March 21, 2016 - SKP · PDF fileMarch 21, 2016 Cera Sanitaryware Ltd. ... CERA is now...
20
March 21, 2016 Cera Sanitaryware Ltd. ...margin expansion fuelled with better product mix CMP INR 1772 Target INR 2515 (Re)Initiating Coverage - BUY SKP Securities Ltd www.skpmoneywise.com Page 1 of 20 Company Background Cera Sanitaryware Ltd. (CERA), promoted by Mr. Vikram Somany, is India’s third largest player in sanitaryware products, with organised market share of ~23%, after HSIL (~40%) and Parryware Roca (~30%). It also manufacturer’s faucets and has presence in tiles. It is now putting up its first tile manufacturing facility under JV with Andhara Pradesh based Anjani Tiles Ltd. Investment Rationale Top-line expected to grow at a CAGR of ~17% over FY15-18E The faucet segment reported robust growth with a CAGR of 42% during FY12-15 with the capacity utilization (CU) of ~60%. With ample capacity in hand and ‘asset light model in place’ we expect the segment to grow with a CAGR of 37% during FY15-FY18E with higher CU. Tiles segment grew by 23% y-o-y to Rs 686.4 mn and contributed 8% to total revenue, during FY15. Contribution from tiles rose to 13% during 9MFY16. We expect tiles segment to grow with a CAGR of 65% during FY15-FY18E with own production capacity coming up now as mentioned below. On the backdrop of strong brand equity and distribution network, growing demand due to changing consumer preferences towards premium lifestyle products and increasing disposable income, we expect CERA’s net sales to grow at a CAGR of ~17% during FY15-FY18E to Rs 13,253.2 mn. Margins expected to improve with better operating leverage EBIDTA Margins of the company was under pressure from FY11 to FY15 where in it reduced from 18.9% to 14.3%. Margins improved to 15.3% during Q3FY16 due to lower energy cost and price increase by the company in the sanitaryware segment, by 2-7% during the quarter. Going forward, we expect EBIDTA margins to stabilize at ~15.5% by FY18E on the back of better product mix, in-house tiles manufacturing including more premium products. PAT margin was up by 40 bps to 8.2% in FY15 from 7.8% reported in FY14 which further improved to 8.6 % during Q3FY16. With improvement in segment margins & better operating leverage coupled with low debt levels, we expect PAT margins to improve further to ~9.1% respectively by FY18E. Also, CERA’s focus on enhancing capacities through asset light model not only reduces its capital investments but also de-risks the balance sheet, enhances return ratios and provides faster access to capacities thereby, resulting in continuous low D/E, which we expect to further improve in coming years. Venturing into tiles manufacturing through JV There is an increased demand for life style consumption products, especially from aspiring mass affluent. To meet the resultant demand for tiles, and as a product extension strategy to leverage its sales network, CERA is now venturing into manufacturing of tiles through a JV with Andhra Pradesh based Anjani Tiles. CERA holds 51% stake in the project that is estimated to cost around Rs 680 mn, with the Company’s equity share of ~Rs190 mn. The plant will have an initial capacity of 10,000 square meters per day of tile manufacturing which could be scaled up to 3x-4x, going forward. The facility has a potential to generate additional revenue of ~Rs 750-1200 mn at full CU. We expect the plant to get commissioned by Q4FY16. Valuation Government of India’s initiatives like “Housing for All” and “Swachh Bharat Abhiyan” coupled with strong brand equity & distribution network, changing consumer preferences towards premium & lifestyle products and diverse product basket augurs well for CERA. It has de-risked its growth strategy with an asset light business model, adopting an outsourcing and joint venture route. We have valued the stock on P/E basis and recommend a BUY on CERA with a target price of Rs 2515/- in 18 months (42% upside). Key Share Data Face Value (INR) 5.0 Equity Capital (INR mn) 65.0 Market Cap (INR mn) 23,046.4 52 Week High/Low (NSE) (INR) 2,961/1,510 Avg. Daily Volume (BSE) 2,322 BSE Code 532443 NSE Code CERA Reuters Code CERA.NS Bloomberg Code CRS:IN Shareholding Pattern (Dec 31, 2015) 55% 14% 6% 25% Promoters FII DII Public & Others Particulars FY15 FY16E FY17E FY18E Net Sales 8,216.7 9,484.2 11,203.6 13,253.2 Growth (%) 23.8% 15.4% 18.1% 18.3% EBITDA 1,175.3 1,372.0 1,688.0 2,049.8 PAT 676.7 793.8 965.4 1,211.4 Growth (%) 30.4% 17.3% 21.6% 25.5% EPS (INR) 52.0 61.0 74.2 93.1 BVPS (INR) 270.4 324.0 389.2 470.3 Key Financials (INR Million) Particulars FY15 FY16E FY17E FY18E P/E (x) 34.1 29.0 23.9 19.0 P/BVPS (x) 6.6 5.5 4.6 3.8 Mcap/Sales (x) 2.8 2.4 2.1 1.7 EV/EBITDA (x) 19.9 16.9 13.8 11.1 ROCE (%) 24.8% 25.3% 26.4% 27.8% ROE (%) 19.2% 18.8% 19.1% 19.8% EBITDA Mar (%) 14.3% 14.5% 15.1% 15.5% PAT Mar (%) 8.2% 8.4% 8.6% 9.1% Debt - Equity (x) 0.2 0.1 0.1 0.1 Key Financials Ratios Source: Company, SKP Research Price Performance CERA vs BSEMIDCAP -40% -30% -20% -10% 0% 10% 20% Mar-15 Apr-15 May-15 May-15 Jun-15 Jul-15 Jul-15 Aug-15 Sep-15 Sep-15 Oct-15 Nov-15 Nov-15 Dec-15 Jan-16 Jan-16 Feb-16 Mar-16 CERA BSE Mid Cap Analysts: Nikhil Saboo Tel No: +91-33-40077019; Mobile: +91-9330186643 e-mail: [email protected] Vineet Agrawal Tel No: +91-22-49226006; Mobile: +91-9819510575 e-mail: [email protected]
Transcript of March 21, 2016 - SKP · PDF fileMarch 21, 2016 Cera Sanitaryware Ltd. ... CERA is now...

March 21, 2016
Cera Sanitaryware Ltd.
...margin expansion fuelled with better product mix
CMP INR 1772 Target INR 2515 (Re)Initiating Coverage - BUY
SKP Securities Ltd www.skpmoneywise.com Page 1 of 20
Company Background
Cera Sanitaryware Ltd. (CERA), promoted by Mr. Vikram Somany, is India’s third largest player in sanitaryware products, with organised market share of ~23%, after HSIL (~40%) and Parryware Roca (~30%). It also manufacturer’s faucets and has presence in tiles. It is now putting up its first tile manufacturing facility under JV with Andhara Pradesh based Anjani Tiles Ltd.
Investment Rationale
Top-line expected to grow at a CAGR of ~17% over FY15-18E The faucet segment reported robust growth with a CAGR of 42% during
FY12-15 with the capacity utilization (CU) of ~60%. With ample capacity in hand and ‘asset light model in place’ we expect the segment to grow with a CAGR of 37% during FY15-FY18E with higher CU.
Tiles segment grew by 23% y-o-y to Rs 686.4 mn and contributed 8% to total revenue, during FY15. Contribution from tiles rose to 13% during 9MFY16. We expect tiles segment to grow with a CAGR of 65% during FY15-FY18E with own production capacity coming up now as mentioned below.
On the backdrop of strong brand equity and distribution network, growing demand due to changing consumer preferences towards premium lifestyle products and increasing disposable income, we expect CERA’s net sales to grow at a CAGR of ~17% during FY15-FY18E to Rs 13,253.2 mn.
Margins expected to improve with better operating leverage EBIDTA Margins of the company was under pressure from FY11 to FY15
where in it reduced from 18.9% to 14.3%. Margins improved to 15.3% during Q3FY16 due to lower energy cost and price increase by the company in the sanitaryware segment, by 2-7% during the quarter. Going forward, we expect EBIDTA margins to stabilize at ~15.5% by FY18E on the back of better product mix, in-house tiles manufacturing including more premium products.
PAT margin was up by 40 bps to 8.2% in FY15 from 7.8% reported in FY14 which further improved to 8.6 % during Q3FY16. With improvement in segment margins & better operating leverage coupled with low debt levels, we expect PAT margins to improve further to ~9.1% respectively by FY18E.
Also, CERA’s focus on enhancing capacities through asset light model not only reduces its capital investments but also de-risks the balance sheet, enhances return ratios and provides faster access to capacities thereby, resulting in continuous low D/E, which we expect to further improve in coming years.
Venturing into tiles manufacturing through JV
There is an increased demand for life style consumption products, especially from aspiring mass affluent. To meet the resultant demand for tiles, and as a product extension strategy to leverage its sales network, CERA is now venturing into manufacturing of tiles through a JV with Andhra Pradesh based Anjani Tiles.
CERA holds 51% stake in the project that is estimated to cost around Rs 680 mn, with the Company’s equity share of ~Rs190 mn. The plant will have an initial capacity of 10,000 square meters per day of tile manufacturing which could be scaled up to 3x-4x, going forward.
The facility has a potential to generate additional revenue of ~Rs 750-1200 mn at full CU. We expect the plant to get commissioned by Q4FY16.
Valuation Government of India’s initiatives like “Housing for All” and “Swachh Bharat Abhiyan” coupled with strong brand equity & distribution network, changing consumer preferences towards premium & lifestyle products and diverse product basket augurs well for CERA. It has de-risked its growth strategy with an asset light business model, adopting an outsourcing and joint venture route. We have valued the stock on P/E basis and recommend a BUY on CERA with a target price of Rs 2515/- in 18 months (42% upside).
Key Share Data
Face Value (INR) 5.0
Equity Capital (INR mn) 65.0
Market Cap (INR mn) 23,046.4
52 Week High/Low (NSE) (INR) 2,961/1,510
Avg. Daily Volume (BSE) 2,322
BSE Code 532443
NSE Code CERA
Reuters Code CERA.NS
Bloomberg Code CRS:IN
Shareholding Pattern (Dec 31, 2015)
55%
14%
6%
25%
Promoters
FII
DII
Public & Others
Particulars FY15 FY16E FY17E FY18E
Net Sales 8,216.7 9,484.2 11,203.6 13,253.2
Growth (%) 23.8% 15.4% 18.1% 18.3%
EBITDA 1,175.3 1,372.0 1,688.0 2,049.8
PAT 676.7 793.8 965.4 1,211.4
Growth (%) 30.4% 17.3% 21.6% 25.5%
EPS (INR) 52.0 61.0 74.2 93.1
BVPS (INR) 270.4 324.0 389.2 470.3
Key Financials (INR Million)
Particulars FY15 FY16E FY17E FY18E
P/E (x) 34.1 29.0 23.9 19.0
P/BVPS (x) 6.6 5.5 4.6 3.8
Mcap/Sales (x) 2.8 2.4 2.1 1.7
EV/EBITDA (x) 19.9 16.9 13.8 11.1
ROCE (%) 24.8% 25.3% 26.4% 27.8%
ROE (%) 19.2% 18.8% 19.1% 19.8%
EBITDA Mar (%) 14.3% 14.5% 15.1% 15.5%
PAT Mar (%) 8.2% 8.4% 8.6% 9.1%
Debt - Equity (x) 0.2 0.1 0.1 0.1
Key Financials Ratios
Source: Company, SKP Research
Price Performance CERA vs BSEMIDCAP
-50%
-40%
-30%
-20%
-10%
0%
10%
20%
Mar
-15
Ap
r-1
5
May
-15
May
-15
Jun
-15
Jul-
15
Jul-
15
Au
g-1
5
Sep
-15
Sep
-15
Oct
-15
No
v-1
5
No
v-1
5
Dec
-15
Jan
-16
Jan
-16
Feb
-16
Mar
-16
CERA
BSE Mid Cap
Analysts: Nikhil Saboo
Tel No: +91-33-40077019; Mobile: +91-9330186643
e-mail: [email protected]
Vineet Agrawal
Tel No: +91-22-49226006; Mobile: +91-9819510575
e-mail: [email protected]
Cera Sanitaryware Ltd.
SKP Securities Ltd www.skpmoneywise.com Page 2 of 20
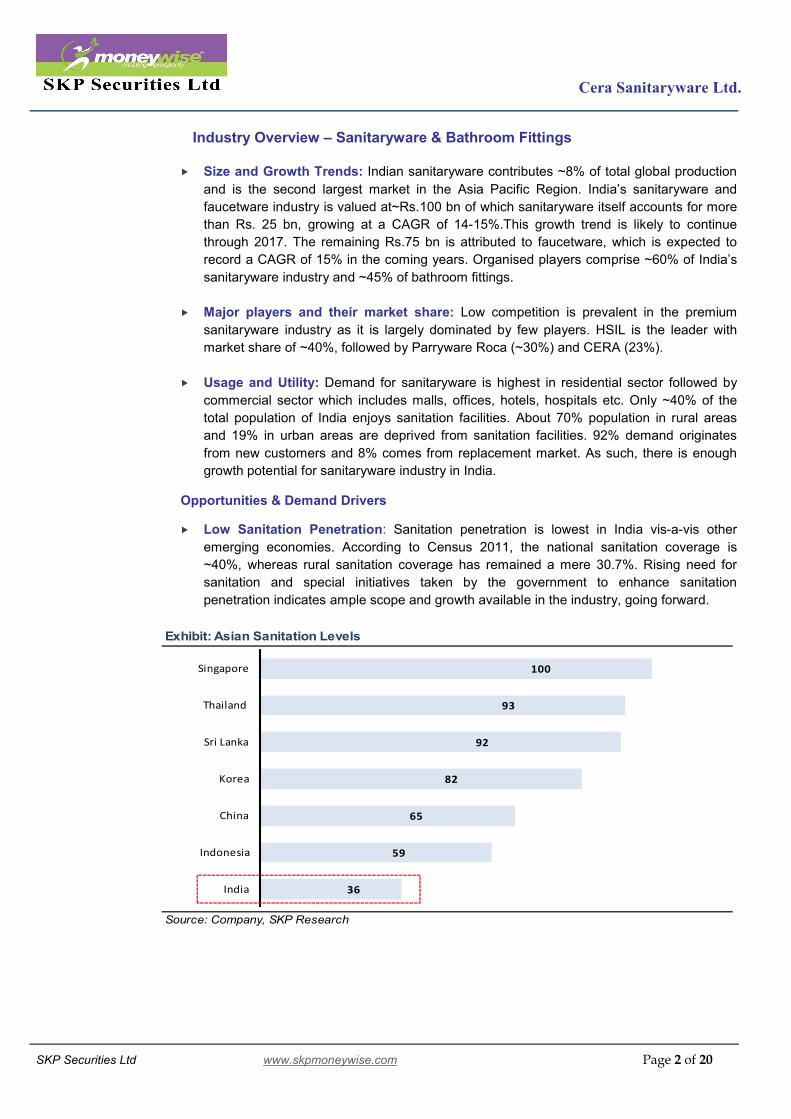
Industry Overview – Sanitaryware & Bathroom Fittings Size and Growth Trends: Indian sanitaryware contributes ~8% of total global production
and is the second largest market in the Asia Pacific Region. India’s sanitaryware and
faucetware industry is valued at~Rs.100 bn of which sanitaryware itself accounts for more
than Rs. 25 bn, growing at a CAGR of 14-15%.This growth trend is likely to continue
through 2017. The remaining Rs.75 bn is attributed to faucetware, which is expected to
record a CAGR of 15% in the coming years. Organised players comprise ~60% of India’s
sanitaryware industry and ~45% of bathroom fittings.
Major players and their market share: Low competition is prevalent in the premium
sanitaryware industry as it is largely dominated by few players. HSIL is the leader with
market share of ~40%, followed by Parryware Roca (~30%) and CERA (23%).
Usage and Utility: Demand for sanitaryware is highest in residential sector followed by
commercial sector which includes malls, offices, hotels, hospitals etc. Only ~40% of the
total population of India enjoys sanitation facilities. About 70% population in rural areas
and 19% in urban areas are deprived from sanitation facilities. 92% demand originates
from new customers and 8% comes from replacement market. As such, there is enough
growth potential for sanitaryware industry in India. Opportunities & Demand Drivers Low Sanitation Penetration: Sanitation penetration is lowest in India vis-a-vis other
emerging economies. According to Census 2011, the national sanitation coverage is
~40%, whereas rural sanitation coverage has remained a mere 30.7%. Rising need for
sanitation and special initiatives taken by the government to enhance sanitation
penetration indicates ample scope and growth available in the industry, going forward.
Exhibit: Asian Sanitation Levels
Source: Company, SKP Research
36
59
65
82
92
93
100
India
Indonesia
China
Korea
Sri Lanka
Thailand
Singapore

Cera Sanitaryware Ltd.
SKP Securities Ltd www.skpmoneywise.com Page 3 of 20
Changing demographics to drive demand: With 50% of India population below the age
of 30, the country’s ‘youth bulge’ is unequivocal about change, and demands better quality
products. Shift in consumer preferences along with greater brand awareness, higher
disposable income and superior standards of living has opened opportunities for new
products, leading to a shift from unorganised to organised sector.
Government’s Initiatives to improve sanitation: GoI is taking special initiatives to
improve sanitation penetration in India. It has launched a multi-million dollar sanitation
project, ‘Nirmal Bharat Abhiyaan’ to raise awareness and improve sanitation levels.
Although, this may not have a direct impact on premium quality producers like CERA,
there will certainly be a rub off effect. GoI also plans to develop 100 smart cities in India,
which would further boost the demand for sanitaryware products, including premium ones.
Heavily dependent on real estate market: Sanitaryware industry is quite dependent on
real estate sector as majority demand comes from new construction. Various initiatives of
Central and State Governments will revitalise the real estate and housing sector in the
country. With increasing urbanisation and infrastructure growth, urban population is
expected to reach to about 600 mn by 2031 which would lead to enhanced demand for
modern housing and building products thereby increasing demand for sanitaryware.
The middle income segment has become one of the principal drivers for real estate boom.
This segment has grown from 11 mn households in 2001-02 to 31 mn households in 2010-
11and is further expected to grow to 114 mn households by 2025-26.
Indian Tiles Industry – An Overview:
Ceramic Tiles market can be broadly divided into two sub-segments viz Ceramic Tiles and Vitrified Tiles. Vitrified Tiles can be further sub divided in to Polished Vitrified Tiles (PVT) and Glazed Vitrified Tiles (GVT).
Market Size: Ceramic tiles are an essential building material now. Despite the industrial slowdown in the past few years, Indian Tiles market grew from 494 million sq. Meters (MSM) in CY09 to 748 MSM in CY13 witnessing a CAGR of ~11%.
Structural shift from ceramic to vitrified tiles: A major change took over the ceramic tiles industry in the recent past with the introduction of the next generation vitrified tiles and porcelain tiles.
Globally, these tiles account for ~50% of total tile sales (by value). In India, contribution of these products is increasing year-on-year, with structural shift in consumer preference for superior, value added products.
Source: Somany Ceramics Presentation – Feb 2015

Cera Sanitaryware Ltd.
SKP Securities Ltd www.skpmoneywise.com Page 4 of 20
India is the third largest tiles producer, globally, with lowest per capita consumption: Top 3 tile producing countries in CY13 and per capita consumption is given below:
Country Production
(MSM) Production (% Share)*
Consumption (MSM)
Consumption (% Share)**
Per Capita Consumption
(sqm)
China 5700 48% 4556 39% 3.4
Brazil 871 7% 837 7% 4.1
India 748 6% 748 6% 0.5
Source: Somany Ceramics Presentation – Feb 2015; * Global Market Size in CY13 11913MSM; ** Global Consumption 11574 MSM
Despite the double digit growth (~11%) of tiles market in India, its per capita consumption is about a third of global average. Majority demand of tiles come from residential segment followed by commercial and replacement segment.
Break-up of domestic tiles market at a glance:
Source: Industry
Unorganised market losing sheen: Earlier the unorganised market was highly
competitive due to low cost manufacturing on account of tax evasion and low operating
cost due to usage of coal based fuel, presence in highly fragmented tier-I cities, low level
of premiumisation – ceramic tiles dominated sales, with no technology innovation.
Unorganised market is now loosing sheen due to –
Change in Consumer Preference: With change in consumer preference for branded value-added building products (from ceramic to vitrified tiles) demand for GVT and PVT tiles are increasing, which offers better designs than ceramic tiles.
Policy Shift - Ban on coal based plant: Ban on usage of coal for manufacturing tiles has further marred liquidity of small players as natural gas is 30% costlier than coal, leading them to increase prices of ceramic tiles, thus, making their pricing competitive with organized players.
Government’s move to curb black money: Liquidity crunch is expected to occur due to Central Government’s engineered move towards curbing black money and will lead to reduced cash transactions in building material segment, impacting the turnover of small unorganised players.
Demand Drivers: Opportunity landscape for the industry is quite wide in India. Following
are the demand drivers which could propel tiles market in the near future:
70%
15%
15%
Residential Demand
Commercial
Replacement
49%51%Organised
Unorganised

Cera Sanitaryware Ltd.
SKP Securities Ltd www.skpmoneywise.com Page 5 of 20
Increasing Urbanization: India is rapidly organizing, which is gradually
translating into more demand for ceramic tiles. A report by McKinsey Global Institute projects 40% of India’s population would be urbanized by 2030.
Growing Mass Affluent Segment: India’s mass affluent – probably the largest such segment in the world in PPP terms – is expected to grow from 58 mn in 2010 to 110 mn by 2020 (40% of the total national households from 24% in 2010). This segment is evolving towards international standards of lifestyle, translating into upsurge in demand for modern tiles.
Rising disposable income: With growing middle class and rising income, real household disposable income has increased by about four times since 1990, translating into greater investment in homes. Rising disposable income at a glance:
Source: Somany Ceramics Presentation – Feb 2015
Growth in real estate: Urban household development, demand for pucca houses and changing consumer preference towards tiles is encouraging the demand for tiles to go up. There is a growth in demand for tiles owing to the water seepage problem that leads to mould formation in walls and ceilings.
Government’s Initiatives: GoI plans to develop 100 smart cities,
development of industrial corridors, housing for all by 2022, etc., all will lead
to a boost in demand for ceramic tiles. ‘Swaccha Bharat Abhiyaan’ will lead
to building of toilets and community toilets.
Organized market gaining ground: Gradually, organized market is stemming up from the unorganized predominance previously, for the reasons mentioned above. This is encouraging for better control purposes and price mechanisms to play.
With more and more unorganized players becoming part of the organized players, market segmentation is skewing towards creation of a centralized market, which can be brought under the purview of regulations. A proper government support and other infrastructural reforms could lead to a better play for Indian ceramic tiles industry in years to come.
1679 1776
2896
3290
3619
4395
4913 4931
6005
6671
0
1000
2000
3000
4000
5000
6000
7000
1990 1995 2004 2005 2006 2007 2008 2009 2010 2011
USD
Per
House
hold

Cera Sanitaryware Ltd.
SKP Securities Ltd www.skpmoneywise.com Page 6 of 20
Outlook:
With increasing construction activities, especially in tier - II & tier - III cities, tiles market in the country is set to flourish. Demand from institutional customers is outpacing the retail demand in many regions of the country.
The overall Indian tiles market is expected to witness CAGR of more than 18% for next five years. However, during the same period demand for vitrified tiles is expected to grow at CAGR of 21% due to increasing institutional sales and changing consumer preferences.
Global Scenario:
The world ceramic tiles production is growing at a healthy CAGR of 8.5% over 2009-13, with the market size of 11,913 MSM. China is the world’s largest tiles producer with 47% market share. Brazil is the second largest tile producer with production capacity of 871 MSM followed by India at 748 MSM.
In terms of exports China is the largest exporter followed by Spain and Italy. These top three countries together contribute close to 66% to the overall world ceramic tiles exports.
Top Ten Ceramic Tiles Producing Nations Top Ten Ceramic Tiles Exporting Nations
Source: Somany Ceramics Annual Report 2015
India has not grown much in terms of exports of ceramic tiles and currently consists of less than 0.5% of global market. As per ‘Indian Council of Ceramic Tiles and Sanitaryware’, India has exported tiles worth USD 441 mn in 2014. India Exports ceramics to markets such as UAE, Saudi Arabia and Malaysia.
Peer Comparison
Source: SKP Research
HSIL CERA HSIL CERA HSIL CERA HSIL CERA HSIL CERA
FY15 16.8% 14.3% 4.3% 8.2% 10.9% 24.8% 0.4 0.2 22.0 34.1
FY16E 17.4% 14.5% 6.1% 8.4% 12.0% 25.3% 0.4 0.1 16.4 29.0
FY17E 17.3% 15.1% 6.5% 8.6% 13.0% 26.4% 0.4 0.1 13.6 23.9
FY18E 17.2% 15.5% 6.9% 9.1% 14.5% 27.8% 0.3 0.1 11.4 19.0
P/E (X)Peers
EBIDTAM (%) PATM (%) ROCE (%) D/E (X)
1148
318 303
114 88 80 63 51 50 48
0
200
400
600
800
1000
1200
1400
Ch
ina
Spai
n
Ital
y
Iran
Turk
ey
Me
xico
Bra
zil
UA
E
Vie
tnam
Po
lan
d
MSM
5700
871 748500 420 390 363 340 300 228
0
1000
2000
3000
4000
5000
6000
Ch
ina
Bra
zil
Ind
ia
Iran
Spai
n
Ind
on
esi
a
Ital
y
Turk
ey
Vie
tnam
Me
xico
MSM

Cera Sanitaryware Ltd.
SKP Securities Ltd www.skpmoneywise.com Page 7 of 20
Company Profile
The Company was incorporated in 1980 as Madhusudan Ceramics, an entity of
Madhusudan Industries Ltd; at Kadi, Gujarat; with the sanitaryware installed capacity of
0.3 mn pieces per annum and marketed its products under the brand name CERA.
During 2001, Ceramic Division of the Company was de-merged to a separate group
company named Madhusudan Oils and Fats Ltd, pursuant to the Order of Hon’ble Gujarat
High Court. Later, Company’s name was changed to Cera Sanitaryware Ltd (CERA).
Under the leadership of Mr. Vikram Somany, Chairman and Managing Director, with ~30
years industry experience, CERA has now become the third largest sanitaryware company
in India, with ~23% organised market share and claims to be largest in premium segment.
During 2007-08, CERA installed gas based captive power plant and wind turbine
generator, at Kadi and became the first sanitaryware company to use natural gas.
In 2010-11, CERA successfully commissioned faucet manufacturing plant, with the initial
capacity of 2,500 pieces per day and increased it to 7,200 pieces per day during FY15.
The plant is scalable up to 10,000 pieces per day.
During FY13, in order to capitalize on the low per capita consumption of tiles and the
growing demand in the industry, the Company launched CERA tiles, on outsourcing basis
and sold under the brand name ‘CERA’ in India. The entry into faucets and tiles is part of
CERA’s effort to position itself as a one-stop-shop bathroom solutions provider and
establish itself more firmly in the premium segment.
Source: The Company
CERA Business Model – One-stop-shop Bathroom Solutions Provider
Outsourcing Manufacturing
In-House Mfg Contract Mfg
Imported
Sanitaryware
Lifestyle products
viz. premium
bathroom products
comprising
bathtubs, jacuzzi,
steam cubicles,
shower partitions,
shower panels and
allied sanitaryware
products
Sanitaryware
Faucets
Sanitaryware
Faucets
Ceramic and
Vitrified tiles

Cera Sanitaryware Ltd.
SKP Securities Ltd www.skpmoneywise.com Page 8 of 20
In-house Manufacturing:
Sanitaryware: CERA has its state-of-the-art manufacturing facility in Kadi, Gujarat with
total manufacturing capacity at 3.0 mn pieces per annum and utilization level at around 97-
98%.The segment contributed ~35% to the total revenues (excluding allied products which
contributed ~14%)in FY15. Being the oldest, this segment will continue to be the mainstay
of the company.
Source: The Company & SKP Research
Faucets: The facility at Kadi also has the capacity to produce 7,200 pieces of faucets per
day, which could be ramped up, up-to 10,000 pieces per day. Currently, the facility is
working at ~60% utilization levels and contributed 8% to the total revenues, in FY15.
Source: The Company & SKP Research
The faucets plant is equipped with high tech energy saving induction furnaces, gravity die-
casting machines, auto-plating nickel-chrome plant and some special purpose machines to
produce quality confirming products.
0.0
0.5
1.0
1.5
2.0
2.5
3.0
3.5
FY12 FY13 FY14 FY15 FY16E FY17E FY18E
Capacity (mn Pieces/Annum)
Capacity Utilization (mn Pieces/Annum)
0
500000
1000000
1500000
2000000
2500000
3000000
FY14 FY15 FY16E FY17E FY18E
Capacity (Pieces/Annum)
Capacity Utilization (Pieces/Annum)

Cera Sanitaryware Ltd.
SKP Securities Ltd www.skpmoneywise.com Page 9 of 20
Contract Manufacturing and Outsourcing:
Sanitaryware: CERA follows asset-light model by outsourcing, premium category
sanitaryware through contract manufacturing, from Gujarat based manufacturers with
whom it procures about 50,000 pcs per month.
CERA also outsource sanitaryware from China and have dedicated manufacturers with
quality control team in place. Production and packaging is done in China, in accordance
with the designs selected by CERA (including labelling), which are dispatched in India.
CERA focus on enhancing capacities through asset light model not only reduces its capital
investments, but also de-risks the balance sheet, enhances return ratios and provides
faster access to capacities. 40% of total revenues from sanitaryware segment are
contributed by outsourcing.
Faucets: Majority faucets are outsourced from Northern India and also from Gujarat.
Outsourcing contributes about ~50% (value-wise) of total faucet revenues of CERA.
Tiles: During FY13, the Company launched CERA tiles, on outsourcing basis and sold
under the brand name ‘CERA’ in India. This segment contributed Rs 686.4 mn to the total
revenue in FY15.
Keeping in view the benefits of outsourcing and JV model, CERA is in the process of
setting up a JV facility for tiles with Anjani Tiles Ltd., Andhra Pradesh and has acquired
controlling stake of 51% in Anjani Tiles recently.
Segment Wise Revenue Contribution at a glance
Source: The Company & SKP Research
73%
15%
8%4%
FY15
Sanitaryware
Faucets
Tiles
Wellness
51%
24%
22%
2%
FY18E
Sanitaryware
Faucets
Tiles
Wellness
Cera Sanitaryware Ltd.
SKP Securities Ltd www.skpmoneywise.com Page 10 of 20
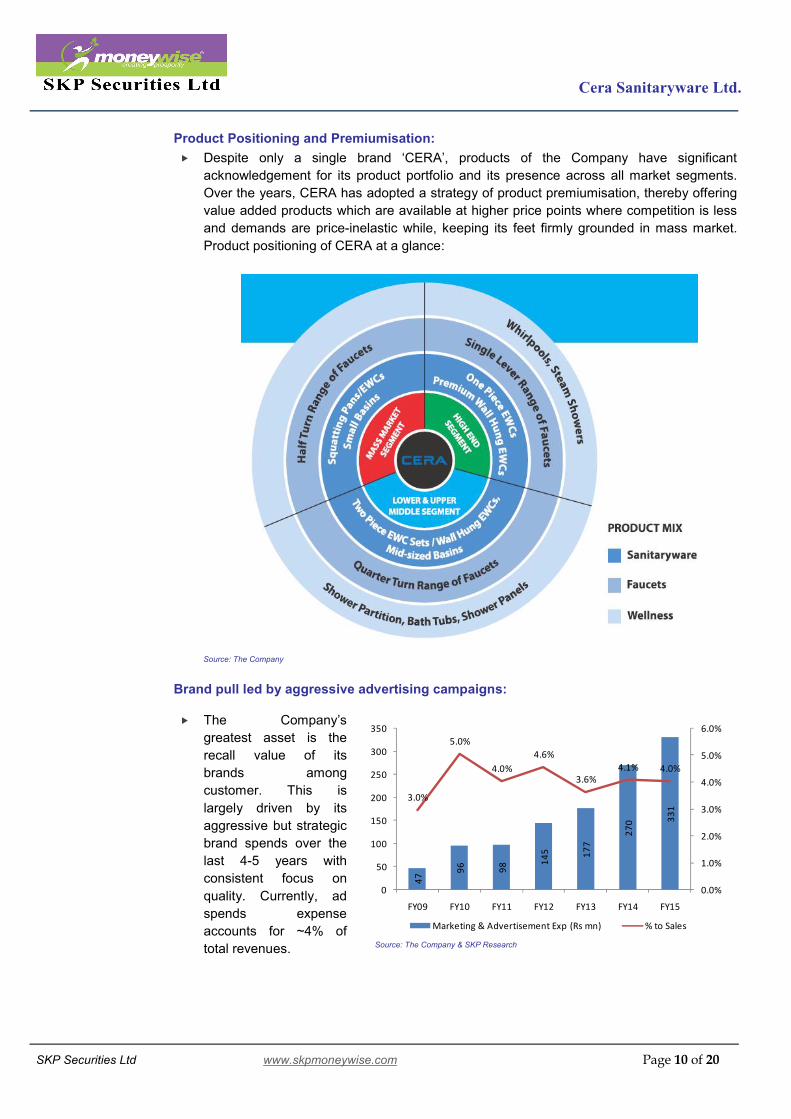
Product Positioning and Premiumisation:
Despite only a single brand ‘CERA’, products of the Company have significant
acknowledgement for its product portfolio and its presence across all market segments.
Over the years, CERA has adopted a strategy of product premiumisation, thereby offering
value added products which are available at higher price points where competition is less
and demands are price-inelastic while, keeping its feet firmly grounded in mass market.
Product positioning of CERA at a glance:
Source: The Company
Brand pull led by aggressive advertising campaigns:
The Company’s
greatest asset is the
recall value of its
brands among
customer. This is
largely driven by its
aggressive but strategic
brand spends over the
last 4-5 years with
consistent focus on
quality. Currently, ad
spends expense
accounts for ~4% of
total revenues.
47
96
98 1
45 17
7
27
0 33
1
3.0%
5.0%
4.0%
4.6%
3.6%4.1% 4.0%
0.0%
1.0%
2.0%
3.0%
4.0%
5.0%
6.0%
0
50
100
150
200
250
300
350
FY09 FY10 FY11 FY12 FY13 FY14 FY15
Marketing & Advertisement Exp (Rs mn) % to Sales
Source: The Company & SKP Research

Cera Sanitaryware Ltd.
SKP Securities Ltd www.skpmoneywise.com Page 11 of 20
Robust distribution network:
Over the years, CERA has established a strong and widespread distribution network,
encompassing ~1400 distributors/dealers (authorised stockists) and 14,000 retailers
across India. To supplement the distribution network, CERA also has 20 major stock
points, 10 zonal sales & service offices and 10 bath studios across the country.
A major marketing exercise of expanding dealer and retailer network is in progress. The
company has also been sponsoring TV programs, arranging architect and plumber meets
on regular intervals etc. to create its brand image in the market. This has helped CERA to
reach wide spectrum of retail customers and maintain its dominating position in the
sanitaryware industry.
Cera’s wide distribution network at a glance:
Source: The Company
Raw Materials: Sanitaryware and faucetware: The basic ingredients for making ceramics is Kaolinite,
clay, feldspar and quartz sand which form the basis for this extremely durable and hard
material. The basic raw material used in manufacturing faucet is brass, since it is highly
resistant to corrosion and calcification.
Tiles: Sand and white clay are the main raw materials for manufacturing tiles, apart from
Feldspar, dolomite and some other minerals.
Procurement and Pricing: CERA procures the above mentioned raw materials locally.
There is not much fluctuation in the prices of raw materials of tiles and sanitaryware. Raw
material cost to sales ratio for CERA reflects a gradual increasing trend from 4.2% in FY10
to 6.3% during FY15.

Cera Sanitaryware Ltd.
SKP Securities Ltd www.skpmoneywise.com Page 12 of 20
Investment Rationale
1. Cera venturing into tiles manufacturing through JV:
Indian GDP is expected to grow ~8% in the coming years, resulting in increased buying
power in the hands of a growing and aspiring mass affluent segment. Keeping this in view
CERA is venturing into manufacturing of tiles through JV.
Cera has entered into a joint-venture agreement with an Andhra Pradesh based Anjani
Tiles Ltd to set up a ceramic vitrified tiles facility in Nellore, Andhra Pradesh.
CERA holds 51% stake in the project that is estimated to cost around Rs 680 mn, with the
Company’s equity share of ~190 mn. The plant will have an initial capacity of 10,000
square meters per day of tile manufacturing which could be scaled up to 3x-4x, going
forward.
The JV partners would fund the project with a mix of equity of around Rs 360 mn and
balance in debt to the tune of Rs 320 mn. The plant will be commissioned by March 2016.
Cera’s focus is to manufacture double charge and soluble salt tiles, initially.
The facility has a potential to generate additional revenue of ~Rs 750-1200 mn at full
capacity. Currently, tiles segment contributes ~13% (9MFY16) to the total revenues of the
company which is fulfilled by outsourcing. With the facility getting commissioned, we
expect the contribution from tiles segment to rise to 23% in FY18E.
Deferment of sanitaryware capex: CERA has deferred the capacity expansion plan of
sanitaryware from 3.0 mn pieces to 3.3 mn pieces due to sluggish demand. 2. Top-line expected to grow at a CAGR of ~17% over FY15-18Eled by faucets and tiles
segment:
Faucets Segment: In FY15, CERA reported net sales of Rs 8.21 bn, registering a growth
of 24% y-o-y on account of robust growth in faucet ware segment backed by strengthening
and enlargement of product basket, intensifying and enlargement of distributor reach. The
segment reported robust growth with a CAGR of 43%during FY12-15.
With ample of capacity in hand and well balanced ‘asset light model in place’ we
further expect the segment to grow with a CAGR of 37% during FY15-FY18E.
Source: The Company & SKP Research
69
3.7
98
7.5
12
23
.5
19
46
.0
25
09
.9
31
65
.1
62%
42%
24%
59%
29%26%
0%
10%
20%
30%
40%
50%
60%
70%
0.0
500.0
1000.0
1500.0
2000.0
2500.0
3000.0
3500.0
FY13 FY14 FY15 FY16E FY17E FY18E
Faucet Revenue % Growth

Cera Sanitaryware Ltd.
SKP Securities Ltd www.skpmoneywise.com Page 13 of 20
Tiles segment grew by 23% y-o-y to Rs 686.4 mn and contributed 8% to overall revenue,
during FY15. The contribution to total revenue rose to 13% during 9MFY16. With JV
capacity with Anjani tiles in place by March 2016, we further expect tiles segment to
grow with a CAGR of 65% during FY15-FY18E.
Source: The Company & SKP Research
Sanitaryware Segment: In FY15, sanitaryware segment reported net sales of Rs 5,963.6
mn, registering y-o-y growth of 24%. The division is continuously working on the optimum
capacity utilization of 97-98% for last many years. With the deferment of increasing the
capacity further, on account of subdued demand of real estate, we anticipate muted
growth in the segment, going forward.
Source: The Company & SKP Research
557.0 686.41235.5
2124.5
3068.1
23%
80%
72%
44%
0%
10%
20%
30%
40%
50%
60%
70%
80%
90%
0
500
1000
1500
2000
2500
3000
3500
FY14 FY15 FY16E FY17E FY18E
Tiles Revenues (Rs mn) % Growth
38
78
.1
48
14
.0
59
63
.6
59
93
.8
63
22
.1
67
70
.4
45%
24% 24%
1%
5% 7%
0%
5%
10%
15%
20%
25%
30%
35%
40%
45%
50%
0
1000
2000
3000
4000
5000
6000
7000
8000
FY13 FY14 FY15 FY16E FY17E FY18E
Sanitaryware Revenue (Rs mn) % Growth

Cera Sanitaryware Ltd.
SKP Securities Ltd www.skpmoneywise.com Page 14 of 20
Overall sales and revenue contribution at a glance:
Overall Sales Revenue Contribution
Source: The Company & SKP Research
3. Margins expected to improve with better operating leverage
EBIDTA Margins of the company was under pressure from FY11 to FY15, when it reduced
from 18.9% to 14.3%. Margins improved to 15.3% during Q3FY16 due to lower energy
cost and price increase taken by the company in sanitaryware segment by 2-7% during
the quarter.
Going forward, we expect EBIDTA margins to stabilize at ~15% by FY18E on the
back of better product mix with more premium products. Furthermore, we expect
margins from captive tiles manufacturing to be better than margins from outsourced
model.
Source: The Company & SKP Research
45
8.3
53
3.7
75
3.3
94
9.4
11
75
.3
13
72
.0
16
88
.0
20
49
.8
18.9%
16.7%15.4%
14.3% 14.3% 14.5%15.1% 15.5%
0.0%
5.0%
10.0%
15.0%
20.0%
0
500
1000
1500
2000
2500
FY11 FY12 FY13 FY14 FY15 FY16E FY17E FY18E
PA
T M
argi
n (
%)
EBID
TA (
`m
n)
24
29
.5
31
93
.9
48
78
.7
66
36
.9
82
16
.7
94
84
.2
11
20
3.6
13
25
3.2
0
2000
4000
6000
8000
10000
12000
14000
FY11 FY12 FY13 FY14 FY15 FY16E FY17E FY18E
Ove
rall
Ne
t R
eve
nu
es
(`m
n)
Overall Revenue
83% 79%73% 73%
63% 56% 51%
13%14%
15% 15%21%
22%24%
8% 8% 13% 19% 23%
3% 6% 4% 4% 3% 2% 2%
0%
10%
20%
30%
40%
50%
60%
70%
80%
90%
100%
FY12 FY13 FY14 FY15 FY16E FY17E FY18E
Sanitaryware Faucets Tiles Welness

Cera Sanitaryware Ltd.
SKP Securities Ltd www.skpmoneywise.com Page 15 of 20
PAT margins (PATM) were up by 40 bps to8.2% in FY15 from 7.8% reported in FY14
which further improved to 8.6 % during Q3FY16.
With improvement in segment margins and better operating leverage coupled with low
debt, we expect PATM to improve further to ~9.1% respectively by FY18E.
PAT Margins, ROE and ROCE at a glance:
Source: The Company & SKP Research
4. Focus on ‘asset light model’ helps in De-leveraged Balance Sheet: As mentioned above, CERA has been focusing on enhancing its production volumes by
entering into outsourcing contracts both indigenously and from China. Recently, it has also
entered in to joint venture with Anjali tiles for manufacturing tiles.
CERA’s focus on enhancing capacities through asset light model not only reduces its capital
investments but also de-risks the balance sheet, enhances return ratios and provides faster
access to capacities thereby, resulting into continuous low debt equity ratio (D/E). CERA’s
D/E is significantly low at 0.2x in FY15 (as shown in the graph below).
Debt position of CERA at a glance:
Source: The Company & SKP Research
265.4320.4
462.1519.1
676.7
793.8965.4
1211.410.9%
10.0%9.5%
7.8%8.2% 8.4% 8.6%
9.1%
0%
2%
4%
6%
8%
10%
12%
0.0
200.0
400.0
600.0
800.0
1000.0
1200.0
1400.0
FY11 FY12 FY13 FY14 FY15 FY16E FY17E FY18E
PA
T M
argi
n (
%)
PA
T (`
mn
)
23.8%23.0%
25.7%
23.2%
19.2% 18.8% 19.1%19.8%
27.4%
25.3%
28.1%
31.0%
24.8% 25.3%26.4%
27.8%
15%
17%
19%
21%
23%
25%
27%
29%
31%
33%
FY11 FY12 FY13 FY14 FY15 FY16E FY17E FY18E
ROE (%) ROCE (%)
25
6.3
8
93
.68
11
6.2
2
14
8.9
2
90
.00
14
2.3
8
27
3.4
2
22
5.9
6
17
8.5
0
15
.75 2
25
.97
29
5.9
5 40
0.4
9
33
3.6
1
45
0.2
0
29
4.0
1
31
3.7
0
33
1.3
3
0.0
0.1
0.1
0.2
0.2
0.3
0.3
0.4
0
50
100
150
200
250
300
350
400
450
500
FY1
0
FY1
1
FY1
2
FY1
3
FY1
4
FY1
5
FY1
6E
FY1
7E
FY1
8E
x
`m
n
Long Term Debt (LHS) Short Term Debt (LHS) D/E (RHS)
13.811.4
9.3
12.8 13.2
23.1 22.8
30.1
0.3 0.3 0.3
0.20.2
0.10.1
0.1
0.0
0.1
0.1
0.2
0.2
0.3
0.3
0.4
0.0
5.0
10.0
15.0
20.0
25.0
30.0
35.0
FY11 FY12 FY13 FY14 FY15 FY16E FY17E FY18E
Interest Coverage (x) - RHS
D/E (x) - LHS
Cera Sanitaryware Ltd.
SKP Securities Ltd www.skpmoneywise.com Page 16 of 20
Key Concerns
Competition from unorganised players: The building product industry is dominated by
small unorganized players. Though, Indian consumers are gravitating towards the
organized segment, offering branded products, any increase in the competitive intensity
from unorganized segment may be detrimental for the company. The proposed GST will
remove the cascading effect of interstate transfers; will create a level playing field for
organised players and will result in a huge shift from the unorganised market to the
organised market.
Extended slowdown in real estate sector may dampen business sentiments: All
product segments of CERA are highly dependent on real estate sector. Any extension of
slowdown to Tier –I and Tier –II cities may dampen the business prospects of CERA.
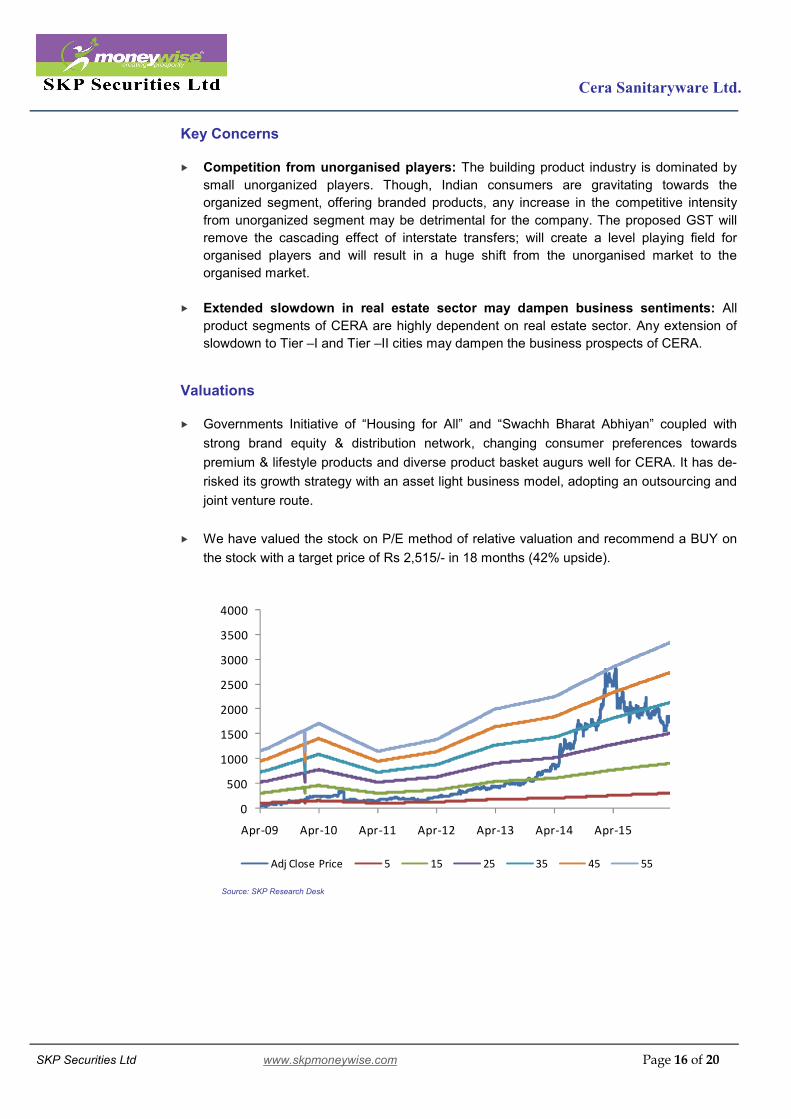
Valuations
Governments Initiative of “Housing for All” and “Swachh Bharat Abhiyan” coupled with
strong brand equity & distribution network, changing consumer preferences towards
premium & lifestyle products and diverse product basket augurs well for CERA. It has de-
risked its growth strategy with an asset light business model, adopting an outsourcing and
joint venture route.
We have valued the stock on P/E method of relative valuation and recommend a BUY on
the stock with a target price of Rs 2,515/- in 18 months (42% upside).
Source: SKP Research Desk
0
500
1000
1500
2000
2500
3000
3500
4000
Apr-09 Apr-10 Apr-11 Apr-12 Apr-13 Apr-14 Apr-15
Adj Close Price 5 15 25 35 45 55

Cera Sanitaryware Ltd.
SKP Securities Ltd www.skpmoneywise.com Page 17 of 20
Q3FY16 & 9MFY16 Standalone Result Review
(All data in Rs mn unless specified, Y/e March)
Particulars Q3 FY16 Q3 FY15 % Change Q2 FY16 % Change 9MFY16 9MFY15 % Change
Net Sales 2335.3 2092.9 11.6% 4293.9 -45.6% 6531.0 5712.3 14.3%
Total Expenditure 1977.7 1796.3 9.2% 3537.7 -44.1% 5599.5 4897.8 12.5%
Raw Material Consumed 56.6 -8.8 -742.2% 501.6 -88.7% 442.9 166.0 166.8%
% to Sales 2.4% -0.4% -- 11.7% -- 6.8% 2.9% --
Purchase of traded goods 1016.7 973.6 4.4% 799.5 27.2% 2584.1 2419.3 6.8%
% to Sales 43.5% 46.5% -- 18.6% -- 39.6% 42.4% --
Employee Expenses 279.5 243.5 14.8% 559.4 -50.0% 813.8 710.6 14.5%
% to Sales 12.0% 11.6% -- 13.0% -- 12.5% 12.4% --
Fuel Cost 83.2 95.3 -12.7% 610.2 -86.4% 221.2 240.0 -7.8%
% to Sales 3.6% 4.6% -- 14.2% -- 3.4% 4.2% --
Marketing & Advertisement 0.0 0.0 -- 0.0 -- 0.0 0.0 --
% to Sales 0.0% 0.0% -- 0.0% -- 0.0% 0.0% --
Other Expenses 541.8 492.7 10.0% 1067.0 -49.2% 1537.5 1362.0 12.9%
% to Sales 23.2% 23.5% -- 24.8% -- 23.5% 23.8% --
EBIDTA 357.6 296.6 20.6% 756.2 -52.7% 931.5 814.4 14.4%
EBIDTA Margin 15.3% 14.2% -- 17.6% -- 14.3% 14.3% --
Depreciation 44.5 41.9 6.1% 289.6 -84.6% 120.8 109.8 10.0%
EBIT 313.1 254.7 22.9% 466.6 -32.9% 810.7 704.6 15.1%
EBIT Margin 13.4% 12.2% -- 10.9% -- 12.4% 12.3% --
Other Income 16.2 14.9 8.7% 11.1 45.9% 63.6 43.7 45.7%
Interest 11.0 21.8 -49.7% 91.8 -88.1% 40.4 52.8 -23.5%
Exceptional Items 0.0 0.0 -- 0.0 -- 0.0 0.0 --
Forex Difference 0.0 0.0 -- 0.0 -- 0.0 0.0 --
Tax 117.2 86.2 36.0% 142.6 -17.8% 297.4 240.1 23.9%
Extraordinary Items 0.0 0.0 -- 0.0 -- 0.0 0.0 --
Prior period taxes written bk. 0.0 0.0 -- 0.0 -- 0.0 0.0 --
Minority Interest 0.0 0.0 -- 0.0 -- 0.0 0.0 --
Share of Associate Company 0.0 0.0 -- 0.0 -- 0.0 0.0 --
Reported Profit After Tax 201.2 161.6 24.5% 243.3 -17.3% 536.6 455.5 17.8%
PAT Margin 8.6% 7.7% -- 5.7% -- 8.2% 8.0% --
Diluted EPS (Rs) 15.5 12.8 21.1% 3.4 358.8% 41.3 36.0 14.6%
Source: The Company

Cera Sanitaryware Ltd.
SKP Securities Ltd www.skpmoneywise.com Page 18 of 20
Exhibit: Income Statement Exhibit: Balance Sheet
Particulars FY15 FY16E FY17E FY18E Particulars FY15 FY16E FY17E FY18E
Total Income 8,216.7 9,484.2 11,203.6 13,253.2 Share Capital 65.0 65.0 65.0 65.0
Growth (%) 23.8% 15.4% 18.1% 18.3% Reserve & Surplus 3,452.1 4,148.3 4,996.6 6,052.0
Expenditure 7,041.4 8,112.2 9,515.6 11,203.4 Shareholders Funds 3,517.1 4,213.3 5,061.7 6,117.0
Material Cost 521.3 635.4 728.2 861.5 Total Debt 592.6 567.4 539.7 509.8
Pur of Traded Goods 3,321.6 3,736.8 4,403.0 5,182.0 Deferred Tax (Net) 278.2 278.2 278.2 278.2
Employee Cost 917.4 1,185.5 1,400.5 1,656.6 Other Long Term Liab 92.7 107.0 95.2 112.7
Power & Fuel & Othr Exp. 1,949.7 2,171.9 2,532.0 2,968.7 Total Liabilities 4,480.6 5,166.0 5,974.8 7,017.8
EBITDA 1,175.3 1,372.0 1,688.0 2,049.8
Depreciation 154.6 161.0 211.5 210.6 Net Block inc. Capital WIP 2,223.4 2,619.3 2,607.9 2,597.3
EBIT 1,020.7 1,211.0 1,476.5 1,839.2 Investments 477.6 368.2 368.2 368.2
Other Income 65.9 75.9 89.6 106.0 Non-Current Asset - 17.0 20.0 23.7
Interest Expense 77.3 52.4 64.8 61.2 Inventories 1,258.9 1,327.8 1,736.6 1,988.0
Profit Before Tax (PBT) 1,009.3 1,234.5 1,501.4 1,884.0 Sundry Debtors 1,612.2 1,640.8 2,240.7 2,518.1
Income Tax 332.6 440.7 536.0 672.6 Cash & Bank Balance 295.3 363.5 292.1 723.6
Profit After Tax (PAT) 676.7 793.8 965.4 1,211.4 Other Current Assets 2.7 3.1 3.6 4.3
Growth (%) 30.4% 17.3% 21.6% 25.5% Loans & Advances 572.4 872.5 1,064.3 1,259.1
Diluted EPS 52.0 61.0 74.2 93.1 Current Liabilities & Prov 1,961.8 2,046.1 2,358.7 2,464.4
Net Current Assets 1,779.7 2,161.5 2,978.7 4,028.6
Total Assets 4,480.6 5,166.0 5,974.8 7,017.8
Exhibit: Cash Flow Statement Exhibit: Ratio Analysis
Particulars FY15E FY16E FY17E FY18E Particulars FY15 FY16E FY17E FY18E
Profit Before Tax (PBT) 1,009.3 1,234.5 1,501.4 1,884.0 Earning Ratios (%)
Depreciation 154.6 161.0 211.5 210.6 EBITDA Margin (%) 14.3% 14.5% 15.1% 15.5%
Interest Provided 75.8 52.4 64.8 61.2 PAT Margins (%) 8.2% 8.4% 8.6% 9.1%
Chg. in Working Capital (534.8) (316.3) (903.3) (604.6) ROCE (%) 24.8% 25.3% 26.4% 27.8%
Direct Taxes Paid (295.5) (440.7) (536.0) (672.6) ROE (%) 19.2% 18.8% 19.1% 19.8%
Other Charges (3.7) - - - Per Share Data (INR)
Operating Cash Flows 405.6 690.9 338.3 878.6 Diluted EPS 52.0 61.0 74.2 93.1
Capital Expenditure (853.3) (557.0) (200.0) (200.0) Cash EPS (CEPS) 63.9 73.4 90.5 109.3
Investments (407.6) 109.4 - - BVPS 270.4 324.0 389.2 470.3
Others 88.1 - - - Valuation Ratios (x)
Investing Cash Flows (1,172.7) (447.6) (200.0) (200.0) P/E 34.1 29.0 23.9 19.0
Changes in Equity 706.0 - - - Price/BVPS 6.6 5.5 4.6 3.8
Inc / (Dec) in Debt 199.1 (25.2) (27.8) (29.8) EV/Sales 2.8 2.5 2.1 1.7
Dividend Paid (inc tax) (74.0) (97.5) (117.1) (156.1) EV/EBITDA 19.9 16.9 13.8 11.1
Interest Paid (75.8) (52.4) (64.8) (61.2) EB/EBIT 22.9 19.2 15.8 12.4
Financing Cash Flows 755.3 (175.1) (209.6) (247.1) Balance Sheet Ratios
Chg. in Cash & Cash Eqv (11.8) 68.2 (71.3) 431.5 Debt - Equity 0.2 0.1 0.1 0.1
Opening Cash Balance 307.1 295.3 363.5 292.1 Current Ratio 1.9 2.1 2.3 2.6
Closing Cash Balance 295.3 363.5 292.1 723.6 Fixed Asset Turn. Ratios 3.8 3.6 4.3 5.1
Source: Company Data, SKP Research
Figures in INR Million Figures in INR Million
Figures in INR Million

Cera Sanitaryware Ltd.
SKP Securities Ltd www.skpmoneywise.com Page 19 of 20
Notes:
The above analysis and data are based on last available prices and not official closing rates. SKP Research is also available on Bloomberg,
Thomson First Call & Investext Myiris, Moneycontrol, Tickerplant and ISI Securities.
DISCLAIMER:
This document has been prepared by SKP Securities Ltd, hereinafter referred to as SKP to provide information about the company(ies)/sector(s), if any, covered in the report and may be distributed by it and/or its affiliates. SKP Securities Ltd., offers broking and depository participant services and is regulated by Securities and Exchange Board of India (SEBI). It also distributes investment products/services like mutual funds, alternative investment funds, bonds, IPOs, etc., renders corporate advisory services and invests its own funds in securities and investment products. We declare that no material disciplinary action has been taken against SKP by any regulatory authority impacting Equity Research Analysis. As a value addition to its clients, it offers its research services and reports in various formats to its clients and prospects. As such, SKP is making these disclosures under SEBI (Research Analysts) Regulations, 2014, under which it is in the process of seeking registration.
Terms & Conditions and Other Disclosures:
This research report (“Report”) is for the personal information of the selected recipient(s), does not construe to be any investment, legal or taxation advice, is not for public distribution and should not be copied, reproduced or redistributed to any other person or in any form without SKP’s prior permission. The information provided in the Report is from publicly available data, which we believe, are reliable. While reasonable endeavors have been made to present reliable data in the Report so far as it relates to current and historical information, but SKP does not guarantee the accuracy or completeness of the data in the Report. Accordingly, SKP or its promoters, directors, subsidiaries, associates or employees shall not be in any way responsible for any loss or damage that may arise to any person from any inadvertent error in the information contained and views and opinions expressed in this publication. Past performance mentioned in the Report should not be taken as an indication or guarantee of future performance, and no representation or warranty, express or implied, is made regarding future performance. Information, opinions and estimates contained in this report reflect a judgment of its original date of publication by SKP and are subject to change without notice. The price, value of and income from any of the securities mentioned in this report can rise or fall. The Report includes analysis and views of individual research analysts (which, hereinafter, includes persons reporting to them) covering this Report. The Report is purely for information purposes. Opinions expressed in the Report are SKP’s or its research analysts’ current opinions as of the date of the Report and may be subject to change from time to time without notice. SKP or any person connected with it does not accept any liability arising from the use of this document. Investors should not solely rely on the information contained in this Report and must make investment decisions based on their own investment objectives, judgment, risk profile and financial position. The recipients of this Report may take professional advice before acting on this information. SKP, along with its affiliates, are engaged in various financial services and so might have financial, businesses or other interest in other entities, including the subject company or its affiliates mentioned in this report, for which it might have received any compensation in the past twelve months. SKP does not provide any merchant banking or market making service and does not manage public offers. However, SKP encourages independence in preparation of research reports and strives to minimize conflict in preparation of research reports.SKP and its analysts did not receive any compensation or other benefits from the subject company mentioned in the Report or from a third party in connection with preparation of the Report. Accordingly, SKP and its Research Analyst do not have any material conflict of interest at the time of publication of this Report. SKP’s research analysts may provide input into its other business activities. Investors should assume that SKP and/or its affiliates are seeking or will seek business assignments from the company(ies) that are the subject of this material and that the research analysts who are involved in preparing this material may educate investors on investments in such businesses. The research analysts responsible for the preparation of this document may interact with trading desk/sales personnel and other parties for the purpose of gathering, applying and interpreting information. Our research analysts are paid on the profitability of SKP, which may include earnings from business activities for which this Report is being used, but not for the preparation of this report. SKP generally prohibits its analysts, persons reporting to analysts and their relatives from maintaining a financial interest in the securities or derivatives of any company(ies) that the analyst covers. Additionally, SKP generally, prohibits its analysts and persons reporting to analysts from serving as an officer, director or advisory board member of any companies that the analyst cover. The following Disclosure of Interest Statement, clarifies it further: SKP or its Research Analyst(s) engaged in preparation of this Report or his/her relative (i) do not have any financial interests in the subject company mentioned in this report (ii) do not own 1% or more of the equity securities of the subject company mentioned in the report as of the last day of the month preceding the publication of the research report (iii) do not have any other material conflict of interest at the time of publication of the research report. The distribution of this document in other jurisdictions may be strictly restricted and/ or prohibited by law, and persons into whose possession this document comes should inform themselves about such restriction and/ or prohibition, and observe any such restrictions and/ or prohibition.

Cera Sanitaryware Ltd.
SKP Securities Ltd www.skpmoneywise.com Page 20 of 20
Analyst Certification
The views expressed in this research report accurately reflect the personal views of the analyst about the subject securities or issues, which are subject to change without prior notice and does not represent to be an authority on the subject. No part of the compensation of the research analyst was, is, or will be directly or indirectly related to the specific recommendations and views expressed by research analyst in this report. The research analysts, strategists, or research associates principally responsible for preparation of SKP research receive compensation based upon various factors, including quality of research, investor client feedback, stock picking, competitive factors and firm revenues.
Disclosure of Interest Statement
Analyst ownership of the stock NIL
Served as an officer, director or employee NIL
SKP Securities Ltd
Contacts Research Sales
Mumbai Kolkata Mumbai Kolkata
Phone 022 4922 6006 033 4007 7000 022 4922 6000 033 4007 7400
Fax 022 4922 6066 033 4007 7007 022 4922 6066 033 4007 7007
E-mail [email protected] [email protected] [email protected]
Member: NSE BSE NSDL CDSL NCDEX* MCX* MCX-SX FPSB
*Group Entities INB/INF: 230707532, BSE INB: 010707538, CDSL IN-DP-CDSL-132-2000, DPID: 021800, NSDL IN-DP-NSDL: 222-2001, DP ID: IN302646, ARN: 0006, NCDEX: 00715, MCX: 31705, MCX-SX: INE 260707532
Institutional & Retail Broking Wealth Advisory & Distribution Investment Banking