March 2020 PSEG Investor Update › 601515617 › files › doc_presentations › ... ·...
30
• NYSE: PEG • March 2020 PSEG Investor Update BUILDING A SUSTAINABLE, FINANCIALLY SOUND ENERGY INFRASTRUCTURE COMPANY
Transcript of March 2020 PSEG Investor Update › 601515617 › files › doc_presentations › ... ·...

• NYSE: PEG •
March 2020 PSEG Investor Update
BUILDING A SUSTAINABLE, FINANCIALLY SOUND ENERGY INFRASTRUCTURE COMPANY

2
Forward-Looking StatementsCertain of the matters discussed in this presentation about our and our subsidiaries’ future performance, including, without limitation, future revenues, earnings, strategies, prospects, consequences and all other statements that are not purely historical constitute “forward-looking statements” within the meaning of the Private Securities Litigation Reform Act of 1995. Such forward-looking statements are subject to risks and uncertainties, which could cause actual results to differ materially from those anticipated. Such statements are based on management’s beliefs as well as assumptions made by and information currently available to management. When used herein, the words “anticipate,” “intend,” “estimate,” “believe,” “expect,” “plan,” “should,” “hypothetical,” “potential,” “forecast,” “project,” variations of such words and similar expressions are intended to identify forward-looking statements. Factors that may cause actual results to differ are often presented with the forward-looking statements themselves. Other factors that could cause actual results to differ materially from those contemplated in any forward-looking statements made by us herein are discussed in filings we make with the United States Securities and Exchange Commission (SEC), including our Annual Report on Form 10-K and subsequent reports on Form 10-Q and Form 8-K. These factors include, but are not limited to:• fluctuations in wholesale power and natural gas markets, including the potential impacts on the economic viability of our generation units;• our ability to obtain adequate fuel supply;• market risks impacting the operation of our generating stations;• increases in competition in wholesale energy and capacity markets;• changes in technology related to energy generation, distribution and consumption and customer usage patterns;• economic downturns;• third-party credit risk relating to our sale of generation output and purchase of fuel;• adverse performance of our nuclear decommissioning and defined benefit plan trust fund investments and changes in funding requirements;• the impact of changes in state and federal legislation and regulations on our business, including PSE&G’s ability to recover costs and earn returns on authorized investments;• PSE&G’s proposed investment programs may not be fully approved by regulators and its capital investment may be lower than planned;• the impact on our New Jersey nuclear plants if such plants are not awarded Zero Emission Certificates (ZEC) in future periods, there is an adverse change in the amount of future ZEC payments, the
ZEC program is overturned or modified through legal proceedings or if adverse changes are made to the capacity market construct;• adverse changes in energy industry laws, policies and regulations, including market structures and transmission planning;• the impact of state and federal actions aimed at combating climate change on our natural gas assets;• risks associated with our ownership and operation of nuclear facilities, including regulatory risks, such as compliance with the Atomic Energy Act and trade control, environmental and other
regulations, as well as financial, environmental and health and safety risks;• changes in federal and state environmental regulations and enforcement;• delays in receipt of, or an inability to receive, necessary licenses and permits;• the impact of any future rate proceedings;• adverse outcomes of any legal, regulatory or other proceeding, settlement, investigation or claim applicable to us and/or the energy industry;• changes in tax laws and regulations;• the impact of our holding company structure on our ability to meet our corporate funding needs, service debt and pay dividends;• lack of growth or slower growth in the number of customers or changes in customer demand;• any inability of PSEG Power to meet its commitments under forward sale obligations;• reliance on transmission facilities that we do not own or control and the impact on our ability to maintain adequate transmission capacity;• any inability to successfully develop, obtain regulatory approval for, or construct generation, transmission and distribution projects;• any equipment failures, accidents, severe weather events or other incidents that impact our ability to provide safe and reliable service to our customers;• our inability to exercise control over the operations of generation facilities in which we do not maintain a controlling interest;• any inability to recover the carrying amount of our long-lived assets and leveraged leases;• any inability to maintain sufficient liquidity;• any inability to realize anticipated tax benefits or retain tax credits;• challenges associated with recruitment and/or retention of key executives and a qualified workforce;• the impact of our covenants in our debt instruments on our operations; and• the impact of acts of terrorism, cybersecurity attacks or intrusions.
All of the forward-looking statements made in this presentation are qualified by these cautionary statements and we cannot assure you that the results or developments anticipated by management will be realized or even if realized, will have the expected consequences to, or effects on, us or our business, prospects, financial condition, results of operations or cash flows. Readers are cautioned not to place undue reliance on these forward-looking statements in making any investment decision. Forward-looking statements made in this presentation apply only as of the date of this presentation. While we may elect to update forward-looking statements from time to time, we specifically disclaim any obligation to do so, even in light of new information or future events, unless otherwise required by applicable securities laws.
The forward-looking statements contained in this presentation are intended to qualify for the safe harbor provisions of Section 27A of the Securities Act of 1933, as amended, and Section 21E of the Securities Exchange Act of 1934, as amended.

3
GAAP DisclaimerPSEG presents Operating Earnings and, for PSEG Power, Adjusted Earnings Before Interest, Taxes, Depreciation and Amortization (EBITDA) in addition to its Net Income reported in accordance with accounting principles generally accepted in the United States (GAAP). Operating Earnings and Adjusted EBITDA are non-GAAP financial measures that differ from Net Income. Non-GAAP Operating Earnings exclude the impact of returns (losses) associated with the Nuclear Decommissioning Trust (NDT), Mark-to-Market (MTM) accounting and material one-time items. Non-GAAP Adjusted EBITDA excludes the same items as our non-GAAP Operating Earnings measure as well as income tax expense, interest expense and depreciation and amortization. The last two slides in this presentation (Slides A and B) include a list of items excluded from Net Income/(Loss) to reconcile to non-GAAP Operating Earnings and non-GAAP Adjusted EBITDA with a reference to those slides included on each of the slides where the non-GAAP information appears.
Management uses non-GAAP Operating Earnings in its internal analysis, and in communications with investors and analysts, as a consistent measure for comparing PSEG’s financial performance to previous financial results. Management believes non-GAAP Adjusted EBITDA is useful to investors and other users of our financial statements in evaluating operating performance because it provides them with an additional tool to compare business performance across companies and across periods. Management also believes that non-GAAP Adjusted EBITDA is widely used by investors to measure operating performance without regard to items such as income tax expense, interest expense and depreciation and amortization, which can vary substantially from company to company depending upon, among other things, the book value of assets, capital structure and whether assets were constructed or acquired. Non-GAAP Adjusted EBITDA also allows investors and other users to assess the underlying financial performance of our fleet before management’s decision to deploy capital. The presentation of non-GAAP Operating Earnings and non-GAAP Adjusted EBITDA is intended to complement, and should not be considered an alternative to, the presentation of Net Income/(Loss), which is an indicator of financial performance determined in accordance with GAAP. In addition, non-GAAP Operating Earnings and non-GAAP Adjusted EBITDA as presented in this release may not be comparable to similarly titled measures used by other companies.
Due to the forward looking nature of non-GAAP Operating Earnings and non-GAAP Adjusted EBITDA guidance, PSEG is unable to reconcile these non-GAAP financial measures to the most directly comparable GAAP financial measure. Management is unable to project certain reconciling items, in particular MTM and NDT gains (losses), for future periods due to market volatility. Guidance included herein is as of February 26, 2020.
These materials and other financial releases can be found on the PSEG website at https://investor.pseg.com. From time to time, PSEG, PSE&G and PSEG Power release important information via postings on their corporate website at https://investor.pseg.com. Investors and other interested parties are encouraged to visit the corporate website to review new postings. The “Email Alerts” link at https://investor.pseg.com may be used to enroll to receive automatic email alerts.

4
Electric & Gas Distribution and TransmissionStrategy: Investments in energy infrastructure and clean energy support reliability and customer expectations and are aligned with public policy Value Proposition: An $11.5 Billion - $15 Billion investment program expected to produce 6.5% - 8% annual compound rate base growth through 2024
Regional Competitive GenerationStrategy: Reliable, highly efficient, carbon-advantaged fleet based on nuclear & new combined cycle gas turbines (CCGTs)Value Proposition: Provides substantial free cash flow and positioned to benefit from potential market rule improvements
A 117-year Newark-based business investing in critical energy infrastructure, providing safe and increasingly clean energy through two strong businesses
ASSETS, OPERATING EARNINGS AND NET INCOME ARE FOR THE YEAR ENDED 12/31/2019. PSE&G AND PSEG POWER DO NOT ADD TO TOTAL DUE TO PSEG ENTERPRISE/OTHER ACTIVITY. *SEE SLIDE B FOR RECONCILIATION OF NET INCOME TO NON-GAAP OPERATING EARNINGS FOR PSEG POWER.
Assets $33BNet Income $1,250M
2019
Assets $13BNet Income $468M
Non-GAAP Operating Earnings* $409M2019

5
PSEG’s Priorities Aligned with New Jersey’s Clean Energy Agenda New Jersey Board of Public Utilities (NJBPU) approved extension of the Clean Energy Future (CEF) –
Energy Efficiency (EE) procedural schedule to September 2020; investment in existing programs extendedin the interim by $111 million
NJBPU staff proposed procedural schedules for $600 million CEF – Energy Cloud (EC – AMI), $300 million CEF – Electric Vehicles (EV) and $100 million CEF - Energy Storage (ES)
NJBPU Energy Master Plan finalized January 2020 PSEG continuing due diligence and negotiations toward a Joint Venture agreement to potentially acquire a
25% equity interest in Ørsted’s 1,100 MW Ocean Wind projectFederal Energy Regulatory Commission (FERC) / PJM / Wholesale Market Reforms Pending PSE&G submitted a rehearing request of FERC’s MISO Transmission Owners’ ROE Order Fast-start pricing proceeding currently held in abeyance by FERC to allow PJM to address dispatch and pricing
misalignment concerns via stakeholder process PJM compliance filing to FERC Capacity Order expected March 18th
Regulatory and Policy Initiatives - Update
FRR=FIXED RESOURCE REQUIREMENT; MOPR=MINIMUM OFFER PRICE RULE; ACR=AVOIDABLE COST RATE; AMI=AUTOMATED METERING INFRASTRUCTURE; MISO=MIDCONTINENT INDEPENDENT SYSTEM OPERATOR
2021Q4 2020Q3 2020Q2 2020
Mar 18 – PJM submits compliance filing to FERC; expected to include MOPR floors for existing units (ACR)
Mar – NJBPU expected to issue rules for 2nd ZEC process
Q2 – FERC order on PJM compliance filing
Mid-Q3 – PJM to set rules/parameters for2022 / 2023 auction (3 months before auction)
Q3/Q4 – File 2nd ZEC application with NJBPU
Q4 – FRR plan due to PJM (30 days before auction)
Nov/Dec – 2022 / 2023 PJM capacity auction (earliest)
Apr – NJBPU order expected on award of ZECs for 6/2022 –5/2025
Q1 2020
Potential FERC/PJM Capacity Auction Timeline:

6
-
200
400
600
800
1,000
1,200
1,400
2005 2006 2007 2008 2009 2010 2011 2012 2013 2014 2015 2016 2017 2018
CO2
Inte
nsity
(lbs
/MW
h)
PSEG Power Generation Carbon Emission Intensity vs. PJM and USA(2005 - 2018)
PSEG PJM Average USA Average
Gas: Increasing efficiency
Coal: Lower capacity factors, and plant retirements
Nuclear: Higher capacity factors, and capacity uprates
Climate Strategy – PSEG Power’s fleet transformation is addressing climate change
Clea
ner
43% decline2005-2018
50% less = ~2.5 million cars
PSEG Power's generation fleet continues to be much less carbon intensive than
PJM and USA averages
CO2
PSEG Power

7
PSEG is committed to real reductions in PSEG Power’s CO2 intensity and emissions and strengthening PSE&G’s system to withstand a climate challenged world
PSEG is Powering ProgressTo find out more, visit www.pseg.com/poweringprogress
Reducing CO2 Intensity/Emissions Clean Energy & Resiliency Governance / ESG Disclosure •Goal to cut PSEG Power’s CO2 emissions 80%
by 2046 from 2005 levels, and achieve Net-Zero CO2 emissions by 2050, assuming advances in technology, public policy and customer behavior
•PSE&G is a founding partner of EPA’s Methane Challenge and a leader in methane reduction through GSMP - reduced annualmethane emissions by approximately 40,000 metric tons of CO2 equivalent during 2019
•Advocating for a national price on carbon•Plans to retire PSEG Power’s one remaining
coal unit in mid-2021•No plans to build or buy new fossil generation •Third lowest CO2 emissions rate and
top 10 producer of zero carbon generation(1)
•Clean Energy Future – Filings intended to expand energy efficiency, electric vehicle infrastructure, energy storage and energy cloud offerings tothe broadest set of customersat the least cost
•Continuing Energy Strong reliability and resiliency infrastructure improvements to minimize the impact of extreme weather events
•Board of Directors oversees sustainability matters and the transition to a Net-Zerofuture
•Membership in CEO Climate Dialogue•First PSEG Climate Report in 2020
to follow TCFD framework•PSEG Annual Sustainability Report
published December 2019•PSEG named to the Forbes JUST 100 List of
America’s Best Corporate Citizens for 2020 by Forbes and JUST Capital
•PSEG named to the Forbes America’s Best Employers for Diversity list for 3rd year
GSMP=GAS SYSTEM MODERNIZATION PROGRAM; TCFD=TASK FORCE ON CLIMATE RELATED FINANCIAL DISCLOSURE; (1) SOURCE: MJ BRADLEY BENCHMARKING AIR EMISSIONS, JUNE 2019; CO2 EMISSION RATE RANKINGS OF TOP 20 PRIVATELY / INVESTOR OWNED POWER PRODUCERS (BY TOTAL GENERATION) IN LB/MWH; ZERO-CARBON GENERATION RANKINGS OF TOP 100 LARGEST U.S. POWER PRODUCERS IN MILLION MWH.

8
Electric Gas
Customers5-Year Annual Customer Growth*
2.3 Million0.8%
1.9 Million 0.7%
2019 Electric and Gas Sales 40,684 GWh
2,589M Therms**
Sales Mix (2019)
Residential 33% 58%
Commercial 58% 38%
Industrial 9% 4%
PSE&G – New Jersey’s largest:• Electric and Gas Distribution utility• Transmission business• Investor in renewables and energy efficiency• Appliance service provider
45%52%
3%
PSE&G 2019 Rate Base***
>$20B
DistributionTransmission
Solar & EE
*ANNUAL CUSTOMER GROWTH USES 2014 AS BASE YEAR.**GAS FIRM SALES ONLY. ***EXCLUDES CWIP. YEAR-END CWIP BALANCE WAS $1.6 BILLION.

9
Cost impact of approved and
proposed programs GSMP II, ES II, and CEF over next five
years
~2% annual increase, yielding flat bills in
real terms
Customer Focus – Customer bills have declined, supporting needed investment in the system
NOTE: AVERAGE MONTHLY BILL FOR A TYPICAL RESIDENTIAL ELECTRIC CUSTOMER THAT USES 6,920 KILOWATT-HOURS PER YEAR AND A TYPICAL RESIDENTIAL GAS HEATING CUSTOMER THAT USES 1,040 THERMS PER YEAR. MARCH 2020 RATES REFLECT JUNE 1, 2020BGS-RSCP SUPPLY CHARGES INCLUDING THE RESULTS OF THE 2020 BGS-RSCP AUCTION.
10
0
500
1,000
1,500
2,000
2,500
3,000
3,500
2020E 2021E 2022E 2023E 2024ETransmission Electric Distribution Gas Distribution Clean Energy 2019-2023 MIC*
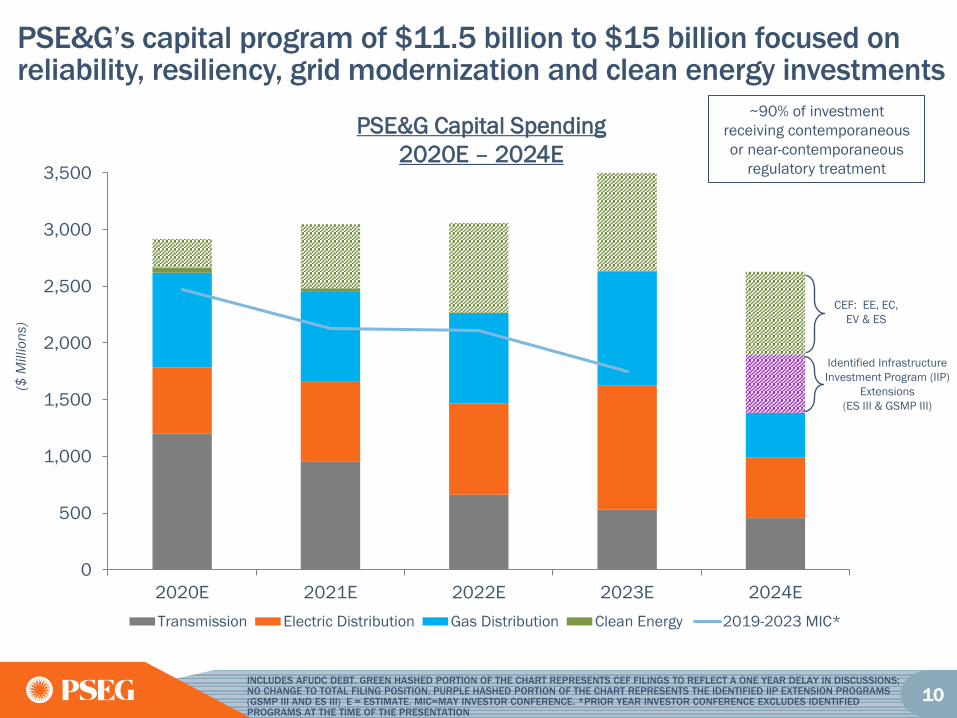
PSE&G’s capital program of $11.5 billion to $15 billion focused on reliability, resiliency, grid modernization and clean energy investments
CEF: EE, EC,EV & ES
PSE&G Capital Spending 2020E – 2024E
($ M
illio
ns)
INCLUDES AFUDC DEBT. GREEN HASHED PORTION OF THE CHART REPRESENTS CEF FILINGS TO REFLECT A ONE YEAR DELAY IN DISCUSSIONS; NO CHANGE TO TOTAL FILING POSITION. PURPLE HASHED PORTION OF THE CHART REPRESENTS THE IDENTIFIED IIP EXTENSION PROGRAMS (GSMP III AND ES III) E = ESTIMATE. MIC=MAY INVESTOR CONFERENCE. *PRIOR YEAR INVESTOR CONFERENCE EXCLUDES IDENTIFIED PROGRAMS AT THE TIME OF THE PRESENTATION
~90% of investment receiving contemporaneous or near-contemporaneous
regulatory treatment
Identified InfrastructureInvestment Program (IIP)
Extensions (ES III & GSMP III)

11
0
5,000
10,000
15,000
20,000
25,000
30,000
35,000
2019 2020E 2021E 2022E 2023E 2024E
Transmission Electric Distribution Gas Distribution Clean Energy
8.0% -
($ M
illio
ns)
GREEN HASHED PORTION OF THE CHART REPRESENTS REVISED CEF FILINGS TO REFLECT A ONE YEAR DELAY IN DISCUSSIONS; NO CHANGE TO TOTAL FILING POSITION. PURPLE HASHED PORTION OF THE CHART REPRESENTS THE IDENTIFIED IIP EXTENSION PROGRAMS (GSMP III AND ES III) E = ESTIMATE. CHART EXCLUDES CWIP. YEAR-END 2019 CWIP BALANCE WAS $1.6 B.
CEF
Investment program provides opportunity for ~ 6.5% to 8% compound annual growth in rate base
6.5% -Identified IIP Extensions
PSE&G Year-End Rate Base

12
Clean Energy Future program designed to achieve the goals of NJ’s Clean Energy Act
• Energy Efficiency: Helps achieve the Clean Energy Act targets of 2% and 0.75% electric and gas savings requirements
• Electric Vehicles: “Smart” electric vehicle infrastructure: Residential, workplace, multi-family, travel corridors
• Energy Storage: Utility-scale systemsto defer additional distribution investment, enable additional solar, and enhance resiliency
• Energy Cloud ‒ AMI: Accelerated roll-out of ~2 million electric meters and supporting infrastructure
Program Investment $ Billions
Energy Efficiency* $2.5
Electric Vehicles** $0.3
Energy Storage** $0.1
Energy Cloud – AMI** $0.6
Investment Total $3.5
~$3.5 Billion, 6-year investment proposal providing cost-effective and innovative solutions supporting NJ’s clean energy goals
*Agreement to extend procedural schedule to September 2020**NJBPU staff proposed schedules for the consideration of
CEF – EC – AMI, CEF – EV and CEF - ES

13
unprotected steel main, resulting in a reduction in methane leaks, safety enhancements and supports customer usage of high efficiency appliances. • 2019: Completed replacement of ~230 miles
of gas main and ~16,000 services Annual methane emissions reduced by
~40,000 metric tons of CO2 equivalent.GSMP II program provides for replacement of 875 miles over five years• $1.9 Billion investment began in 2019• $1.6 Billion recovered through clause• Improved terms, with semi-annual recovery• Creating 750 jobs• GSMP I replaced ~450 miles/3 years for $905M
Gas Distribution InvestmentsGas System Modernization Program focused on modernizing and replacing cast iron and
Base capital and new business >$1 Billion over five years

14
Energy Strong II: Continuing critical energy infrastructure program
• $842M total spending (Clause $692M, Stipulated Base $150M)‒ $741M Electric (Clause $641M, Stipulated Base $100M): substation life cycle and flood mitigation,
contingency reconfiguration and grid modernization‒ $101M Gas (Evenly split between Clause and Stipulated Base): M&R station life cycle
• Program work began Q4 2019, extending through December 2023• Improves reliability and resiliency, modernizes system
Old – Below Flood Level New – Above Flood Level
New Equipment RaisedAbove Flood Elevations
Old Station Below/New Station Raised Above Flood Elevations
M&R=METERING & REGULATION

15
Customer bills will remain in line with inflation, even with inclusion of our active and proposed programs
• Bills remained flat in real terms from 2016 to 2020, even with inclusion of GSMP I, ES I, 2018 Rate Case and ZECs
• Over the next 5 years, the impact of GSMP II, ES II and proposed CEF programs on customer bills will be ~2%/year, flat in real terms
… and EE can help lower bills going forward.*AVERAGE MONTHLY BILL FOR A TYPICAL RESIDENTIAL ELECTRIC CUSTOMER USING 6,920 KILOWATT-HOURS PER YEAR AND A TYPICAL RESIDENTIAL GAS HEATING CUSTOMER USING 1,040 THERMS PER YEAR. **MARCH 2020 RATES REFLECT JUNE 1, 2020 BGS-RSCP SUPPLY CHARGES INCL. RESULTS OF 2020 BGS-RSCP AUCTION. ***CEF INCLUDES THE PROPOSED NET IMPACTS OF THE CEF PROGRAMS AS FILED. CEF-EE INCLUDES IMPACTS SUCH AS GEM, REDUCTIONS IN THE SBC, COST SHIFTING AND OTHER BILL SAVINGS. E=ESTIMATE. GEM=GREEN ENABLING MECHANISM.

16
PSE&G: lowest residential bills among 12 regional Gas Utilities and below the average of 12 regional Electric Utilities
BASED UPON A CALCULATION OF MONTHLY BILLS FOR AN ELECTRIC CUSTOMER USING 500 KILOWATT-HOURS AND A GAS CUSTOMER USING 100 THERMS USING RATES AS OF OCTOBER 1, 2019
Monthly Gas Bills Monthly Electric Bills
Average $93
Average $129

17
Bridgeport Harbor
ISO New England
New Haven
Bethlehem EnergyCenter (BEC)
Peach Bottom
BergenKearnyEssex
Sewaren
Linden
Burlington
Hope CreekSalem
New York ISO
PJM
Keys Energy Center
S
S
S
S
SS
SS
S
S S
S
SSSS S
S
S
S
S
S
S
PSEG Power’s generating assets mainly located in three competitive markets
• Major assets located near key load centers
• Completed construction program of three new, highly efficient combined-cycle units
• Positioned to benefit from market volatility
Solar Source assets:• Solar (467 MWDC /365 MWAC)
Kalaeloa
S = Solar
SS
ISO=INDEPENDENT SYSTEM OPERATOR

18
Delayed 2022/2023 RPM Auction will be informed by changes in:
PJM’s RPM Auction Results*
Delivery Year 2019/2020 2020/2021 2021/2022
PSEG Power’s Average Prices ($/MW-day)
$116 $179 $182
Rest of Pool Prices ($/MW-day)$100/$80 (CP/Base)
$77(CP)
$140(CP)
PSEG Power’s Cleared Capacity (MW) 8,300 7,300 6,900
ISO New England’s Forward Capacity Market Auction Results**Delivery Year 2019/2020 2020/2021 2021/2022 2022/2023 2023/2024
PSEG Power’s Average Prices($/MW-day)
$231 $195 $192 $179 $231
PSEG Power’s Cleared Capacity (MW) 1,330 1,330 950 950 480
PJM and ISO-NE completed auctions provide a solid and continuing revenue stream
PSEG Power’s average price reflects Bridgeport Harbor 5, which cleared the 2019/2020 auction at $231/MW-day for seven years, with escalations based on Handy-Whitman Index
• Net CONE• PJM Parameters
• Demand Response Rules• Environmental Regulations
• Load Forecasts• FERC Market Reforms/Extended MOPR
NOTE: DELIVERY YEARS RUN FROM JUNE 1 TO MAY 31 OF THE NEXT CALENDAR YEAR E=ESTIMATE; *AVERAGE PRICES AND CLEARED CAPACITY (MW) REFLECT BASE AND INCREMENTAL AUCTIONS. KEYSTONE AND CONEMAUGH HAVE BEEN EXCLUDED FROM Q4 2019 AND BEYOND. **AVERAGE PRICES AND CLEARED CAPACITY (MW) REFLECT BRIDGEPORT HARBOR 5 ADDITION IN MID-2019 AND THE ANNOUNCED RETIREMENT OF BRIDGEPORT HARBOR 3 IN MID-2021. MOPR=MINIMUM OFFER PRICE RULE
PJM Capacity Revenue
NE Capacity Revenue

19HEDGE PERCENTAGES AND PRICES AS OF FEBRUARY 5, 2020 AND REFLECT REVENUES OF FULL REQUIREMENT LOAD DEALS BASED ON CONTRACT PRICE INCLUDING RENEWABLE ENERGY CREDITS, ANCILLARY AND TRANSMISSION COMPONENTS BUT EXCLUDING CAPACITY. HEDGES INCLUDE POSITIONS WITH MTM ACCOUNTING TREATMENT AND OPTIONS.
Stable Gross Margin - Hedging strategy is designed to mitigate risk and secure free cash flow
2020 2021 2022
Nuclear
Volume TWh 31 31 31
% Hedged 100% 80-85% 30-35%
Price $/MWh $37 $36 $36
Combined Cycle
Volume TWh 19-21 19-21 19-21
% Hedged 70-75% 0% 0%
Price $/MWh $37 $- $ -
Total
Volume TWh 50-52 50-52 50-52
% Hedged 85-90% 45-50% 20-25%
Price $/MWh $37 $36 $36

20
Potential investment in Ørsted’s Ocean Wind is aligned with New Jersey’s clean energy policy goals
PSEG exercised an option to potentially acquire a 25% equity interest in the 1,100 MW Ocean Wind project
Ocean Wind was the winner of NJ’s first offshore wind solicitation in June 2019
The Ocean Wind project will be locatedoff the coast of Atlantic City and is scheduled to come on-line in 2024
Potential investment is subject to advanced due diligence, negotiations toward a JV agreement and any required regulatory approvals
Updated NJ’s offshore wind capacity target to 7,500 MW by 2035 in November 2019

21(1) EXCLUDES NUCLEAR ARO, EARLY RETIREMENT AND GAIN ON SALE OF HUDSON / MERCER COAL PLANTS, IMPACTS FROM SANDY STORM RECOVERY COSTS AND CERTAIN REGULATORY BALANCE ACCOUNT AND PASS THROUGH ITEMS. INCLUDES NON-OPERATING PENSION AND OPEB AMOUNTS WHICH ARE REPORTED SEPARATELY AND NO LONGER SUBJECT TO CAPITALIZATION EFFECTIVE JANUARY 1, 2018 AS A RESULT OF NEW ACCOUNTING GUIDANCE.
$0
$500
$1,000
$1,500
$2,000
$2,500
2014 2015 2016 2017 2018 2019PSEG Power Distribution Transmission Other
($ M
illio
ns)
PSEG has controlled O&M with actions focused on continuous improvement
PSEG O&M Expense (1)
2014 – 2019 CAGR: (2.1%)
Cost control actions• Continued focus on
vendors to ensure maximum value
• Frequent organizational reviews to drive efficiency and cost optimization
• ‘Best practices’ teams focused on improving performance while managing costs
• Technology investments to improve productivity

22
$2.76$2.91 $2.90 $2.93
$3.12
$3.28
2014 2015 2016 2017 2018 2019 2020E
Strategic focus continues to deliver solid results
*SEE SLIDE A FOR ITEMS EXCLUDED FROM NET INCOME TO RECONCILE TO NON-GAAP OPERATING EARNINGS.**BASED ON THE MID-POINT OF 2020 NON-GAAP OPERATING EARNINGS GUIDANCE OF $3.30 TO $3.50 PER SHARE.E= ESTIMATE.
2020E Guidance
$3.30 – $3.50
PSEG non-GAAP Operating Earnings per Share*
+4%**

23
$1.00
$1.20
$1.40
$1.60
$1.80
$2.00
$2.20
$2.40
$2.60
$2.80
2015 2016 2017 2018 2019 2020E
$1.88
PSE&GEPS
($/S
hare
)
Annual Dividend Per Share(2015-2020E CAGR: 4.7%)
Opportunity for consistent and sustainable dividend growth
$1.96*
$1.56 $1.64$1.72
$1.80
PSE&G 2020E
Net Income Guidance
Range
*INDICATIVE ANNUAL 2020 PSEG COMMON DIVIDEND RATE PER SHARE. E=ESTIMATE.NOTE: ALL FUTURE DECISIONS REGARDING DIVIDENDS ON THE COMMON STOCK ARE SUBJECT TO APPROVAL BY THE BOARD OF DIRECTORS.

24
PSEG Value Proposition
• PSE&G – Delivering on promise for rate base growth through alignment with customer interests and state policy goals
• PSEG Power – Increasingly efficient, clean fleet advantaged by asset diversity, fuel mix and location
• Focus on providing strong, sustainable returns of invested capital reinforced by operational excellence, financial strength and disciplined investment
• 113-year record of paying common dividend with opportunity for consistent, sustainable growth
Disciplined Investment
•Aligned with
NJ’s Energy &
Environmental Goals
Operational Excellence
•Safe, Reliable
Operations with Commitment to Continuous Improvement
Financial Strength
•Assuring Balanced Results in
Regulatory/Policy Matters

25
PSEG Meeting TakeawaysRegulatory Stability & Opportunities Consistent with NJ Energy Policy
• CEF updates: AMI moratorium lifted; draft procedural schedules exist for EC, EV and ES; extension of existing EE programs and authorization for additional $111 million of investment
• Next distribution base rate case not required before year-end 2023 • ZEC award preserves nuclear and supports stable gross margin
Among Highest Regulated Growth Rates • Rate Base CAGR at 6.5% - 8% (2020E-2024E) fueled by GSMP II, ES II,
CEF filings, and transmission investment• NJ’s Clean Energy Act and NJ Energy Master Plan have investable potential
Financial Strength Remains Intact• Stable credit metrics enable accelerated return of excess deferred taxes and
increases rate base• Higher 54% equity ratio at PSE&G post rate case settlement• Conclusion of PSEG Power’s construction program improves cash flow• No new equity needed to finance existing 2020-2024 capital plan• Dividend: 2020 indicative $0.08 increase to $1.96 per share

PSEGAPPENDIX
27
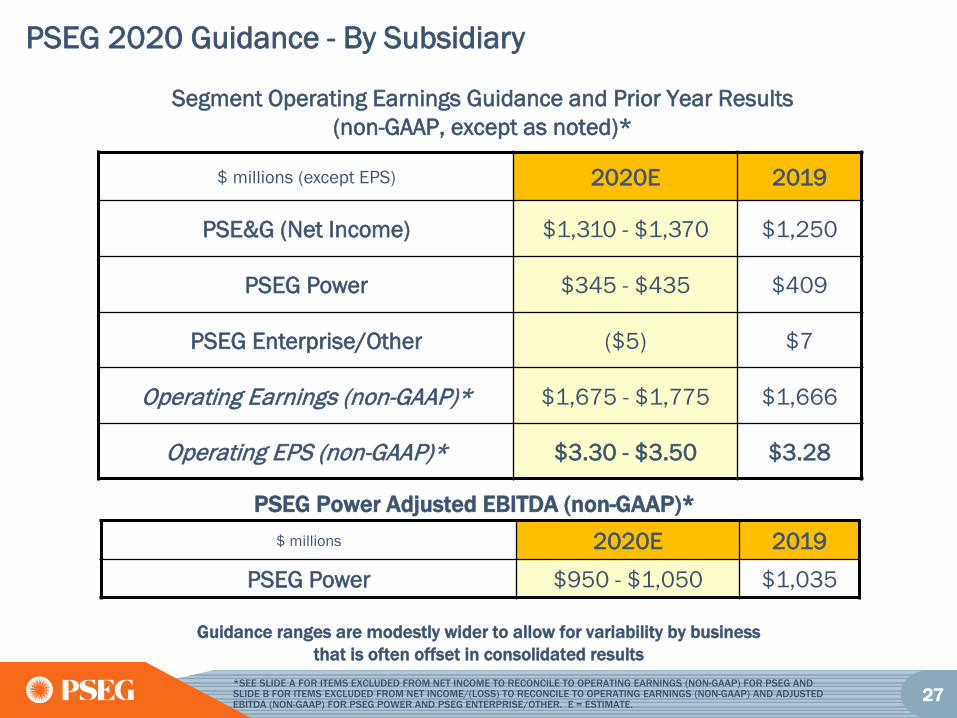
PSEG 2020 Guidance - By Subsidiary
$ millions (except EPS) 2020E 2019
PSE&G (Net Income) $1,310 - $1,370 $1,250
PSEG Power $345 - $435 $409
PSEG Enterprise/Other ($5) $7
Operating Earnings (non-GAAP)* $1,675 - $1,775 $1,666
Operating EPS (non-GAAP)* $3.30 - $3.50 $3.28
Segment Operating Earnings Guidance and Prior Year Results(non-GAAP, except as noted)*
$ millions 2020E 2019PSEG Power $950 - $1,050 $1,035
PSEG Power Adjusted EBITDA (non-GAAP)*
*SEE SLIDE A FOR ITEMS EXCLUDED FROM NET INCOME TO RECONCILE TO OPERATING EARNINGS (NON-GAAP) FOR PSEG AND SLIDE B FOR ITEMS EXCLUDED FROM NET INCOME/(LOSS) TO RECONCILE TO OPERATING EARNINGS (NON-GAAP) AND ADJUSTED EBITDA (NON-GAAP) FOR PSEG POWER AND PSEG ENTERPRISE/OTHER. E = ESTIMATE.
Guidance ranges are modestly wider to allow for variability by business that is often offset in consolidated results

28
$2.83
$3.12$3.28 $3.33
0.36 (0.18)(0.02)
$0.00
$0.50
$1.00
$1.50
$2.00
$2.50
$3.00
$3.50
FY 2018Net Income
FY 2018Operating Earnings
(non-GAAP)*
PSE&G PSEG Power PSEGEnterprise/
Other
FY 2019Operating Earnings
(non-GAAP)*
FY 2019Net Income
$ / s
hare
PSEG EPS Reconciliation – FY 2019 versus FY 2018
ZECs 0.18
Capacity (0.17)
Re-contracting, Lower Cost to Serve
(0.09)
Volume (0.01)
Gas Operations (0.04)
O&M 0.04
Depreciation (0.04)
Interest Expense (0.05)
Transmission 0.17
Gas Margin 0.16
Electric Margin 0.04
Weather (0.02)
Distribution O&M 0.03
Distribution Depreciation & Interest
(0.08)
Distribution Non-Operating Pension/OPEB
0.08
Distribution Taxes & Other (0.02)
Interest Expense partially offset by
Lower Taxes
*SEE SLIDE A FOR ITEMS EXCLUDED FROM NET INCOME TO RECONCILE TO OPERATING EARNINGS (NON-GAAP).

29
Reconciliation of Non-GAAP Operating Earnings
PLEASE SEE PAGE 3 FOR AN EXPLANATION OF PSEG’S USE OF OPERATING EARNINGS AS A NON-GAAP FINANCIAL MEASURE AND HOW IT DIFFERS FROM NET INCOME. A
2019 2018 2017 2016 2015 2014
Net Income 1,693$ 1,438$ 1,574$ 887$ 1,679$ 1,518$ (Gain) Loss on Nuclear Decommissioning Trust (NDT)
Fund Related Activity, pre-tax(a) (PSEG Power) (255) 144 (133) (5) (24) (138) (Gain) Loss on Mark-to-Market (MTM), pre-tax(b) (PSEG Power) (285) 117 167 168 (157) (111) Storm O&M, net of insurance recoveries, pre-tax (PSEG Power) - - - - (172) 27 Plant Retirements and Dispositions, pre-tax (PSEG Power) 402 (51) 975 669 - - Lease Related Activity, pre-tax (PSEG Enterprise/Other) 58 8 77 147 - - Goodwill Impairment, pre-tax (PSEG Power) 16 - - - - - Income Taxes related to Operating Earnings (non-GAAP) reconciling items, excluding Tax Reform(c) 37 (74) (427) (391) 150 104 Tax Reform - - (745) - - -
Operating Earnings (non-GAAP) 1,666$ 1,582$ 1,488$ 1,475$ 1,476$ 1,400$
PSEG Fully Diluted Average Shares Outstanding (in millions) 507 507 507 508 508 508
Net Income 3.33$ 2.83$ 3.10$ 1.75$ 3.30$ 2.99$ (Gain) Loss on NDT Fund Related Activity, pre-tax(a) (PSEG Power) (0.50) 0.28 (0.26) (0.01) (0.05) (0.27) (Gain) Loss on MTM, pre-tax(b) (PSEG Power) (0.56) 0.23 0.33 0.33 (0.31) (0.22) Storm O&M, net of insurance recoveries, pre-tax (PSEG Power) - - - - (0.34) 0.05 Plant Retirements and Dispositions, pre-tax (PSEG Power) 0.79 (0.10) 1.92 1.32 - - Lease Related Activity, pre-tax (PSEG Enterprise/Other) 0.11 0.02 0.15 0.29 - - Goodwill Impairment, pre-tax (PSEG Power) 0.03 - - - - - Income Taxes related to Operating Earnings (non-GAAP) reconciling items, excluding Tax Reform(c) 0.08 (0.14) (0.84) (0.78) 0.31 0.21 Tax Reform - - (1.47) - - -
Operating Earnings (non-GAAP) 3.28$ 3.12$ 2.93$ 2.90$ 2.91$ 2.76$
($ millions, Unaudited)
($ Per Share Impact - Diluted, Unaudited)
Public Service Enterprise Group Incorporated - Consolidated Operating Earnings (Non-GAAP) Reconciliation
Reconciling ItemsYear Ended
December 31,
(b) Includes the financial impact from positions with forward delivery months.(a) Effective January 1, 2018, unrealized gains (losses) on equity securities are recorded in Net Income instead of Other Comprehensive Income (Loss).
(c) Income tax effect calculated at 28.11% statutory rate for 2019 and 2018 and 40.85% statutory rate for prior years, except for lease related activity which is calculated at a combined leveraged lease effective tax rate, and NDT related activity which is calculated at the statutory rate plus a 20% tax on income (losses) from qualified NDT funds.

30PLEASE SEE PAGE 3 FOR AN EXPLANATION OF PSEG’S USE OF OPERATING EARNINGS AND ADJUSTED EBITDA AS NON-GAAP FINANCIAL MEASURES AND HOW THEY DIFFER FROM NET INCOME/(LOSS). B
Reconciliation of non-GAAP Operating Earnings for PSE&G, PSEG Powerand PSEG Enterprise/Other and non-GAAP Adjusted EBITDA for PSEG Power
2019 2018 2017 2016 2015 2014
Net Income 1,250$ 1,067$ 973$ 889$ 787$ 725$ Tax Reform - - (10) - - -
Operating Earnings (non-GAAP) 1,250$ 1,067$ 963$ 889$ 787$ 725$
PSEG Fully Diluted Average Shares Outstanding (in millions) 507 507 507 508 508 508
($ millions, Unaudited)
PSE&G Operating Earnings (Non-GAAP) Reconciliation
Reconciling ItemsYear Ended
December 31,
2019 2018 2017 2016 2015 2014
Net Income 468$ 365$ 479$ 18$ 856$ 760$ (Gain) Loss on NDT Fund Related Activity, pre-tax(a) (255) 144 (133) (5) (24) (138) (Gain) Loss on MTM, pre-tax(b) (285) 117 167 168 (157) (111) Storm O&M, net of insurance recoveries, pre-tax - - - - (172) 27 Plant Retirements and Dispositions, pre-tax 402 (51) 975 669 - - Goodwill Impairment, pre-tax 16 - - - - - Income Taxes related to Operating Earnings (non-GAAP) reconciling items, excluding Tax Reform(c) 63 (73) (395) (336) 150 104 Tax Reform - - (588) - - -
Operating Earnings (non-GAAP) 409$ 502$ 505$ 514$ 653$ 642$
PSEG Fully Diluted Average Shares Outstanding (in millions) 507 507 507 508 508 508
($ millions, Unaudited)
PSEG Power LLC - Operating Earnings (Non-GAAP) Reconciliation
Reconciling ItemsYear Ended
December 31,
2019 2018 2017 2016 2015 2014
Net Income (Loss) (25)$ 6$ 122$ (20)$ 36$ 33$ Lease Related Activity, pre-tax 58 8 77 147 - - Income Taxes related to Operating Earnings (non-GAAP) reconciling items, excluding Tax Reform(a) (26) (1) (32) (55) - - Tax Reform - - (147) - - -
Operating Earnings (non-GAAP) 7$ 13$ 20$ 72$ 36$ 33$
PSEG Fully Diluted Average Shares Outstanding (in millions) 507 507 507 508 508 508
($ millions, Unaudited)
PSEG Enterprise/Other - Operating Earnings (Non-GAAP) Reconciliation
Reconciling ItemsYear Ended
December 31,
(a) Income tax effect calculated at a combined leveraged lease effective tax rate.
(b) Includes the financial impact from positions with forward delivery months.(a) Effective January 1, 2018, unrealized gains (losses) on equity securities are recorded in Net Income instead of Other Comprehensive Income (Loss).
(c) Income tax effect calculated at 28.11% statutory rate for 2019 and 2018 and 40.85% statutory rate for prior years, except for NDT related activity which is calculated at the statutory rate plus a 20% tax on income (losses) from qualified NDT funds.
2019
Operating Earnings (non-GAAP) 409$ Depreciation and Amortization, pre-tax (a) 372 Interest Expense, pre-tax (a) (b) 114 Income Taxes (a) 140
Adjusted EBITDA (non-GAAP) 1,035$
PSEG Fully Diluted Average Shares Outstanding (in millions) 507
PSEG Power Adjusted EBITDA (non-GAAP) Reconciliation
Reconciling ItemsYear Ended
December 31,
(a) Excludes amounts related to Operating Earnings (non-GAAP) reconciling items.(b) Net of capitalized interest.