March 2003 U.S. Acquisitions of Canadian Firms and the ...economics.ca/2003/papers/0239.pdf · 5 1...
40
March 2003 PRELIMINARY DRAFT; PLEASE DO NOT QUOTE U.S. Acquisitions of Canadian Firms and the Role of the Exchange Rate George J. Georgopoulos Division of Management University of Toronto at Scarborough Abstract The decline of the Canadian dollar relative to the U.S. dollar over the past 15 years has raised concerns that Canadian firms have been left vulnerable to takeovers by U.S firms. Theory and empirical studies on cross border mergers and acquisitions (M&As) have generated mixed support for a link between exchange rates and M&As. This paper argues that exchange rate movements may affect acquisition M&As because acquisitions involve firm-specific assets which can generate returns in currencies other than that used for purchase. We use data on U.S. acquisitions in Canada across four-digit SIC industries from 1985 to 2001, and, along with the real exchange rate, account for factors such as industry level Canadian tariff rates, value added of U.S. industries, the number of Canadian M&As and the number of Canadian establishments. Maximum-likelihood estimates from fixed and random effects negative binomial models reveal that a Canadian dollar depreciation leads to U.S. M&As in Canada, but only involving target firms that posses firm-specific assets (high R&D firms). Tariff rates are not significant for such industries. The real exchange rate is not significant for U.S. M&As involving low R&D firms, whereas tariff rates are. Keywords: Mergers and Acquisitions, Exchange Rate, Fixed and Random Effects Negative Binomial JEL classification: F21, F41 Correspondence to George Georgopoulos, Division of Management, University of Toronto at Scarborough, 1265 Military Trail, Scarborough, Ontario, Canada, M1C 1A4; Phone: (416) 287 7335; Fax: (416) 978 7363. Email ([email protected]). I am grateful to Bruce Blonigen and Walid Hejazi for useful suggestions. Of course, the usual disclaimer applies.
Transcript of March 2003 U.S. Acquisitions of Canadian Firms and the ...economics.ca/2003/papers/0239.pdf · 5 1...
March 2003
PRELIMINARY DRAFT; PLEASE DO NOT QUOTE
U.S. Acquisitions of Canadian Firms and the Role of the Exchange Rate
George J. GeorgopoulosDivision of Management
University of Toronto at Scarborough
Abstract
The decline of the Canadian dollar relative to the U.S. dollar over the past 15 years hasraised concerns that Canadian firms have been left vulnerable to takeovers by U.S firms.Theory and empirical studies on cross border mergers and acquisitions (M&As) havegenerated mixed support for a link between exchange rates and M&As. This paperargues that exchange rate movements may affect acquisition M&As because acquisitionsinvolve firm-specific assets which can generate returns in currencies other than thatused for purchase. We use data on U.S. acquisitions in Canada across four-digit SICindustries from 1985 to 2001, and, along with the real exchange rate, account for factorssuch as industry level Canadian tariff rates, value added of U.S. industries, the numberof Canadian M&As and the number of Canadian establishments. Maximum-likelihoodestimates from fixed and random effects negative binomial models reveal that aCanadian dollar depreciation leads to U.S. M&As in Canada, but only involving targetfirms that posses firm-specific assets (high R&D firms). Tariff rates are not significantfor such industries. The real exchange rate is not significant for U.S. M&As involvinglow R&D firms, whereas tariff rates are.
Keywords: Mergers and Acquisitions, Exchange Rate, Fixed and Random Effects NegativeBinomial
JEL classification: F21, F41
Correspondence to George Georgopoulos, Division of Management, University of Toronto atScarborough, 1265 Military Trail, Scarborough, Ontario, Canada, M1C 1A4; Phone: (416) 2877335; Fax: (416) 978 7363. Email ([email protected]).
I am grateful to Bruce Blonigen and Walid Hejazi for useful suggestions. Of course, theusual disclaimer applies.
2
1. Introduction
The decline in the value of the Canadian dollar relative to the U.S. dollar over the late
1990s has raised concerns that Canadian firms are vulnerable for takeover by U.S. firms at “fire
sale” prices. Data on the number of U.S. mergers and acquisitions (hereafter M&As) in Canada
lend support to this claim. While the Canadian dollar declined in value over 1994-2000, the
number of U.S. M&As increased from 260 in 1994 to 478 in 2000, with associated real
transaction values of $5.3 billion and $24.1 billion respectively.
Increased cross border M&A activity raises concerns over the economic impact in the
target nation. Cross border M&As lead to the transfer of ownership and control from domestic
to foreign hands. This transfer may be accompanied by lay-offs and/or the reduction of
production facilities. Cross border M&As also can be used to reduce competition in the
domestic market. These issues are expressed in political discussions and the media, where the
concerns become more pronounced when M&As are viewed as eroding national sovereignty.
While these issues are important, this paper will instead focus on whether there is a link
between the value of the Canadian dollar relative to the U.S. dollar and the number of U.S.
M&As in Canada.
Theories on the link between exchange rates and cross border M&As provide
ambiguous predictions. One view is that there is no link. While a Canadian dollar depreciation
relative to the U.S. dollar makes Canadian assets relatively cheaper for acquiring U.S. firms,
the returns from these Canadian asset are also denominated in Canadian dollars. Conversion
into U.S. dollars at the higher rate of exchange of U.S. dollars for Canadian dollars offsets the
cost reduction of the purchase. Therefore, there is no net impact of a Canadian dollar
depreciation on cross border takeovers.
3
A limitation of the above theory is that the Canadian asset is viewed as a financial asset,
such as a bond or stock, where the costs and revenues are generated in only one currency. If, on
the other hand, the Canadian asset is a factor input that is transferable such as technology, it can
produce output and revenues in another currency. Blonigen (1997) proposes such a theory,
where the firm being acquired has an innovation or a firm-specific asset. His theory also relies
on the assumption of market segmentation or imperfect markets for goods. In this context, the
result is that after a depreciation of the Canadian dollar relative to the U.S. dollar, in the
presence of imperfect goods markets, a U.S. firm will bid higher for a target Canadian firm with
a firm-specific asset than a Canadian firm.
This paper adopts this theory and investigates the empirical link between U.S. M&As
activity in Canada and the Canada-U.S. exchange rate. Specifically we employ random and
fixed effects negative binomial approach to model count data on the number of U.S. acquisitions
in Canada across four-digit SIC industries. Our explanatory variables include the industry
specific real exchange rate, along with traditional determinants of U.S. M&As, such as the U.S.
growth rate, U.S. industry value added, and Canadian tariff rates. Supply variables include the
number of Canadian establishments and the number of Canadian M&As of Canadian firms. The
data are at an annual frequency and cover the period 1985-2001.
The results from the full sample set reveal that the real exchange rate is a determining
factor in explaining U.S. M&As. That is, a Canadian dollar depreciation leads to increased
U.S. M&As in Canada.
To investigate the asset acquisition hypothesis, we split the sample into low R&D
industries and high R&D industries, where it is assumed that high R&D industries are relatively
more technologically endowed than low R&D industries. The high R&D sample set includes
4
traditional technologically based industries such as telecommunication equipment, and
machinery and electronic parts.
The following results emerge. First, it is revealed that the real exchange rate is a
statistically significant determinant for M&As in high R&D industries. That is, a Canadian
dollar depreciation leads to increased U.S. M&As of high R&D industries in Canada. The
estimated coefficient is substantially larger than in the full sample case. Furthermore, the tariff
variable is insignificant. This is a theoretically plausible result, as the tariff rate should not
factor into a foreign firm’s decision to purchase a firm-specific asset.
Secondly, for low R&D industries, the real exchange rate is not statistically significant.
Furthermore, the tariff rate is significant. These results are plausible. For firms with low or no
firm specific assets, the main motive for foreign firms acquiring them is to gain market presence
or power. As such, traditional determinants of FDI play a role, such as tariff rates.
The organization of the paper is as follows. Section 2 presents an overview on the
determinants of Foreign Direct Investment (hereafter FDI), as cross border M&As is one form
of FDI. Section 3 presents a literature review on the theoretical link between exchange rates
and M&As. Section 4 presents summary statistics on the number and value of U.S. M&As in
Canada. Section 5 outlines the econometric methodology and presents the determinants of cross
border M&As and the data used in the empirical analysis. Section 6 presents the empirical
results. Section 7 concludes and discusses further work.
2. Overview on the Determinants of FDI
Strategies in which a corporation can expand internationally is through exporting,
5
The process of corporate globalization typically begins with exporting, then licensing, followed by1
foreign direct investment. (Shapiro 2002). The former two avenues involve minimal investment, and profits areimmediate relative to FDI.
FDI is usually discussed in the context of the multinational corporation (MNC) or multinational2
enterprise (MNE) or transnational corporation (TNC). These terms all refer to the same phenomenon, that beingboth production and transactions are taking place in plants located in two or more countries, but under thesupervision and general direction of the headquarters located in one country.
The 10% ownership of ordinary shares or voting power threshold is the requirement to classify such an3
investment as “direct” for most countries, including Canada and the U.S.
Foreign indirect investment, or portfolio investment, involves only the transfer of money capital (bonds,4
stocks at a value of less than 10% of all stocks outstanding, and various money market instruments, where the theholdings of these instruments does not have significant influence on the issuer of the instruments or does notinvolve ownership or control of any enterprise.
The costs of operating outside of a firm’s country or region include informational costs on product and5
labour markets abroad, linguistic and cultural differences, and the costs of entering foreign networks. Althoughcosts may be incurred if the firm instead chose to trade, they will nonetheless be substantially lower in a foreigncountry.
licensing, and foreign direct investment. Foreign direct investment (FDI) is investment made1
in an enterprise outside of the company’s home country, where the company has a minimum2
stake of 10% of the total equity of the foreign enterprise. The key feature for these investments3
to be ‘direct’ is that the ownership of the resources transferred must remain with the investing
company.4
FDI contributes to the expansion of a company’s production outside of its national
boundaries. The flow of funds could be used to either create its own affiliate, called greenfield
acquisitions, to restructure existing firms, known as brownfield investments, or to merge or
acquire existing firms.
Motives for FDI can be explained through Dunning’s (1988) OLI framework, which
outlines the advantages and conditions under which foreign direct investment will occur in light
of the inherent disadvantages and higher costs of foreign production. To motivate FDI, three5
6
Arms length transactions involving relationship-specific assets may result in the “hold-up” problem.6
conditions are required. A firm must have an ownership advantage over other firms, such as a
patent, a management advantage, or an intangible asset such as goodwill or reputation. Second,
the foreign market must offer a location advantage, where it is more profitable to produce in the
foreign country than to produce at home and export to the foreign country. Factors in this context
encouraging foreign production include quotas, tariffs, lower factor prices, and transportation
costs associated with trade. These two conditions alone do not preclude the firm from licensing
a foreign firm to produce the product for the foreign market. For a firm to find it less costly to
produce abroad than to engage in arms length market activities, there must be an
internalization advantage. For example, offering a license to a foreign firm to produce in the
foreign market could result in leakage of private information concerning the ownership asset.
Also arms length activities could result in the foreign firm acting opportunistically as a result of
an incomplete contract. Hence significant transaction costs associated with arms length6
negotiations that are higher than the costs of producing abroad promotes vertical integration or
in-house production in the foreign country.
This paper focuses on one form of FDI, cross border M&As. Cross border M&As offer
two main advantages over greenfield investments. One advantage is greater speed in gaining
market access or power. In an industry such as the Information Technology sector, product life
cycles are short, and speed and timing is critical. Acquiring a firm will permit quicker access
to any market.
A second advantage is access to proprietary assets. An asset may be an input that is not
tangible or licensable, such as a scientific technology, a management or organizational skill
7
and/or marketing expertise. This motivation is the main theme of this paper. Cross border
M&As initiated for the purpose of acquiring assets may not be affected by traditional FDI
factors, such as trade barriers. One non-traditional factor influencing cross border M&As for
the purpose of acquiring an innovation asset is the exchange rate. As proposed by Blonigen
(1997), in the presence of imperfect goods markets, if a foreign country’s currency appreciates
relative to the domestic country’s currency, the foreign firm can purchase a firm-specific asset
in the domestic country using the domestic currency, and use this asset to increase sales and
revenues in the foreign market. Below we elaborate on this analysis and outline the literature on
the exchange rate - FDI link.
Concerning modes of FDI and the effects on market concentration, a greenfield
investment will increase competition in the domestic market as the number of participants has
increased. The effects of a cross border acquisition on concentration depends on the degree of
market presence of the foreign firm. If the foreign firm has no presence in the domestic market,
an acquisition will not change market concentration or competition, at least in the short run.
However if the foreign firm is already has market presence, acquiring its only rival outright
certainly increases market concentration. A foreign firm, whether present or not in the domestic
market, can increase its competition by acquiring a domestic firm and group of suppliers to
corner the market of a particular input. In this paper we focus less on the effects of acquisitions
on market concentration, and instead focus on foreign firms acquiring a domestic target firm to
access a firm specific asset that is transferable.
3. Exchange Rate - FDI Link and Related Literature
8
Another theoretical argument emphasizes the link between the variability or the forecast of the7
exchange rate and FDI. Studies in this framework include Cushman (1985, 1988) and Goldberg and Kolstad(1994). By contrast, the emphasis of our paper is on the effects changes in the level of the exchange rate on FDI.
Explanations for exchange rate affects on FDI typically are divided among relative
wage effects (Cushman 1985, 1989, Caves 1989) and relative wealth effects (Froot and Stein7
1991, Klein and Rosengren 1994). In the traditional relative wage effect explanation, FDI
represents capital seeking relatively cheap labour. A depreciation of a country’s currency is
associated with an increase in its inward FDI. Relative wealth explanations rely on capital
market imperfections that limit a firm’s level of external financing. A domestic currency
depreciation increases the foreign firm’s wealth relative to the domestic firm, which in turn
increases the amount it may bid on the domestic asset.
Caves (1989) explains that foreign investment becomes sensitive to the exchange rate in
that costs vary with the configuration of the foreign investors’ activities. A depreciation of the
U.S. dollar reduces the cost of production in the U.S. Caves finds an empirical negative
relationship between the lag value of the bilateral real exchange rate and inward FDI flows
from 15 countries into the U.S. over 1978-1986.
Froot and Stein (1991) formally establish a link between the exchange rate and FDI.
They present a model where imperfect capital markets and changes in relative wealth between
domestic and foreign agents play a prominent role. Imperfect capital markets are due to the
specific nature of the acquired asset. Unlike a “passive” investment portfolio of bonds or
stocks, an “information intensive” investment, such as acquiring a firm, has informational
asymmetries with respect to the realization of profits. In this scenario realized profits from the
asset are costlessly seen only by the asset’s owner, while creditors must absorb a positive
9
monitoring cost to observe this profit. The existence of monitoring costs thus makes it
impossible or costly for agents to finance a firm acquisition solely with externally obtained
funds; some amount of internal financing is required. A higher level of net wealth available to
finance such an investment will lower the total cost of capital. Froot and Stein (1991) present a
stylized example illustrating relative wealth changes between a domestic and foreign firm when
the exchange rate changes. For a given amount of internal funds denominated in each countries’
currency, a depreciation of the domestic currency will increase the relative wealth position of
the foreign firm. In competing with the domestic firm for the acquisition of a domestic target
firm, the foreign firm’s cost of capital has decreased, raising its bidding price for the target
firm. In general, more foreign firms will win the auctions for domestic target firms. This theory
is a version of a view quite prominent in the Canadian press, that there are cost of capital
advantages to U.S. firms as a result of a depreciation of the Canadian dollar.
Empirical results by Froot and Stein show that over 1977-1987, the exchange rate had a
statistically significant negative effect on the value and number of transactions for mergers and
acquisitions and for greenfield transactions. The authors looked at the influence of the real
Canadian-U.S. exchange rate on overall FDI into Canada. Using only the real exchange rate and
a constant as a regressor, the results showed that over 1972-1987, the real exchange rate was
statistically significant.
While the relative wage and wealth effect both predict a negative relationship between
the value of the currency and FDI, Klein and Rosengreen attempt to distinguish between the
two. They regress the ratio of cross border M&As on the real exchange rate (ratio of U.S. price
level to the price level of the foreign country), relative wages between the U.S. and the foreign
country, and the ratio of the index of the value of the U.S. stock market to the index of the value
10
of the stock market of the foreign country. The first and third variables are proxies for relative
wealth effects, whereas the second variable is a proxy for the relative wage effect. The results
show statistically negative coefficients on the real exchange rate and relative stock indexes,
whereas relative wages are not statistically significant. The relative wealth effect is thus the
dominant influence.
Dewenter (1995) also investigates differential effects of the real exchange rate on
acquisitions across industries. While the results show some evidence of industry differences,
particularly for machinery manufacturing, the author suggests data on industry specific exchange
rates and wealth may yield more robust results. This paper employs such variables.
Consistent with the relative wealth effects from Froot and Stein (1991), who suggest
foreign firms will raise their bidding price in response to a domestic currency depreciation,
Swenson (1993) and Harris and Ravenscraft (1991) show that U.S. (domestic) target
shareholder wealth gains from cross border acquisitions are positively related to a domestic
currency depreciation. Dewenter (1995) finds that a depreciating dollar is associated with a
higher foreign takeover premia for U.S. targets than domestic premia.
As mentioned studies on cross border acquisitions of Canadian assets arose over
concern that Canadian firms were left vulnerable from a downward trend of the value of the
Canadian dollar relative to the U.S. dollar over the 1990s. Unfortunately the number of
Canadian studies is sparse. Schembri (2002) plots the net annual value of acquisition flows
(value of foreign acquisitions of Canadian assets less value of Canadian acquisition of foreign
assets) over 1975-2000. The data show no overwhelming evidence of a positive trend over the
1990's. Aba and Mintz (2002) also show that there has not been a positive net value or number
foreign acquisitions in Canada. They also reveal differences across sectors, where foreign
11
For the same VAR, they also report that real exchange rate volatility does not Granger-cause inward FDI.8
They do however provide impulse response results on the exchange rate variables and total domestic9
investment and domestic investment in machinery and equipment. The results lean towards an insignificantrelationship between these two measures of investment and the exchange rate variables.
takeovers of Canadian firms is prevalent in the oil and gas sectors, while there has been a
significant increase in the number of Canadian firms acquiring foreign firms in the finance,
insurance and real estate sector. A shortcoming with both studies is that their analysis does not
preclude the possibility that Canadian acquisitions of foreign firms may have resulted from a
Canadian dollar appreciation relative to the associated countries. For example, the Canadian
dollar generally appreciated relative to the English Pound, the German Mark and the French
Franc and Japanese Yen over the latter part of the 1990's. A formal empirical model looking at
exchange rate effects on acquisitions, while taking into account other factors, would be more
convincing.
Lafrance and Tessier (2001) employ VAR analysis containing the Canadian inward FDI
flows, the real exchange rate, and a measure of exchange rate volatility. Over 1970:1-2000:1
they find that the level of the real exchange rate Granger- causes inward FDI. This result is not8
robust when the ratio of undistributed corporate profits to GNP is added to the VAR. A
shortcoming of the Granger technique is that it does not provide an estimate of the direction or
magnitude of the exchange rate-FDI relationship. Unfortunately the authors do not carry out
impulse response analysis on these variables.9
Hejazi and Safarian (2002) explain Canada’s inward FDI stock and trade patterns with
29 countries, employing the gravity model to explain inward FDI and an augmented gravity
model to explain trade. The authors find no statistical relationship between the stock of inward
12
FDI and the exchange rate.
Blonigen (1997) provides theoretical and empirical evidence in support of a negative
relationship between a domestic country’s currency value and the amount of foreign
acquisitions of domestic firms. This theory assumes that FDI is motivated by acquiring firm-
specific assets. Unlike Froot and Stein’s imperfect capital market assumption, Blonigen’s
argument relies on the assumption of imperfect goods markets, where the domestic firm does
not have equal access to the foreign market in selling its products.
Suppose a U.S. and Canadian firm have equal opportunity to purchase a Canadian firm
that has an innovation that is transferable. Assuming wealth for the U.S. firm is in U.S. dollars
and wealth for the Canadian firm is in Canadian dollars, a Canadian currency depreciation will
lower the costs of purchasing this firm for the U.S. firm, while the costs will remain the same
for the Canadian firm. Since the asset is transferable, the U.S. firm can transfer that asset to the
U.S. market, generating returns in U.S. dollars, while this option is unavailable for the Canadian
firm due to unequal access to the U.S. market. Thus, discounted future profits increase for the
U.S. firm, but not for the Canadian firm, leading to a higher bid price by the U.S. firm and
increasing the likelihood of the U.S. firm acquiring the Canadian firm.
The assumption of imperfect goods market is not unreasonable, as U.S. firms generally
have greater market presence and accessibility in U.S. markets relative to Canadian firms. This
may be due to established networks in the form of buyer and seller relationships and
distributional networks. Some of these relationships reflect strategic choices such as
relationship-specific investments, where it is too costly to switch suppliers, especially for
differentiated products. Greaney (2002) proposes that network effects can produce asymmetric
trade and investment flows.
13
Another form of unequal access is the case where the U.S. firm is part of a cluster or
agglomeration and the Canadian firm is not, where the U.S. firm’s potential profitability from
the acquired asset is thus higher due to knowledge spillovers from localized related industries
and research centres. In general, a U.S. firm is more familiar with the workings of its own
market relative to a Canadian firm, and hence its profitable opportunities will be higher. As
such the potential Canadian target firm will be more valuable to the U.S. firm than to the
Canadian firm in light of a Canadian dollar depreciation.
As noted with Swenson (1993), Harris and Ravenscraft (1991) and Dewenter (1995),
foreign companies pay a premium in acquiring U.S. firms relative to U.S. companies. Feenstra
(1998) suggests that this result may reflect foreign firms getting preferential treatment in their
own country relative to U.S. firms, thus making the U.S. acquisition more valuable to the foreign
firm. Further work involves measuring the abnormal returns from a U.S. acquisition of
Canadian firms. A higher abnormal return from U.S firms would reflect some positive degree of
imperfect goods markets between U.S. and Canadian markets.
Entering foreign markets in order to gain information and experience that is expected to
prove useful elsewhere suggests that FDI may in part be motivated by a desire to source
technology, as supported by a few studies. Dunning (1995) suggests FDI is “pulled” towards
centres of innovation as a means for the investor to acquire new skills. Kogut and Chiang
(1991) found that Japanese investments in Europe and the U.S. were attracted to R&D
industries, often in the form of M&As. Van Pottelsberghe and Lichtenberg (2001) show that a
country’s technological base and total factor productivity is increased more through outward
FDI rather than inward FDI. We have also proposed that technology is transferred to the U.S.
after the Canadian firm is acquired. This seems intuitive and is supported by two survey studies
14
FDI includes only the amount of funds involved in the merger or acquisition, not the total value of the10
merger or acquisition transaction. The World Investment Report definition of an acquisition is any transaction thatyields control of at least 10% of the target firm’s assets or common shares. As noted below and in Appendix 1, ourdata reflects M&As were there is control of at least 50% of the target firm’s assets.
In collecting the data, the Investment Review Division does not distinguish between acquisitions and11
mergers. However the Division suggested that over 95% of the transactions involve acquisitions.
by McFetridge (1987) and Caves (1996) that show that technology is quickly transferred to
large markets.
Using an extensive data set, this paper attempts to add to the sparse literature on foreign
acquisitions of Canadian firms. We focus on U.S. acquisitions, as an overwhelmingly number of
foreign acquired Canadian firms are by U.S. companies. Below we outline the trend of U.S.
M&A activity in Canada.
4. Merger and Acquisition Trends in Canada
According to the World Investment Report (UNCTAD 2000), cross border M&As are
the major driving force in the recent increase in FDI. In 1999, cross border M&As increased by
35 percent. M&As now represent over one third of total FDI. Approximately 97% of these10
transactions are acquisitions, while 3% are mergers. Between developed countries,
approximately 85% of total FDI is in the form of cross border M&As. The report suggests that
the rapid pace of technological change and the liberalization of foreign investment policies by
numerous countries are the major driving factors of the increased number and value of M&As.
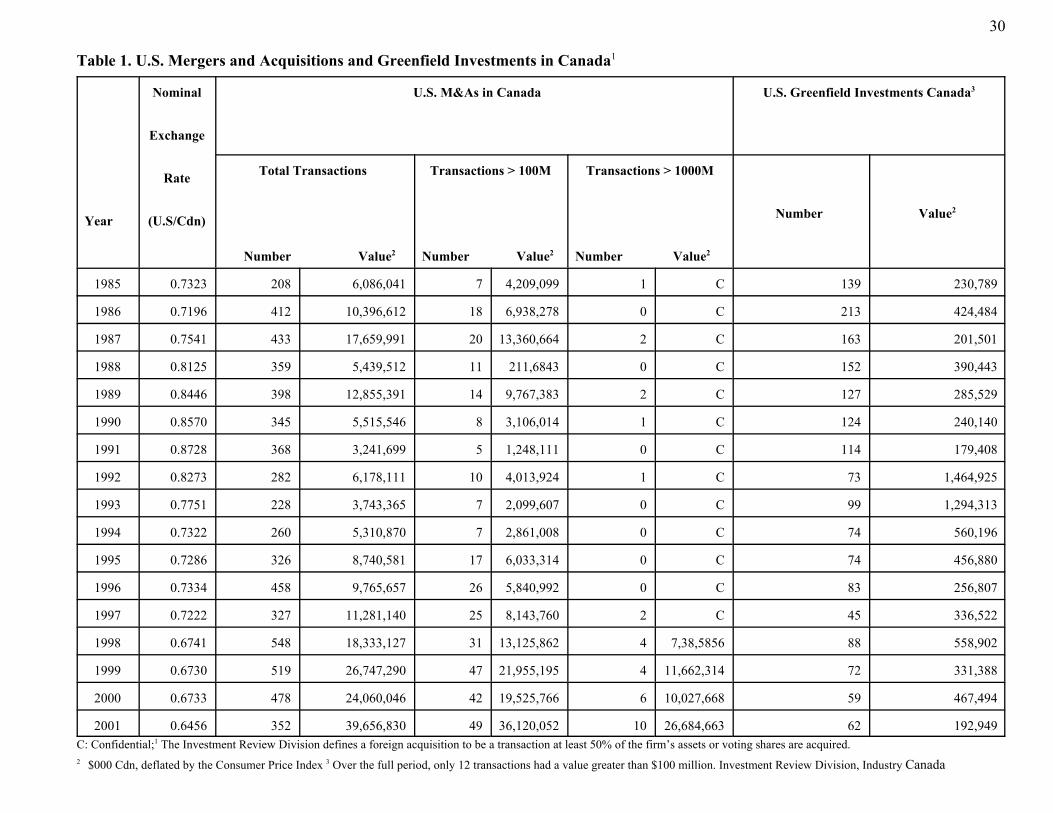
Table 1 presents data on U.S. M&As and U.S. greenfield investments in Canada. The
data are from the Investment Review Division, Industry Canada. They define a foreign11
acquisition to be a transaction where the foreign firm acquires at least 50% of the domestic
15
Note that other agencies define an M&A to be control of at least 10% of the target firm. The12
International Trade Division uses this minority-owned definition, and as such records the funds involved inacquiring 10% of the firm to calculate FDI values. The values in Table 1 on M&As record the value of thetransaction, not the funds invested to acquire the firm.
firm’s assets or voting shares. A few patterns emerge from the data. The primary form of12
investment in terms of real dollar value is acquisition of existing Canadian assets, as opposed
to new establishments or greenfield investments. Second, acquisitions fluctuate much more from
year to year than the start ups of new establishments. Part of the fluctuation in acquisitions can
be attributed to the occasional occurrence of very large acquisitions. The table also shows that
the value of acquisitions increased significantly during the years 1987, 1989, and 1998-2001,
periods that experienced transactions with a value of greater than $1 billion. The data on the
value of greenfield investments, on the contrary, is relatively stable, with the exception of the
values in 1992 and 1993. Furthermore the value of the transactions is relatively small, where,
although not reported here, only 12 of the new establishment transactions over the whole period
had a value greater than $100 million.
The data also show a significant increase in the value of M&As, beginning in 1995 and
continuing up to 2001. Along with the increase in the number of acquisitions valued at greater
than $1 billion, there was also a significant increase in the number of transactions valued
greater than $100 million over this period. The number of transactions in this value range
increased from 7 in 1994 to 17 in 1995 and increased steadily thereafter to 49 in 2001. Of
particular interest is the value of the U.S.- Canada exchange rate over this period. Table 1 also
shows that the Canadian dollar depreciated significantly from 1991 to 1992, and continued to
do so over the latter part of the 1990's up to 2001. The statistics roughly suggest an association
between the value of the Canadian dollar and the number and value of acquisitions. Furthermore
16
it would be difficult to attribute the wide fluctuations in cross border M&As to relative changes
in factor prices or transaction costs, as the latter two factors of FDI change gradually or
infrequently.
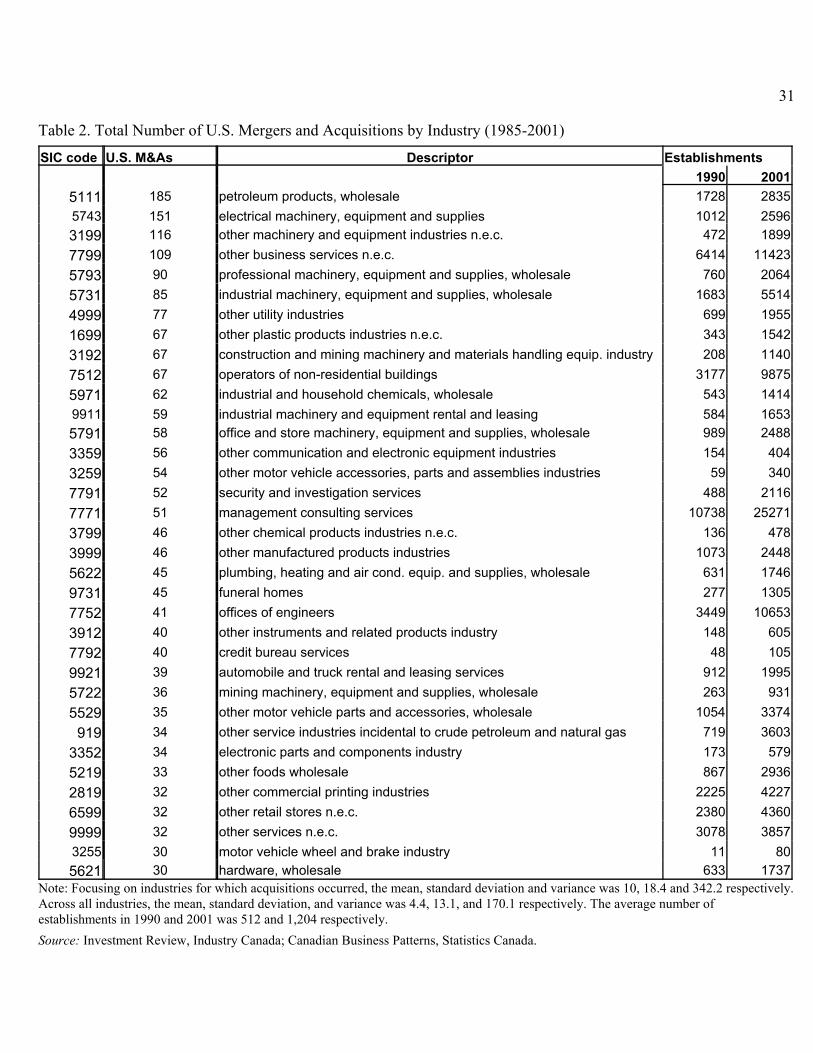
It would be insightful to examine the sectors where most of the M&A activity is taking
place. Table 2 reports the total number of U.S. M&As by target industry, where sectors with
more than or equal to 30 M&As are only reported. The wholesale petroleum products sector
experienced the most M&A activity, where 185 transactions took place over 1985-2001 (this is
the only petroleum category in the wholesale industry). Casual observation shows that a fair
amount of M&A activity occurred in the wholesale industry, which consists of SIC codes 5011-
5999. Of the 35 reported codes, 11 are in the wholesale industry. Of the top 13 sectors, 6 are in
wholesale, with most M&A occurring within the petroleum products wholesale industry. The
high frequency of M&A in the wholesale industry may partially be explained by the high
number of establishments in each SIC code. The last two columns in Table 2 show that for most
of the wholesale industry codes, there were more than 2,000 establishments in 2001, where the
industry average was 1,204 (see notes below Table 1).
Looking across all codes in Table 2, the number of establishments is not the only factor
driving the frequency of M&As. There were 67 M&A transactions in codes 3192 and 7512, yet
the number of establishments in each was substantially different. The same can be said of codes
7771 and 3799 which experienced 51 and 46 M&As respectively. Other examples are
comparing the second and third reported codes in Table 2, and comparing the last two reported
codes. There are thus other determinants of cross border M&As beyond the number of
establishments.
One potential factor is the Canada-U.S. exchange rate. Overall the data show a high
17
Hausman et al. (1984) state that the RE Negbin model yields asymptotically more efficient estimators13
than their fixed effects model. For these results to be consistent, the industry-specific effects need to beuncorrelated with the regressors.
degree of U.S. M&A activity over the second half of the 1990s. Over this period the Canadian
dollar depreciated relative to the U.S. dollar. This suggest that the exchange rate may have
some explanatory power. Below we present the statistical model and investigate the
explanatory power of the exchange rate and other determinants of U.S. M&A activity in Canada.
5. Empirical Methodology and Specification
We model the number of U.S. mergers and acquisitions by employing the Random
Effects Negative Binomial (henceforth RENegbin) model proposed by Hausman et al. (1984).
As opposed to the Poisson model, the RENegbin model allows for the conditional expected
value and the variance of the number of M&As to differ, i.e. allowing for “overdispersion”.
Given the panel nature of the data used here, the RENegbin model allows disperson to vary
randomly across industries. We also present Hausman tests to determine whether the Fixed
Effects Negative Binomial model is more appropriate. Appendix I discusses the RENegbin13
model in more detail.
The dependent variable is the number of U.S. M&As of Canadian businesses at the 4-
digit SIC level, excluding government services industries (codes 8111-8699). The data was
taken from the Investment Review Division, Industry Canada. According to the Investment
Canada Act, section 26, a merger or acquisition relates to a change in control, where control is
defined as acquiring at least 50% plus one of common voting stocks, or above 50% of assets.
For more details on the collection of these data and other variables, see the Appendix II.
18
As will noted below, like this paper, he uses a similar real exchange rate, along with the two demand14
variables and the number of domestic M&As. Notable differences are his dependent variable being at the 3 digitlevel, whereas ours is at the 4 digit level. While Blonigen uses a protection variable from the World Bank, thispaper uses tariff rates. Furthermore while this paper uses the number of establishments to capture sector size,Blonigen uses a time trend.
The regressors chosen generally follow Blonigen’s (1997) regressor set. The industry-14
specific real exchange rate is constructed using the nominal Canadian per U.S. exchange rate,
and roughly 2-digit SIC price indexes for Canada and the U.S. Concordance tables were used to
match Canadian 1980 SIC codes with U.S. 1987 SIC codes (Statistics Canada 1990). An
increase in the industry specific real exchange rate reflects a real Canadian dollar depreciation
and should be positively correlated with the dependent variable.
Cross border M&As may result from foreign firms avoiding tariffs and other restrictions
that nations impose on imports. Cross border M&As are thus alternative strategies in
penetrating a domestic market. We capture this policy effect by including effective Canadian
tariff rates on U.S. imports at the 4-digit SIC level. We would expect a positive correlation
between this variable and the dependent variable.
To account for U.S. demand for Canadian firm factors, we employ the U.S. growth rate
of real U.S. GDP, and the share of value added of U.S. industry i at the 2-digit SIC level (again,
concordance tables were used for this latter variable). These demand factors may be reflecting
horizontal mergers as firms seek to achieve greater market power. The demand variables
should be positively correlated with the dependent variable.
For supply variables, we include the total number of Canadian establishments at the 4-
digit SIC level to account for sector size. The larger the sector size measured by the number of
establishments, the higher the probability of a U.S. acquisition, ceteris paribus. To capture the
19
overall climate of merger and acquisition activity in Canada, we include the number of mergers
and acquisition of Canadian firms by Canadian firms at the 4-digit SIC level. A positive climate
of M&A opportunities in Canada should be reflected by a high amount of M&As by Canadian
firms. A positive climate should also increase the probability of an acquisition by a U.S. firm.
Thus there should be a positive correlation between the number of Canadian M&As and U.S.
M&As. This supply variable should be positively correlated with the dependent variable.
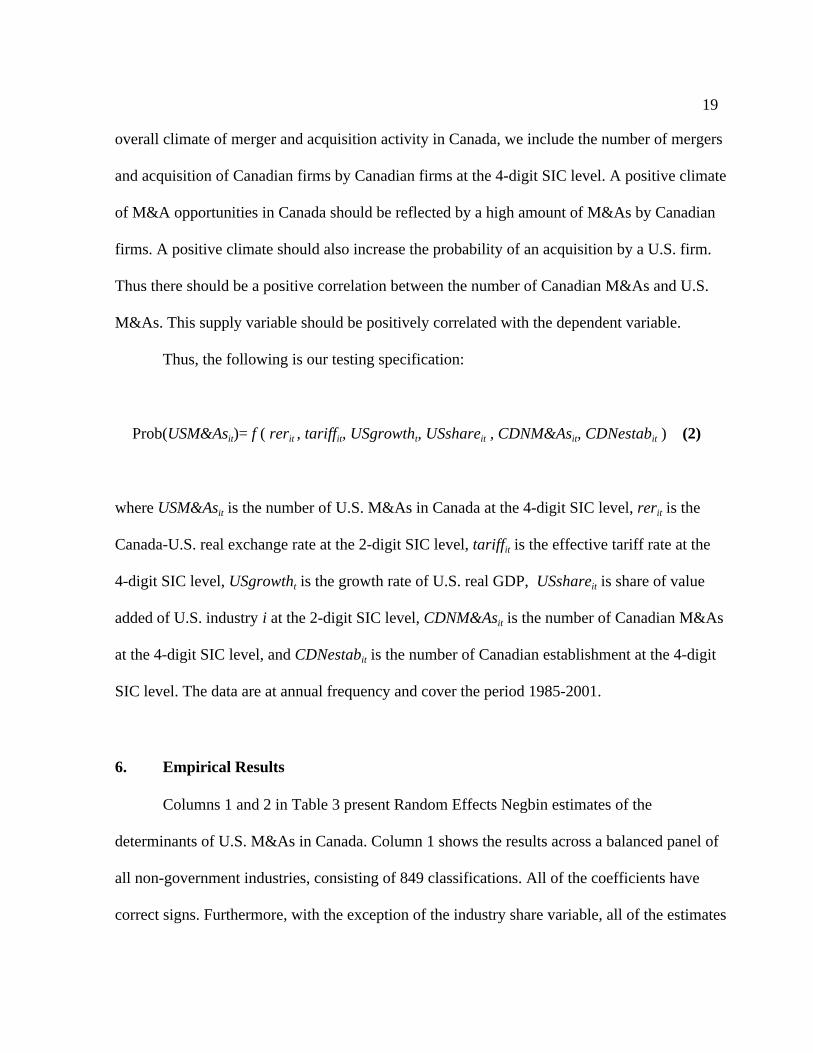
Thus, the following is our testing specification:
Prob(USM&As )= f ( rer , tariff , USgrowth , USshare , CDNM&As , CDNestab ) (2)it it it t it it it
where USM&As is the number of U.S. M&As in Canada at the 4-digit SIC level, rer is theit it
Canada-U.S. real exchange rate at the 2-digit SIC level, tariff is the effective tariff rate at the it
4-digit SIC level, USgrowth is the growth rate of U.S. real GDP, USshare is share of valuet it
added of U.S. industry i at the 2-digit SIC level, CDNM&As is the number of Canadian M&Asit
at the 4-digit SIC level, and CDNestab is the number of Canadian establishment at the 4-digitit
SIC level. The data are at annual frequency and cover the period 1985-2001.
6. Empirical Results
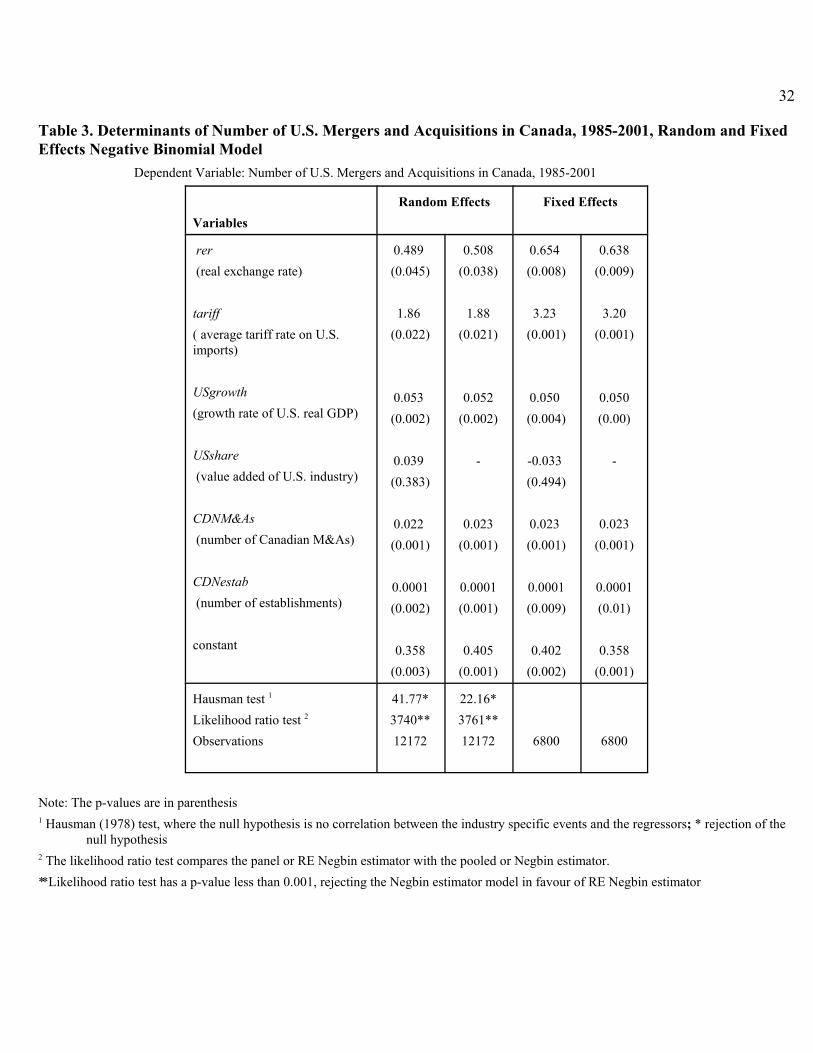
Columns 1 and 2 in Table 3 present Random Effects Negbin estimates of the
determinants of U.S. M&As in Canada. Column 1 shows the results across a balanced panel of
all non-government industries, consisting of 849 classifications. All of the coefficients have
correct signs. Furthermore, with the exception of the industry share variable, all of the estimates
20
The test results and estimates of the alpha parameter are available upon request.15
The results from using the nominal exchange rate are available upon request.16
are statistically significant at the 5% level as shown by the p-values.
Below the reported coefficient estimates we record a likelihood ratio test which
compares the RE Negbin or panel estimator with the Negbin model or pooled estimator. The
test statistic rejects the null hypothesis of the pooled estimator or the Negbin estimator with
constant dispersion. Although not reported, we performed a likelihood ratio test on the alpha
parameter to determine whether the data can be modeled by a Poisson process. A value of zero
for the alpha parameter implies that the data is generated by a Poisson process, or no
overdispersion, which is a special case of the Negbin model. For this and all specifications, the
Poisson model is rejected in favour of the Negbin model. 15
Column 2 shows results from excluding the share variable. Again, all the coefficients
have correct signs, and are all statistically significant. There is strong evidence that growth in
U.S. real GDP is highly correlated with increased U.S. M&As in Canada. Supply side factors,
such as the size of the sector and the degree of M&A activity level proxied by the number of
Canadian M&As, are also statistically positively correlated with U.S. M&As. There is also
evidence of tariff jumping. Finally, the real exchange rate is statistically significant when we
estimate across all industries. Although not reported here, the results are robust when the
nominal interest rate is used.16
To test whether the industry-specific effects are correlated with the regressors, we
compare the random effects estimates to the fixed effects estimates using a Hausman (1978) test.
We report the Hausman test at the bottom of column 1, which tests the specifications in column
21
1 and 3. This test is distributed as ÷ under the null hypothesis of no correlation between the2
industry specific effects and the regressors. The test statistic equals 41.77, reflecting
inconsistent parameter estimates and thus a rejection of the random effects model in favour of
the fixed effects model. Column 3 shows the estimated results are similar to the random effects
estimates, as all the variables but industry share are significant, and all the significant variables
have correct signs. Column 4 excludes the industry share variable, where the results are similar
to column 2. Using the nominal exchange rate, the fixed effects model yields similar results.
Overall the specifications show the real exchange rate to be a significant determinant of U.S.
M&As in Canada.
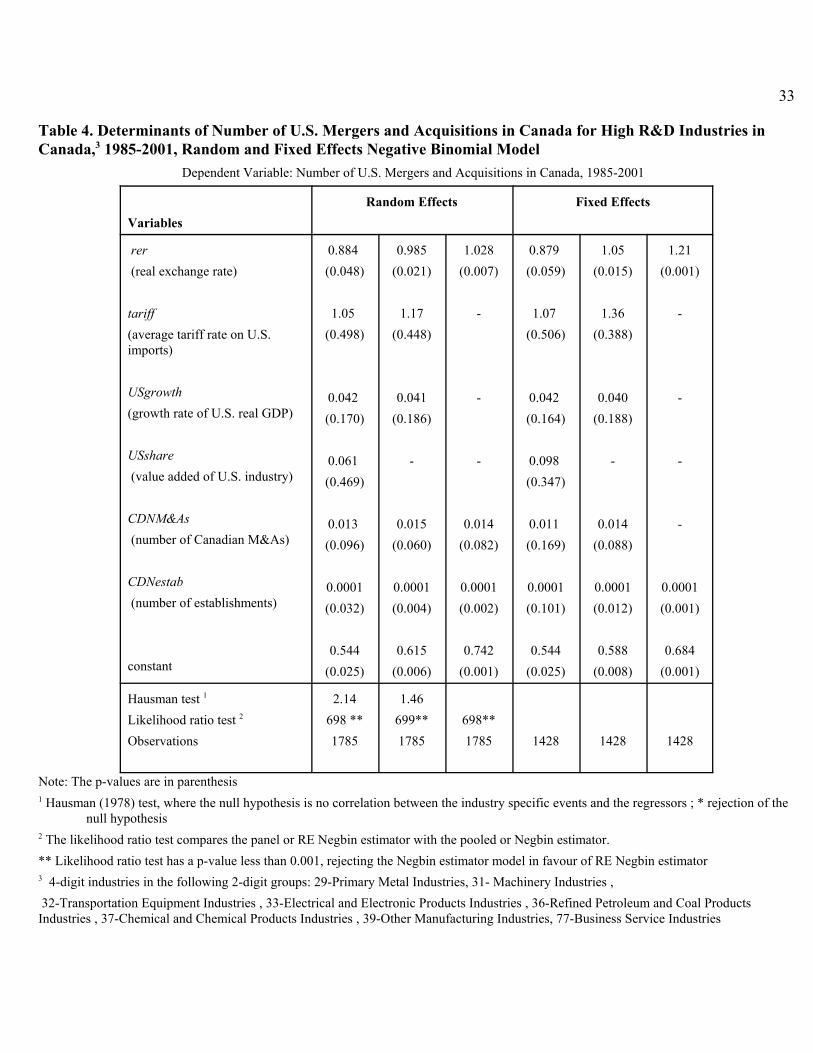
To distinguish between acquisitions occurring due to the asset acquisition effect or the
wealth effect proposed by Froot and Stein (1991), we split the data set according to the degree
of R&D intensity. High R&D industries are more likely to have technology related firm-specific
assets. According to the asset acquisition hypothesis proposed by Blonigen (1997) these
industries are expected to experience a higher number of cross border M&A activity in the
presence of a foreign currency appreciation, as domestic firm specific assets that are
transferable are now relatively less costly to acquire. We classify high R&D industries as those
whose ratio of R&D expenditures to GDP are greater than the ratio of R&D to GDP for Canada,
that being 2% (World Competitiveness Report 2001). The industries with ratios greater than
2% are reported at the bottom of Table 4. Most of these are in the manufacturing sector and are
the traditional R&D industries, such as telecommunication equipment, and electronic parts and
equipment. Business service industries are also in this category.
Column 1 in Table 4 presents the from the high R&D industry data set. At the bottom of
the table the Hausman test shows that the random effects model is the correct model, as the
22
industry specific effects are uncorrelated with the regressors, yielding consistent estimates.
Focusing on column 1, again all the coefficients have correct signs. The value added share
variable is insignificant, as are the U.S. growth and tariff rate variables. The latter result is
intuitively sensible, as a tariff barrier is not a factor for a foreign firm engaging in an M&A
transaction solely to acquire a firm specific asset. The insignificant estimated coefficient on the
tariff barrier reflects this. The insignificance of the value added and growth variables may
reflect that these two variables are factors for horizontal integration, or firms wishing to expand
market scale to achieve sufficient economies of scale. These two variables are not factors
explaining the acquisition of firm-specific assets, or vertical integration.
More importantly, the coefficient on the real exchange rate is significant and almost
twice the magnitude compared with the full sample estimate from the random effects model,
0.889 vs. 0.489. Columns 2 and 3 show the results from separately dropping the insignificant
variables USshare, tariff, and USgrowth. Column 3 presents the final results, where the
estimate of the coefficient on the real exchange rate becomes more precise and its magnitude is
larger. The likelihood ratio tests are also recorded, showing that the Negbin model can be
rejected in favour of the RE Negbin model. Furthermore, although not reported here, the results
show significant values for the alpha parameter, reflecting overdispersion and invalidating the
Poisson model. Results from using the nominal exchange rate remain robust. We also present
the fixed effects estimates in columns 4-6, where again the results are similar to the random
effects model.
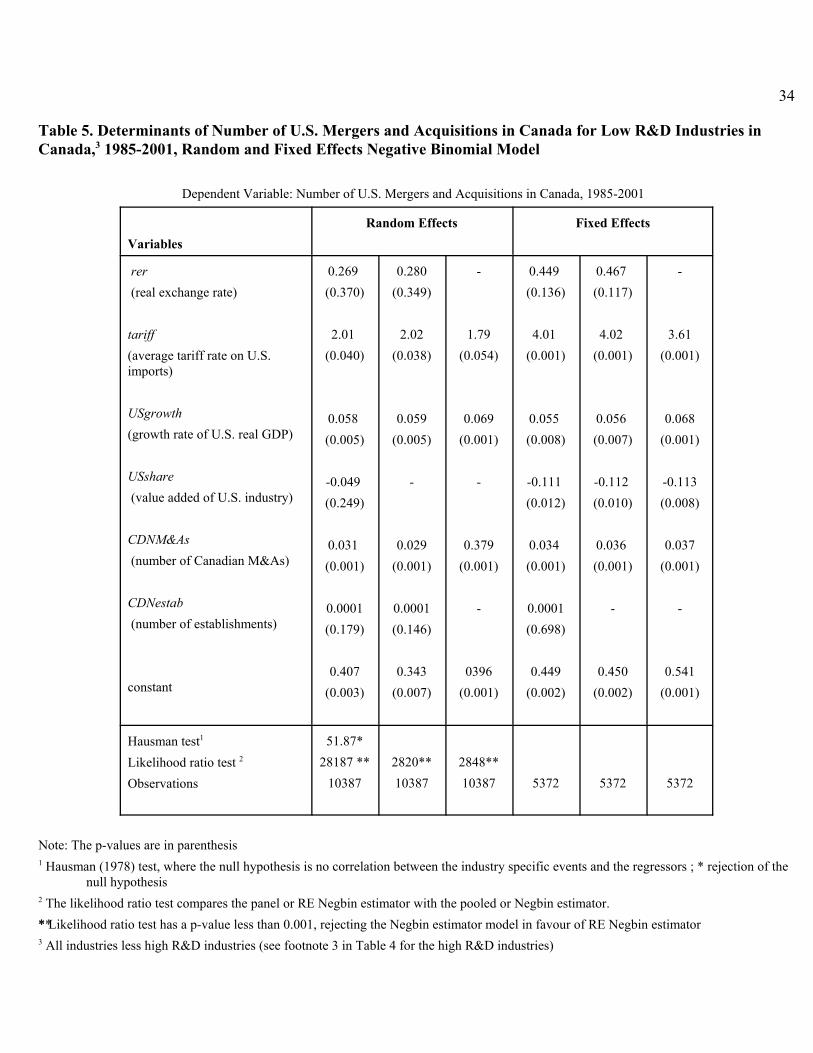
Table 5 shows the results from the sectors characterized by a low intensity of R&D.
The Hausman test rejects the null hypothesis of no correlation between industry specific effects
and the regressors, although again the results between the two estimation procedures are
23
similar. Focusing on column 4, of importance is that the real exchange rate is statistically
insignificant. This is consistent with our asset acquisition hypothesis, where there is no interest
in acquiring a firm if this firm does possess a technology that will create revenues in the foreign
country in the face of an appreciation of the foreign currency and imperfect goods markets. Note
also that the tariff rate is now significant. For these industries, the suggested motive for cross
border M&As is to gain access to a new market or exploit economies of scale, both of which
are inhibited by tariffs.
Notwithstanding the insignificant coefficient, the magnitude of the coefficient on the real
exchange rate is substantially lower than the high R&D case and the full sample. Columns 5
and 6 show the results from omitting the insignificant variables. We see that the real exchange
rate remains statistically insignificant. Column 6 report the statistically significant estimates.
Again the likelihood ratio tests reveal that the RE Negbin model is appropriate as
opposed to the Negbin model. The results again show a significant alpha value, invalidating the
Poisson model. The results are similar when the nominal exchange rate is used.
To summarize, the results strongly show that the exchange rate is a factor for cross
border M&As of firms with high levels of R&D, associated with high levels of technology. For
these firms tariff rates are not statistically significant. This is expected when the primary motive
for an M&A is to acquire a firm-specific asset. For industries with low levels of R&D, the
exchange rate does not play a role. The results suggest that M&A activity in these sectors occur
for foreign firms to gain market access or to increase market power. Traditional FDI factors
driving this motive, such as tariffs and foreign country growth in real GDP, show to be
statistically significant.
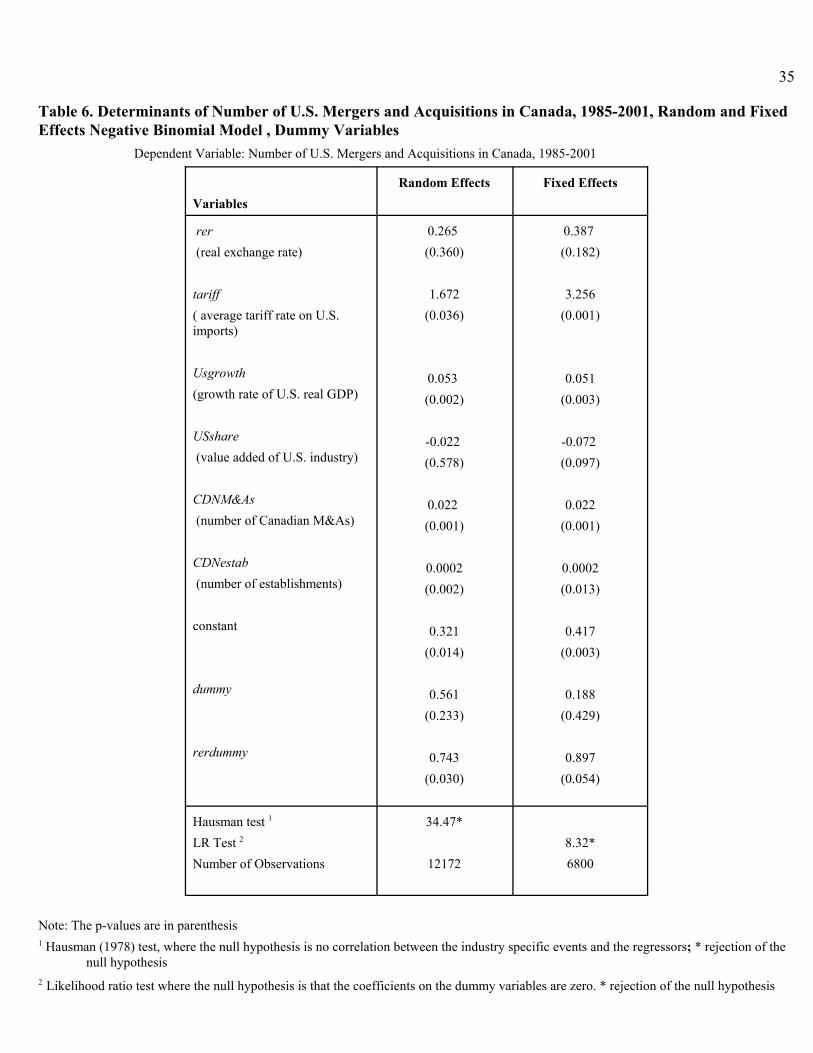
As an alternative to splitting the full data set into high and low R&D firms, we can
24
improve the efficiency of the parameter estimates by employing the full data set and include
dummy variables for the high R&D industries. Specifically, in Table 6, an intercept dummy
variable, dummy, taking on a value of 1 for high R&D industries is included to test whether the
expected mean value of cross border M&As of high R&D industries differs from low R&D
acquisitions. Furthermore we include a dummy variable that interacts with the real exchange
rate; the variable rerdummy is the product of the real exchange rate and the dummy variable that
takes on a value of 1 for high R&D industries. This allows for testing whether the real exchange
rate has a differential response on the acquisition of high vs. low R&D industries.
As the results in Table 6 show, the intercept dummy is not significant, reflecting an
insignificant difference of the expected mean values of the number of acquisitions between high
and low R&D industries. Of importance is the performance of the exchange rate- dummy
interacting variable, rerdummy. The p-value shows it is marginally significant at the 5% level
of significance, and the value of the coefficient is high and similar to the value in Table 4.
Furthermore the real exchange rate variable rer, which captures this variable’s effect on the
acquisition of low R&D industries, is insignificant. Overall these results are consistent with the
results in Tables 5 and 6 and confirm that the real exchange rate matters for acquisitions only in
high R&D industries.
7. Concluding remarks and extensions
Data on U.S. M&As and greenfield transactions in Canada over 1985-2001 revealed
increased M&A activity over the latter half of the 1990s, with a relatively downward trend in
greenfield investments. Over this period the Canadian dollar depreciated substantially relative
to the U.S. dollar. This evidence suggested a potential link between the Canada-U.S. exchange
25
rate and the number of U.S. M&As in Canada. A potential theory that explains this link is
proposed by Blonigen (1997), which relies on the assumption of imperfect goods markets and
the possession of firm specific assets by the target firm.
We employed fixed and random effects negative binomial models to model count data
on the number of U.S. M&As in Canada. The results from the full sample set showed that the
real exchange rate was a determining factor in explaining U.S. M&As, taking into account other
FDI determinants.
We then split the sample into low R&D industries and high R&D industries, where the
latter sample included traditional R&D industries such as telecommunication equipment, and
machinery and electronic parts. The results showed that the real exchange rate was statistically
significant for M&As in high R&D industries, where the estimated coefficient was substantially
larger than in the full sample case. Furthermore, the tariff variable was insignificant. This is a
theoretically plausible result, as the tariff rate should not factor into a foreign firm’s decision to
acquire a firm possessing an innovative asset. For the low R&D industries, the real exchange
rate was not significant, whereas the tariff rate was. These results are plausible; given little if
any firm specific assets held by these firms, the main motive for foreign firms to acquire them is
to gain market presence or power. As such traditional determinants of FDI play a role, such as
tariff rates. Using an intercept dummy and interactive exchange rate- dummy variable in the full
data set, the results showed again that the real exchange rate matters for acquisitions of only
high R&D industries.
While this paper focuses on establishing an empirical link between U.S. M&As and the
exchange rate, it would be instructive to touch on a few policy implications. The loss of control
over such high-value added industries, with their associated positive spillover effects, has a
26
potentially significant economic impact in the domestic country. The size of the impact depends
on whether the innovation or firm specific asset is entirely relocated. To the extent that
domestic production is not halted after the takeover, welfare may not be reduced. If all of the
asset is transferred and production facilities in Canada cease, welfare will reduce. The effects
are pronounced for technologically endowed assets, as significant spillover effects are
associated with such assets. Studies have shown that Canada’s economy lacks in high-end or
product innovative manufacturing industries, which may be a significant contributor to the
Canada-U.S. productivity gap (Trefler, 1999; Statistics Canada 2001; Martin and Porter 2001).
In an environment with a low value of the Canadian dollar relative to the U.S. dollar,
there may be incentive problems in initiating or starting up research or innovative intensive
projects, as these ventures may eventually be acquired by U.S. firms. Furthermore it will be
difficult to rationalize government spending and subsidization to these firms given they are
vulnerable for takeover during periods of continuous Canadian currency depreciations.
While this paper focuses on the exchange rate as a determining factor of cross border M&As,
monetary authorities should then take note of the negative consequences of a currency
depreciation, as this factor contributes to the loss of ownership of Canadian R&D intensive
industries.
27
Bibliography
Aba and Mintz (2002) “ Preserving Control: Canada and the International Market for CorporateAcquisitions”, Backgrounder, No. 62, September, C.D. Howe Institute
Blonigen, A. (1997) “Firm Specific Assets and the Link Between Exchange Rates and ForeignDirect Investment” American Economic Review vol. 87, no. 3, pp. 447-65
Cameron, A. and P. Trivedi (1998) Regression Analysis of Count Data, New York:Cambridge University Press
Caves, D. (1996) “Multinational Enterprise and Economic Analysis” Second Edition,Cambridge Surveys of Economics Literature, Cambridge University Press
________ (1989) “Exchange-Rate Movements and Foreign Direct Investment in the UnitedStates” in Internalization of U.S. Markets, D.B. Audretsch and M.P. Claudon (eds), pp.199-228, New York: New York University Press
Cushman, D. (1985) “Real Exchange Rate Risk, Expectations, and the Level of DirectInvestment”, Review of Economics and Statistics, vol. 67, no. 2, pp. 297-308
___________(1988) “Exchange-Rate Uncertainty and Foreign Direct Investment in the UnitedStates” Weltwirtschaftliches Archiv, vol. 124, no. 2, pp. 322-36
Dewenter, K. (1995) “Do Exchange Rate Changes Drive Foreign Direct Investment?” Journalof Business vo. 68, no. 3, pp. 405-433
Dunning, J. (1995) “Reappraising the Eclectic Paradigm in an Age of Alliance Capitalism” Journal of International Business Studies, 3, pp 461-491
Dunning, J. (1988) “Location and the Multinational Enterprise: A Neglected Factor?” Journal of International Business Studies, 29, 1
Feenstra, R. (1998) “Facts and Fallacies about Foreign Direct Investment”, Working Paper,University of California at Davis and the National Bureau of Economic Research
Froot, K. and J. Stein (1991) “Exchange Rates and Foreign Direct Investment: An ImperfectCapital Markets Approach”, Quarterly Journal of Economics 106 pp190-207
Goldberg, L. and C. Kolstad (1994) “Foreign Direct Investment, Exchange Rate Variability and
28
Demand Uncertainty” International Economic Review vol. 36, No. 4 , pp 855-73
Gross, R. and L. Trevino (1994) “Foreign Direct Investment in the United States: An Analysisby Country of Origin” Journal of International Business Studies vol. 5, pp 139-155
Greaney, T. (2002) “Reverse Importing and Asymmetric Trade and FDI: A NetworksExplanation”, Working Paper No. 02-15, University of Hawaii at Manoa
Harris, R. and D. Ravensraft (1991) “The role of acquisitions in foreign direct investment:evidence from the US stock market” Journal of Finance, 46, 825-44
Hausman, J.A. (1978) “Specification Tests in Econometrics”, Econometrica 46, 1251-71
Hausman, J., Hall, B. and Z. Griliches (1984) “Econometric Models for Count Data with anApplication to the Patents R&D Relationship” Econometrica 52 (4), pp 909-38
Hejazi, W. and A.E. Safarian (2002) “ Explaining Canada’s Changing FDI Patterns”, WorkingPaper, University of Toronto
Klein, M., and E. Rosengren (1994) “The real exchange rate and foreign direct investment inthe United States: relative wealth vs. relative wage effects” Journal of InternationalEconomics 36, pp 373-389
Kogut, B. and J. Chang (1991) “Technological Capabilities and Japanese Foreign DirectInvestment in the United States” The Review of Economics and Statistics, 73: 401-13
Lafrance, R. and D. Tessier (2001) “Exchange Rate Variability and Investment in Canada” in Revisiting the Case for Flexible Exchange Rates, Proceedings of a conference held atthe Bank of Canada, November 2000: Bank of Canada
Martin, R. and M. Porter (2001) “Canadian Competitiveness: A Decade after the Crossroads”,
Working Paper, Rotman School of Management
McFetridge, D.G. (1987) “The Timing, Mode and Terms of Technology Transfer: Some RecentFindings” In A. Safarian and G. Y. Bertin (eds.), Government, Mulitnationals, andInternational Technology Transfer, pp. 135-50. New York: St. Martin’s Press
29
Schembri, L. (2002) “Foreign Takeovers and the Canadian Dollar: Evidence and Implications”,Bank of Canada Review, Spring
Shapiro, A.C. (2002) Foundations of Multinational Financial Management, fourth Edition,Wiley
Statistics Canada (2001) “Productivity Growth in Canada”, Catalogue No. 15-204-XPE
Statistics Canada (1990) “Concordance between the standard industrial classifications ofCanada and the United States, 1980 Canadian SIC - 1987 United States SIC ”,Catalogue 12-574-XDE
Swenson, D. (1993) “Foreign mergers and acquisitions in the United States”. In K.A. Froot(ed.), Foreign Direct Investment, pp. 255-86. Chicago: University of Chicago Press
Trefler (1999) “The Long and the Short of the Canada-U.S. Free Trade Agreement”, Perspectives of North American Free Trade Paper Number 6, Industry Canada
Van Pottelsberghe de la Potterie, B, and F. Lichtenberg (2001) “Does Foreign DirectInvestment Transfer Technology Across Borders?” The Review of Economics andStatistics, August, 83(3): 490-497
World Competitiveness Report (2001), EMF Foundation, Geneva, Switzerland
World Investment Report (2000) Cross Border Mergers and Acquisitions and Development,United Nations, New York and Geneva
30
Table 1. U.S. Mergers and Acquisitions and Greenfield Investments in Canada1
Year
Nominal
Exchange
Rate
(U.S/Cdn)
U.S. M&As in Canada U.S. Greenfield Investments Canada3
Total Transactions
Number Value2
Transactions > 100M
Number Value2
Transactions > 1000M
Number Value2
Number Value2
1985 0.7323 208 6,086,041 7 4,209,099 1 C 139 230,789
1986 0.7196 412 10,396,612 18 6,938,278 0 C 213 424,484
1987 0.7541 433 17,659,991 20 13,360,664 2 C 163 201,501
1988 0.8125 359 5,439,512 11 211,6843 0 C 152 390,443
1989 0.8446 398 12,855,391 14 9,767,383 2 C 127 285,529
1990 0.8570 345 5,515,546 8 3,106,014 1 C 124 240,140
1991 0.8728 368 3,241,699 5 1,248,111 0 C 114 179,408
1992 0.8273 282 6,178,111 10 4,013,924 1 C 73 1,464,925
1993 0.7751 228 3,743,365 7 2,099,607 0 C 99 1,294,313
1994 0.7322 260 5,310,870 7 2,861,008 0 C 74 560,196
1995 0.7286 326 8,740,581 17 6,033,314 0 C 74 456,880
1996 0.7334 458 9,765,657 26 5,840,992 0 C 83 256,807
1997 0.7222 327 11,281,140 25 8,143,760 2 C 45 336,522
1998 0.6741 548 18,333,127 31 13,125,862 4 7,38,5856 88 558,902
1999 0.6730 519 26,747,290 47 21,955,195 4 11,662,314 72 331,388
2000 0.6733 478 24,060,046 42 19,525,766 6 10,027,668 59 467,494
2001 0.6456 352 39,656,830 49 36,120,052 10 26,684,663 62 192,949C: Confidential;1 The Investment Review Division defines a foreign acquisition to be a transaction at least 50% of the firm’s assets or voting shares are acquired.2 $000 Cdn, deflated by the Consumer Price Index 3 Over the full period, only 12 transactions had a value greater than $100 million. Investment Review Division, Industry Canada
31
Table 2. Total Number of U.S. Mergers and Acquisitions by Industry (1985-2001)
SIC code U.S. M&As Descriptor Establishments1990 2001
5111 185 petroleum products, wholesale 1728 28355743 151 electrical machinery, equipment and supplies 1012 25963199 116 other machinery and equipment industries n.e.c. 472 18997799 109 other business services n.e.c. 6414 114235793 90 professional machinery, equipment and supplies, wholesale 760 20645731 85 industrial machinery, equipment and supplies, wholesale 1683 55144999 77 other utility industries 699 19551699 67 other plastic products industries n.e.c. 343 15423192 67 construction and mining machinery and materials handling equip. industry 208 11407512 67 operators of non-residential buildings 3177 98755971 62 industrial and household chemicals, wholesale 543 14149911 59 industrial machinery and equipment rental and leasing 584 16535791 58 office and store machinery, equipment and supplies, wholesale 989 24883359 56 other communication and electronic equipment industries 154 4043259 54 other motor vehicle accessories, parts and assemblies industries 59 3407791 52 security and investigation services 488 21167771 51 management consulting services 10738 252713799 46 other chemical products industries n.e.c. 136 4783999 46 other manufactured products industries 1073 24485622 45 plumbing, heating and air cond. equip. and supplies, wholesale 631 17469731 45 funeral homes 277 13057752 41 offices of engineers 3449 106533912 40 other instruments and related products industry 148 6057792 40 credit bureau services 48 1059921 39 automobile and truck rental and leasing services 912 19955722 36 mining machinery, equipment and supplies, wholesale 263 9315529 35 other motor vehicle parts and accessories, wholesale 1054 3374
919 34 other service industries incidental to crude petroleum and natural gas 719 36033352 34 electronic parts and components industry 173 5795219 33 other foods wholesale 867 29362819 32 other commercial printing industries 2225 42276599 32 other retail stores n.e.c. 2380 43609999 32 other services n.e.c. 3078 38573255 30 motor vehicle wheel and brake industry 11 805621 30 hardware, wholesale 633 1737
Note: Focusing on industries for which acquisitions occurred, the mean, standard deviation and variance was 10, 18.4 and 342.2 respectively.Across all industries, the mean, standard deviation, and variance was 4.4, 13.1, and 170.1 respectively. The average number ofestablishments in 1990 and 2001 was 512 and 1,204 respectively.Source: Investment Review, Industry Canada; Canadian Business Patterns, Statistics Canada.
32
Table 3. Determinants of Number of U.S. Mergers and Acquisitions in Canada, 1985-2001, Random and FixedEffects Negative Binomial Model
Dependent Variable: Number of U.S. Mergers and Acquisitions in Canada, 1985-2001
VariablesRandom Effects Fixed Effects
rer (real exchange rate)
tariff( average tariff rate on U.S.imports)
USgrowth (growth rate of U.S. real GDP)
USshare (value added of U.S. industry)
CDNM&As (number of Canadian M&As)
CDNestab (number of establishments)
constant
0.489 (0.045)
1.86 (0.022)
0.053 (0.002)
0.039 (0.383)
0.022 (0.001)
0.0001(0.002)
0.358(0.003)
0.508(0.038)
1.88(0.021)
0.052(0.002)
-
0.023(0.001)
0.0001(0.001)
0.405(0.001)
0.654 (0.008)
3.23 (0.001)
0.050 (0.004)
-0.033 (0.494)
0.023 (0.001)
0.0001(0.009)
0.402(0.002)
0.638(0.009)
3.20(0.001)
0.050(0.00)
-
0.023(0.001)
0.0001(0.01)
0.358(0.001)
Hausman test 1
Likelihood ratio test 2
Observations
41.77*3740**12172
22.16*3761**12172 6800 6800
Note: The p-values are in parenthesis1 Hausman (1978) test, where the null hypothesis is no correlation between the industry specific events and the regressors; * rejection of the
null hypothesis2 The likelihood ratio test compares the panel or RE Negbin estimator with the pooled or Negbin estimator. ** Likelihood ratio test has a p-value less than 0.001, rejecting the Negbin estimator model in favour of RE Negbin estimator
33
Table 4. Determinants of Number of U.S. Mergers and Acquisitions in Canada for High R&D Industries inCanada,3 1985-2001, Random and Fixed Effects Negative Binomial Model
Dependent Variable: Number of U.S. Mergers and Acquisitions in Canada, 1985-2001
VariablesRandom Effects Fixed Effects
rer (real exchange rate)
tariff(average tariff rate on U.S.imports)
USgrowth (growth rate of U.S. real GDP)
USshare (value added of U.S. industry)
CDNM&As (number of Canadian M&As)
CDNestab (number of establishments)
constant
0.884 (0.048)
1.05 (0.498)
0.042 (0.170)
0.061 (0.469)
0.013 (0.096)
0.0001(0.032)
0.544(0.025)
0.985(0.021)
1.17(0.448)
0.041(0.186)
-
0.015(0.060)
0.0001(0.004)
0.615(0.006)
1.028(0.007)
-
-
-
0.014(0.082)
0.0001(0.002)
0.742(0.001)
0.879 (0.059)
1.07 (0.506)
0.042 (0.164)
0.098 (0.347)
0.011 (0.169)
0.0001(0.101)
0.544(0.025)
1.05(0.015)
1.36(0.388)
0.040(0.188)
-
0.014(0.088)
0.0001(0.012)
0.588(0.008)
1.21(0.001)
-
-
-
-
0.0001(0.001)
0.684(0.001)
Hausman test 1
Likelihood ratio test 2
Observations
2.14698 **1785
1.46699**1785
698**1785 1428 1428 1428
Note: The p-values are in parenthesis1 Hausman (1978) test, where the null hypothesis is no correlation between the industry specific events and the regressors ; * rejection of the
null hypothesis2 The likelihood ratio test compares the panel or RE Negbin estimator with the pooled or Negbin estimator.** Likelihood ratio test has a p-value less than 0.001, rejecting the Negbin estimator model in favour of RE Negbin estimator 3 4-digit industries in the following 2-digit groups: 29-Primary Metal Industries, 31- Machinery Industries , 32-Transportation Equipment Industries , 33-Electrical and Electronic Products Industries , 36-Refined Petroleum and Coal ProductsIndustries , 37-Chemical and Chemical Products Industries , 39-Other Manufacturing Industries, 77-Business Service Industries
34
Table 5. Determinants of Number of U.S. Mergers and Acquisitions in Canada for Low R&D Industries inCanada,3 1985-2001, Random and Fixed Effects Negative Binomial Model
Dependent Variable: Number of U.S. Mergers and Acquisitions in Canada, 1985-2001
VariablesRandom Effects Fixed Effects
rer (real exchange rate)
tariff(average tariff rate on U.S.imports)
USgrowth (growth rate of U.S. real GDP)
USshare (value added of U.S. industry)
CDNM&As (number of Canadian M&As)
CDNestab (number of establishments)
constant
0.269 (0.370)
2.01 (0.040)
0.058 (0.005)
-0.049 (0.249)
0.031 (0.001)
0.0001(0.179)
0.407(0.003)
0.280(0.349)
2.02(0.038)
0.059(0.005)
-
0.029(0.001)
0.0001(0.146)
0.343(0.007)
-
1.79(0.054)
0.069(0.001)
-
0.379(0.001)
-
0396(0.001)
0.449 (0.136)
4.01 (0.001)
0.055 (0.008)
-0.111 (0.012)
0.034 (0.001)
0.0001(0.698)
0.449(0.002)
0.467 (0.117)
4.02 (0.001)
0.056 (0.007)
-0.112 (0.010)
0.036 (0.001)
-
0.450(0.002)
-
3.61(0.001)
0.068(0.001)
-0.113(0.008)
0.037(0.001)
-
0.541(0.001)
Hausman test1 Likelihood ratio test 2
Observations
51.87*28187 **
103872820**10387
2848**10387 5372 5372 5372
Note: The p-values are in parenthesis1 Hausman (1978) test, where the null hypothesis is no correlation between the industry specific events and the regressors ; * rejection of the
null hypothesis2 The likelihood ratio test compares the panel or RE Negbin estimator with the pooled or Negbin estimator.*** Likelihood ratio test has a p-value less than 0.001, rejecting the Negbin estimator model in favour of RE Negbin estimator 3 All industries less high R&D industries (see footnote 3 in Table 4 for the high R&D industries)
35
Table 6. Determinants of Number of U.S. Mergers and Acquisitions in Canada, 1985-2001, Random and FixedEffects Negative Binomial Model , Dummy Variables
Dependent Variable: Number of U.S. Mergers and Acquisitions in Canada, 1985-2001
VariablesRandom Effects Fixed Effects
rer (real exchange rate)
tariff( average tariff rate on U.S.imports)
Usgrowth (growth rate of U.S. real GDP)
USshare (value added of U.S. industry)
CDNM&As (number of Canadian M&As)
CDNestab (number of establishments)
constant
dummy
rerdummy
0.265 (0.360)
1.672(0.036)
0.053 (0.002)
-0.022 (0.578)
0.022 (0.001)
0.0002(0.002)
0.321(0.014)
0.561(0.233)
0.743(0.030)
0.387 (0.182)
3.256(0.001)
0.051(0.003)
-0.072 (0.097)
0.022(0.001)
0.0002(0.013)
0.417(0.003)
0.188(0.429)
0.897(0.054)
Hausman test 1
LR Test 2
Number of Observations
34.47*
121728.32*6800
Note: The p-values are in parenthesis1 Hausman (1978) test, where the null hypothesis is no correlation between the industry specific events and the regressors; * rejection of the
null hypothesis2 Likelihood ratio test where the null hypothesis is that the coefficients on the dummy variables are zero. * rejection of the null hypothesis
36
Prob(yit) '( e &λit λyitit )/yit ! (1)
λit ' exp(Xitβ)
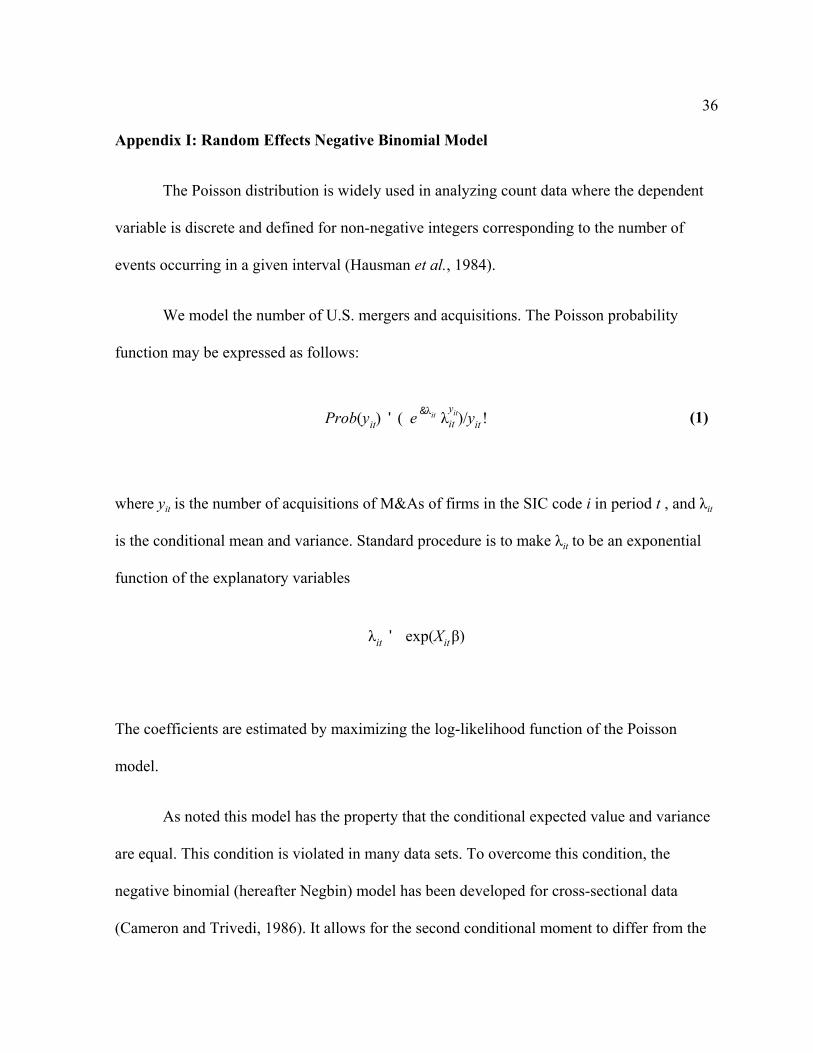
Appendix I: Random Effects Negative Binomial Model
The Poisson distribution is widely used in analyzing count data where the dependent
variable is discrete and defined for non-negative integers corresponding to the number of
events occurring in a given interval (Hausman et al., 1984).
We model the number of U.S. mergers and acquisitions. The Poisson probability
function may be expressed as follows:
where yit is the number of acquisitions of M&As of firms in the SIC code i in period t , and λit
is the conditional mean and variance. Standard procedure is to make λit to be an exponential
function of the explanatory variables
The coefficients are estimated by maximizing the log-likelihood function of the Poisson
model.
As noted this model has the property that the conditional expected value and variance
are equal. This condition is violated in many data sets. To overcome this condition, the
negative binomial (hereafter Negbin) model has been developed for cross-sectional data
(Cameron and Trivedi, 1986). It allows for the second conditional moment to differ from the
37
18 Hausman et al. (1984) state that the RE Negbin model yields asymptotically more efficient estimatorsthan their fixed effects model. For these results to be consistent, the industry-specific effects need to be uncorrelatedwith the regressors.
λit ' exp(Xitβ % git )
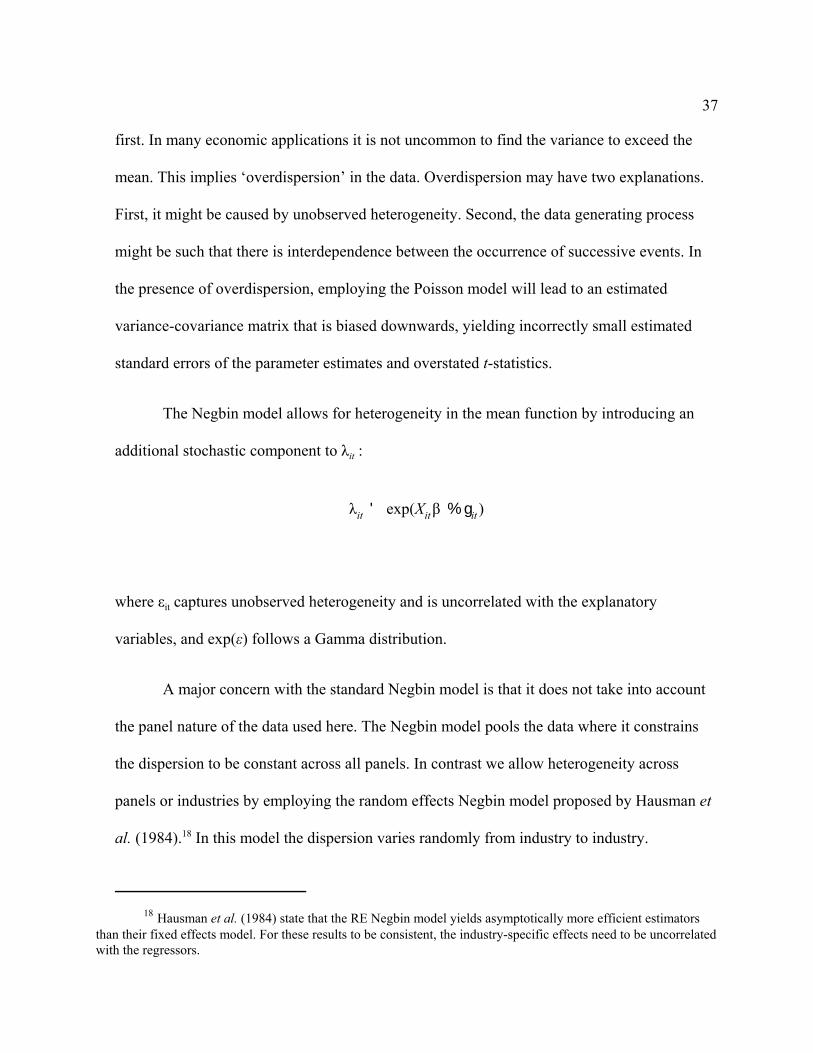
first. In many economic applications it is not uncommon to find the variance to exceed the
mean. This implies ‘overdispersion’ in the data. Overdispersion may have two explanations.
First, it might be caused by unobserved heterogeneity. Second, the data generating process
might be such that there is interdependence between the occurrence of successive events. In
the presence of overdispersion, employing the Poisson model will lead to an estimated
variance-covariance matrix that is biased downwards, yielding incorrectly small estimated
standard errors of the parameter estimates and overstated t-statistics.
The Negbin model allows for heterogeneity in the mean function by introducing an
additional stochastic component to λit :
where εit captures unobserved heterogeneity and is uncorrelated with the explanatory
variables, and exp(ε) follows a Gamma distribution.
A major concern with the standard Negbin model is that it does not take into account
the panel nature of the data used here. The Negbin model pools the data where it constrains
the dispersion to be constant across all panels. In contrast we allow heterogeneity across
panels or industries by employing the random effects Negbin model proposed by Hausman et
al. (1984).18 In this model the dispersion varies randomly from industry to industry.
38
19 The Beta distribution will be symmetric if a = b , and can be U-shaped or hump-shaped.
Specifically, the Poisson parameter λit follows a gamma distribution with parameters (γ , δ).
For the variation across industries, we allow each industry i to have its own δi such that
1/(1+δi) is distributed as a Beta random variable with the shape parameters (a, b).19 For any
industry i, the dispersion (variance divided by mean) is equal to 1+ δi . As is standard, we set
γit = exp(Xit β). We also present Hausman test results and fixed effects results.
39
Appendix II: Data Sources
USM&Asit : U.S. mergers and acquisitions with and of Canadian businesses. The source for
this data is the Investment Review Division, Industry Canada. The data record the
transactions involving U.S.-owned businesses merging or acquiring Canadian-owned business
in Canada. According to the Investment Canada Act, section 26, a merger or acquisition
relates to a change in control, where control is defined as acquiring at least 51% of common
voting stocks or assets.
The act requires every non-Canadian to file a Notification or an Application for
Review with Investment Review, Industry Canada, each time a non-Canadian plans to or
actually commences a new business activity in Canada (greenfield investment) or acquires a
Canadian business. Review Applications are necessary for relatively large transactions
(excess of $218 million for WTO members and $5 million for non-WTO members), where the
Minister of Finance determines whether the investment is permitted. Authorities at
Investment Review contact the potential investors within a specified period after the
submission of forms to determine whether the transaction was implemented. The recorded
acquisition data reflects those applications where the investment was actually carried out. All
the notifications are recorded in the data, but there is no follow up process of the
notifications; there may thus be an upward bias on the number of investments in this category.
However authorities at Investment Review estimate that the vast majority of Notifications are
submitted after the investment has taken place.
40
The data does not distinguish between mergers and acquisitions.
rerit : the Canada-U.S. real exchange rate at the 2-digit SIC level. The nominal exchange rate
data e is from CANSIM I and are annual averages. The 2-digit U.S. industry price data are
from the Bureau of Labour Statistics, Industry Prices. The Canadian prices are from CANSIM
I, Industrial Product Indices.
tariffit: is the effective tariff rate at the 4-digit SIC level. This is equal to the ratio of the value
duties collected on U.S. imports at the 4-digit SIC level to the value of U.S. imports at the 4-
digit SIC level. The source is the International Trade Division, Statistics Canada
Usgrowtht : growth rate of U.S. real GDP, CITIBASE.
Usshareit : share of value added of U.S. industry i at the 2-digit SIC level, which was
constructed using the share of GDP of industry i to total GDP. U.S. Bureau of Economic
Analysis, GDP by Industry.
CDNestabit : the number of Canadian establishment at the 4-digit SIC level. Canadian
Business Patterns, Statistics Canada.
CDNM&Asit: Canadian mergers and acquisitions with and of Canadian businesses. Thomson
Financial Securities Data Company (SDC Platinum Database). These data conform to the
Investment Review definition of control (51% of control over common voting shares or
assets). Unlike the Investment Review data, the data is based on published sources recording
announced investments. Given the press coverage focuses only on large transactions, the data
may not capture all mergers and acquisitions in Canada.