March 11, 2009 / NIH Office of the CIO NIH Operational Analysis Management Framework Presentation to...
37
March 11, 2009 / NIH Office of the CIO NIH Operational Analysis Management Framework Presentation to PMCoE Wednesday, March 11, 2009 Wednesday, March 11, 2009 Stan Maoury, PMP Project Manager, ICF International Debbie Sinmao Project Manager, ICF International
-
Upload
justin-green -
Category
Documents
-
view
218 -
download
0
Transcript of March 11, 2009 / NIH Office of the CIO NIH Operational Analysis Management Framework Presentation to...

March 11, 2009 / NIH Office of the CIO
NIH Operational Analysis Management FrameworkPresentation to PMCoE
Wednesday, March 11, 2009Wednesday, March 11, 2009
Stan Maoury, PMPProject Manager, ICF International
Debbie SinmaoProject Manager, ICF International

2February 12, 2009/Office of the NIH CIO
Background
NIH has implemented various investment management best practices to control risk and align investments with mission priorities. However . . . • Focus is usually on development activities (~only 20% of life
cycle costs)
• Execution can be inconsistent and vary by project Governance reporting focuses on cost vice value Inconsistent visibility into system performance Decisions are sometimes made without data on realized performance Processes are loosely coupled (e.g., data calls and reporting)
OMB (circular A-11) and CPIC policy require that “Operational Analyses” be performed to ensure steady-state systems continue to align with mission priorities and deliver services at required service levels, a reasonable cost, and appropriate levels of risk.

3February 12, 2009/Office of the NIH CIO
Background (Cont’d)
»In 2008, the NIH OCIO commissioned a project to develop an Operational Analysis management framework that will help to objectively measure and consistently report system performance across NIH’s steady-state IT systems.
»OperationalAnalyses areperformed duringthe O&M phaseof the HHS EPLC• Measures
performance ofthe product ofthe project
Program Goals & Objectives
HHS IT Portfolio
Inte
gra
tio
n
Solution Architecture Development OperationsSolution Development Retirement
C&A Maintenance
Select / Reselect EvaluateControl
Security Testing, C&ASecurity Planning
EA
Security
CPIC
EPLC
StageGates
2 3
Preliminary Design Review
3
Preliminary Design Review
1
Selection Review
1
Selection Review
Baseline Review
4
Operational Readiness Review
4
Operational Readiness Review
Preliminary MaintenanceAcquisition DevelopmentACQ
IT Governance Organization Led
Can be delegated
IT Governance Organization Led
Can be delegated
The EPLC will evolve to include Other Critical Partner / Stakeholder Functions
PlanningRequirements
AnalysisDesign TestDevelopment Implementation
Operations & Maintenance
DispositionConceptInitiation
Target performance levels

4February 12, 2009/Office of the NIH CIO
Agenda
»Operational Analysis • What is it?• Why are we doing it?• How are we doing it?
»The NIH Operational Analysis Management Framework• Performance Component• Process Component• Tools Component
»Current Activities & Next Steps
»Q&A* Back-up slides provide more framework details

March 11, 2009 / NIH Office of the CIO
Operational AnalysisWhat is it?What is it?

6February 12, 2009/Office of the NIH CIO
Operational Analysis . . . What is it?
»OMB defines Operational Analysis as:A method of examining the ongoing performance of an operating asset investment and measuring that performance against an established set of cost, schedule, and performance goals
- OMB, Capital Programming Guide, V2.0, Supplement to OMB Circular A-11, Part 7: Planning, Budgeting, and Acquisition of Capital Assets, p. 54.
»In lay terms . . . a method for measuring and monitoring the ongoing performance ofan IT system in production(i.e., a steady-statesystem, or steady-statecomponent of amixed lifecyclesystem).
SelectHow do you
know you have selected the best
projects?
ControlWhat are you doing to ensure that the
projects will deliver the benefits projected?
EvaluateBased on your evaluation, did
the system deliverthe expected
benefits?
SelectHow do you
know you have selected the best
projects?
SelectHow do you
know you have selected the best
projects?
ControlWhat are you doing to ensure that the
projects will deliver the benefits projected?
ControlWhat are you doing to ensure that the
projects will deliver the benefits projected?
EvaluateBased on your evaluation, did
the system deliverthe expected
benefits?
EvaluateBased on your evaluation, did
the system deliverthe expected
benefits?
SelectHow do you
know you have selected the best
projects?
ControlWhat are you doing to ensure that the
projects will deliver the benefits projected?
EvaluateBased on your evaluation, did
the system deliverthe expected
benefits?
SelectHow do you
know you have selected the best
projects?
SelectHow do you
know you have selected the best
projects?
ControlWhat are you doing to ensure that the
projects will deliver the benefits projected?
ControlWhat are you doing to ensure that the
projects will deliver the benefits projected?
EvaluateBased on your evaluation, did
the system deliverthe expected
benefits?
EvaluateBased on your evaluation, did
the system deliverthe expected
benefits?
Steady State
System
Performance
7February 12, 2009/Office of the NIH CIO
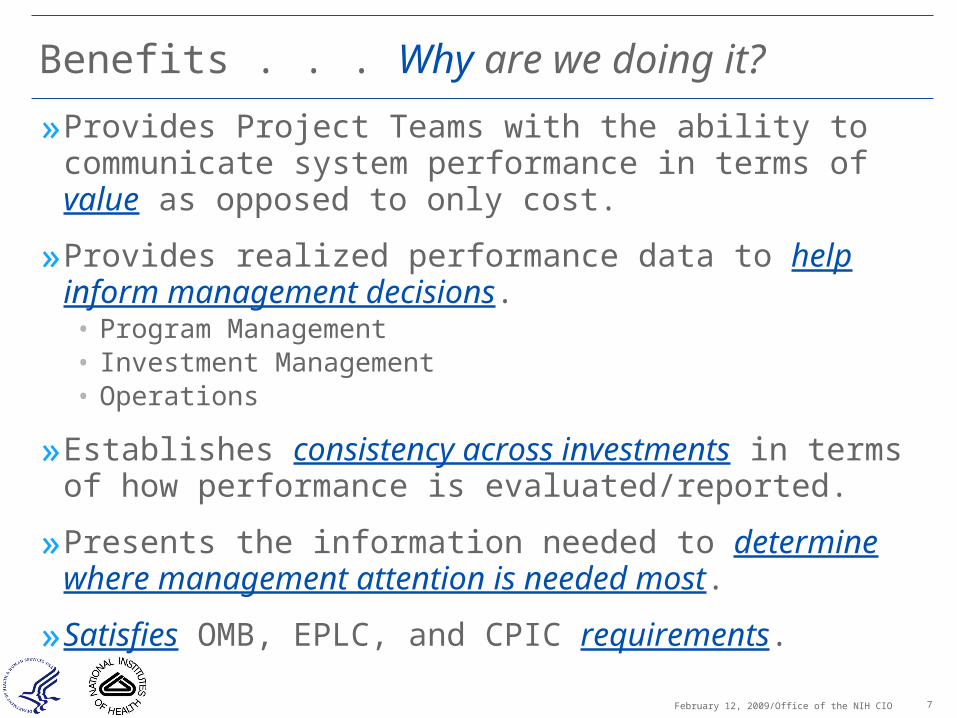
Benefits . . . Why are we doing it?
»Provides Project Teams with the ability to communicate system performance in terms of value as opposed to only cost.
»Provides realized performance data to help inform management decisions.• Program Management• Investment Management• Operations
»Establishes consistency across investments in terms of how performance is evaluated/reported.
»Presents the information needed to determine where management attention is needed most.
»Satisfies OMB, EPLC, and CPIC requirements.

8February 12, 2009/Office of the NIH CIO
NIH Operational Analysis Management Framework . . . How are we doing it?»A community approach
Baseline Assessment
Understand current NIH methodology for measuring and reporting steady-state
enterprise IT system performance
Baseline Assessment
Understand current NIH methodology for measuring and reporting steady-state
enterprise IT system performance
Comprehension ofoperational baselinefrom which the OAwill be developed
Comprehension ofoperational baselinefrom which the OAwill be developed
•Define requirements
•Leverage existing practices &
mechanisms
Framework DevelopmentDesign and document
(implementation level of detail) the Operational Analysis management framework
Framework DevelopmentDesign and document
(implementation level of detail) the Operational Analysis management framework
•Engage stakeholders in developing the
framework
Framework Implementation &
ExecutionImplement and execute the
Operational Analysis processes and tools
Framework Implementation &
ExecutionImplement and execute the
Operational Analysis processes and tools Working Operational
Analysis processes and procedures
Working Operational Analysis processes and procedures
Working Operational Analysis processes and procedures
NIH Operational Analysis Management frameworkNIH Operational Analysis Management framework
•Develop checklists & templates
•Train processes •Perform Operational
Analyses
WE ARE HERE
March 11, 2009 / NIH Office of the CIO
The NIH Operational Analysis Management Framework

10February 12, 2009/Office of the NIH CIO
NIH Operational Analysis Management Framework . . . How are we doing it? (Cont’d)»The NIH Operational Analysis Management
FrameworkPERFORMANCE PERFORMANCE . . . What?. . . What?PERFORMANCE PERFORMANCE . . . What?. . . What?
Defines performance reporting information requirements• What do decision makers want to know about a system’s performance?• What are the metrics that reflect this performance?• What data do we need to collect to calculate these metrics?• Where are that data generated?
TOOLS TOOLS . . . With What?. . . With What?TOOLS TOOLS . . . With What?. . . With What?
Facilitate process execution and ensure process & reporting consistency
PROCESS PROCESS . . . How?. . . How?PROCESS PROCESS . . . How?. . . How?Directs how information will be collected, analyzed, & reported, and who is involved
• How do we perform an Operational Analysis? What are the steps?• What stakeholders are involved? What is each one’s responsibility?• What tools can / are needed to facilitate the process(es)?
Ob
jecti
ve,
acti
on
ab
le in
form
ati
on

11February 12, 2009/Office of the NIH CIO
Operational Analysis Management FrameworkPerformance Component: Structure» The Performance Component is comprised of four
Performance Dimensions (Stakeholder Satisfaction, Value/Contribution, Financial Performance, Investment Health)• Each dimension consists of two
or more Measurement Areas
• Each measurement area consistsof three or more PerformanceMetrics
Performance Dimension
A class of metrics that identifies a specific aspect of performance
Performance Dimension
Measurement Areas
Performance Metrics
Has
Has
Measurement Area
A group of like metrics within a dimension that focuses attention upon relevant groupings of performance metrics
Performance Metric
A measurable element that quantifies the degree to which an activity or event is performed

12February 12, 2009/Office of the NIH CIO
Operational Analysis Management FrameworkPerformance Component: 4 Dimensions of Performance
Dimension OMB A-11 Alignment
Exhibit 300 Alignment
Stakeholder Satisfaction Measures user perceptions of how well the system delivers the products or services it was designed to deliver. OMB requires satisfaction surveys be administered on an annual basis, as defined in Circular A-11.
Customer Satisfaction
Customer Results
Value / Contribution Measures the impact the system has on NIH itself, and how well it contributes to achieving NIH’s strategic objectives. Provides a gauge of how well the investment meets business needs and contributes to the achievement of NIH goals.
Strategic and Business Results
Mission & Business Results; Processes & Activities
Financial Performance Compares current financial performance with a pre-established cost baseline and other economic indicators, and reviews the system for cost in terms of planned expenditures.
Financial Performance
N/A
Investment Health Provides an overall objective qualitative assessment of the system’s ongoing value and stability in terms of its strategic and operational fit, technical sustainability, scalability and risk.
Innovation Technology

13February 12, 2009/Office of the NIH CIO
Operational Analysis Management FrameworkProcess Component
• OA Performance Results Package
• Deliver reports, recommendations, & supporting analyses to decision makers
5.0Support Decision
Making
• Documented Performance Data
• Capture & record performance data
3.0Record
Performance Data
• Baseline Measures• Target Performance Levels• What constitutes success
• Measure baseline performance levels
• Identify desired performance levels
2.0Set
Performance Targets
• Metrics• Metric Definitions• Data Source
• Identify & define performance metrics
1.0Define Performance
Metrics
• OA Report• Summary Report• Decision Recommendation• Supporting Analysis
• Collect, analyze, & report system performance
• Formulate a decision recommendation
4.0Analyze &
Report System Performance
Updates & Changes As Needed
OtherProgram
Management Areas

14February 12, 2009/Office of the NIH CIO
Operational Analysis Management FrameworkTools Component
Tool Sub-Process EnabledMetric Definition Template 1.0 Define Performance
Metrics2.0 Set Performance Targets
Satisfaction Survey Checklists 3.0 Record Performance Data
Investment Health Assessment Checklist
4.0 Analyze & Report System Performance
Operational Analysis Report Template
4.0 Analyze & Report System Performance
Operational Analysis Summary Report Template
4.0 Analyze & Report System Performance
Operational Analysis Performance Results Package Checklist
5.0 Support Decision Making

March 11, 2009 / NIH Office of the CIO
Current Activities & Next Steps

16February 12, 2009/Office of the NIH CIO
Operational Analysis Management FrameworkCurrent Activities & Next Steps»Finalize Tools
• Conduct prototype tryouts Investment Health Assessment Checklist Operational Analysis Report Template Operational Analysis Summary Report Template
»Deliver Training• Enterprise IT System Project Management Teams
Three dates will be available: April 30, May 8• Morning session will focus on performing the analysis• Afternoon session will focus on utilizing tools• Registration to begin in mid March
• Additional training will be available NIH-wide following Enterprise IT System PM Team training

17February 12, 2009/Office of the NIH CIO
Operational Analysis Management FrameworkCurrent Activities & Next Steps (Cont’d)»Begin Implementation/Execution
• In accordance with OMB requirements and HHS EPLC guidance, all steady-state systems are to perform an Operational Analysis on an annual basis
• NIH “enterprise IT Systems” are being
»Maintain the framework• Revaluate metric usage• Implement process enhancements

18February 12, 2009/Office of the NIH CIO
Open Discussion
»Q&A
»Contact Information• NIH Office of the CIO
Carmen Cheng, NIH, OD, OCIO ([email protected]) Jane Small, NIH, OD, OCIO ([email protected])
• ICF International Stan Maoury ([email protected]) Debbie Sinmao ([email protected]) Adrienne Lalle ([email protected])

March 11, 2009 / NIH Office of the CIO
Back-up Slides4 Dimensions of Performance4 Dimensions of Performance
Stakeholder SatisfactionStakeholder SatisfactionValue/ContributionValue/ContributionFinancial PerformanceFinancial PerformanceInvestment HealthInvestment Health
4 Dimensions of Performance4 Dimensions of PerformanceStakeholder SatisfactionStakeholder SatisfactionValue/ContributionValue/ContributionFinancial PerformanceFinancial PerformanceInvestment HealthInvestment Health

20February 12, 2009/Office of the NIH CIO
Operational Analysis Management FrameworkPerformance Component: Stakeholder Satisfaction Dimension»User and Business Owner Satisfaction
• Captures how well a system is perceived to be serving line of business objectives, processes, and outcomes
»Technical and Administrative Satisfaction• Captures an understanding of the relative ease or burden
associated with maintaining a system over time• Provides an indicator for whether technical aspects of the
system are impacting overall cost and/or risk
21February 12, 2009/Office of the NIH CIO
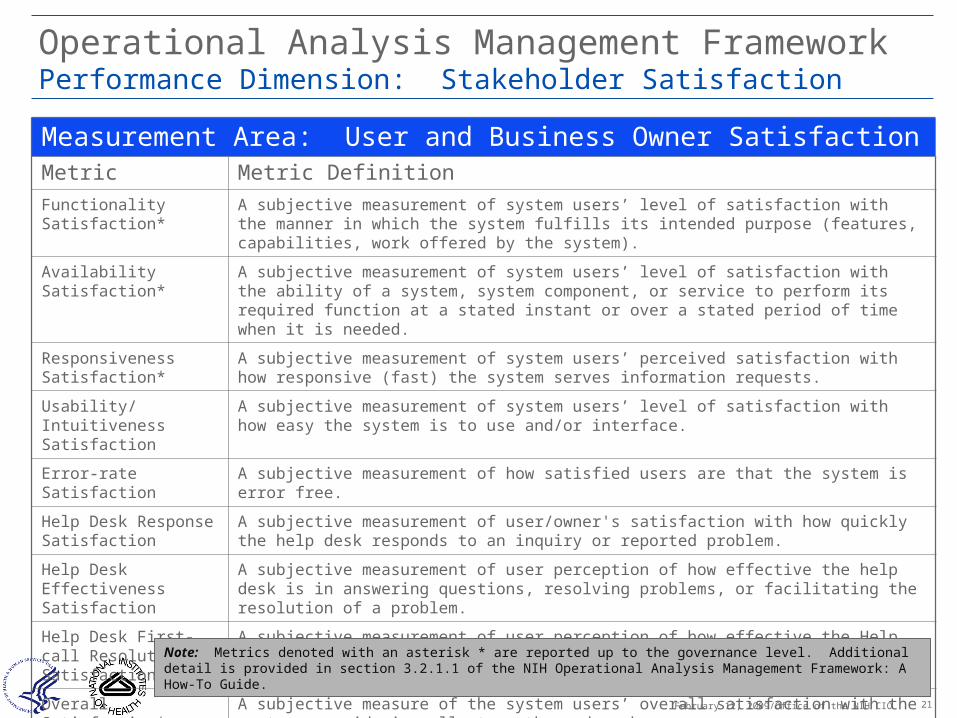
Operational Analysis Management FrameworkPerformance Dimension: Stakeholder Satisfaction
Measurement Area: User and Business Owner SatisfactionMetric Metric DefinitionFunctionality Satisfaction*
A subjective measurement of system users’ level of satisfaction with the manner in which the system fulfills its intended purpose (features, capabilities, work offered by the system).
Availability Satisfaction* A subjective measurement of system users’ level of satisfaction with the ability of a system, system component, or service to perform its required function at a stated instant or over a stated period of time when it is needed.
Responsiveness Satisfaction*
A subjective measurement of system users’ perceived satisfaction with how responsive (fast) the system serves information requests.
Usability/Intuitiveness Satisfaction
A subjective measurement of system users’ level of satisfaction with how easy the system is to use and/or interface.
Error-rate Satisfaction A subjective measurement of how satisfied users are that the system is error free.
Help Desk Response Satisfaction
A subjective measurement of user/owner's satisfaction with how quickly the help desk responds to an inquiry or reported problem.
Help Desk Effectiveness Satisfaction
A subjective measurement of user perception of how effective the help desk is in answering questions, resolving problems, or facilitating the resolution of a problem.
Help Desk First-call Resolution Satisfaction
A subjective measurement of user perception of how effective the Help Desk is in resolving issues on the first call.
Overall Satisfaction* A subjective measure of the system users’ overall satisfaction with the system, considering all strengths and weaknesses.
Note: Metrics denoted with an asterisk * are reported up to the governance level. Additional detail is provided in section 3.2.1.1 of the NIH Operational Analysis Management Framework: A How-To Guide.

22February 12, 2009/Office of the NIH CIO
Operational Analysis Management Framework:Performance Dimension: Stakeholder Satisfaction (cont’d)
Measurement Area: Technical and Administrative Stakeholder SatisfactionMetric DefinitionSoftware Maintenance Burden Satisfaction
A subjective measurement of System Administrators'/Technical Support Staff's level of perceived burden associated with performing software maintenance or upgrade activities.
Hardware Maintenance Burden Satisfaction
A subjective measurement of System Administrators'/Technical Support Staff's level of perceived burden associated with performing hardware maintenance or upgrade activities.
Security Compliance Satisfaction
A subjective measurement of System Administrators'/Technical Support Staff's level of satisfaction with the system's adherence to Federal, HHS, and NIH security requirements.
Service Level Agreement/ Service Level Commitment Satisfaction
A subjective measurement of System Administrators'/Technical Support Staff's level of satisfaction with the written agreements/ commitments between the service provider and Customer(s) that document agreed service levels.
Technical Currency Satisfaction
A subjective measurement of System Administrators’/Technical Support Staff’s level of satisfaction with the currency of the system’s technical components.
Note: Additional detail is provided in sections section 3.2.1.2 of the NIH Operational Analysis Management Framework.

23February 12, 2009/Office of the NIH CIO
Operational Analysis Management FrameworkPerformance Component: Value/Contribution Dimension
» Strategic• Defines metrics that characterize the system’s alignment with NIH’s strategic
direction, goals, and objectives
» Workload• Focuses upon the work that a system performs; demonstrates system-specific
results as well as environmental aspects of performance
» Incident Management• Focuses upon metrics that indicate the ability of the system’s support
organization to address reports of system failure and to restore normal service
» Problem Management• Focuses upon metrics that characterize the ability of support organizations to
eliminate root causes of reported Incidents
» Service Level Management• Focuses upon metrics that indicate the system’s operational adherence to
established service levels and pre-established agreements or commitments with business owners
» Availability Management• Focuses upon metrics that indicate the ongoing availability of the system to
business users

24February 12, 2009/Office of the NIH CIO
Operational Analysis Management FrameworkPerformance Dimension: Value/Contribution
Measurement Area: StrategicMetric Definition
Strategic Alignment/Purpose* A measurement of the degree to which the system aligns with, supports, or contributes to achieving a stated strategic goal.
Contribution to Strategic Objectives*
A measurement of the degree to which the system supports, or contributes to, a stated objective. Objectives are actionable and quantifiable targets whose achievement supports a high-level strategic goal.
Contribution to Mandates or Compliance Records*
A list of the government mandates and compliance requirements the system contributes to meeting.
Note: Metrics denoted with an asterisk * are reported up to the governance level. Additional metric information can be found in section 3.2.2.1 of the NIH Operational Analysis Management Framework: A How-To Guide.

25February 12, 2009/Office of the NIH CIO
Operational Analysis Management FrameworkPerformance Dimension: Value/Contribution (cont’d)
Measurement Area: Workload
Metric Definition
Total Business Demand*
Total number of work units required by the business units/mission areas to be performed during the measurement period (e.g. FY).
System Demand Total number of work units to be processed/produced by a system within the measurement period.
Backlog* The volume of work units that enter a system within the measurement period (e.g., year, month, etc.); however, was not processed by the system within the measurement period.
Throughput Index The ratio of Throughput to system capacity (within measurement period).
Demand Index The work demand placed upon the system compared to total work to be performed by the mission area/Program.
Workload Index The percentage of work completed by the system within the measurement period.
Number of Internal Users Served*
The number of NIH employees, contractors, and other support staff who accessed and used the system during the measurement period.
Number of External Users Served*
The number of non-NIH employees who accessed and used the system during the measurement period.
Variance from Business Case Performance Claims*
Difference between performance targets established in the Business Case vs. realized performance levels.
Note: Metrics denoted with an asterisk * are reported up to the governance level. Additional metric information can be found in section 3.2.2.2 of the NIH Operational Analysis Management Framework: A How-To Guide.

26February 12, 2009/Office of the NIH CIO
Operational Analysis Management FrameworkPerformance Dimension: Value/Contribution (cont’d)
Measurement Area: Incident ManagementMetric Definition
Percent of Incidents resolved within Target
The ratio of Incidents resolved within predefined SLA/SLC compared to the total number of Incidents that occurred during the observation period.
Mean Time to Restore (MTTR) The average time taken to restore a system back to service after an Incident occurs.
Percent of Incorrectly Assigned Incidents
The percentage of total user-initiated interactions with the help desk that were incorrectly assigned to support staff by the help desk.
Percent of Incorrectly Categorized Incidents
The percentage of Incidents that were incorrectly categorized by help desk personnel.
Percent of First Call Resolutions The percentage of Incidents that were closed as a result of only one help desk interaction.
Percent of Internally Generated Incidents (system/NOC) Resolved Before Customer Notification/ Impact
Percentage of system/internal generated Incidents resolved before customer notification/ report of disruption in functionality.
Number of Repeat Incidents The number of reoccurring Incidents.
Percent of Incidents with Non-technical Cause
The percent of total Incidents within a reporting period that were caused by non-technical errors (e.g. user errors).
Mean Incident Resolution Time The average amount of time taken to resolve an Incident.
Top 5 Incident Categories per period A list of the main categories of Incidents per month.
Note: Additional metric information can be found in section 3.2.2.3 of the NIH Operational Analysis Management Framework: A How-To Guide.

27February 12, 2009/Office of the NIH CIO
Operational Analysis Management FrameworkPerformance Dimension: Value/Contribution (cont’d)
Measurement Area: Problem Management
Metric Definition
Mean Time to ID Known Error The average time required to reach a Known Error state (where the root cause of a Problem has been diagnosed determined).
Mean Time to Resolve Known Error
The average time it takes to resolve a Known Error after its root cause was determined.
Problem Backlog Quantifies the volume of Problems that were not addressed by customer support.
Percent of Incidents Related to Known Errors
The percentage of Incidents solved which were related to Known Errors in Known Error Database.
Percent of Requests for Change (RFC) raised by Problem Management
The percentage of total RFCs that were initiated to resolve a Problem or Known Error. An RFC is a form, or screen, used to record details of a request for a change to any configuration item within an infrastructure or to procedures and items associated with the infrastructure.
Percent of Incidents Linked to Problems
Percentage of Incidents that were escalated to Problem Management.
Note: Additional metric information can be found in section 3.2.2.4 of the NIH Operational Analysis Management Framework: A How-To Guide.
28February 12, 2009/Office of the NIH CIO
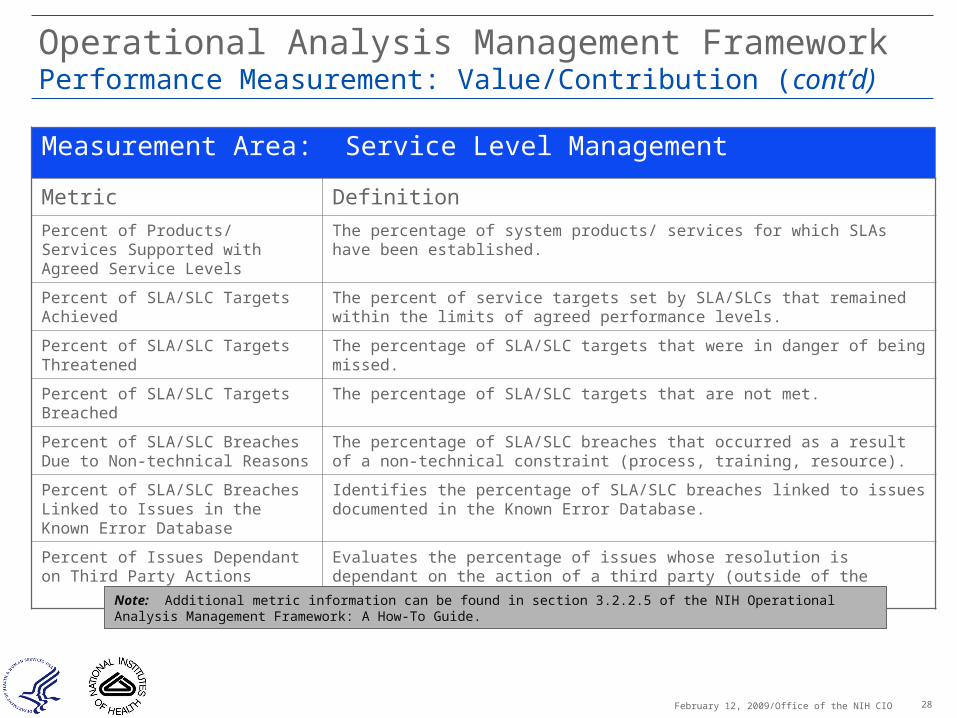
Operational Analysis Management FrameworkPerformance Measurement: Value/Contribution (cont’d)
Measurement Area: Service Level Management
Metric Definition
Percent of Products/ Services Supported with Agreed Service Levels
The percentage of system products/ services for which SLAs have been established.
Percent of SLA/SLC Targets Achieved
The percent of service targets set by SLA/SLCs that remained within the limits of agreed performance levels.
Percent of SLA/SLC Targets Threatened
The percentage of SLA/SLC targets that were in danger of being missed.
Percent of SLA/SLC Targets Breached
The percentage of SLA/SLC targets that are not met.
Percent of SLA/SLC Breaches Due to Non-technical Reasons
The percentage of SLA/SLC breaches that occurred as a result of a non-technical constraint (process, training, resource).
Percent of SLA/SLC Breaches Linked to Issues in the Known Error Database
Identifies the percentage of SLA/SLC breaches linked to issues documented in the Known Error Database.
Percent of Issues Dependant on Third Party Actions
Evaluates the percentage of issues whose resolution is dependant on the action of a third party (outside of the Project Team).
Note: Additional metric information can be found in section 3.2.2.5 of the NIH Operational Analysis Management Framework: A How-To Guide.

29February 12, 2009/Office of the NIH CIO
Operational Analysis Management FrameworkPerformance Measurement: Value/Contribution (cont’d)
Measurement Area: Availability Management
Metric Definition
Service Downtime The total amount of time service is degraded or unavailable during the performance measurement period.
Downtime of a Component The total amount of time a service component is not operational during the performance measurement period.
Mean Incident Detection and Recording Time
The average time it takes to record an Incident from the time the Incident was detected.
Mean Incident Response Time The average time it takes to respond to an Incident from the time it was first recorded.
Third Party Services Downtime The total amount of time third party services are not available during the performance measurement period.
Third Party Components Downtime
The total amount of time third party provided components are not operational during the performance measurement period.
Note: Additional metric information can be found in section 3.2.2.6 of the NIH Operational Analysis Management Framework: A How-To Guide.

30February 12, 2009/Office of the NIH CIO
Operational Analysis Management FrameworkPerformance Component: Financial Performance Dimension»Quantitative
• Measures O&M budget levels, financial expenditure targets, actual expenditures, and impacts of unplanned mandates
»Comparative• Compares the Quantitative measurement area metrics as
ratios to illustrate the relationships between expenditures and budget or products/services produced

31February 12, 2009/Office of the NIH CIO
Operational Analysis Management FrameworkPerformance Dimension: Financial PerformanceMeasurement Area: QuantitativeMetric DefinitionO&M Budget Request* The estimated funds required to sustain steady-state operations, which includes the
following elements:» Government Labor (loaded)» Contractor Services (this is Contractor labor)» HW costs » SW costs » SW licenses, agreements, subscriptions, and other SW services » Infrastructure and other non-SW or licensing services» Facilities» Training» Security Services (to include Certification & Accreditation (C&A)
O&M Budget Allocated* The amount of funding allocated by NIH governing boards to sustain steady-state operations.
Actual O&M Cost (FY)* The funds expended in sustainment of steady-state operations, which includes the following elements:» Government Labor (loaded)» Contractor Services (this is Contractor labor)» HW costs SW costs SW licenses, agreements, subscriptions, and other SW services » Infrastructure and other non-SW or licensing services» Facilities» Training» Security Services (to include Certification & Accreditation (C&A)
Unfunded Mandate Expenditure* Expenditures associated with O&M activities in response to unfunded mandates.
Note: Metrics denoted with an asterisk * are reported up to the governance level. Additional metric information can be found in section 3.2.3.1 of the NIH Operational Analysis Management Framework: A How-To Guide.

32February 12, 2009/Office of the NIH CIO
Operational Analysis Management FrameworkPerformance Dimension: Financial Performance (cont’d)
Measurement Area: Comparative
Metric Definition
Central Fund Allocation (FY)*
The percentage of NIH’s central fund account that is allocated to the system. This includes (tap) funding to support program management, planning, DME, and O&M.
Percent of Program Funds Allocated to System
Percent of the total budget allocated to the mission area (e.g., Extramural Research, Administration, Intramural Research) that the IT system’s total FY budget represents.
O&M Budget Variance* The amount of O&M funding requested during the current year relative to the amount allocated by NIH governing boards.
O&M Cost Variance* Difference between actual O&M expenditures and the allocated O&M budget.
Cost Per Output* Calculates the amount spent on delivery for any relevant (Strategic/Workload) Value/Contribution metric.
Note: Metrics denoted with an asterisk * are reported up to the governance level. Additional metric information can be found in section 3.2.3.2 of the NIH Operational Analysis Management Framework: A How-To Guide.

33February 12, 2009/Office of the NIH CIO
Operational Analysis Management FrameworkPerformance Component: Investment Health Dimension
» Strategic Fit• Assesses an IT system’s ability to meet emerging requirements and support
long-term strategic objectives• Identifies systems that are best positioned to provide the greatest short- and
long-term benefit to the NIH and its stakeholders
» Operational Fit• Addresses how well the system is positioned to meet today’s business needs
and complement the processes, activities, roles and skills in place to perform NIH’s mission
» Risk• Assesses the overall risk of an IT system by considering factors such as
environmental constraints, technical design, PM controls, security, and financial requirements
» Technical Sustainability• Assesses the extent to which the IT system’s technical components align
with the direction of technology adoption planned for NIH• Identifies the technologies that are presently supporting NIH enterprise
systems and evaluates industry support for those technologies moving forward

34February 12, 2009/Office of the NIH CIO
Operational Analysis Management FrameworkPerformance Dimension: Investment Health
Measurement Area: Strategic Fit
Metric Definition
Support for Short and Long-term Objectives*
A qualitative assessment of the extent to which the system aligns with Federal, HHS, NIH, and/or IC tactical and strategic mission objectives.
Lifespan* An assessment of the length of time that a system has been employed and a forecast of how long the system may provide ongoing value.
Support for Mandated Policies, Initiatives, or Technologies*
Assesses how well the system is able to support or adapt to emerging technologies and mandatory initiatives and policies.
Note: Metrics denoted with an asterisk * are reported up to the governance level. Additional metric information can be found in section 3.2.4.1 of the NIH Operational Analysis Management Framework: A How-To Guide.

35February 12, 2009/Office of the NIH CIO
Operational Analysis Management FrameworkPerformance Dimension: Investment Health (cont’d)
Measurement Area: Operational FitMetric Definition
System of Record* Indicates whether the system serves as an authoritative source for mission critical data.
SLA/SLC Conformity* An assessment of the extent to which the system has and meets SLAS/SLCs.
New Requirements* An assessment of the extent to which current functionality supports current and emerging operational needs.
Outdated Functionality* Identifies unnecessary and outdated system functions.
Alternatives Investments* Identifies whether alternative solutions for system function have been evaluated for feasibility and cost efficiency.
Note: Metrics denoted with an asterisk * are reported up to the governance level. Additional metric information can be found in section 3.2.4.2 of the NIH Operational Analysis Management Framework: A How-To Guide.
36February 12, 2009/Office of the NIH CIO
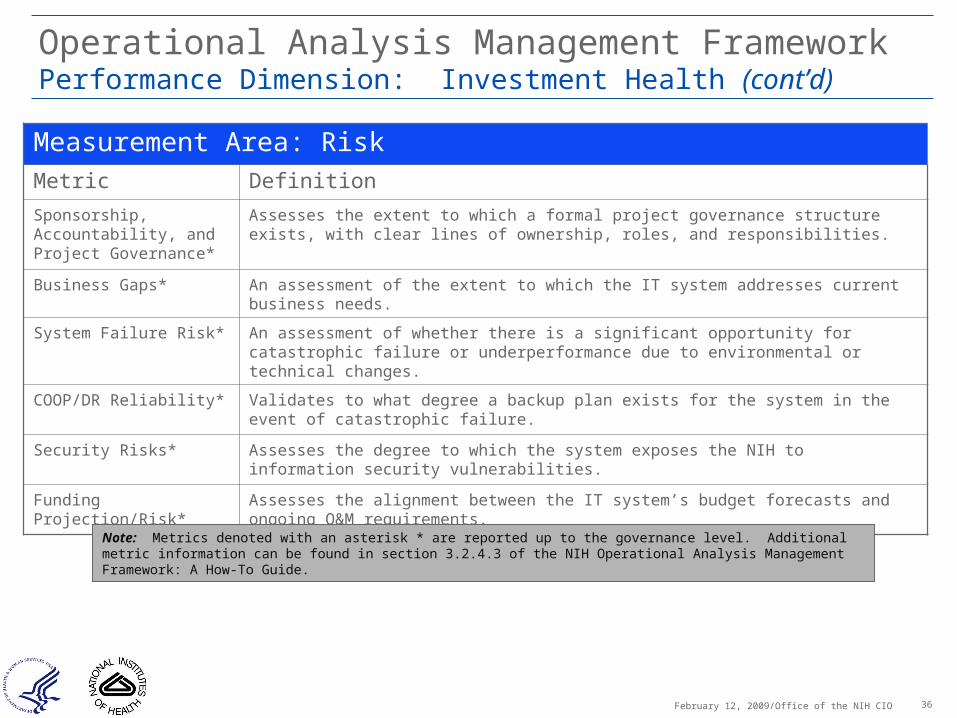
Operational Analysis Management FrameworkPerformance Dimension: Investment Health (cont’d)
Measurement Area: Risk Metric Definition
Sponsorship, Accountability, and Project Governance*
Assesses the extent to which a formal project governance structure exists, with clear lines of ownership, roles, and responsibilities.
Business Gaps* An assessment of the extent to which the IT system addresses current business needs.
System Failure Risk* An assessment of whether there is a significant opportunity for catastrophic failure or underperformance due to environmental or technical changes.
COOP/DR Reliability* Validates to what degree a backup plan exists for the system in the event of catastrophic failure.
Security Risks* Assesses the degree to which the system exposes the NIH to information security vulnerabilities.
Funding Projection/Risk* Assesses the alignment between the IT system’s budget forecasts and ongoing O&M requirements.
Note: Metrics denoted with an asterisk * are reported up to the governance level. Additional metric information can be found in section 3.2.4.3 of the NIH Operational Analysis Management Framework: A How-To Guide.

37February 12, 2009/Office of the NIH CIO
Operational Analysis Management FrameworkPerformance Dimension: Investment Health (cont’d)
Measurement Area: Technical SustainabilityMetric Definition
Technology Maintenance Burden*
An assessment of the feasibility of supporting the technology components over a period of time.
Technical Currency* An assessment of whether the technology components are up-to-date and have a reasonable lifespan.
Technical Complexity* As assessment of the degree of complexity of the system’s end-to-end solution architecture.
Technical Support* An assessment of the availability of learning materials and expert staff to maintain key system components.
NIH Standards Compliance* Assesses the degree to which technical components comply with NIH standards.
Vendor Support* Assesses the availability of vendor support over the lifetime of the system.
Note: Metrics denoted with an asterisk * are reported up to the governance level. Additional metric information can be found in section 3.2.4.4 of the NIH Operational Analysis Management Framework: A How-To Guide.