MARAMA ICAC Meeting Exton, PA July 09, 2008 · 20 Degrees C, 1 ATM Rev. A.0. 27 Elemental Hg,...
59
The world leader in serving science MARAMA ICAC Meeting Exton, PA July 09, 2008 Richard Panorese- Regional Sales Manager Jeremy Whorton- Mercury CEMS Applications Engineer Update and Discussion on Advances in Mercury CEMS, Real World Experiences and Lessons Learned
Transcript of MARAMA ICAC Meeting Exton, PA July 09, 2008 · 20 Degrees C, 1 ATM Rev. A.0. 27 Elemental Hg,...
The world leader in serving science
MARAMA ICAC Meeting
Exton, PA
July 09, 2008
Richard Panorese- Regional Sales Manager
Jeremy Whorton- Mercury CEMS Applications Engineer
Update and Discussion on
Advances in Mercury CEMS,
Real World Experiences and
Lessons Learned
2
Agenda July 10 MARAMA ICAC Meeting
�Overview of Thermo Fisher Scientific
�Clean Air Mercury Rule
�Overview of Mercury Freedom System
�Low Level Monitoring Experiences
�Certification Preparation Experiences
�Summary
3
ThermoFisher Mercury CEMS Capabilities
� Thermo Fisher has shipped 450+ Hg CEMS- some direct and others through systems integrators.
� Commitment to Power Generation Industry, EPRI, and EPA
• Supplier of instrumentation to EPA and Utilities since Early 1970’s
� Deep Instrumentation & CEMS Applications Design Expertise
(~35 Engineers Contributing to Development)
• Critical to Meeting Requirements of Very Challenging Application
� Modern Manufacturing Facilities and Processes
• Key To Meeting Significant Market Demand
4
Clean Air Mercury Rule
� EPA is required to regulate mercury emissions, as mandated by the Clean Air Act Amendments of 1990
� EPA proposed a “cap-and-trade” approach on March 16, 2004.
� The final “CAMR” rule was signed on March 15, 2005� Established a cap-and-trade program
� Required most units to continuously monitor Hg emissions.
� Update- Feb 8- Rule is thrown Out, but many states still require monitoring. CEMS Installation activities are still moving forward.
5
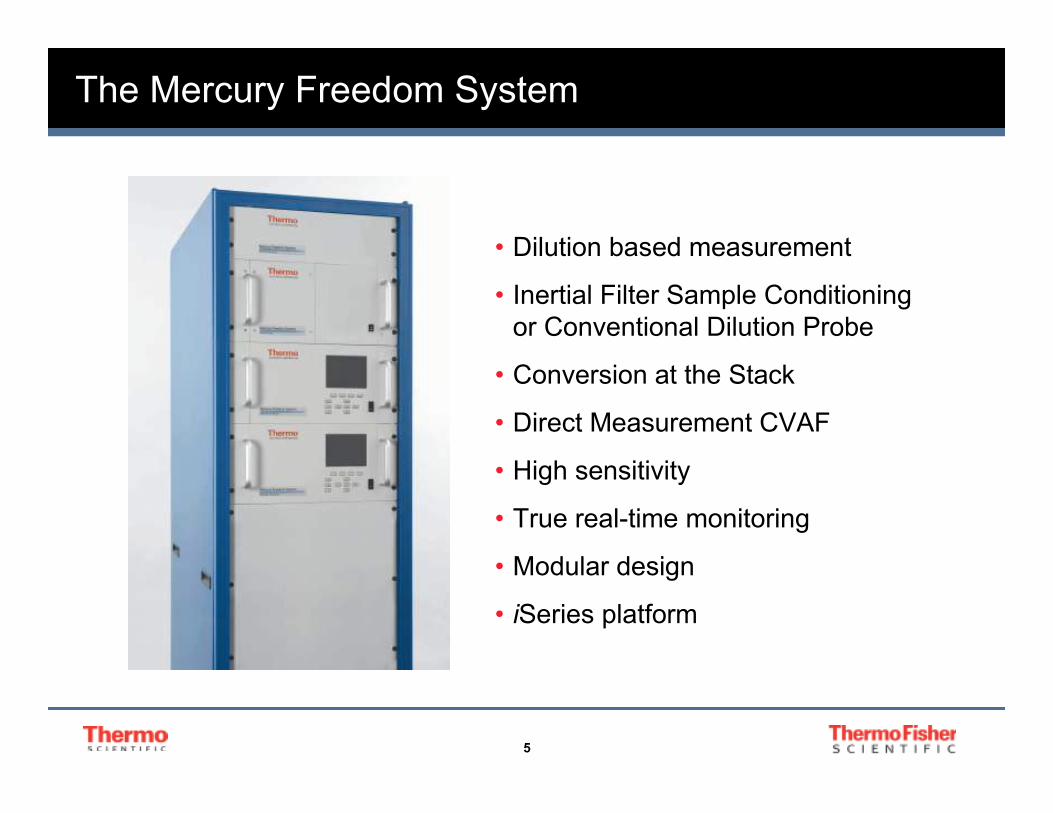
The Mercury Freedom System
• Dilution based measurement
• Inertial Filter Sample Conditioning
or Conventional Dilution Probe
• Conversion at the Stack
• Direct Measurement CVAF
• High sensitivity
• True real-time monitoring
• Modular design
• iSeries platform
6
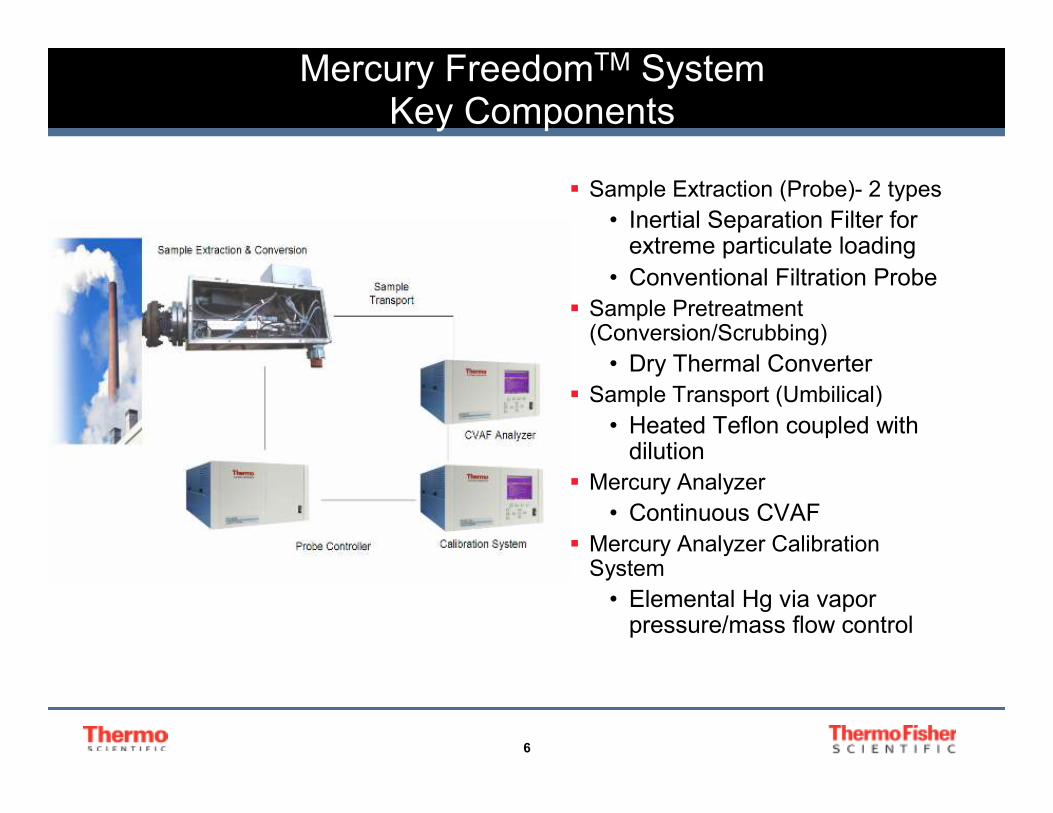
Mercury FreedomTM SystemKey Components
� Sample Extraction (Probe)- 2 types
• Inertial Separation Filter for extreme particulate loading
• Conventional Filtration Probe
� Sample Pretreatment (Conversion/Scrubbing)
• Dry Thermal Converter
� Sample Transport (Umbilical)
• Heated Teflon coupled with dilution
� Mercury Analyzer
• Continuous CVAF
� Mercury Analyzer Calibration System
• Elemental Hg via vapor pressure/mass flow control
7
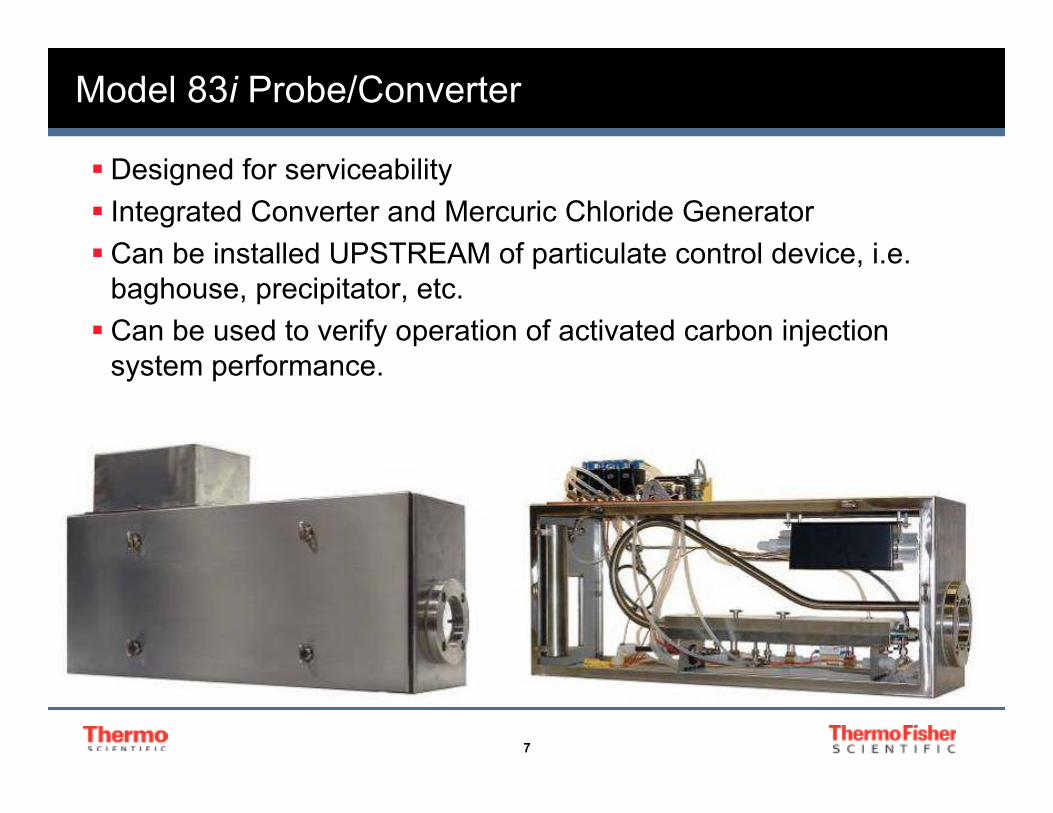
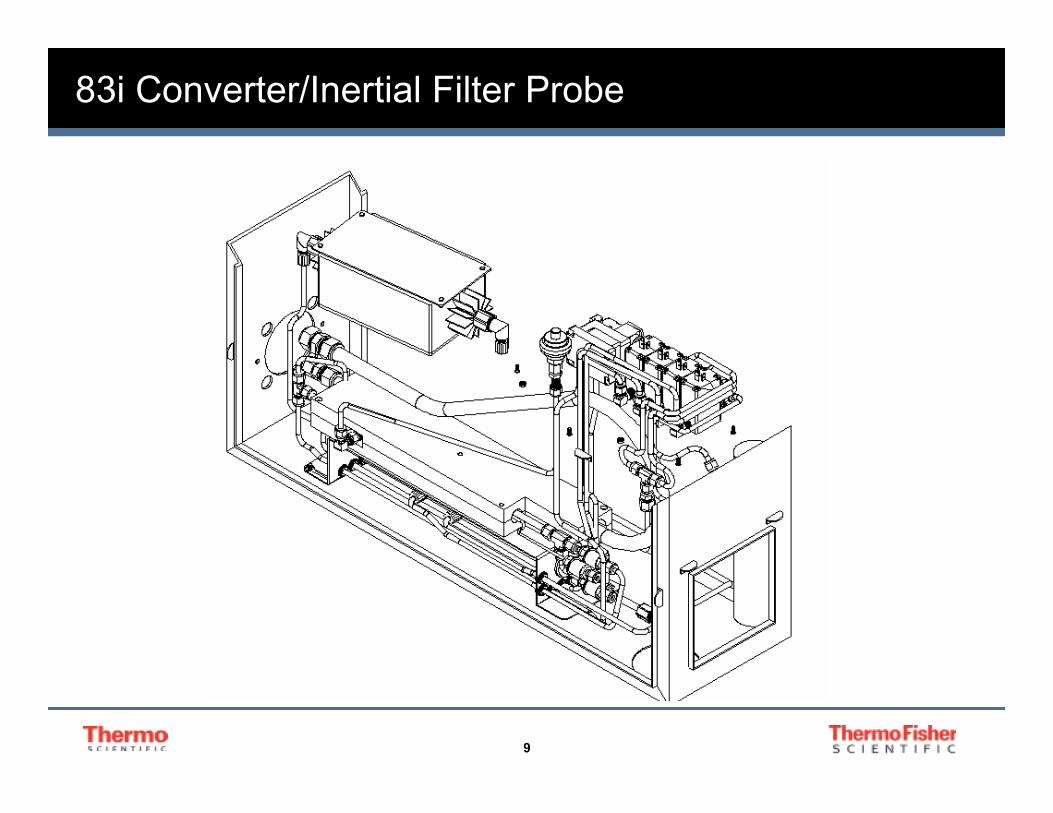
Model 83i Probe/Converter
� Designed for serviceability
� Integrated Converter and Mercuric Chloride Generator
� Can be installed UPSTREAM of particulate control device, i.e.
baghouse, precipitator, etc.
� Can be used to verify operation of activated carbon injection
system performance.
8
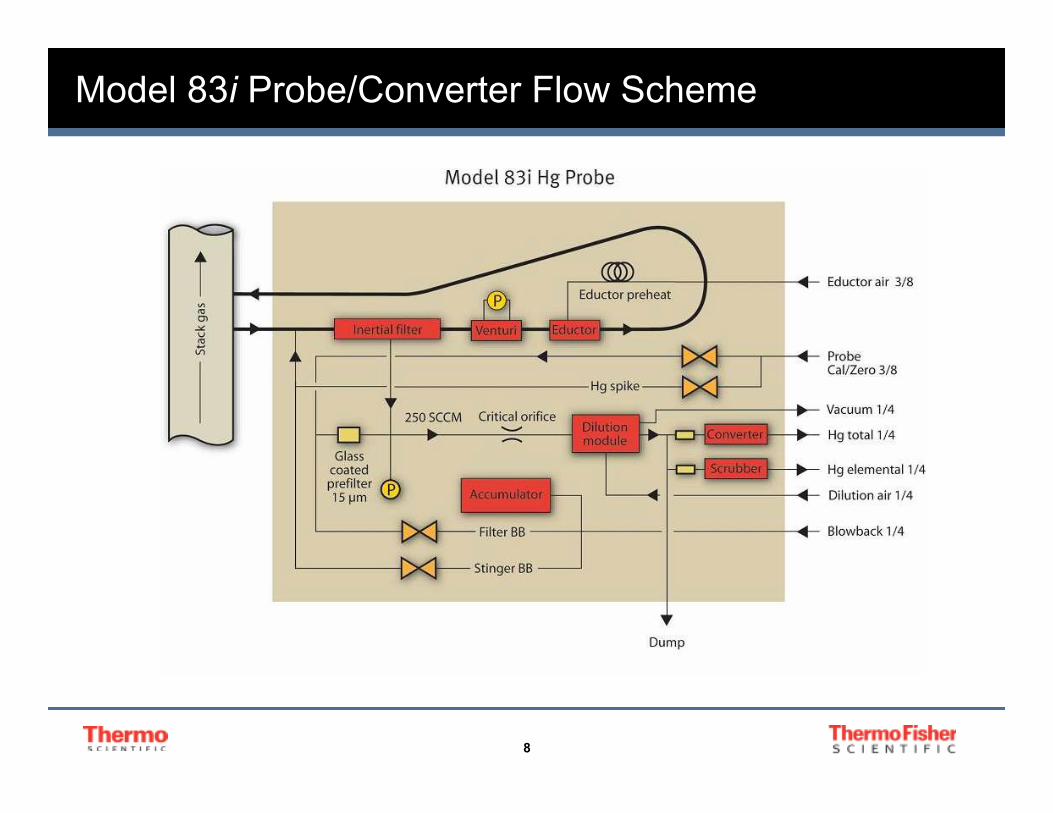
Model 83i Probe/Converter Flow Scheme
9
83i Converter/Inertial Filter Probe
10
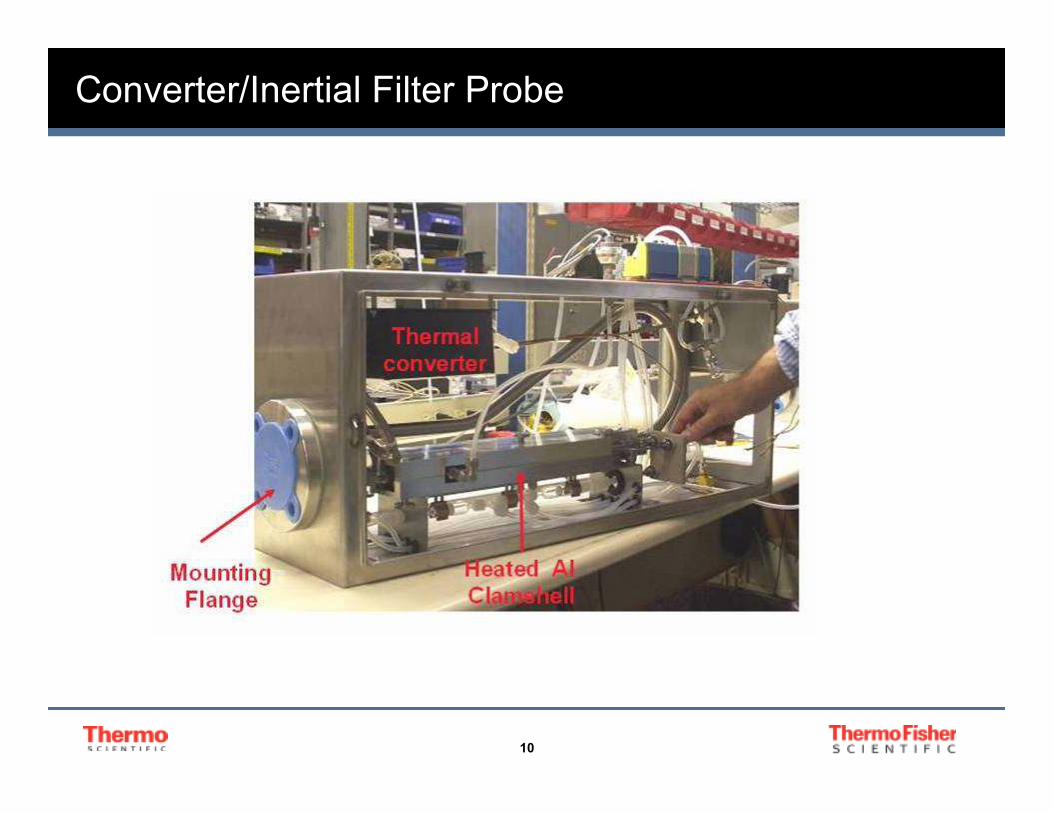
Converter/Inertial Filter Probe
11
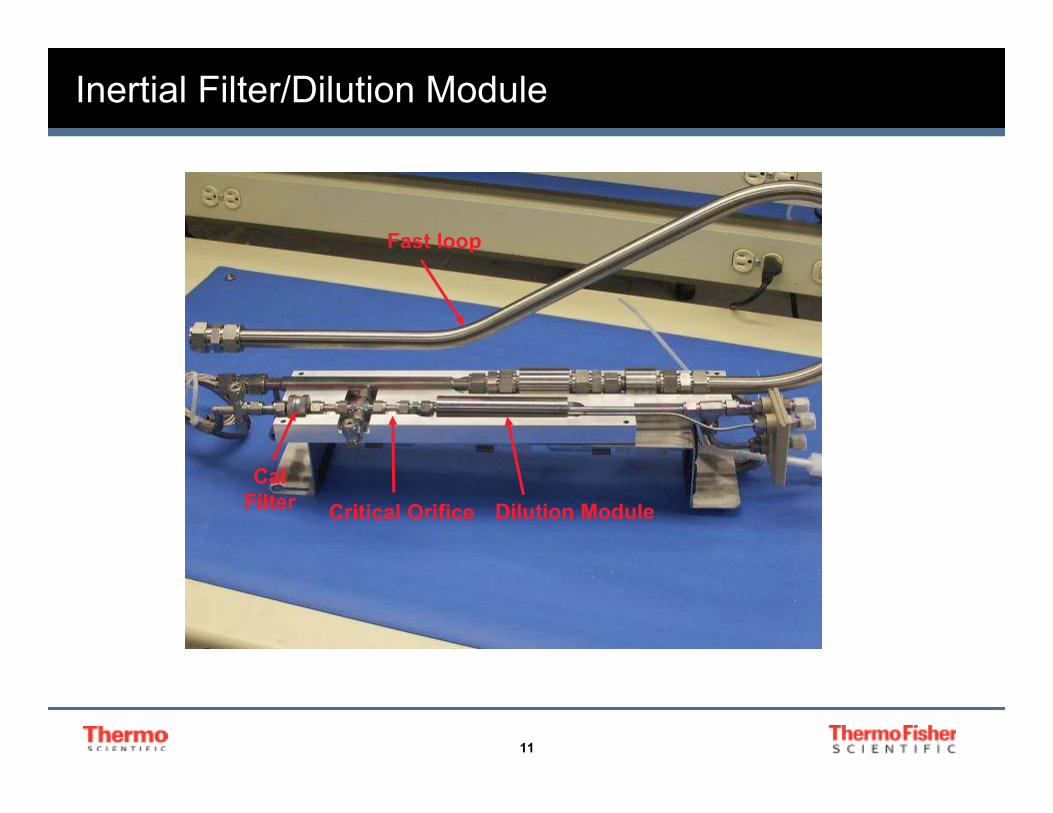
Inertial Filter/Dilution Module
Critical Orifice Dilution Module
Fast loop
Cal
Filter
12
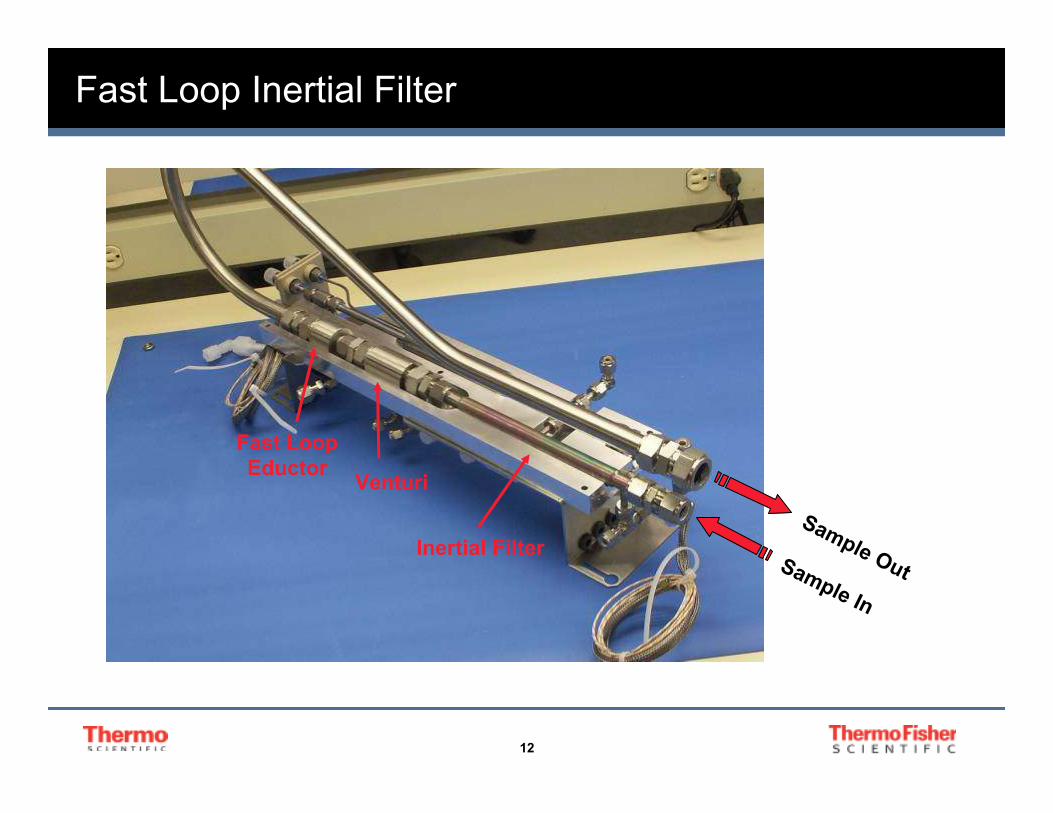
Fast Loop Inertial Filter
Inertial Filter
Venturi
Fast Loop
Eductor
Sample In
Sample Out
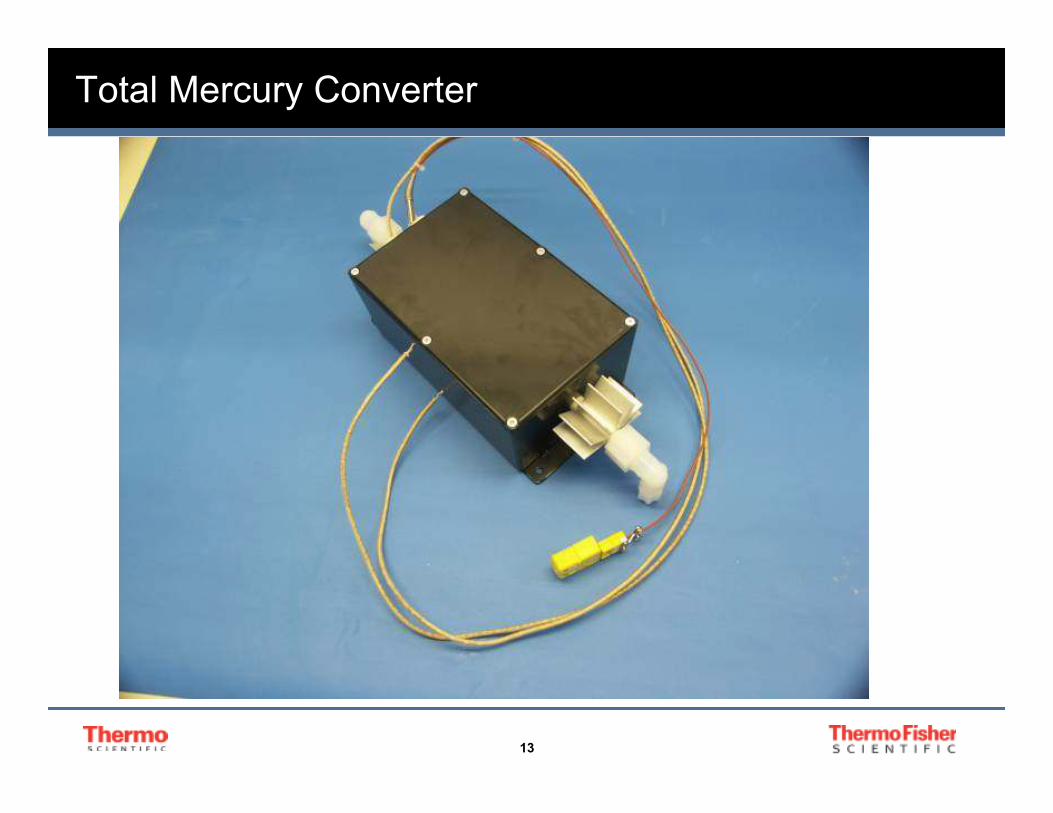
13
Total Mercury Converter
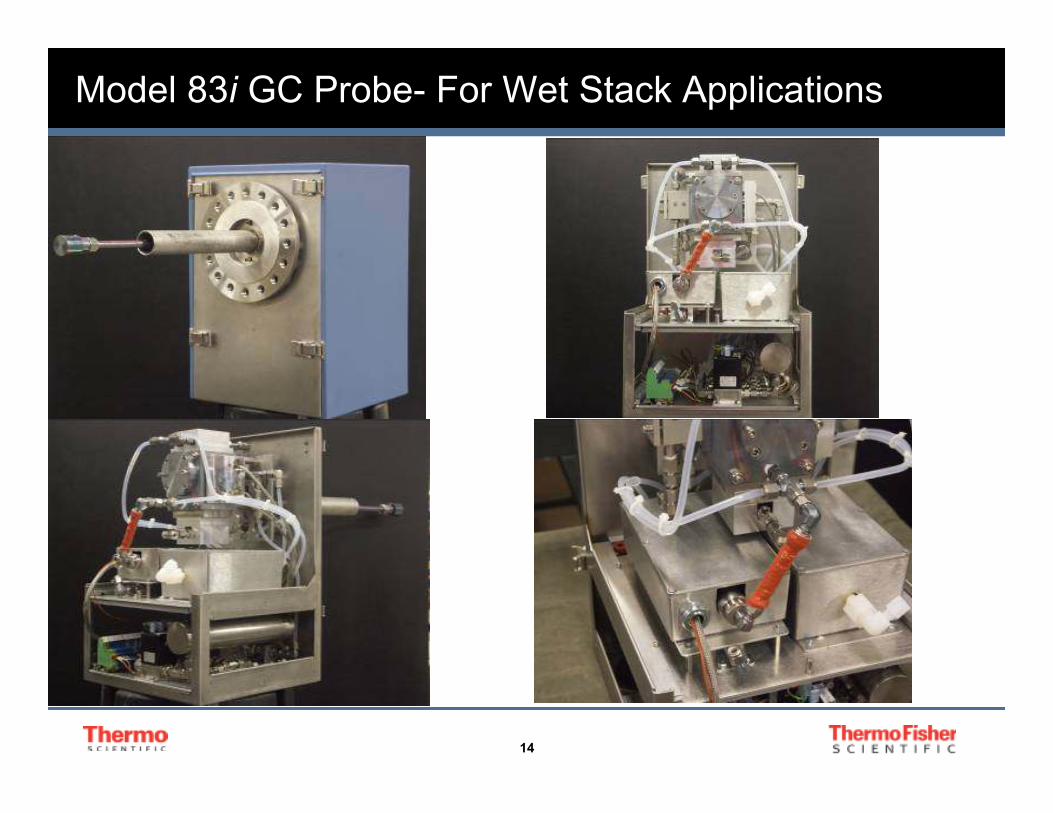
14
Model 83i GC Probe- For Wet Stack Applications
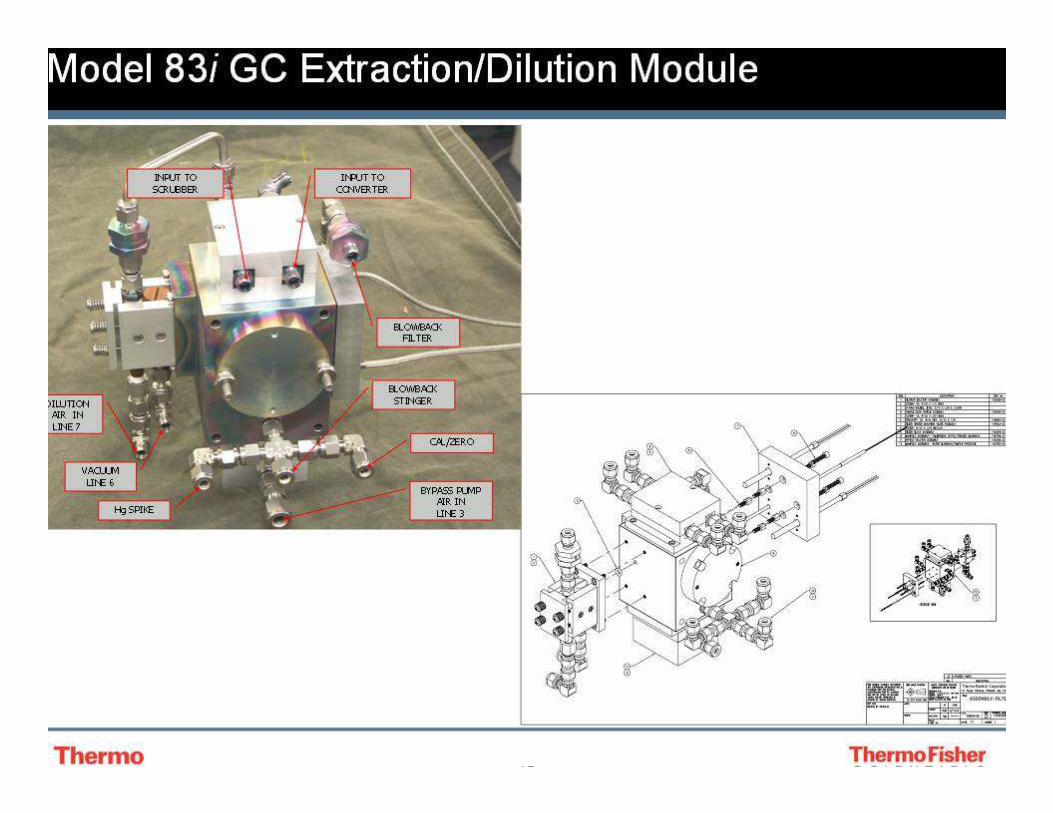
15
Model 83i GC Extraction/Dilution Module
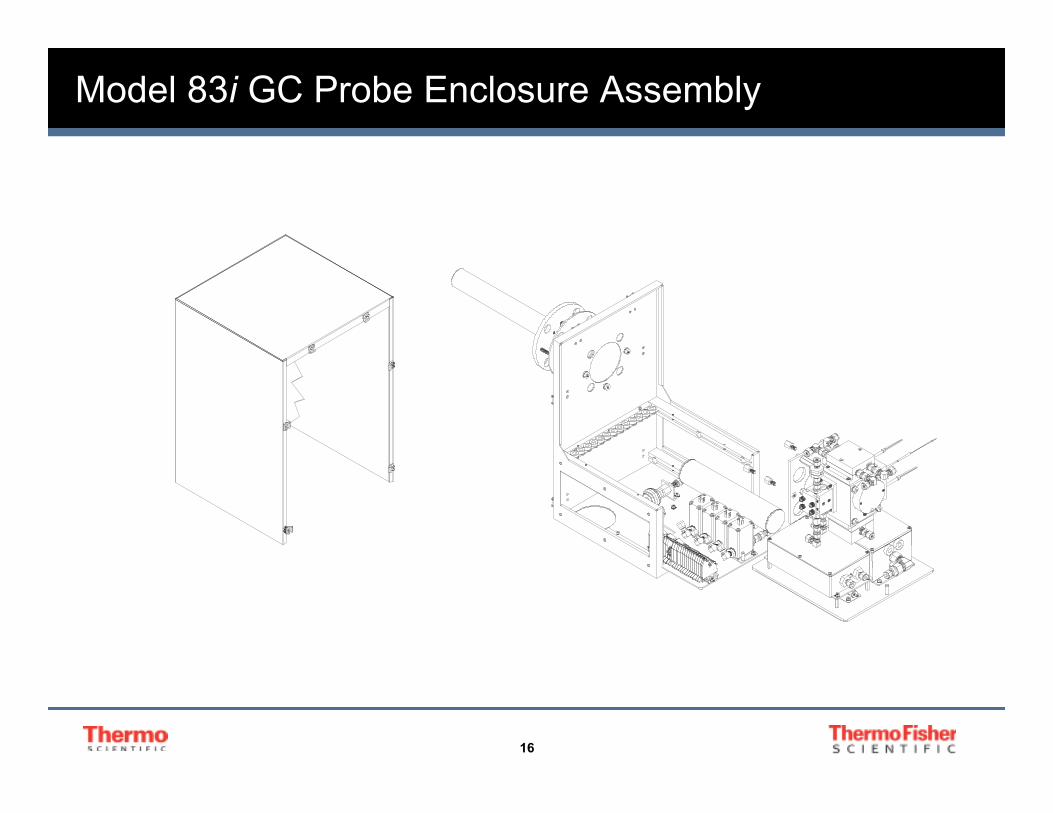
16
Model 83i GC Probe Enclosure Assembly
17
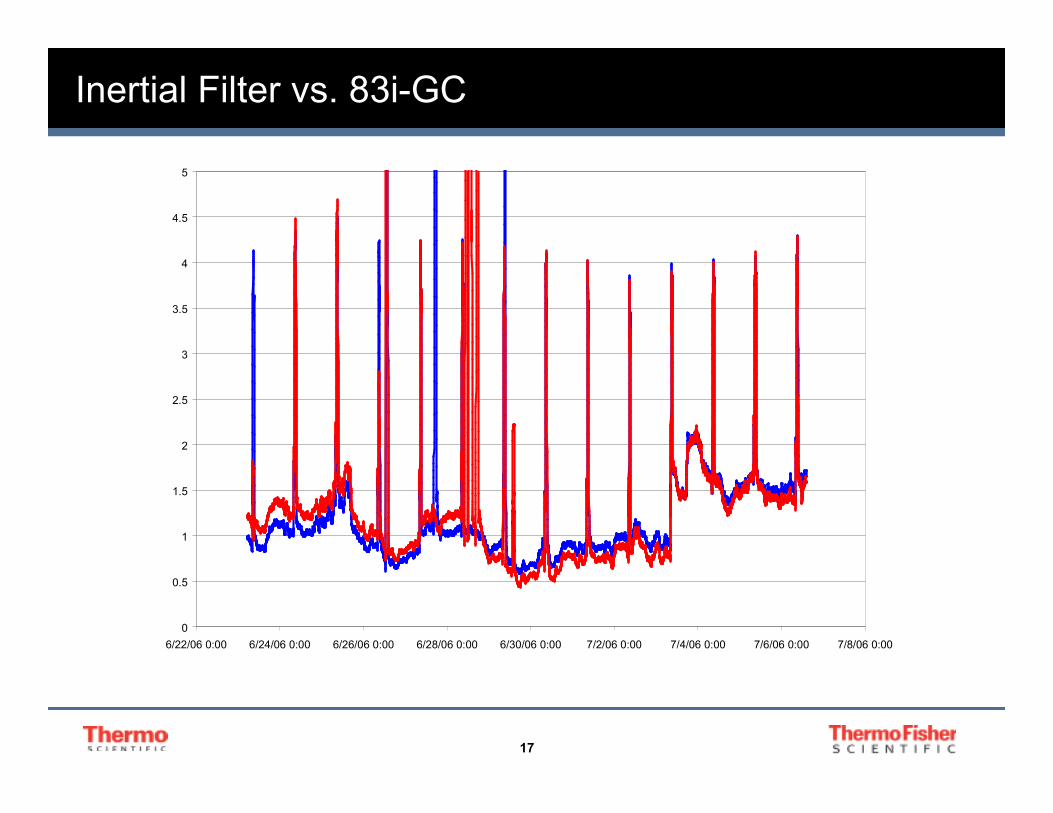
Inertial Filter vs. 83i-GC
0
0.5
1
1.5
2
2.5
3
3.5
4
4.5
5
6/22/06 0:00 6/24/06 0:00 6/26/06 0:00 6/28/06 0:00 6/30/06 0:00 7/2/06 0:00 7/4/06 0:00 7/6/06 0:00 7/8/06 0:00
18
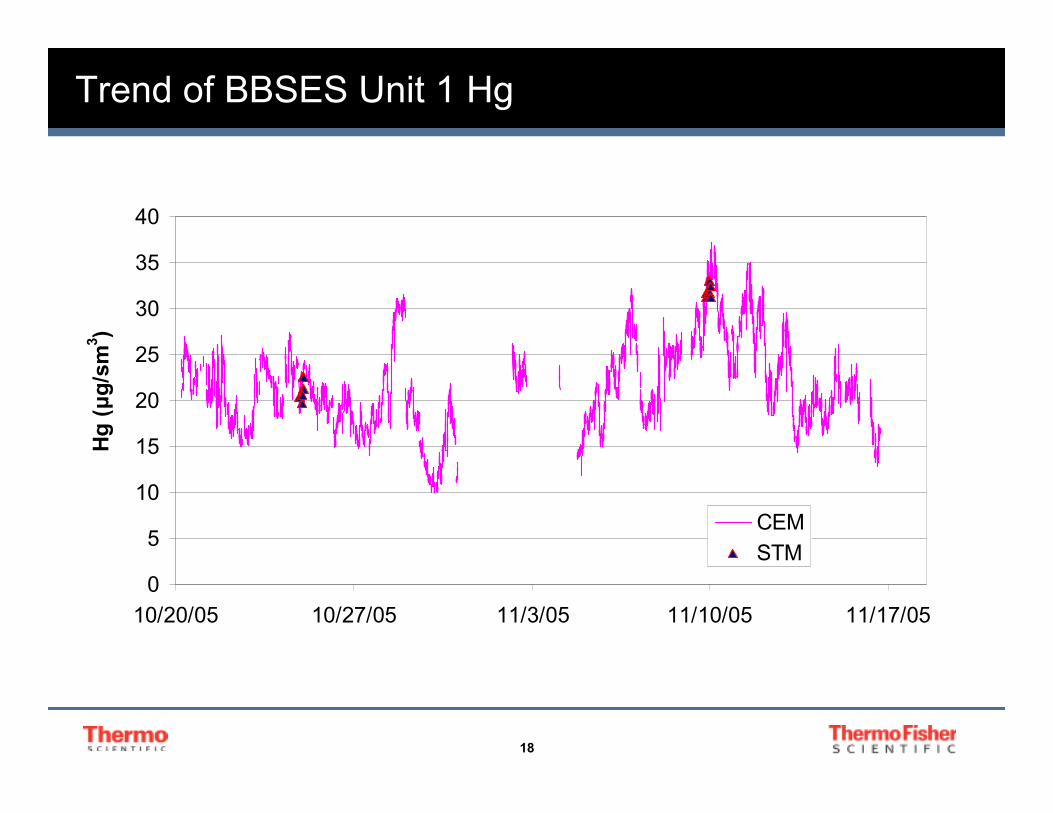
Trend of BBSES Unit 1 Hg
0
5
10
15
20
25
30
35
40
10/20/05 10/27/05 11/3/05 11/10/05 11/17/05
Hg (µg/s
m3)
CEM
STM
19
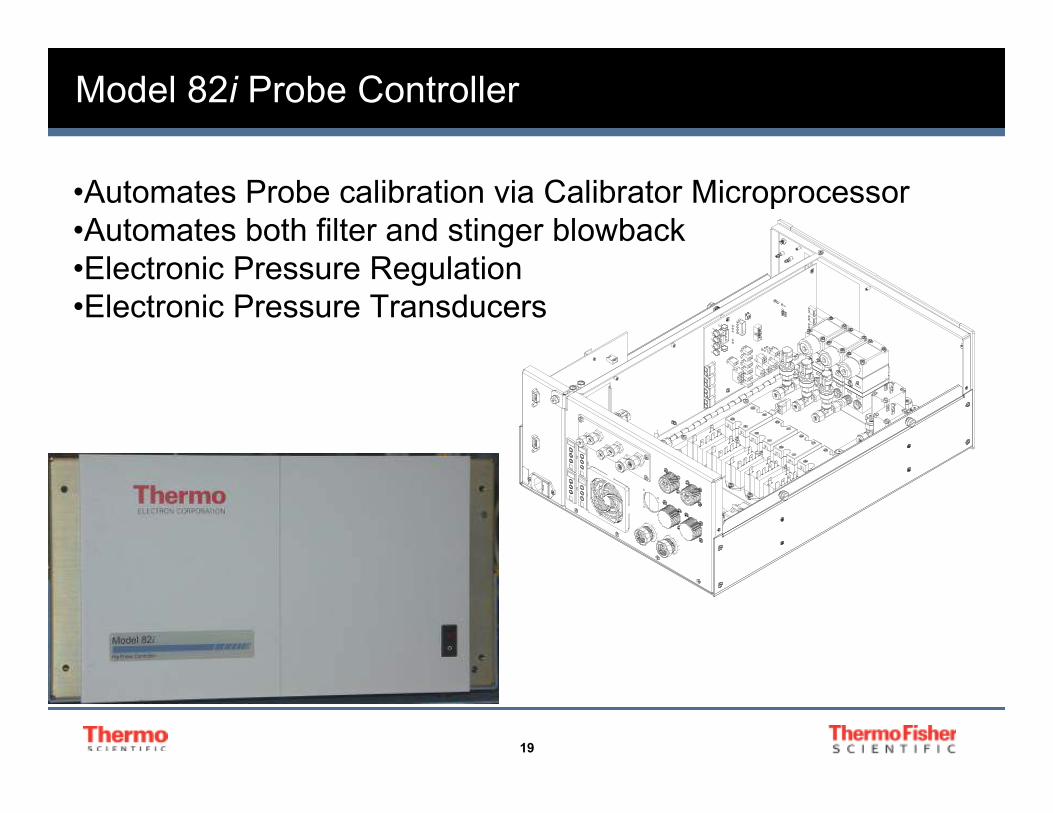
Model 82i Probe Controller
•Automates Probe calibration via Calibrator Microprocessor
•Automates both filter and stinger blowback
•Electronic Pressure Regulation
•Electronic Pressure Transducers
20
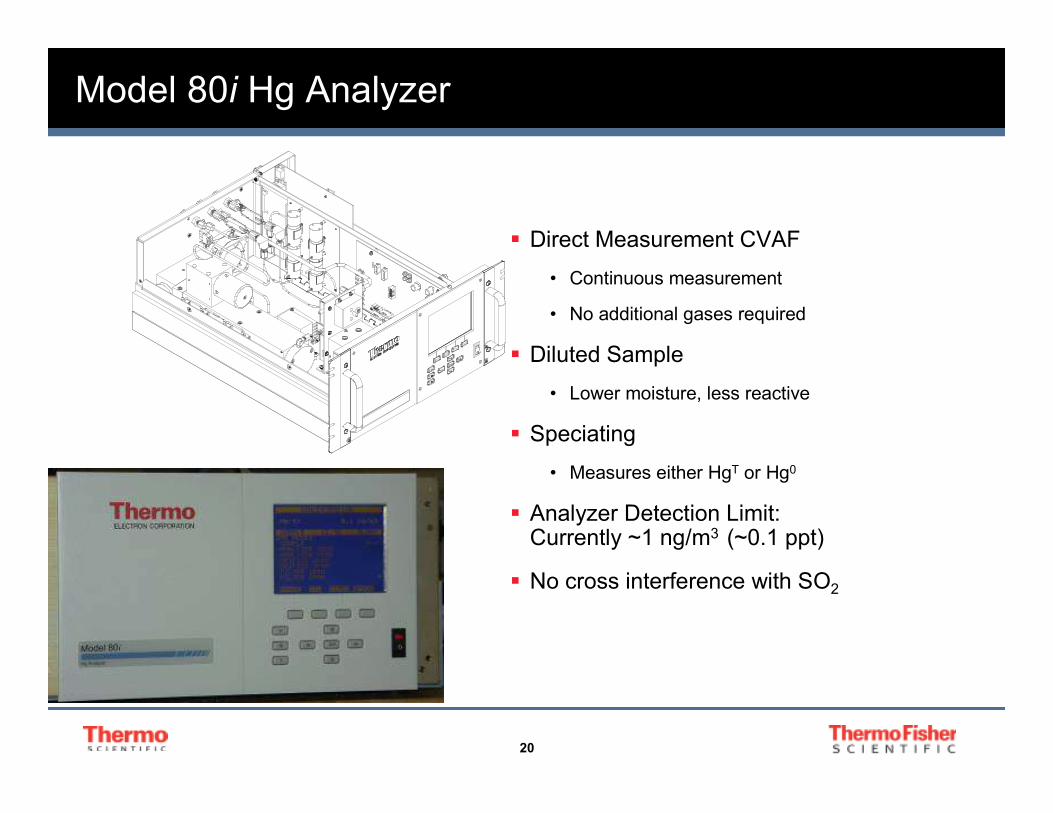
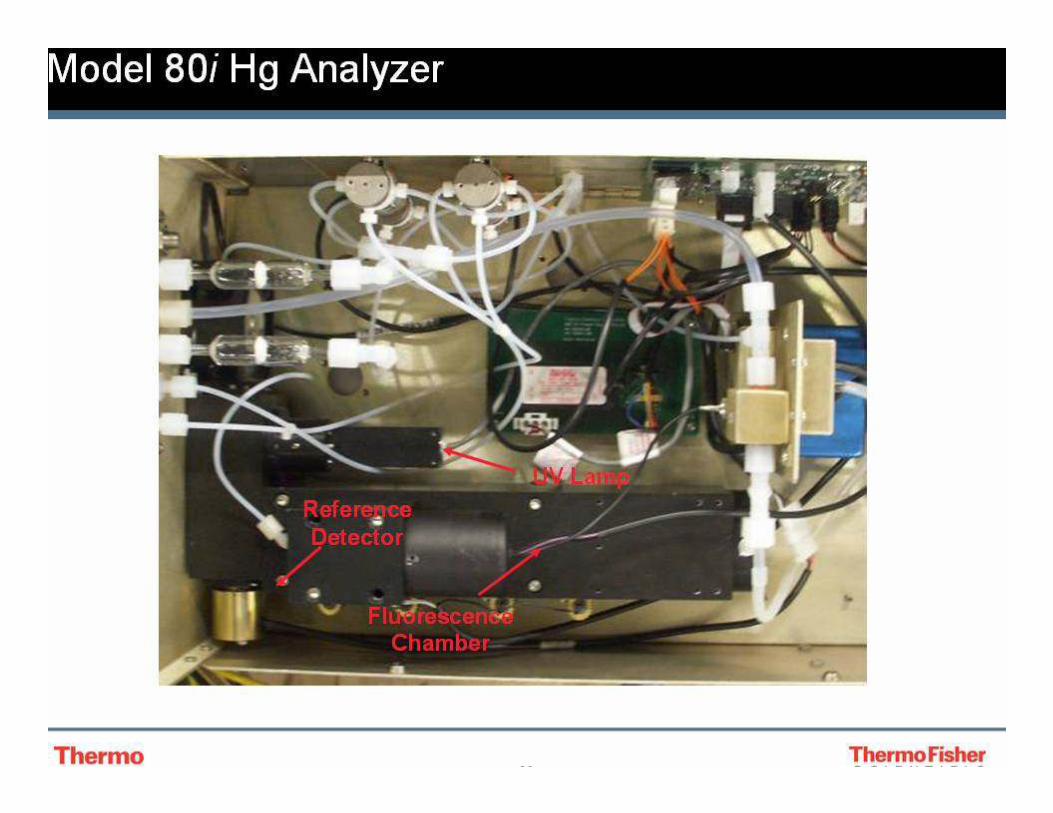
Model 80i Hg Analyzer
� Direct Measurement CVAF
• Continuous measurement
• No additional gases required
� Diluted Sample
• Lower moisture, less reactive
� Speciating
• Measures either HgT or Hg0
� Analyzer Detection Limit: Currently ~1 ng/m3 (~0.1 ppt)
� No cross interference with SO2
21
Model 80i Hg Analyzer
22
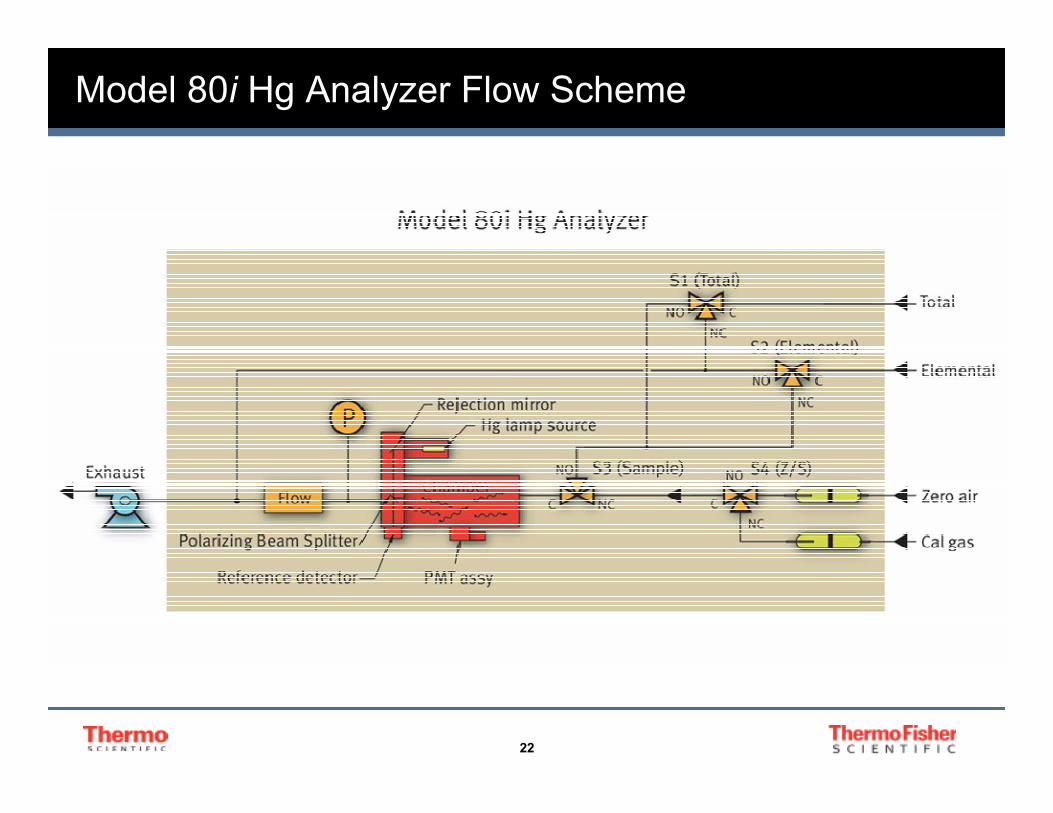
Model 80i Hg Analyzer Flow Scheme
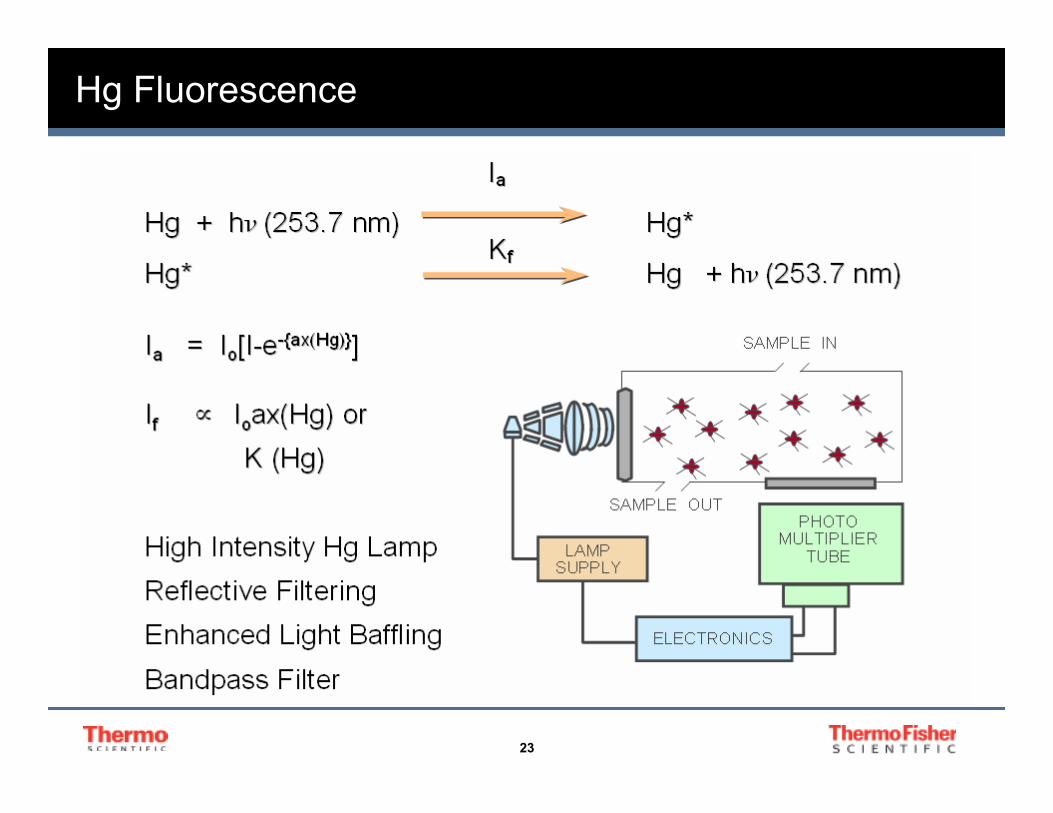
23
Hg Fluorescence
24
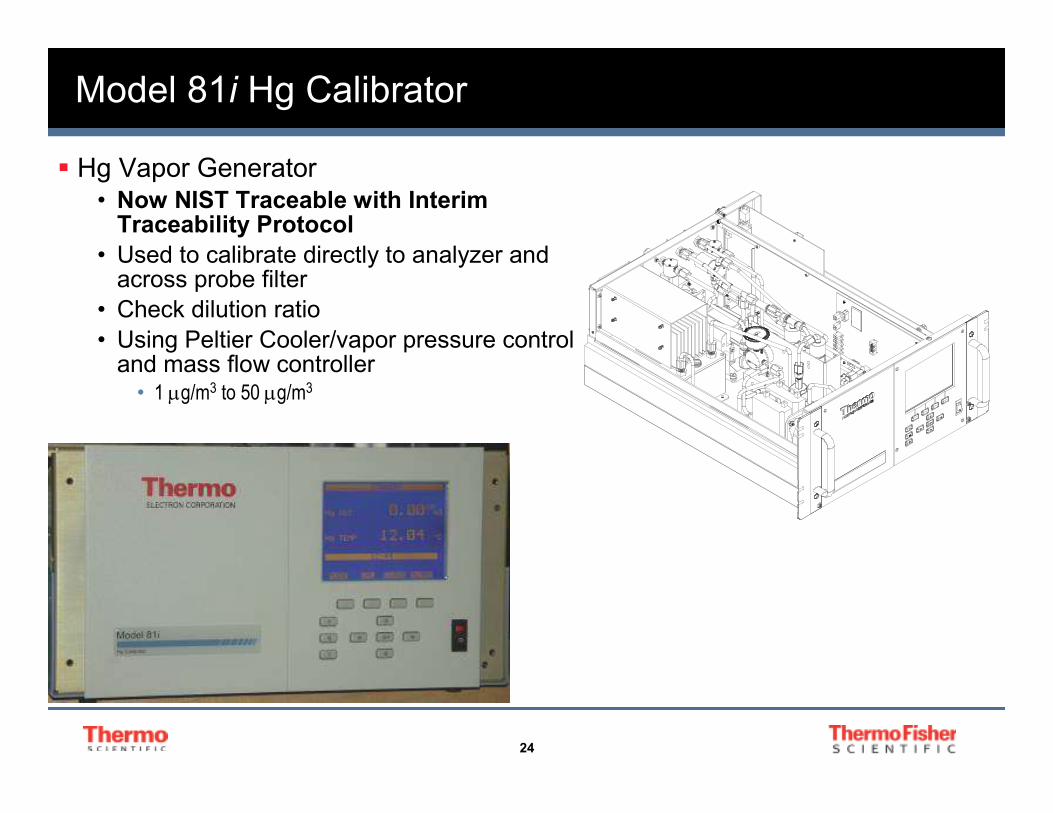
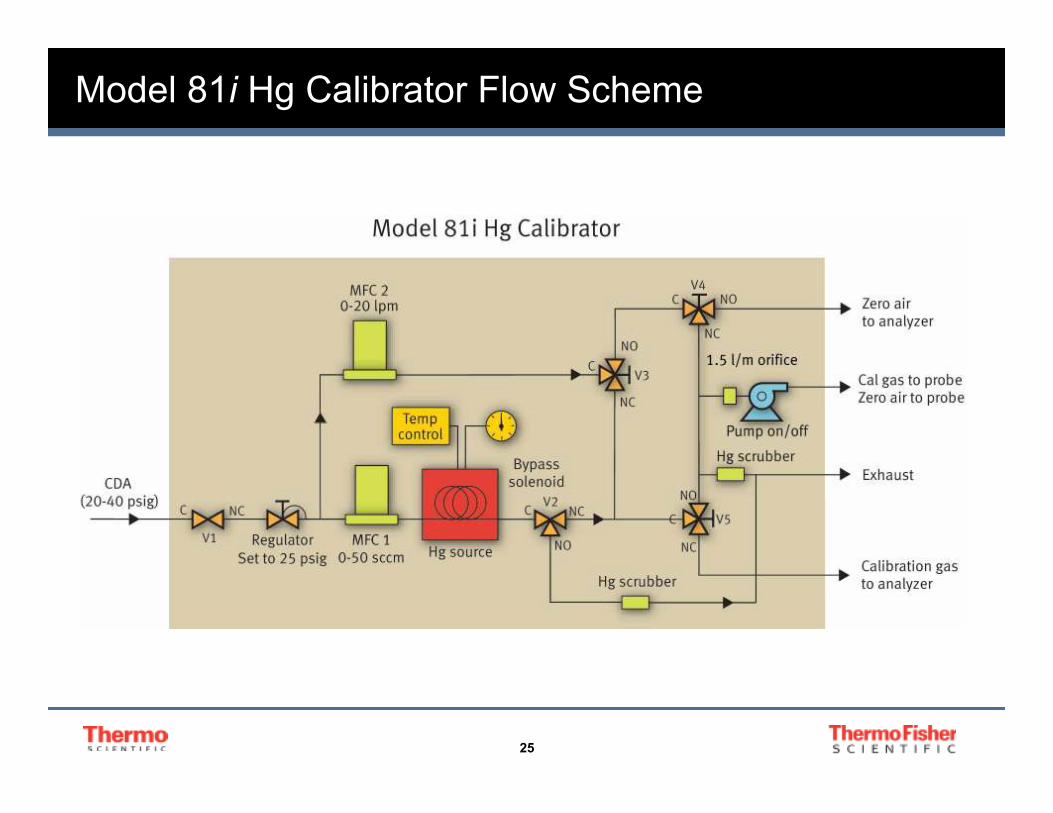
Model 81i Hg Calibrator
� Hg Vapor Generator• Now NIST Traceable with Interim
Traceability Protocol
• Used to calibrate directly to analyzer and across probe filter
• Check dilution ratio
• Using Peltier Cooler/vapor pressure control and mass flow controller• 1 µg/m3 to 50 µg/m3
25
Model 81i Hg Calibrator Flow Scheme
26
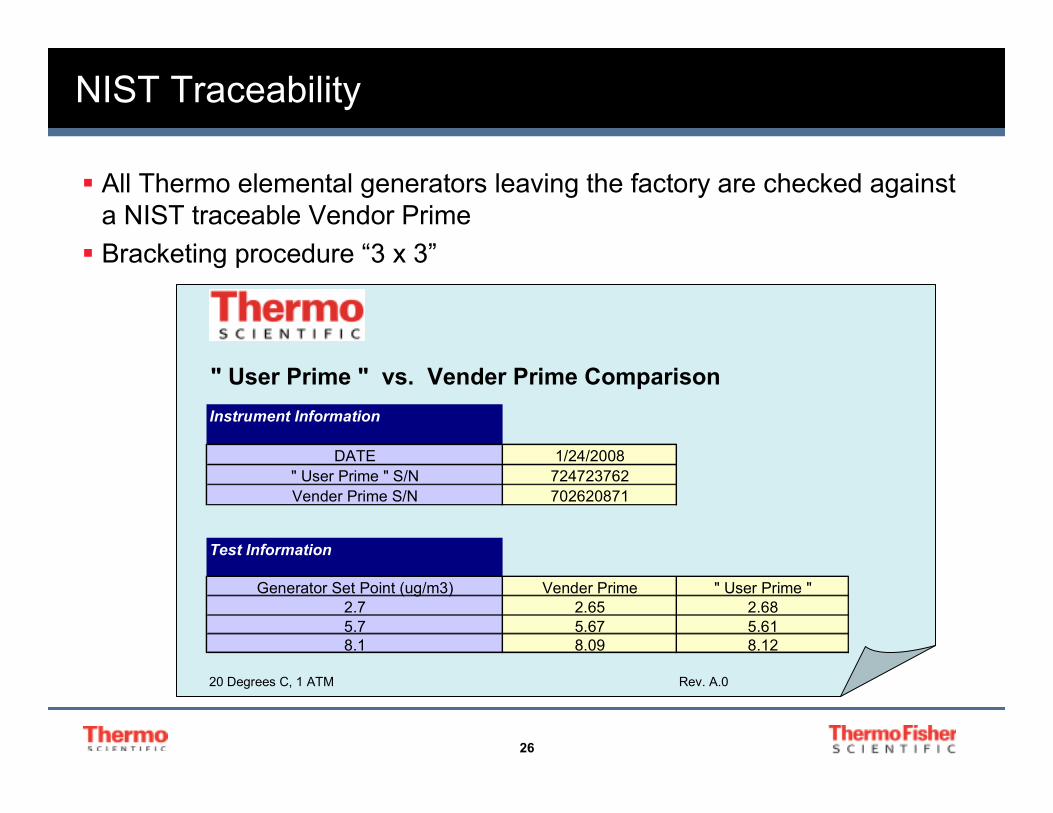
NIST Traceability
� All Thermo elemental generators leaving the factory are checked against
a NIST traceable Vendor Prime
� Bracketing procedure “3 x 3”
" User Prime " vs. Vender Prime Comparison
Instrument Information
DATE 1/24/2008
" User Prime " S/N 724723762
Vender Prime S/N 702620871
Test Information
Generator Set Point (ug/m3) Vender Prime " User Prime "
2.7 2.65 2.68
5.7 5.67 5.61
8.1 8.09 8.12
20 Degrees C, 1 ATM Rev. A.0
27
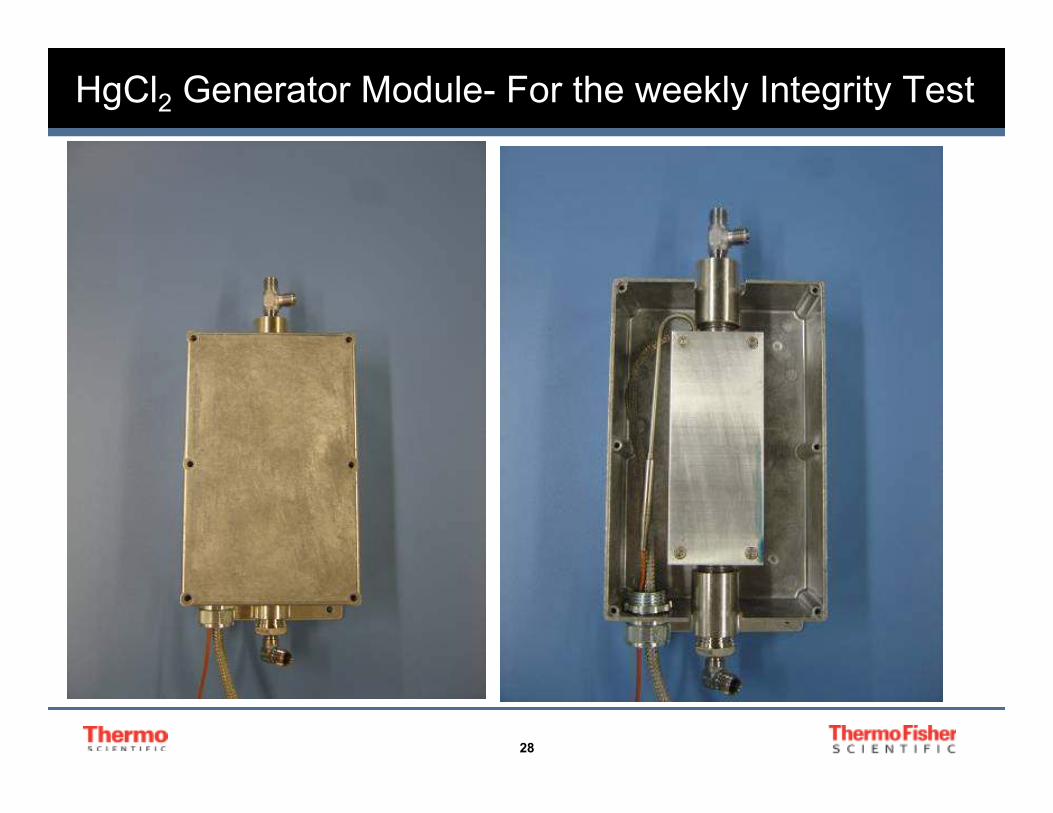
Elemental Hg, Oxidized Hg, and the Weekly Integrity Test
• The Thermo 81i Mercury Calibrator generates Elemental
Mercury Calibration gas.
• Daily span checks are required with elemental Mercury.
• CAMR required a “Weekly Integrity Test” with Oxidized
Mercury.
• Thermo provides the “Mercuric Chloride Generator” for
this test.
• A 3-point Oxidized Linearity is required for initial
certification of Hg CEMS.
28
HgCl2 Generator Module- For the weekly Integrity Test
29
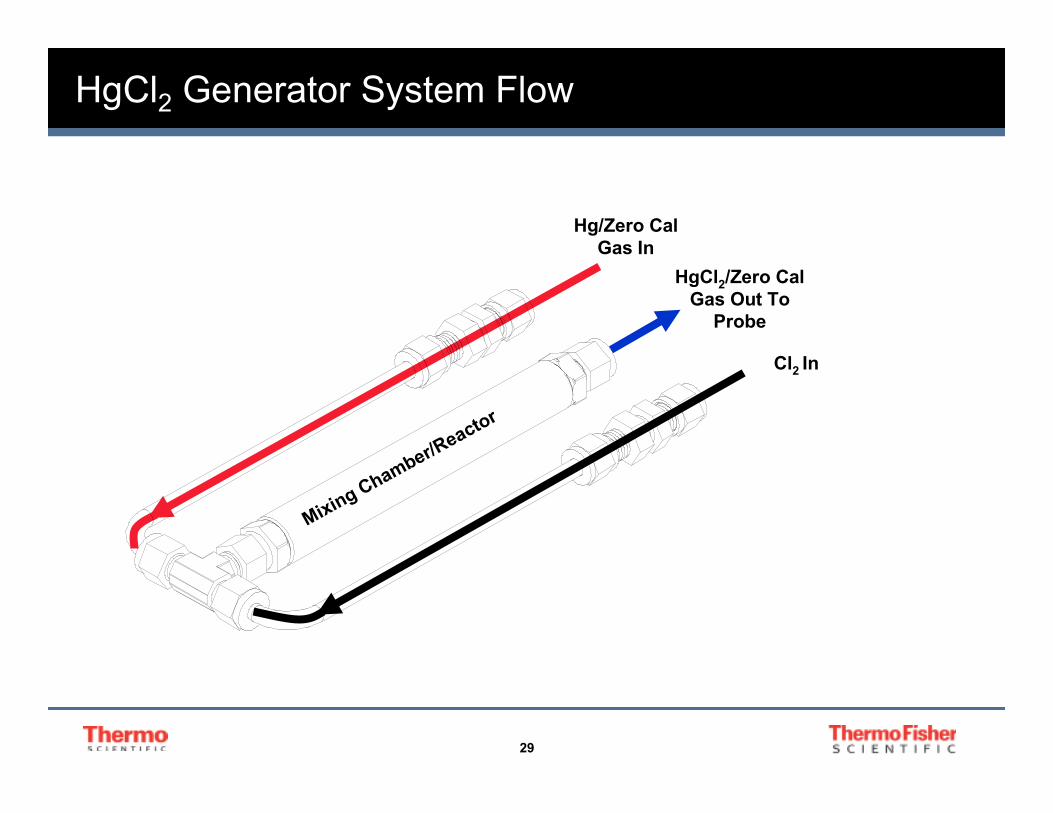
HgCl2 Generator System Flow
Cl2 In
Hg/Zero Cal
Gas In
HgCl2/Zero Cal
Gas Out To
Probe
Mixing C
hamber/
Reacto
r
30
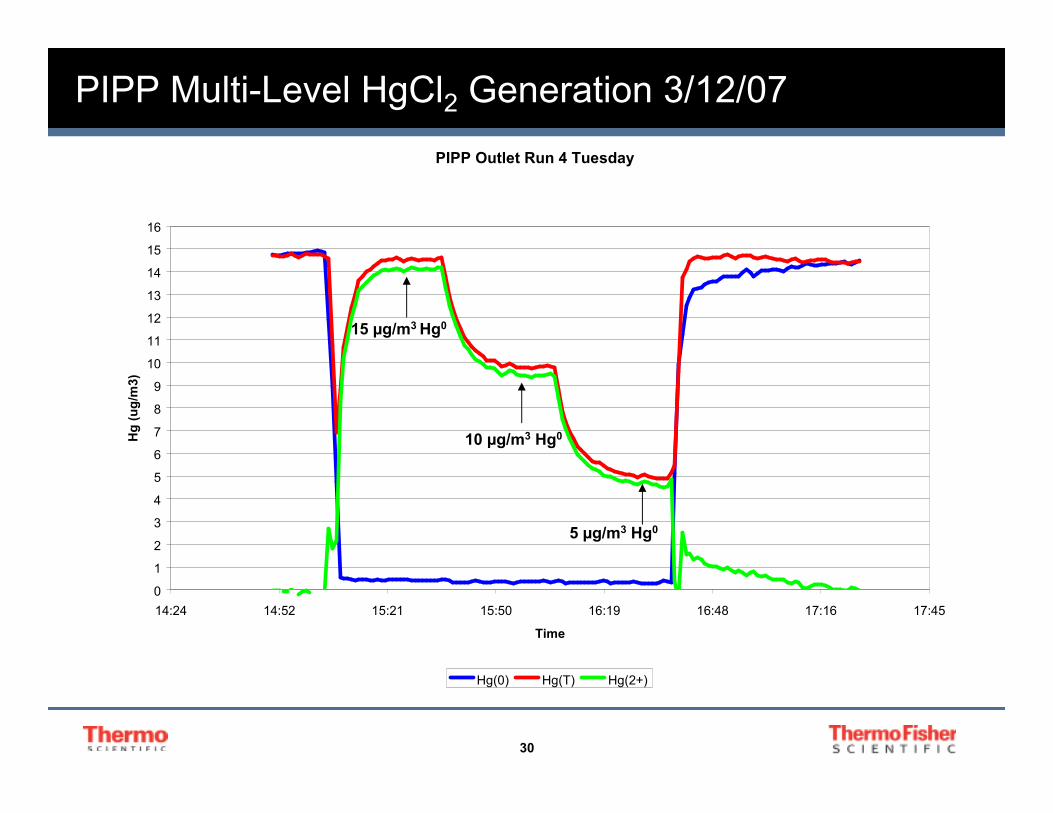
PIPP Multi-Level HgCl2 Generation 3/12/07
PIPP Outlet Run 4 Tuesday
0
1
2
3
4
5
6
7
8
9
10
11
12
13
14
15
16
14:24 14:52 15:21 15:50 16:19 16:48 17:16 17:45
Time
Hg (ug/m
3)
Hg(0) Hg(T) Hg(2+)
15 µg/m3 Hg0
10 µg/m3 Hg0
5 µg/m3 Hg0
31
Installation Activities
�Low Level Monitoring Experiences
• Nitrogen Generator
�Certification Preparation Experiences
• The challenges of emission rate variability.
32
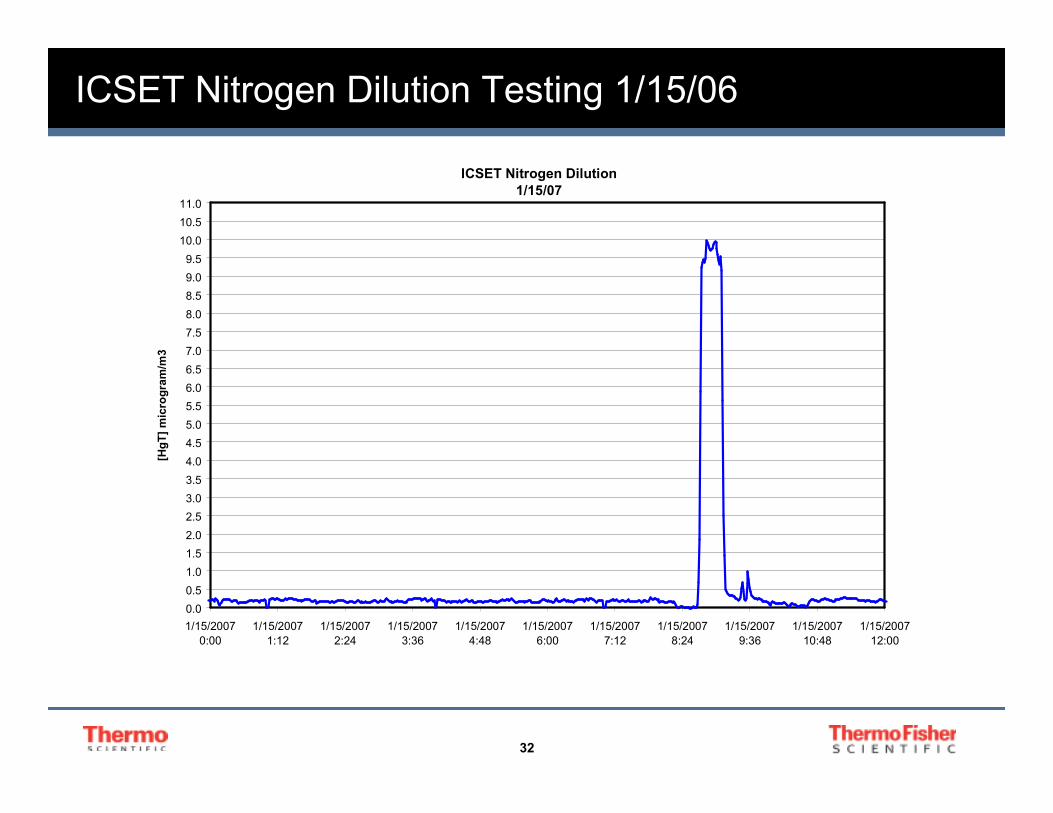
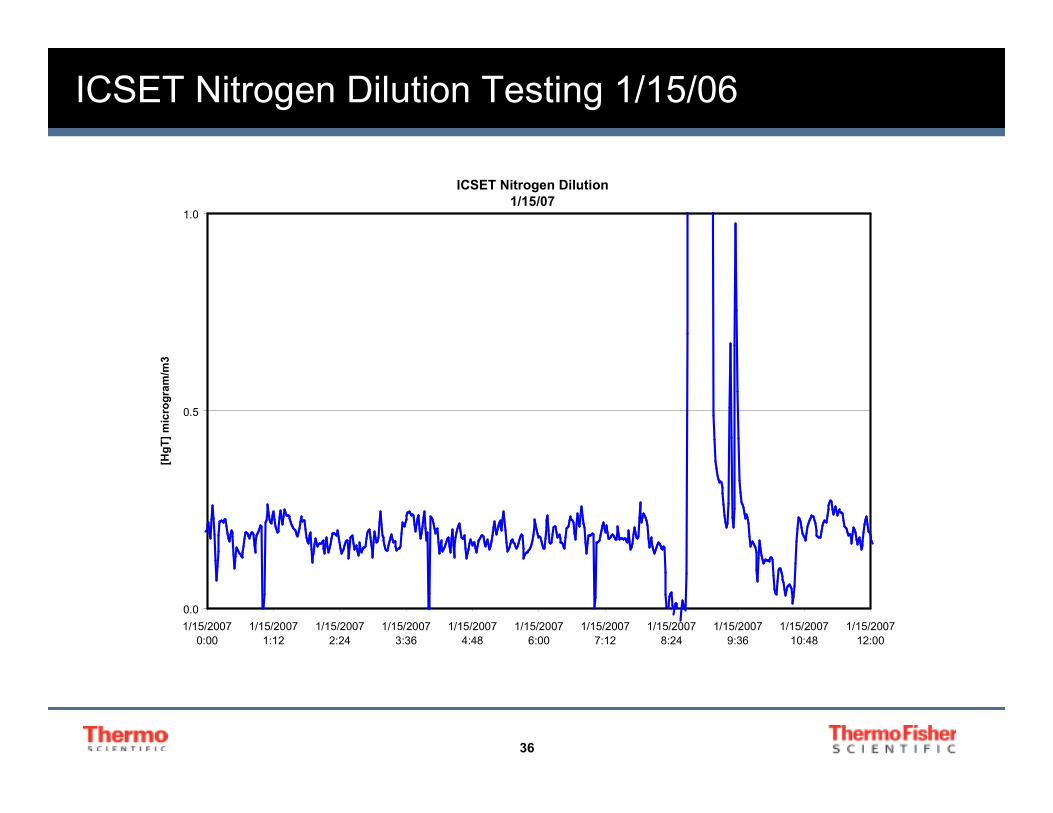
ICSET Nitrogen Dilution Testing 1/15/06
ICSET Nitrogen Dilution
1/15/07
0.0
0.5
1.0
1.5
2.0
2.5
3.0
3.5
4.0
4.5
5.0
5.5
6.0
6.5
7.0
7.5
8.0
8.5
9.0
9.5
10.0
10.5
11.0
1/15/2007
0:00
1/15/2007
1:12
1/15/2007
2:24
1/15/2007
3:36
1/15/2007
4:48
1/15/2007
6:00
1/15/2007
7:12
1/15/2007
8:24
1/15/2007
9:36
1/15/2007
10:48
1/15/2007
12:00
[HgT] m
icro
gra
m/m
3
33
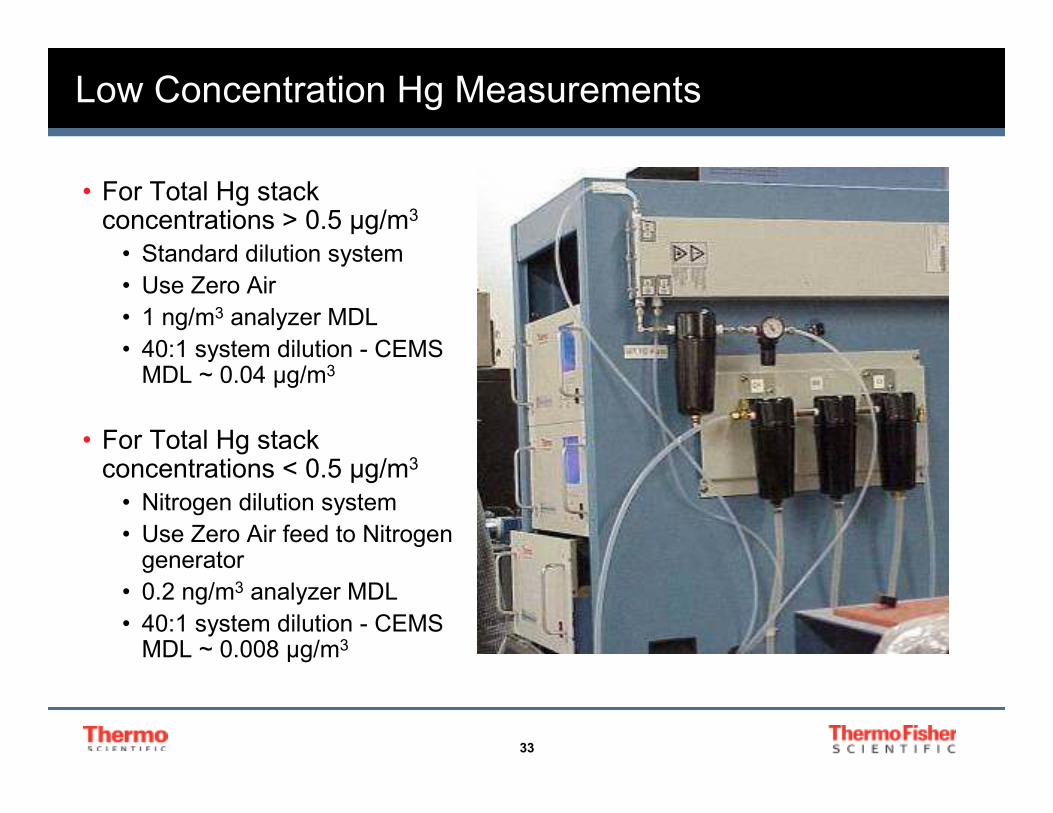
Low Concentration Hg Measurements
• For Total Hg stack concentrations > 0.5 µg/m3
• Standard dilution system
• Use Zero Air
• 1 ng/m3 analyzer MDL
• 40:1 system dilution - CEMS MDL ~ 0.04 µg/m3
• For Total Hg stack concentrations < 0.5 µg/m3
• Nitrogen dilution system
• Use Zero Air feed to Nitrogen generator
• 0.2 ng/m3 analyzer MDL
• 40:1 system dilution - CEMS MDL ~ 0.008 µg/m3
34
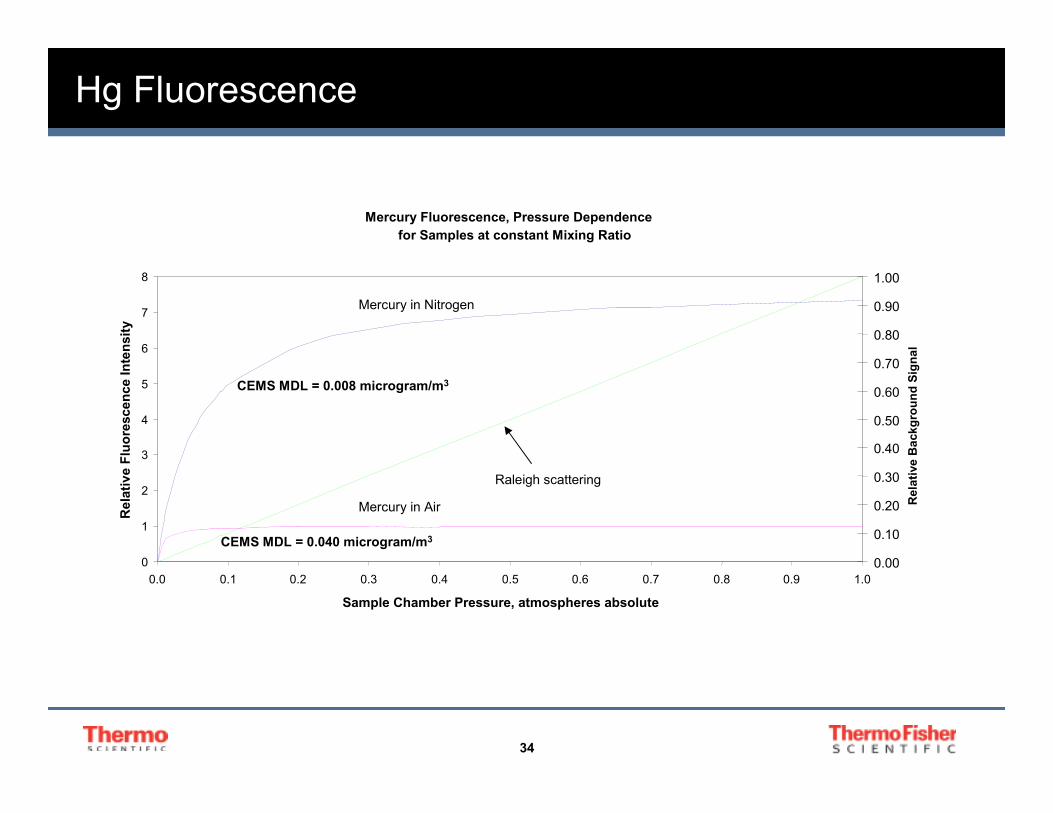
Hg Fluorescence
Mercury Fluorescence, Pressure Dependence
for Samples at constant Mixing Ratio
0
1
2
3
4
5
6
7
8
0.0 0.1 0.2 0.3 0.4 0.5 0.6 0.7 0.8 0.9 1.0
Sample Chamber Pressure, atmospheres absolute
Rela
tive F
luore
scence Inte
nsity
0.00
0.10
0.20
0.30
0.40
0.50
0.60
0.70
0.80
0.90
1.00
Rela
tive B
ackgro
und S
ignal
Mercury in Nitrogen
Mercury in Air
Raleigh scattering
CEMS MDL = 0.008 microgram/m3
CEMS MDL = 0.040 microgram/m3
35
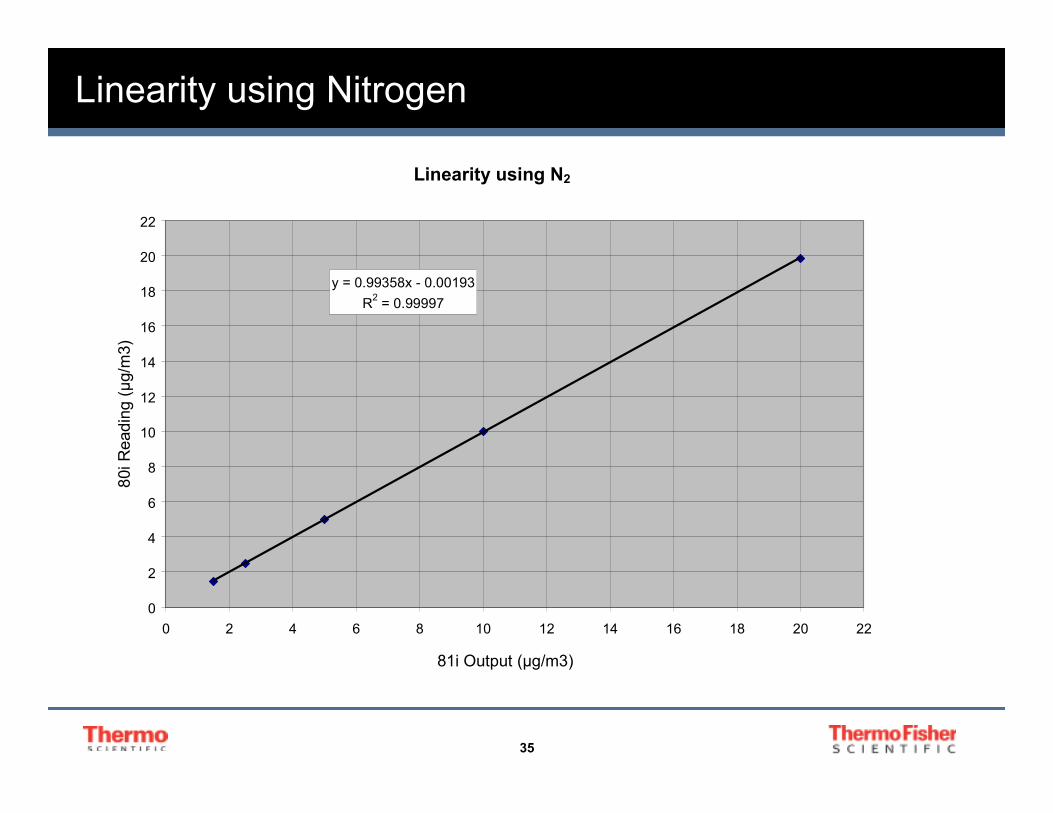
Linearity using Nitrogen
Linearity using N2
y = 0.99358x - 0.00193
R2 = 0.99997
0
2
4
6
8
10
12
14
16
18
20
22
0 2 4 6 8 10 12 14 16 18 20 22
81i Output (µg/m3)
80i Reading (µg/m3)
36
ICSET Nitrogen Dilution Testing 1/15/06
ICSET Nitrogen Dilution
1/15/07
0.0
0.5
1.0
1/15/2007
0:00
1/15/2007
1:12
1/15/2007
2:24
1/15/2007
3:36
1/15/2007
4:48
1/15/2007
6:00
1/15/2007
7:12
1/15/2007
8:24
1/15/2007
9:36
1/15/2007
10:48
1/15/2007
12:00
[HgT] m
icro
gra
m/m
3
37
Nebraska Public Power District Study- May 2008
• Cooperative Certification Preparation study performed
at Sheldon Station- NPPD
• Nitrogen Generators needed for low level monitoring.
• RATAs are still expensive, even Method 30B.
• Hg RATAs and Hg CEMS are still new to many people.
• We are showing all the test results, operational data,
good practices to help other users pass RATAs
38
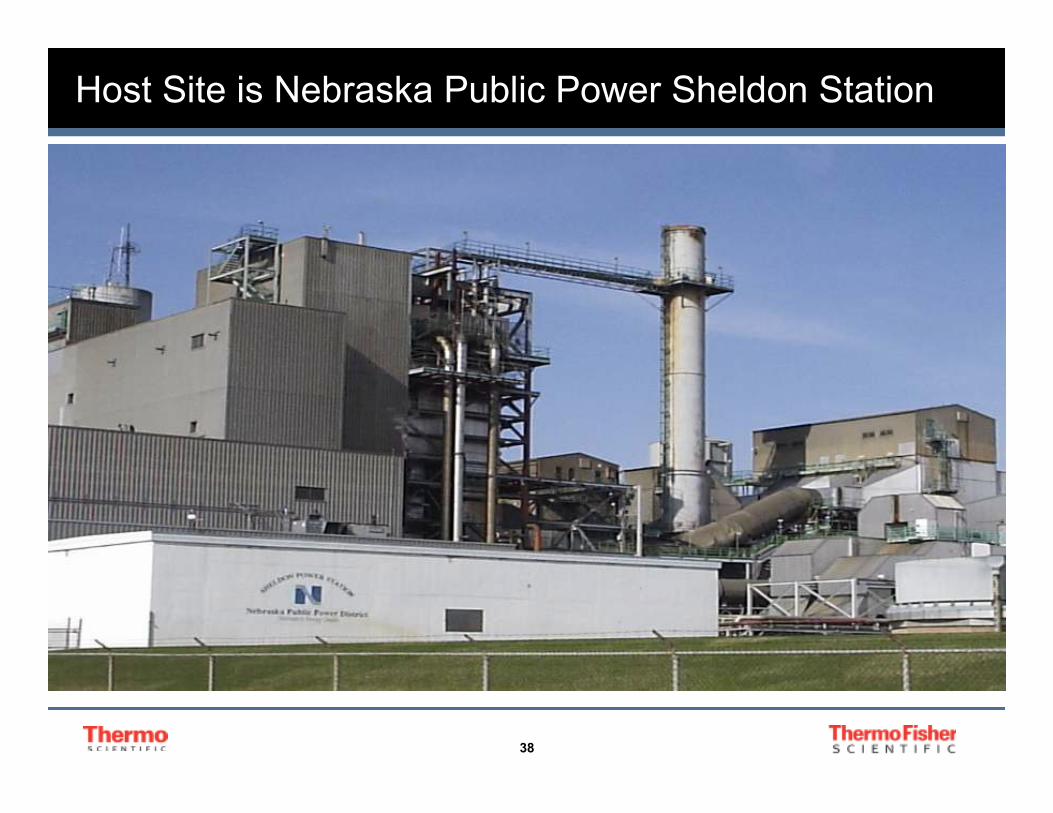
Host Site is Nebraska Public Power Sheldon Station
39
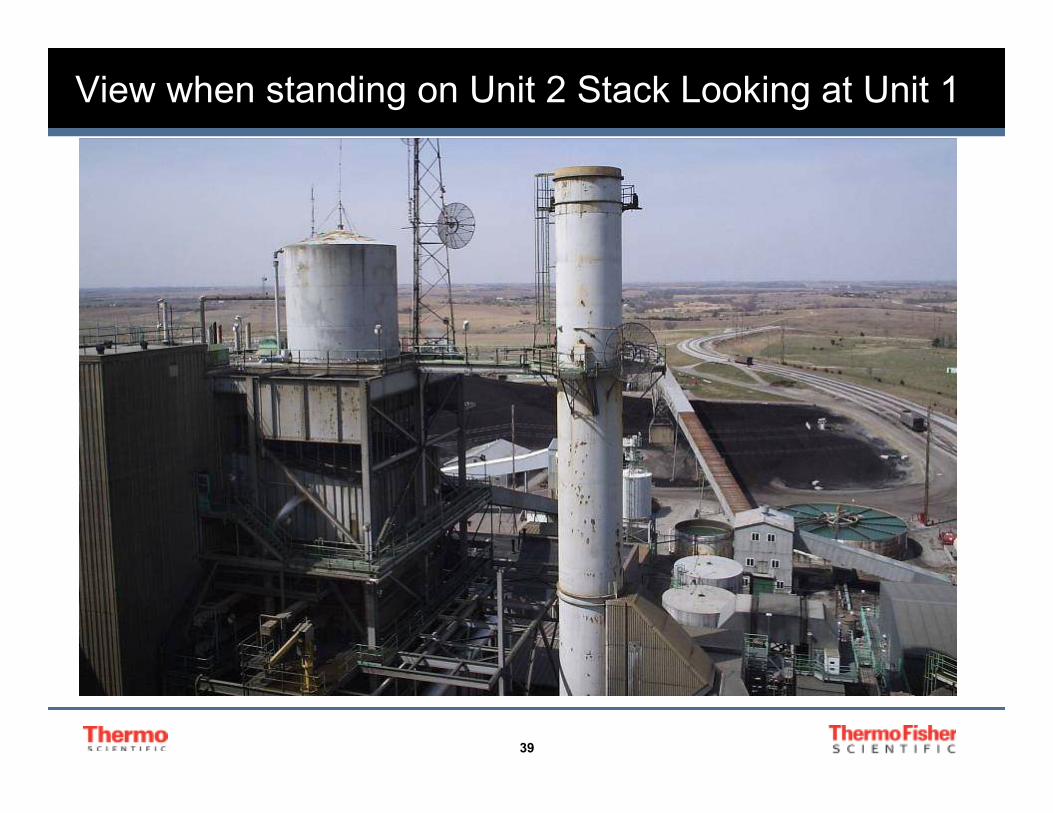
View when standing on Unit 2 Stack Looking at Unit 1
40
Sheldon Station Details
Sheldon Unit 1 (1963) - 120 MWg
Sheldon Unit 2 (1968) - 135 MWg
•Two units, each B&W boiler w/ 3-cyclones
•Hot-side precipitators added 1976.
•Pulse jet baghouses added 2000.
•No scrubbers or SCR
•PRB Coal for fuel
•Precipitators de-energized but still in gas stream to
capture large ash particles.
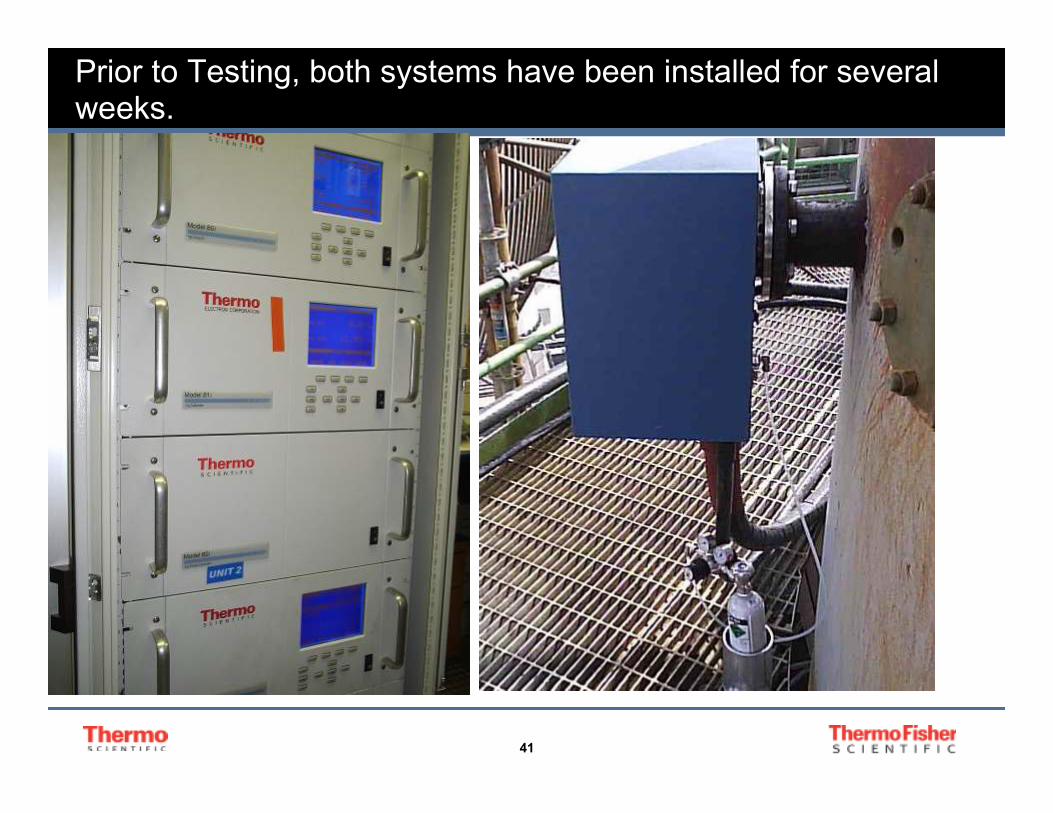
41
Prior to Testing, both systems have been installed for several weeks.
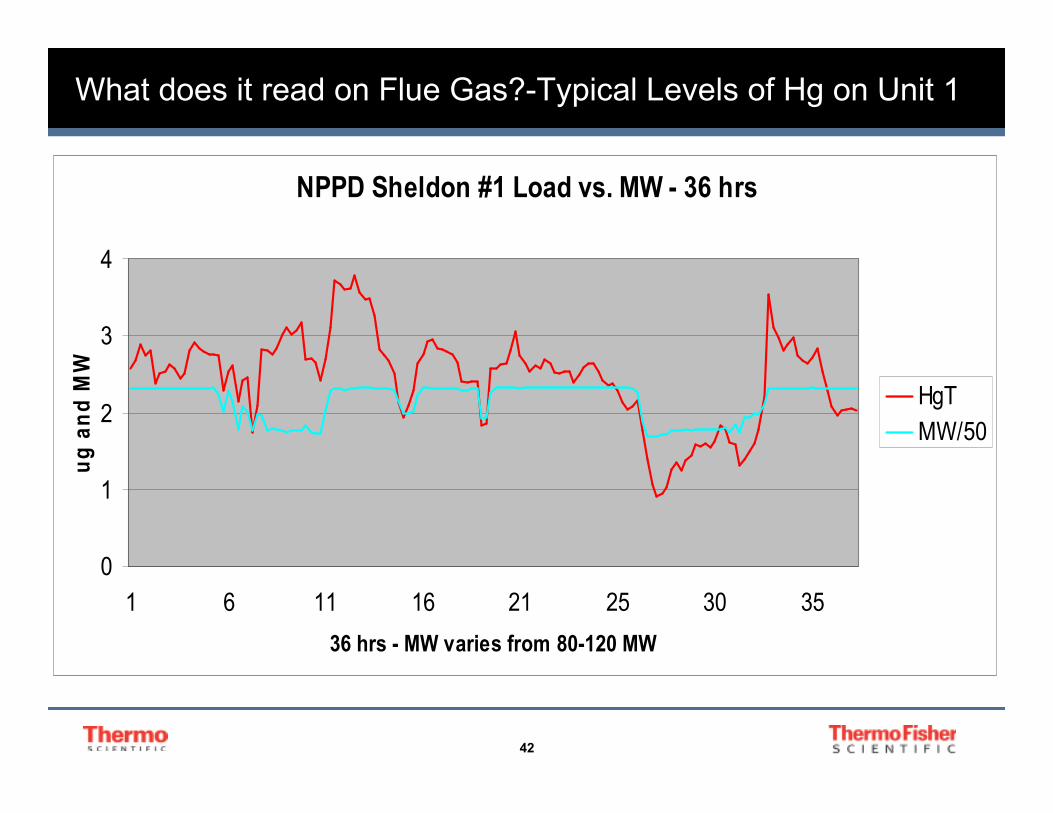
42
What does it read on Flue Gas?-Typical Levels of Hg on Unit 1
NPPD Sheldon #1 Load vs. MW - 36 hrs
0
1
2
3
4
1 6 11 16 21 25 30 35
36 hrs - MW varies from 80-120 MW
ug
an
d M
W
HgT
MW/50
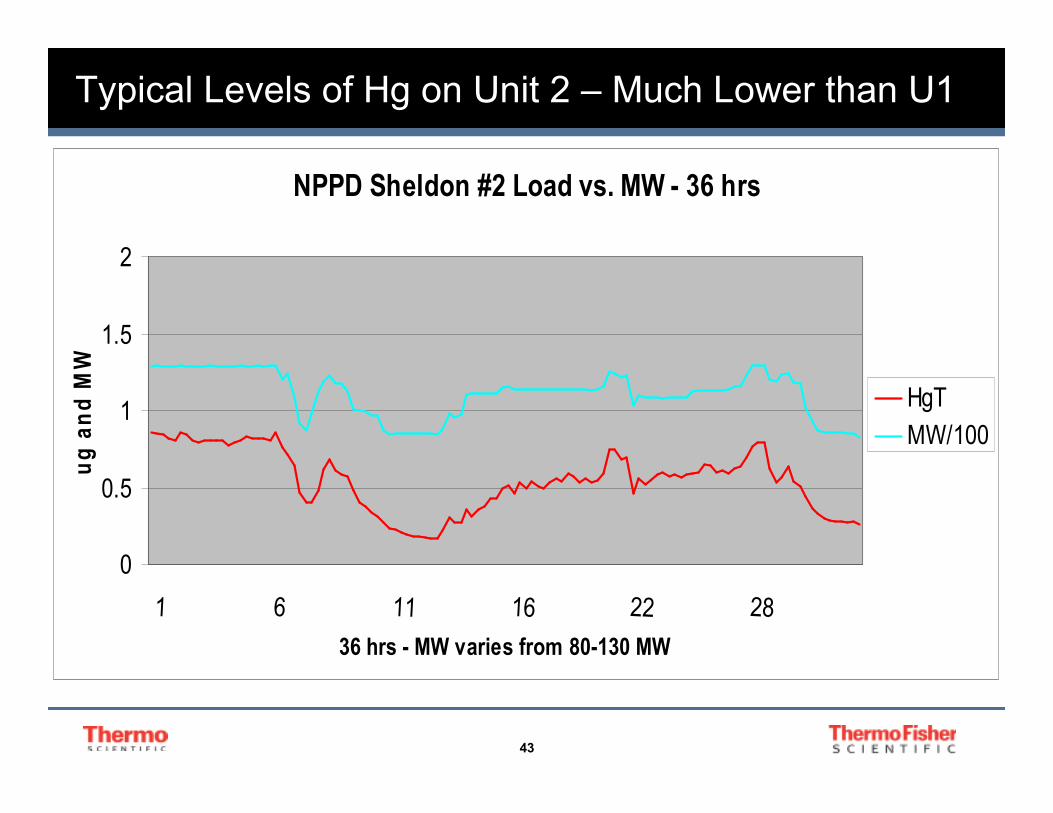
43
Typical Levels of Hg on Unit 2 – Much Lower than U1
NPPD Sheldon #2 Load vs. MW - 36 hrs
0
0.5
1
1.5
2
1 6 11 16 22 28
36 hrs - MW varies from 80-130 MW
ug
an
d M
W
HgT
MW/100
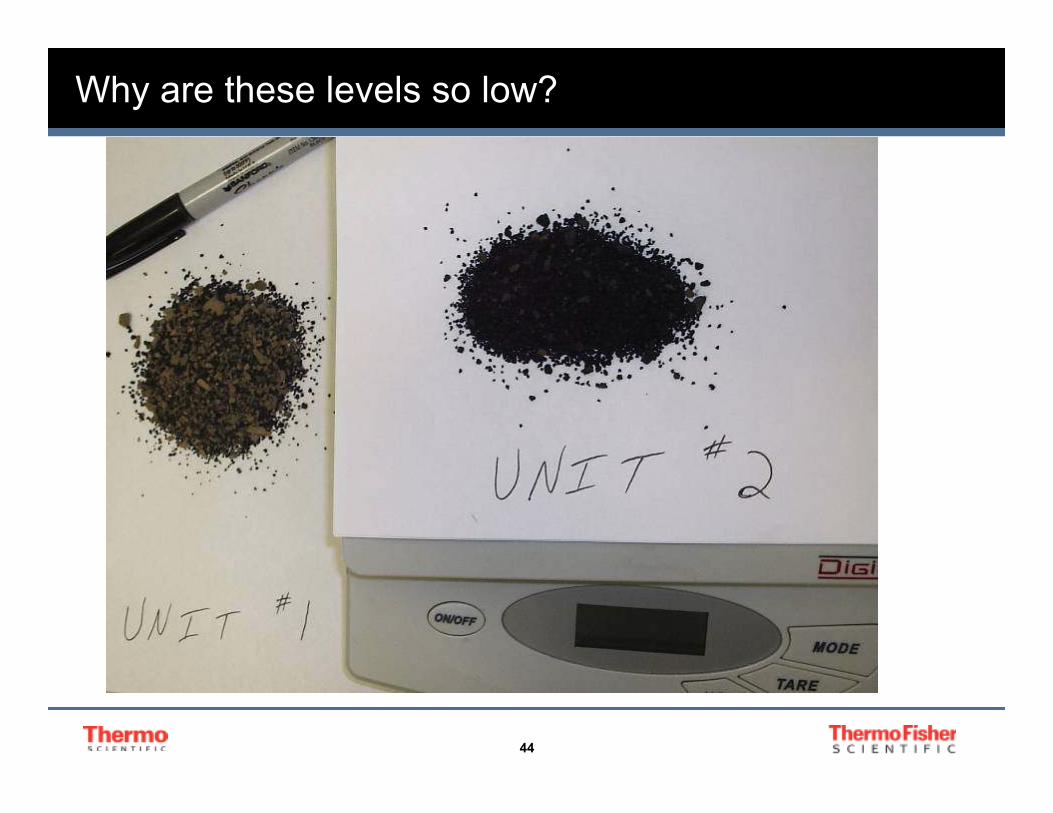
44
Why are these levels so low?
45
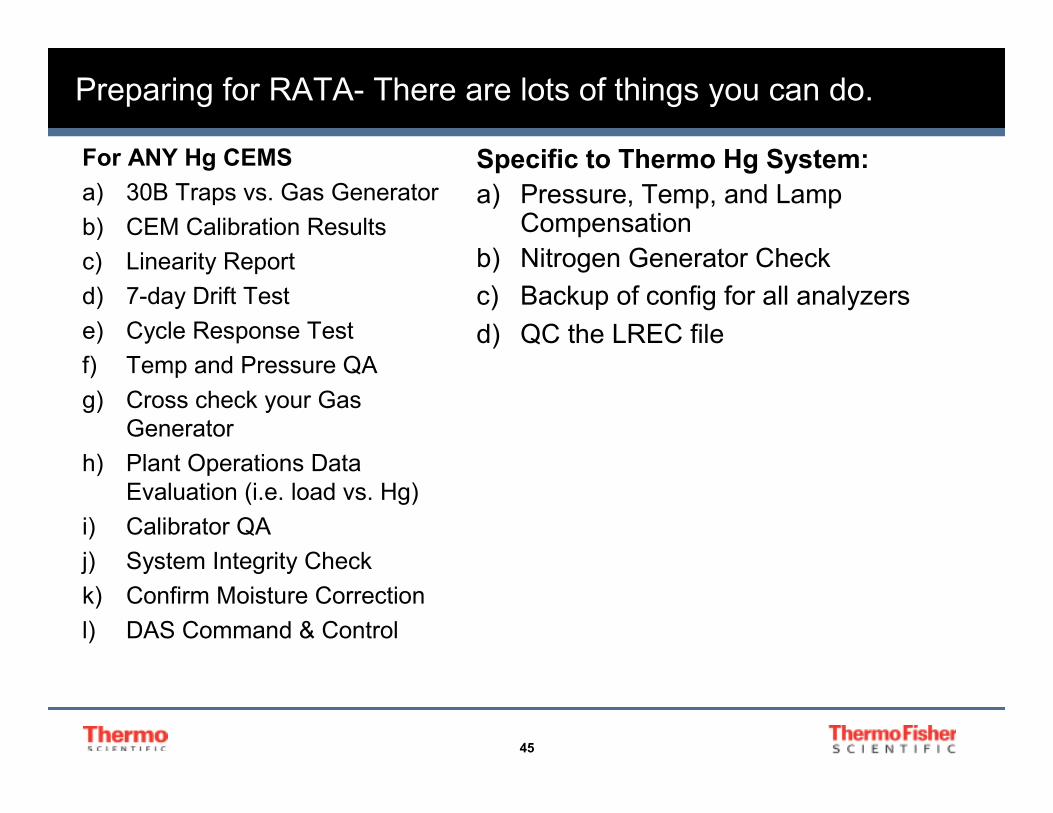
Preparing for RATA- There are lots of things you can do.
For ANY Hg CEMS
a) 30B Traps vs. Gas Generator
b) CEM Calibration Results
c) Linearity Report
d) 7-day Drift Test
e) Cycle Response Test
f) Temp and Pressure QA
g) Cross check your Gas
Generator
h) Plant Operations Data
Evaluation (i.e. load vs. Hg)
i) Calibrator QA
j) System Integrity Check
k) Confirm Moisture Correction
l) DAS Command & Control
Specific to Thermo Hg System:
a) Pressure, Temp, and Lamp Compensation
b) Nitrogen Generator Check
c) Backup of config for all analyzers
d) QC the LREC file
46
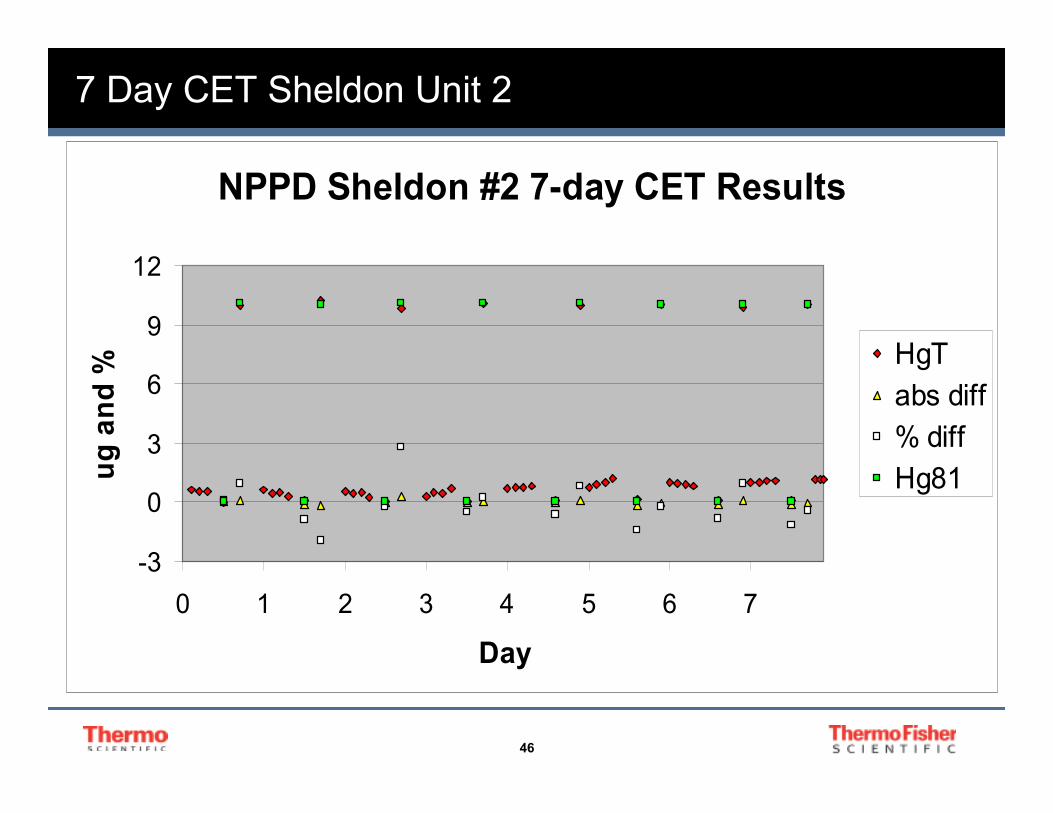
7 Day CET Sheldon Unit 2
NPPD Sheldon #2 7-day CET Results
-3
0
3
6
9
12
0 1 2 3 4 5 6 7
Day
ug a
nd %
HgT
abs diff
% diff
Hg81
47
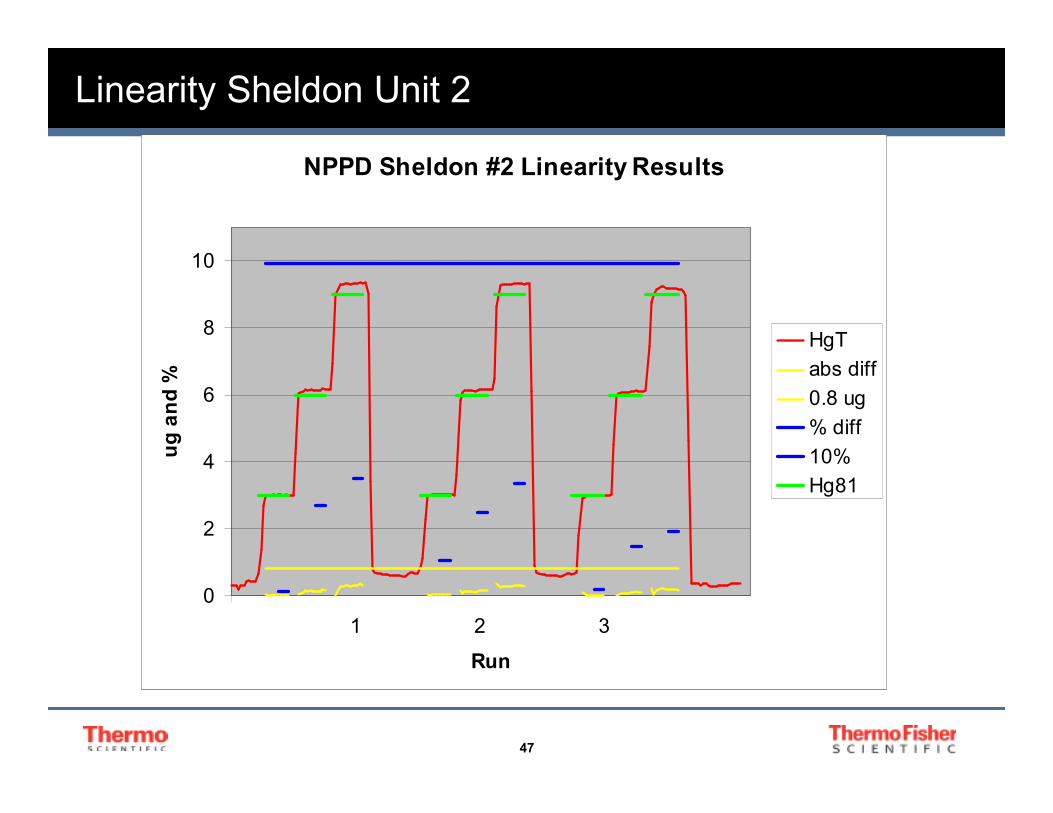
Linearity Sheldon Unit 2
NPPD Sheldon #2 Linearity Results
0
2
4
6
8
10
1 2 3
Run
ug a
nd %
HgT
abs diff
0.8 ug
% diff
10%
Hg81
48
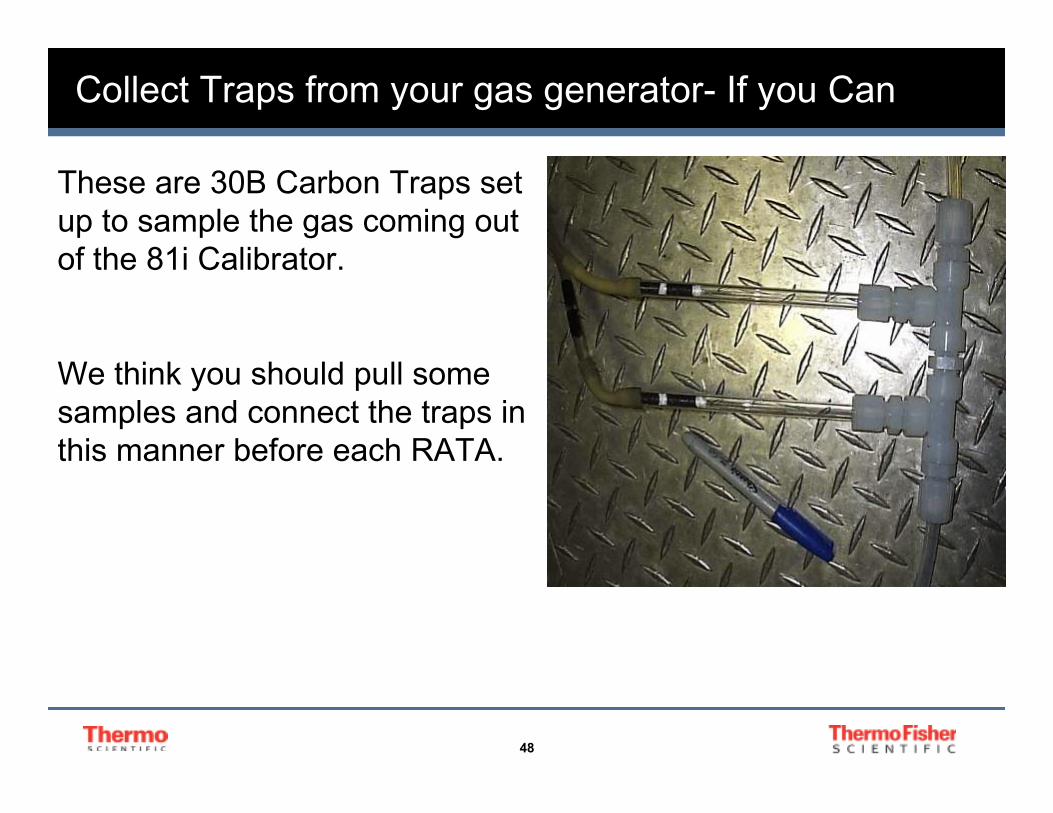
Collect Traps from your gas generator- If you Can
These are 30B Carbon Traps set
up to sample the gas coming out
of the 81i Calibrator.
We think you should pull some
samples and connect the traps in
this manner before each RATA.
49
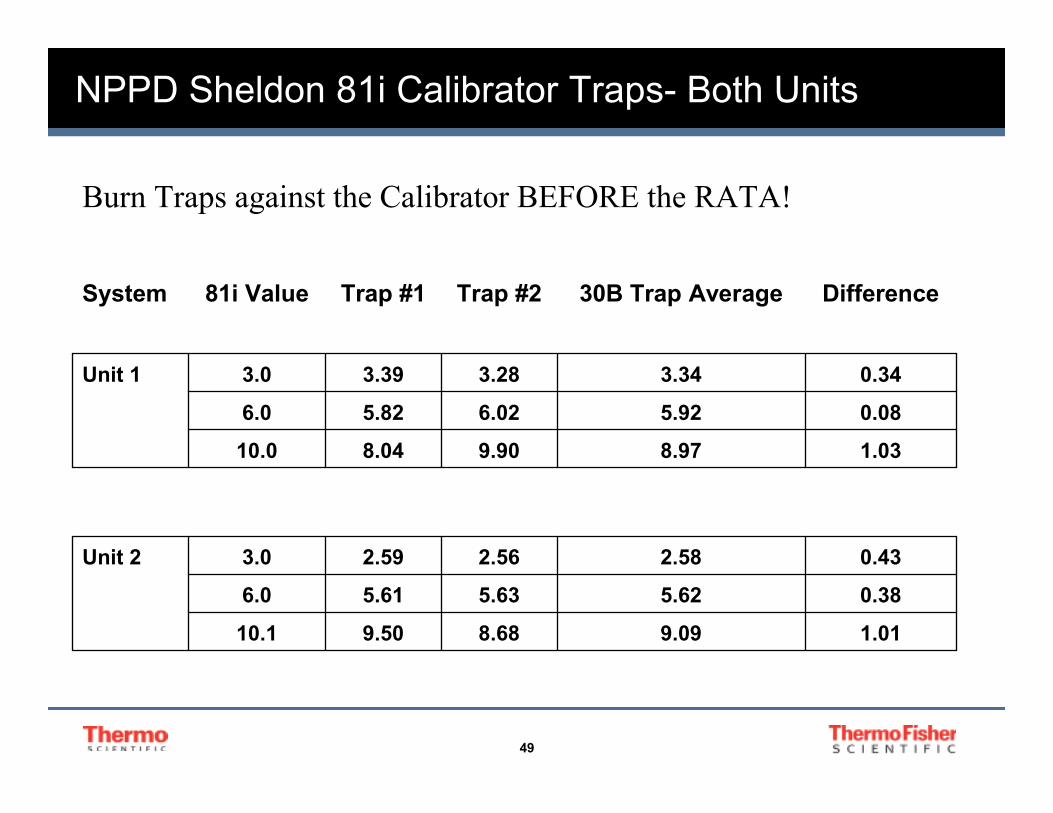
NPPD Sheldon 81i Calibrator Traps- Both Units
1.019.098.689.5010.1
0.385.625.635.616.0
0.432.582.562.593.0Unit 2
1.038.979.908.0410.0
0.085.926.025.826.0
0.343.343.283.393.0Unit 1
Difference30B Trap AverageTrap #2Trap #181i ValueSystem
Burn Traps against the Calibrator BEFORE the RATA!
50
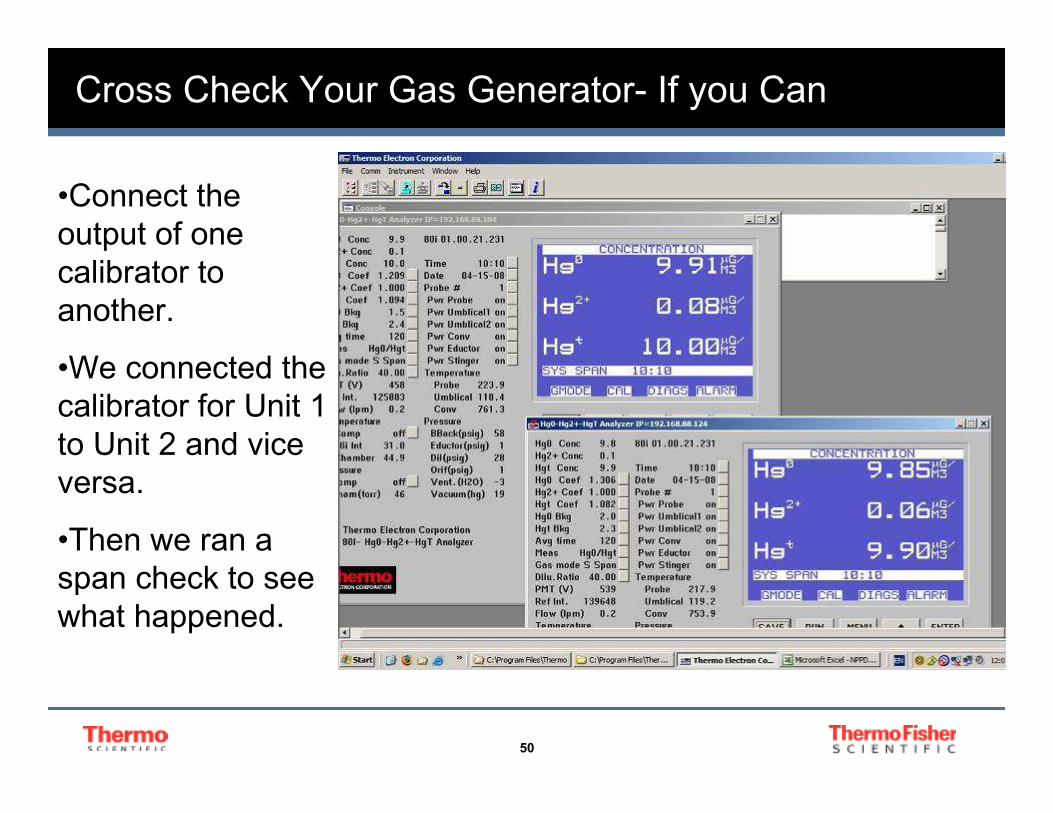
Cross Check Your Gas Generator- If you Can
•Connect the
output of one
calibrator to
another.
•We connected the
calibrator for Unit 1
to Unit 2 and vice
versa.
•Then we ran a
span check to see
what happened.
51
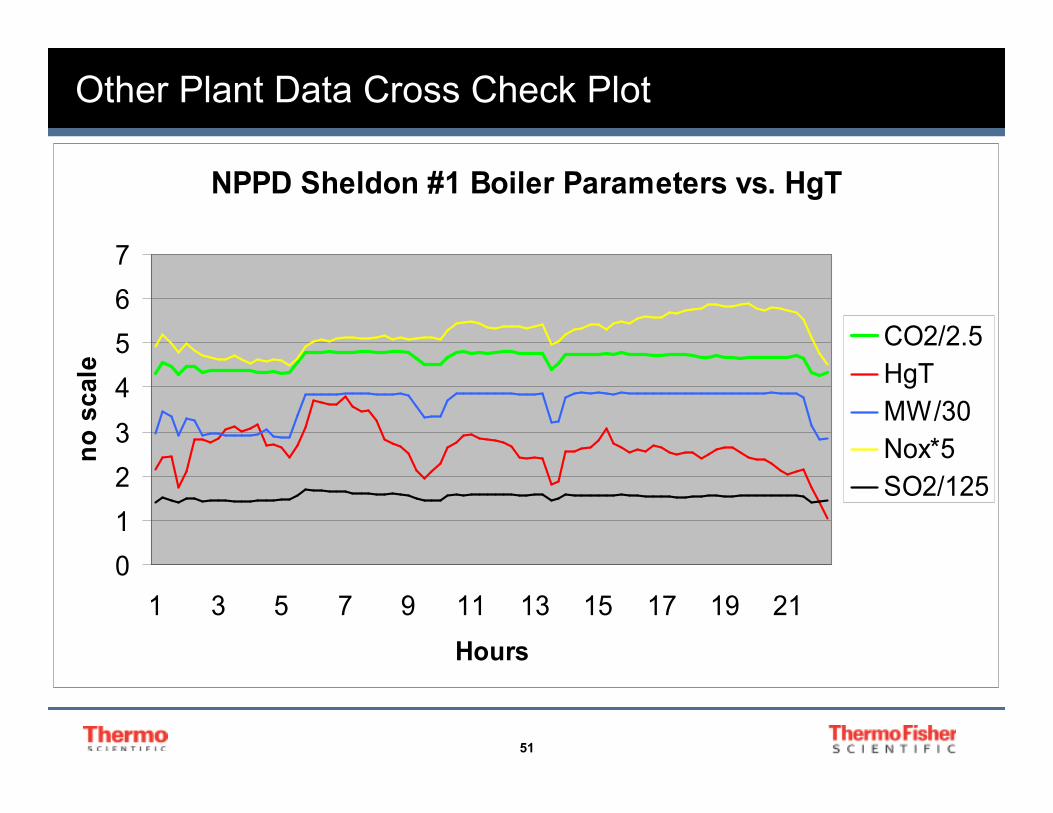
Other Plant Data Cross Check Plot
NPPD Sheldon #1 Boiler Parameters vs. HgT
0
1
2
3
4
5
6
7
1 3 5 7 9 11 13 15 17 19 21
Hours
no s
cale
CO2/2.5
HgT
MW/30
Nox*5
SO2/125
52
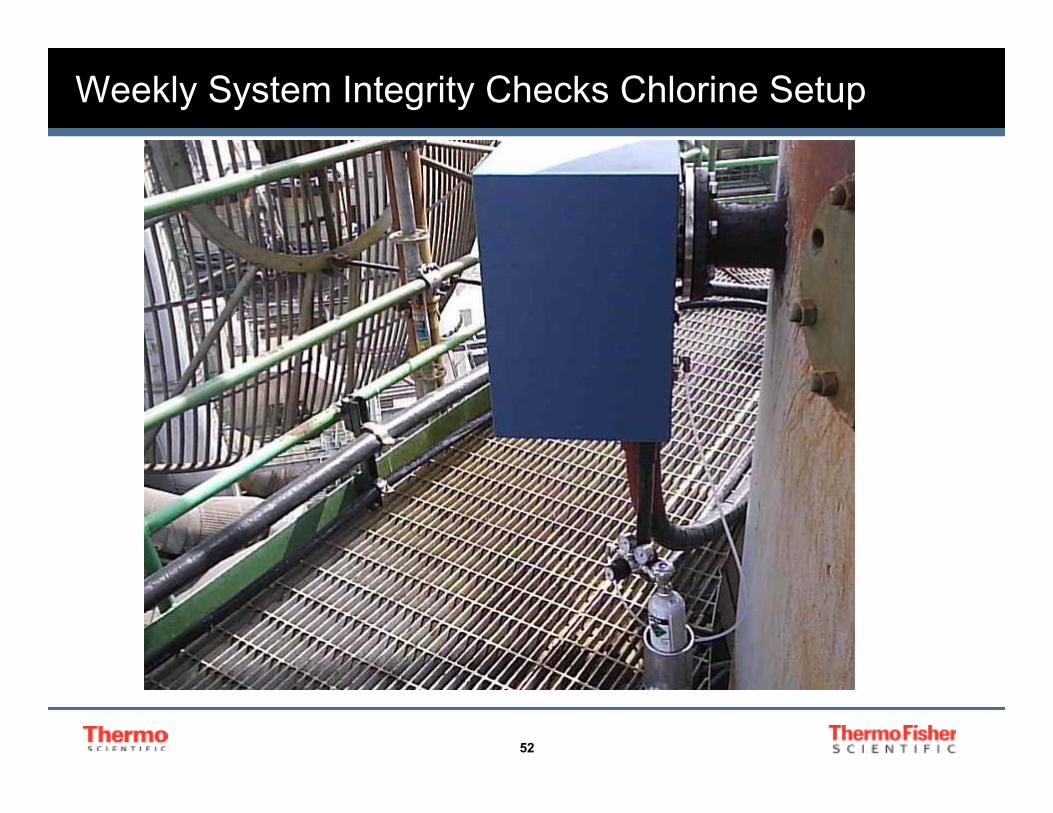
Weekly System Integrity Checks Chlorine Setup
53
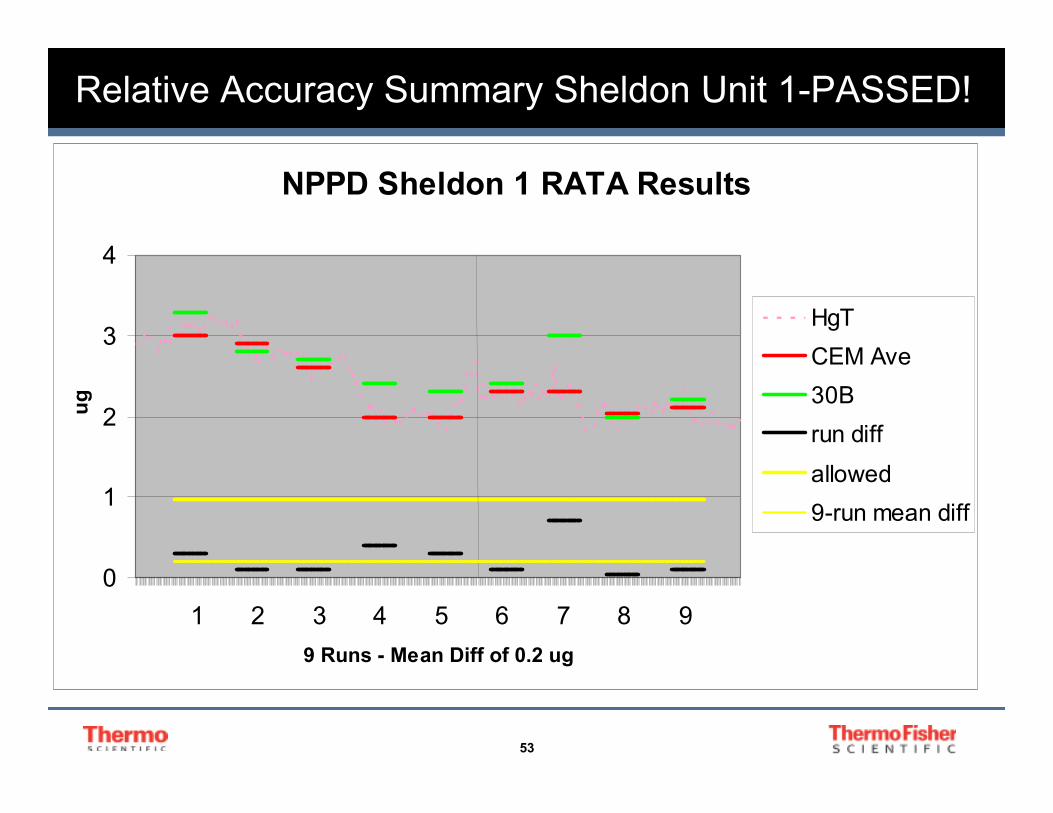
Relative Accuracy Summary Sheldon Unit 1-PASSED!
NPPD Sheldon 1 RATA Results
0
1
2
3
4
1 2 3 4 5 6 7 8 9
9 Runs - Mean Diff of 0.2 ug
u
g
HgT
CEM Ave
30B
run diff
allowed
9-run mean diff
54
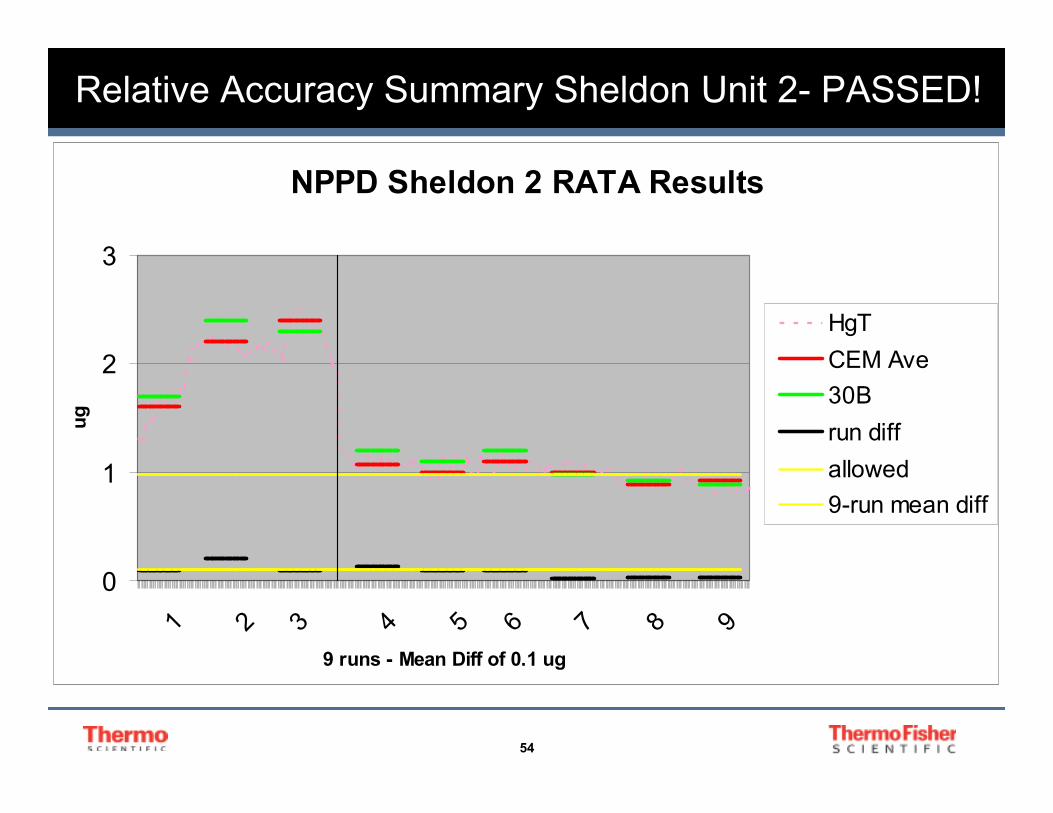
Relative Accuracy Summary Sheldon Unit 2- PASSED!
NPPD Sheldon 2 RATA Results
0
1
2
3
1 2 3 4 5 6 7 8 9
9 runs - Mean Diff of 0.1 ug
ug
HgT
CEM Ave
30B
run diff
allowed
9-run mean diff
55
RATA Challenges with Method 30B constraints
�Mercury Concentrations in the stack dropped from 2.4 to 0.9
ug/m3 during the 2-day period of the Unit 2 RATA.
�If the Hg concentration in the flue gas changes during the RATA,
one needs to ensure that 30B QA checks, specifically including
spike targets and permissible sample mass range, are within
tolerance. Even concentration changes that seem insignificant could
be very important.
�If the concentration had fallen another 0.2 ug, a new spike target
would have to be used, doubling the amount of QA testing
required.
56
RATA Challenges with Method 30B constraints- More
•The Method 30B QA of the trap is very specific to the initial
concentration values when choosing the sampling parameters.
•If the concentration values shift from the initial, one cannot
assume that the QA is valid. At lower concentrations, shifts have
a larger impact on staying within the boundaries of the method
QA limits.
•At concentrations just above 1.0 ug, paired train agreement can
be challenging.
57
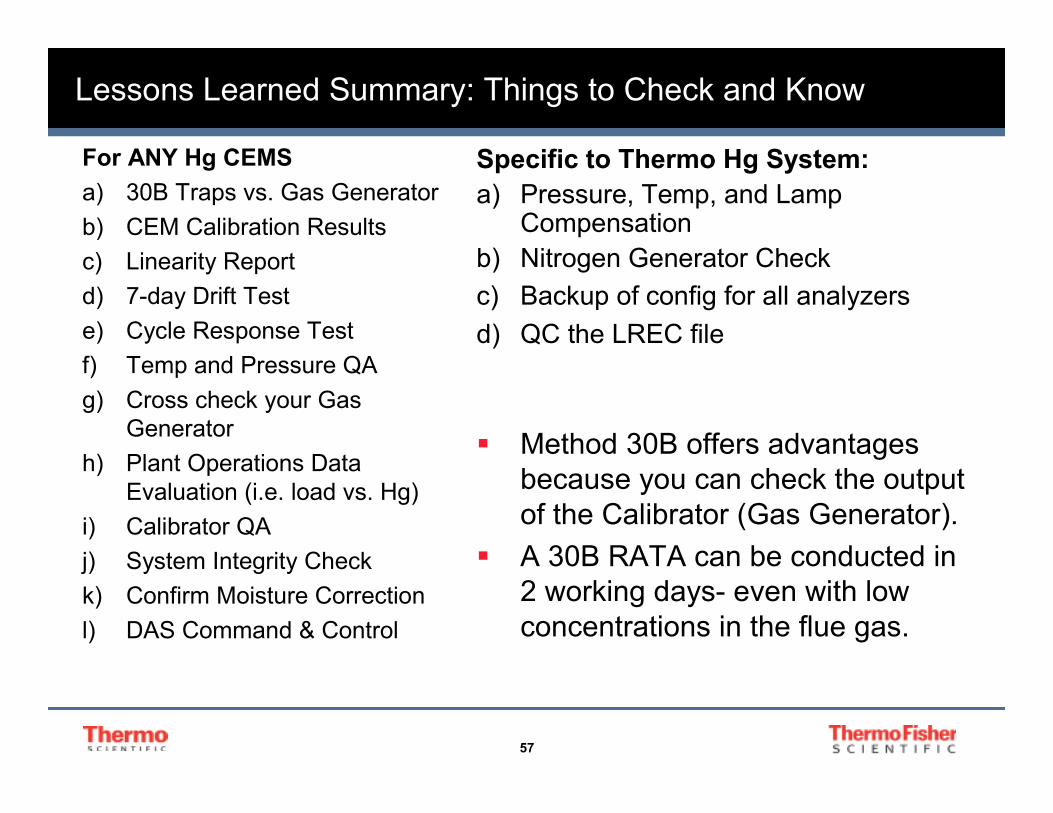
Lessons Learned Summary: Things to Check and Know
For ANY Hg CEMS
a) 30B Traps vs. Gas Generator
b) CEM Calibration Results
c) Linearity Report
d) 7-day Drift Test
e) Cycle Response Test
f) Temp and Pressure QA
g) Cross check your Gas
Generator
h) Plant Operations Data
Evaluation (i.e. load vs. Hg)
i) Calibrator QA
j) System Integrity Check
k) Confirm Moisture Correction
l) DAS Command & Control
Specific to Thermo Hg System:
a) Pressure, Temp, and Lamp Compensation
b) Nitrogen Generator Check
c) Backup of config for all analyzers
d) QC the LREC file
� Method 30B offers advantages
because you can check the output
of the Calibrator (Gas Generator).
� A 30B RATA can be conducted in
2 working days- even with low
concentrations in the flue gas.
58
Mercury FreedomTM System
� Thermo has been a key supplier of air pollution monitoring
solutions for 30+ years
� The Hg CEMS development is an extension of Thermo
experience and expertise
� Thermo-owned, proprietary technology affords a seamless
integration of components and ease of operation
� System is designed, engineered, manufactured, and supported
by Thermo Fisher Scientific
59
Thanks
Questions?