Maps and Tools for Level 1 Wetland Analysis · 2019-02-12 · 1980 2017 Problems with older NWI •...
25
Maps and Tools for Level 1 Wetland Analysis Nevada Wetlands Meeting Feb 7, 2019
Transcript of Maps and Tools for Level 1 Wetland Analysis · 2019-02-12 · 1980 2017 Problems with older NWI •...

Maps and Tools for Level 1 Wetland Analysis
Nevada Wetlands MeetingFeb 7, 2019

Map Sites/Regions Groups
PolygonsPresence/absenceClass types/attributes
300,000+
Management areasRiver systemMountain range
Hundreds – Thousands
Agency programsScientific campaigns
Several dozen

1980 2017
Problems with older NWI• Inconsistent levels of
detail• Redundant and displaced
features• Mislabeling
Extracted manually drawn polygons labeled as palustrine or lacustrine andscreened by perimeter/area
NWI

GSSURGO
Potential wetland soil landscapes (PWSL)
Percentile score
Modeled from horizon data

SSI
Spring Stewardship Initiative Database
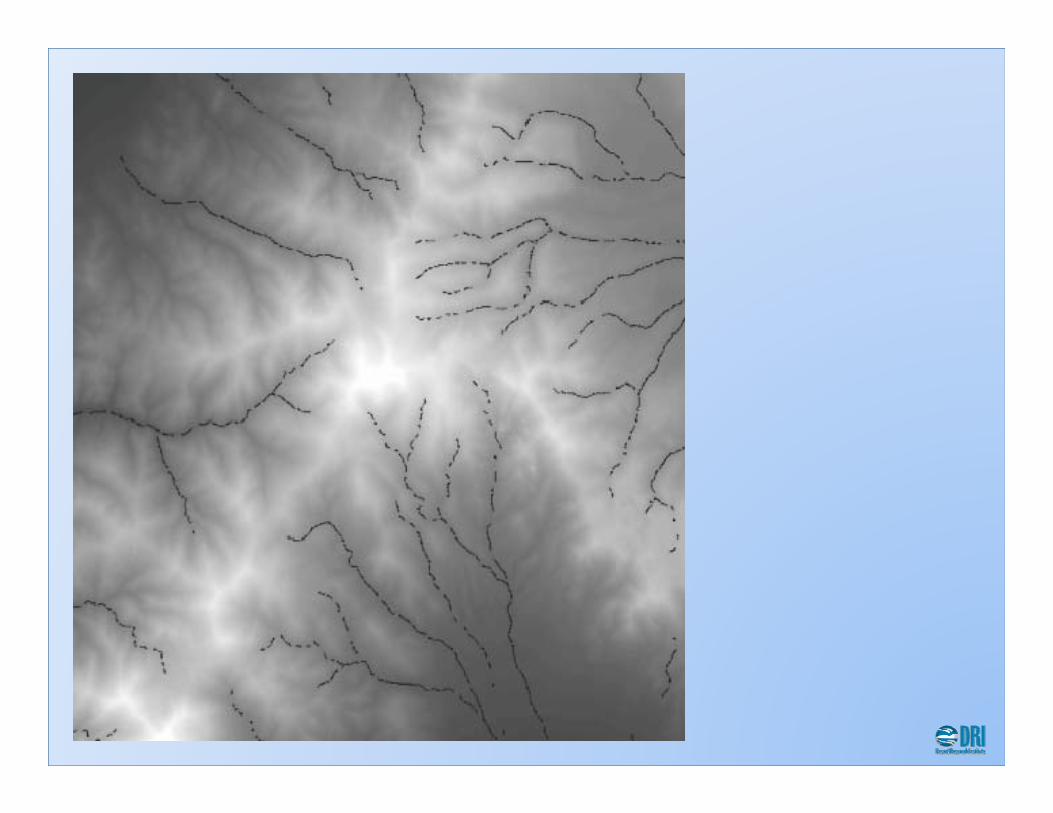
Region‐grow point data using Landsat

Waterbodies
Maps plus Landsat NDWI (5,2)

MRVN
Map of Riparian Vegetation for Nevada
Landsat‐based
Anomalous vegetativevigor in late summer
Supplemented with NHD perennial streams
Ag/Urban cropping

MRVNProducers 84.6%User’s 93.5%
LandFireProducers 37.5%User’s 23.1%

Additional sources:
• Chambers et al. wet meadows
• Nevada priority wetlands
• ???

Higher Quality IndicatorsNewer NWIMRVNDetected SSI pointsWaterbody Edges
Lower Quality IndicatorsOlder severely edited NWIGSSURGO
High 2+ indicators, at least 1 high qualityMedium 1 high quality indicatorLow 1 low quality indicator
Confidence


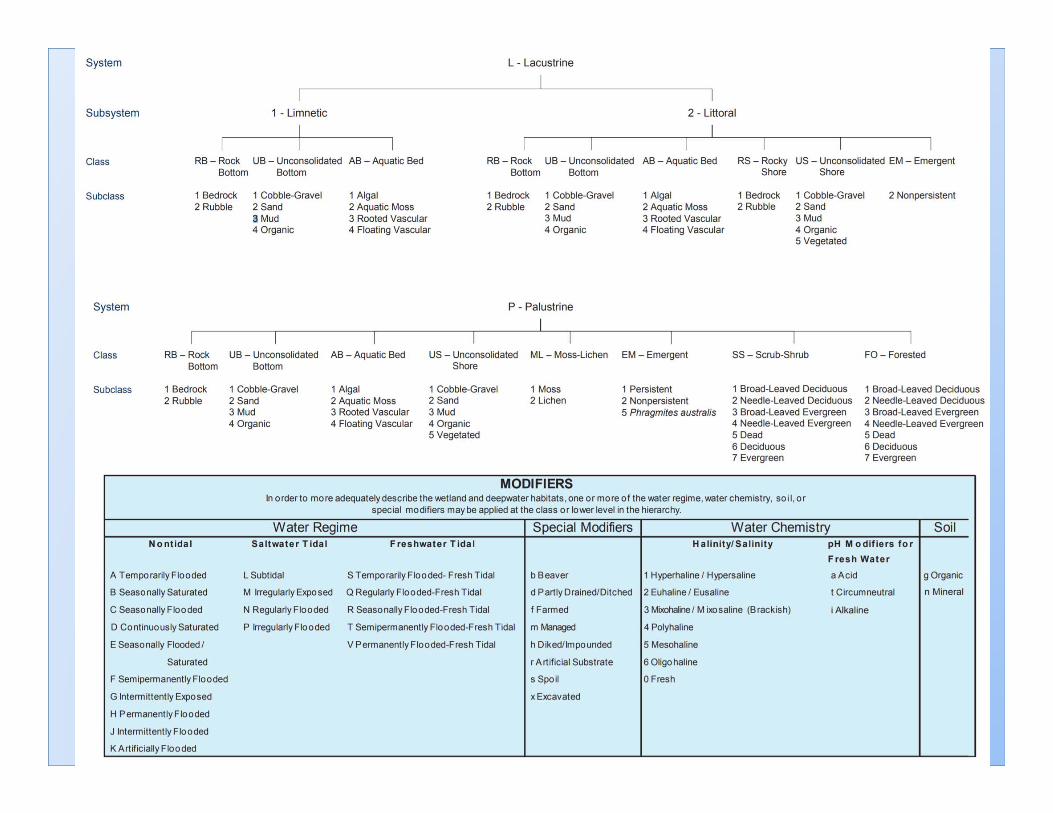
Taxonomy
What is appropriate or possible at level 1 right now?
Role of ‘riparian’

Level 1 Analysis
Map and image products provide:
‐ current understanding of what’s there now
‐ Context on the site relative to its surroundings
‐ Information on changes over time
‐ Information to aid planning of Level 2 activities

Data vs. InformationArcMap Wetlands Toolbar (WetBar)
• Dynamic datasets (Google Earth Engine)• Data management• One‐time calculation• Interpretive Tools

WETBAR

Level 1 Land cover
• SWReGap
• LandFire
Sufficient accuracy for this scale?Other sources?What neighborhood?

Hydrologic Boundaries
• NV State Engineer’s map
• HUC

What other maps or statistics to characterize
• Hydrology
• Ecological integrity
• ????
Dissemination
• Active community Sharepoint
• Static Earth Engine portal

Who else should we contact for data and feedback on level 1 products?

Test cases:
Send a shapefile or (lat/lon) for one or two study areas

Thank you