Mapping with Adobe CC
24
ArcGIS to Adobe Illustrator Created for DUSPViz by Luke Mich | Fall 2016
Transcript of Mapping with Adobe CC

ArcGIS to Adobe IllustratorCreated for DUSPViz by Luke Mich | Fall 2016
Mapping in Adobe | DUSPViz | Fall 2016 | Page 2
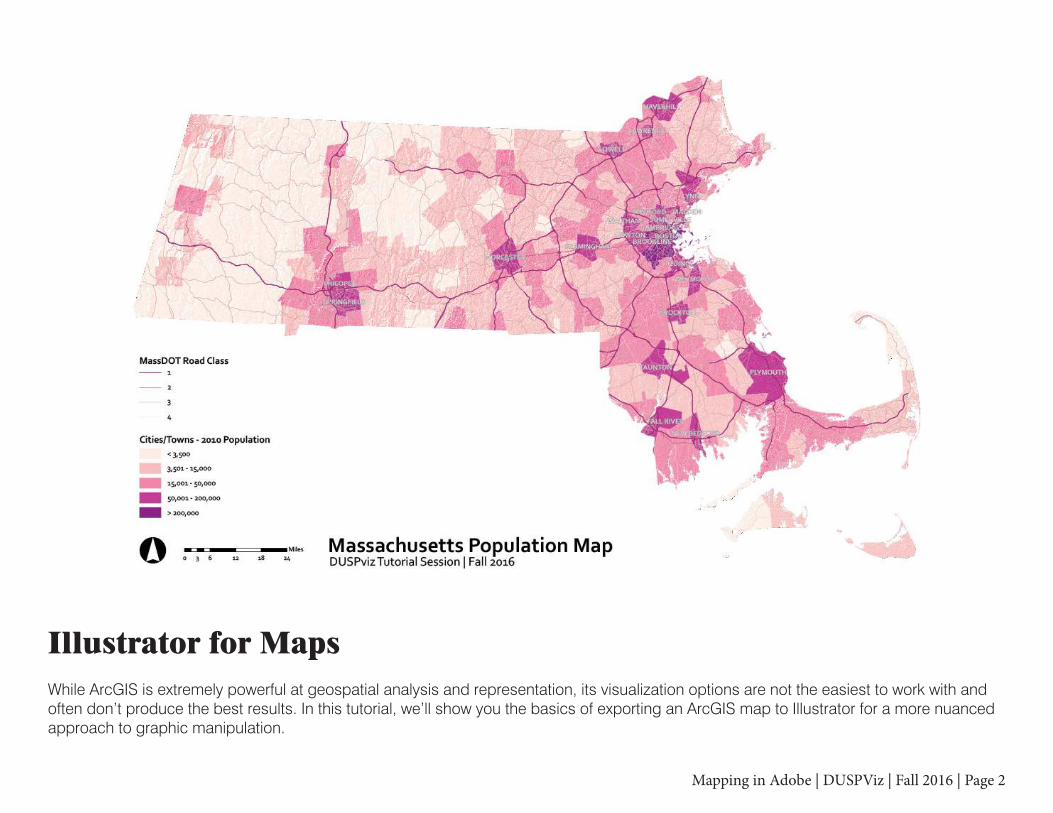
Illustrator for MapsWhile ArcGIS is extremely powerful at geospatial analysis and representation, its visualization options are not the easiest to work with and often don’t produce the best results. In this tutorial, we’ll show you the basics of exporting an ArcGIS map to Illustrator for a more nuanced approach to graphic manipulation.

Mapping in Adobe | DUSPViz | Fall 2016 | Page 3
Setting Up the MapStart by opening the Massachusetts.mxd file in ArcMap. This is a simple map with Massachusetts’ cities and towns symbolized by population and MassDOT roads symbolized by class. You’ll want to make sure that your map is properly symbolized in ArcMap before exporting. You’ll also want to ensure that none of your symbols have transparency, your line-types are all solid (no dashes or stripes), and your features are labelled (convert labels to annotations by right clicking on the layer in the ArcMap Table of Contents).
Mapping in Adobe | DUSPViz | Fall 2016 | Page 4
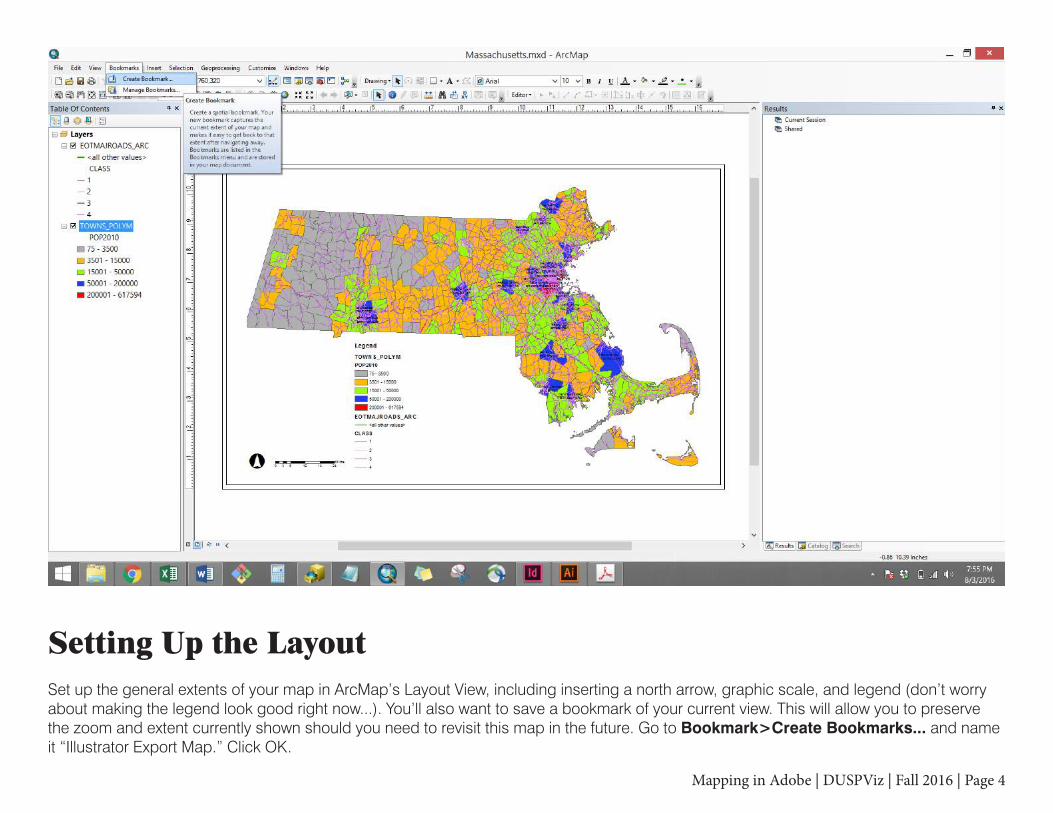
Setting Up the LayoutSet up the general extents of your map in ArcMap’s Layout View, including inserting a north arrow, graphic scale, and legend (don’t worry about making the legend look good right now...). You’ll also want to save a bookmark of your current view. This will allow you to preserve the zoom and extent currently shown should you need to revisit this map in the future. Go to Bookmark>Create Bookmarks... and name it “Illustrator Export Map.” Click OK.

Mapping in Adobe | DUSPViz | Fall 2016 | Page 5
Exporting the MapNext, go to File>Export Map... and select AI (*.ai) from the dropdown menu. Ensure “Destination” is set to “CMYK” under the “Format” tab, and name the file “Massachusetts.ai” - then click Save.

Mapping in Adobe | DUSPViz | Fall 2016 | Page 6
Opening the Exported MapWhen you open your newly exported map, you’ll likely be met with the above warning. Go ahead and click Update to update text formatting.

Mapping in Adobe | DUSPViz | Fall 2016 | Page 7
Cleaning the FileOpen up the Layers Panel. The “Other 2” layer contains our north arrow, legend, and scale bar. In the “Layers” Layer, “Other” contains our neatline (the black page border), “TOWNS...Anno” contains our annotation text, “EOT...” contains the roads, and “TOWNS_POLYM” contains the cities and towns polygons. You’ll also note that all layers contain clipping masks. We’ll need to remove these to get started. Select all the artwork (Ctrl + A) and go to Object>Clipping Mask>Release.

Mapping in Adobe | DUSPViz | Fall 2016 | Page 8
Cleaning the File (cont.)Our imported map also contains some unnecessary blank (and invisible) frames wrapping the edge of our page and hiding under our neatline. Using the Select (black arrow) tool, click and drage a selection window with the mouse to grab the edge of our page and the neatline. Then, while holding Shift, click on the neatline to remove it from the selection. Hit Delete.
Mapping in Adobe | DUSPViz | Fall 2016 | Page 9
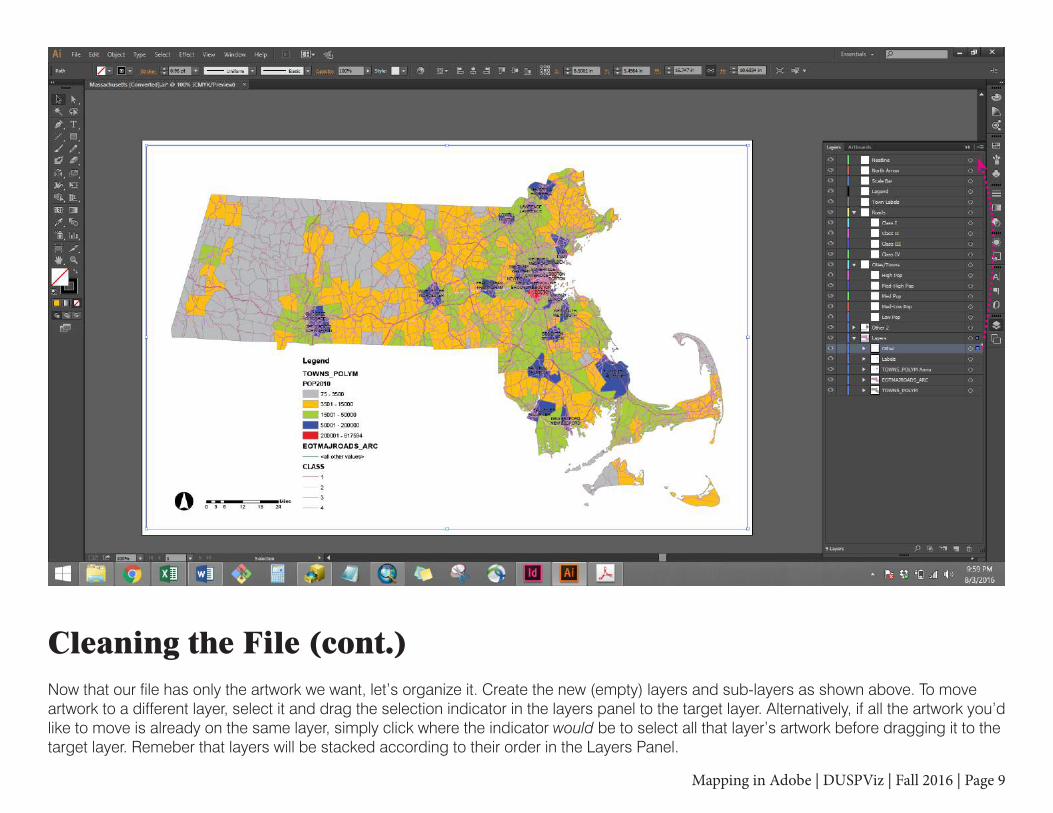
Cleaning the File (cont.)Now that our file has only the artwork we want, let’s organize it. Create the new (empty) layers and sub-layers as shown above. To move artwork to a different layer, select it and drag the selection indicator in the layers panel to the target layer. Alternatively, if all the artwork you’d like to move is already on the same layer, simply click where the indicator would be to select all that layer’s artwork before dragging it to the target layer. Remeber that layers will be stacked according to their order in the Layers Panel.

Mapping in Adobe | DUSPViz | Fall 2016 | Page 10
Cleaning the File (cont.)Once you’ve moved the easy artwork (neatline, north arrow, scale bar, labels), it’s time to move the symbolized shapes from ArcGIS. To select similar objects, click on one desired object (say, a gray-colored town polygon). Then, click the “Select Similar” button in the Control Panel. You can change what properties you intend to match by clicking the small arrow beside the button (choose “Fill” for our towns and “Stroke” for our roads). Then click and drag the selection indicator to the appropriate layer. Continue for the other symbolized shapes.

Mapping in Adobe | DUSPViz | Fall 2016 | Page 11
Changing Colors and StrokesNow that our file is rearranged, we can select particular layers to change their properties. Let’s turn off (eyeball symbol) the Roads and Labels layers so we can better see our Cities and Towns polygons. To adjust the color and stroke, click the selection indicator for the desired layer, and make adjustments in the Color or Stroke Panels. I’m using a color palette from Color Brewer (www.colorbrewer2.org) and converted all strokes to white and 0.25pt thickness.

Mapping in Adobe | DUSPViz | Fall 2016 | Page 12
Changing Colors and Strokes (cont.)For the Roads layers, I’ve elected to use the same colors for the strokes as the first (lightest) four polygon fill colors, but I boosted the black (K) value to 20 units to differentiate them from the polygons below. I’ve also adjusted the stroke widths to make the smaller roads thinner. You can stylize these (and the polygons from the previous page) however you’d like.

Mapping in Adobe | DUSPViz | Fall 2016 | Page 13
Changing Text LabelsSelect the contents of the “Labels” layer. Open the Character Panel (Window>Type>Character) and adjust the font and sizes to your liking. You may need to nudge the text in order for Illustrator to recognize the appropriate text sizes after import (with the text selected, click your keyboard’s up arrow once and down arrow once). You can also change the text color and add a stroke. Click and drag (or nudge via the keyboard arrows) to adjust the location of text on your map.

Mapping in Adobe | DUSPViz | Fall 2016 | Page 14
Adjusting the Legend and Adding a TitleNow we can adjust our legend. Click and drag the elements around to better align them (use the Align Panel when you can), change the font and text size, and rename the elements for legibility. Add a title on its own layer using the Text Tool.

Mapping in Adobe | DUSPViz | Fall 2016 | Page 15
Working with Raster DataIllustrator doesn’t work well with raster data exported directly from ArcMap, but we can use Photoshop as a workaround. Add the “relief_clip” data to your map, and change the symbology to be “streched” as shown above. (Note: if you already have raster data in your map file, you can simply turn it off before exporting to Illustrator to avoid problems.) Turn off the other layers so the relief data is isolated.
Mapping in Adobe | DUSPViz | Fall 2016 | Page 16
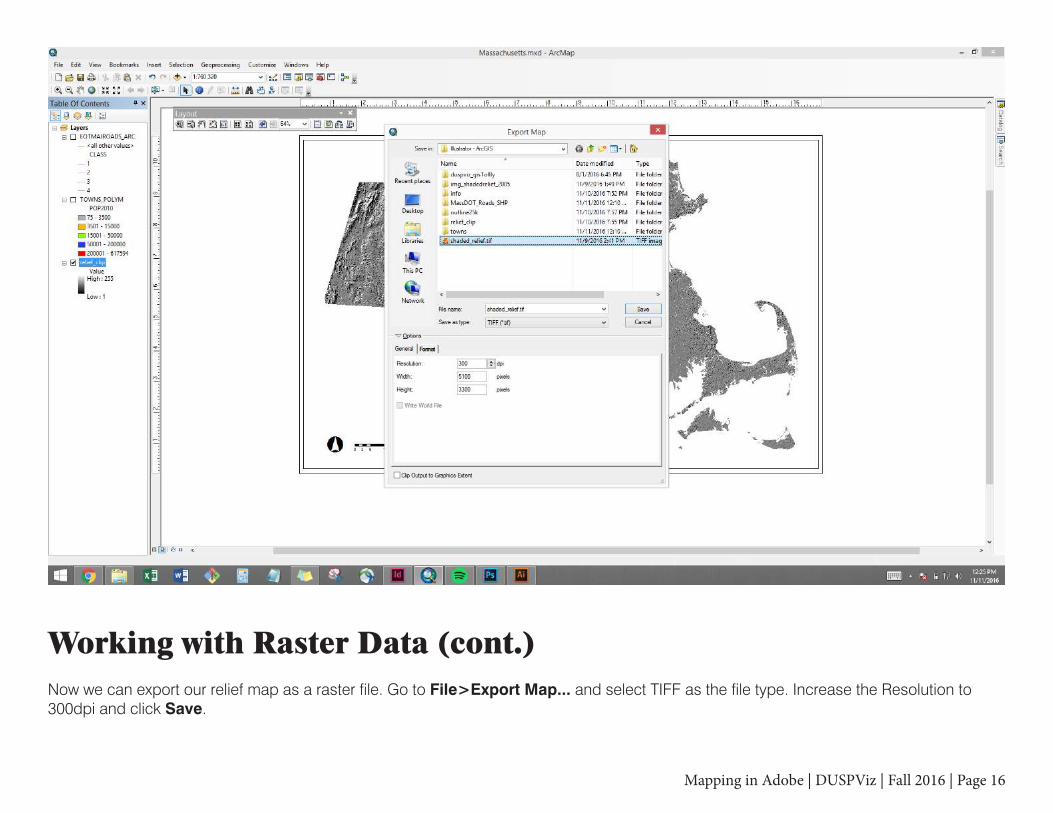
Working with Raster Data (cont.)Now we can export our relief map as a raster file. Go to File>Export Map... and select TIFF as the file type. Increase the Resolution to 300dpi and click Save.
Mapping in Adobe | DUSPViz | Fall 2016 | Page 17
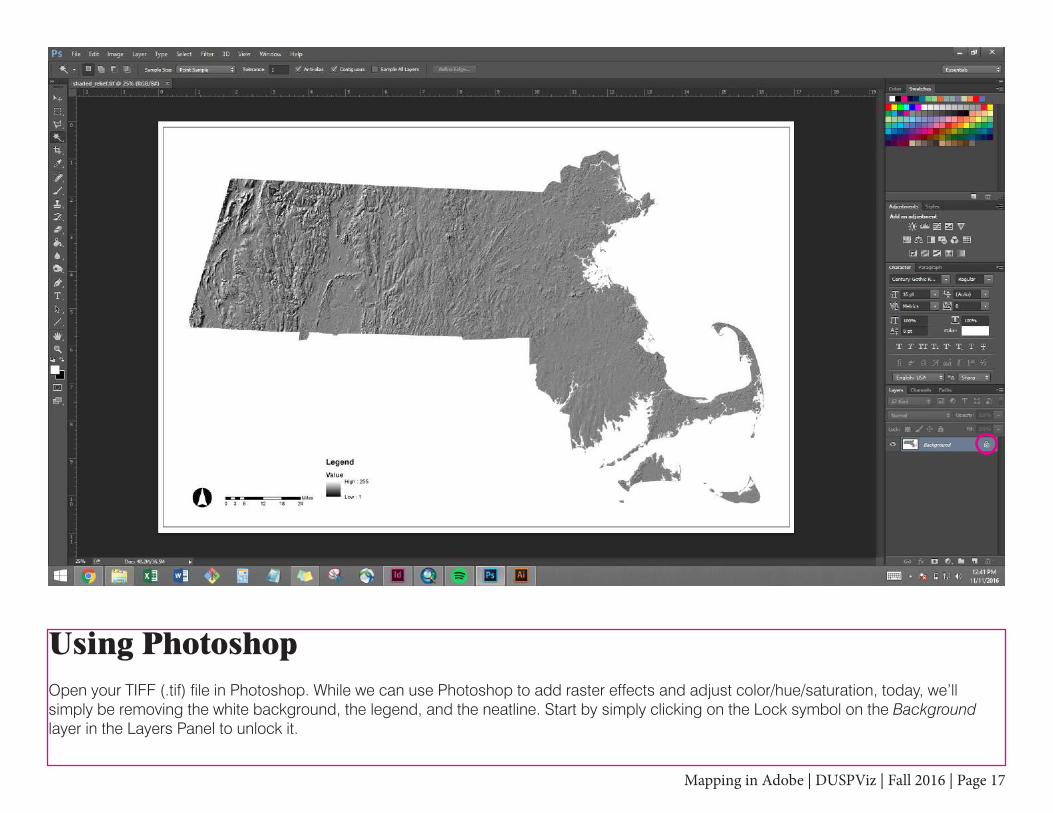
Using PhotoshopOpen your TIFF (.tif) file in Photoshop. While we can use Photoshop to add raster effects and adjust color/hue/saturation, today, we’ll simply be removing the white background, the legend, and the neatline. Start by simply clicking on the Lock symbol on the Background layer in the Layers Panel to unlock it.

Mapping in Adobe | DUSPViz | Fall 2016 | Page 18
Using Photoshop (cont.)To remove the white background, use the Magic Wand tool, ensure the “Contiguous” box is checked in the Control Panel, and click delete.

Mapping in Adobe | DUSPViz | Fall 2016 | Page 19
Using Photoshop (cont.)To remove the legend and neatline, select the Polygonal Lasso Tool and draw a rough outline around the relief map, being careful to exclude the items we want to remove. Then, go to Select>Inverse (or Ctrl/Cmd+Shift+I) to select the inverse of the shape we’ve drawn. Then click delete.

Mapping in Adobe | DUSPViz | Fall 2016 | Page 20
Using Photoshop (cont.)To save, go to File>Save As... and select Photoshop (.psd) as the file type. This will allow us to come back to this file to make any edits we need to. Name your file and click Save.

Mapping in Adobe | DUSPViz | Fall 2016 | Page 21
Combining Raster and Vector ArtworkBack in Illustrator, create a new layer just above our “Cities and Towns” layer. Then go to File>Place Linked* and select our Photoshop file. Click Place.
*Note: Older versions of Illustrator, like the one I’m using here, will include a “Link” option in the File>Place dialog instead.
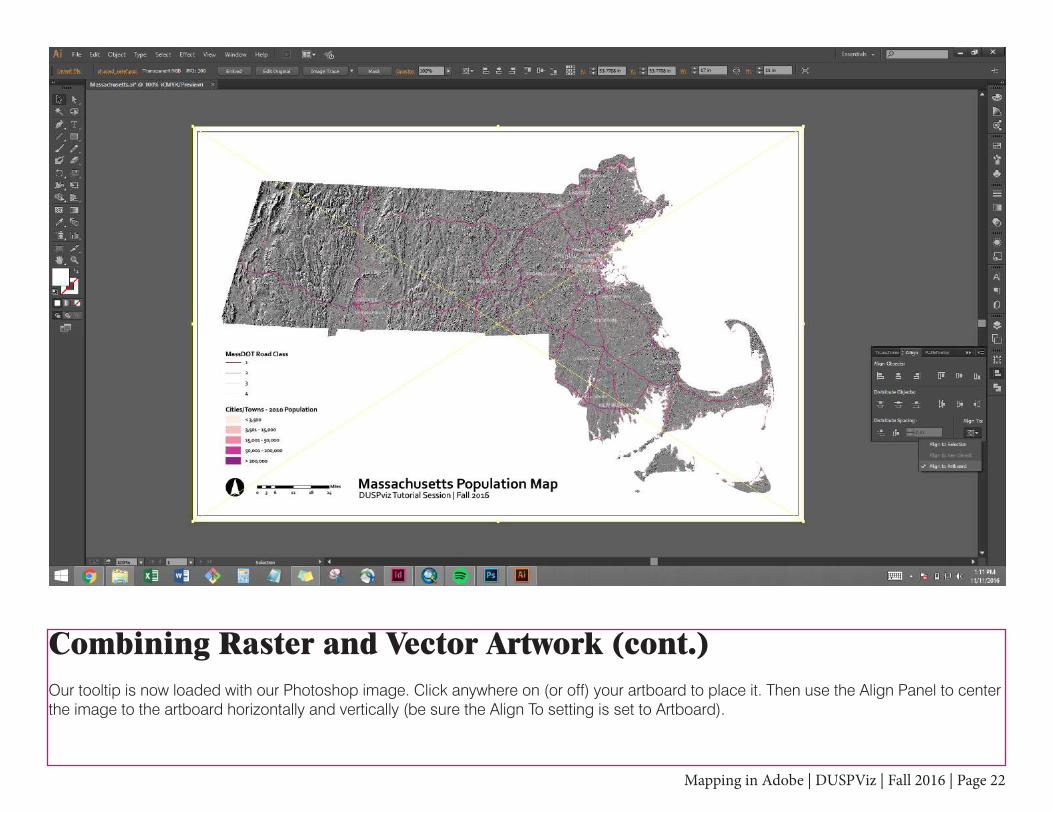
Mapping in Adobe | DUSPViz | Fall 2016 | Page 22
Combining Raster and Vector Artwork (cont.)Our tooltip is now loaded with our Photoshop image. Click anywhere on (or off) your artboard to place it. Then use the Align Panel to center the image to the artboard horizontally and vertically (be sure the Align To setting is set to Artboard).

Mapping in Adobe | DUSPViz | Fall 2016 | Page 23
Combining Raster and Vector Artwork (cont.)With our relief map still selected, open the Appearance Panel, click the Opacity link and set the Blend Mode to Overlay. You can leave the Opacity Percentage at 100%.

Mapping in Adobe | DUSPViz | Fall 2016 | Page 24
Finishing the MapBecause our Photoshop file has been placed as a link, any changes we make in that file will be updated in our Illustrator drawing - but be careful not to move either file in your folder structure or the link will be broken! Save your Illustrator file and then go to File>Save A Copy and change the file type to Adobe PDF (.pdf). Congrats - your map is finished!