Mapping the World's Changing Industrial Landscape
16
www.chathamhouse.org.uk briefing paper Mapping the World’s Changing Industrial Landscape Donald Hepburn International Economics | July 2011 | IE WIT BP 2011/01 Summary points The world’s industrial landscape has changed dramatically in the past 25 years. Industries have emerged, evolved and migrated to new countries. This transformation reflects the emergence of China, South Korea, India, Brazil, Mexico and other developing countries as major economic powers. This transformation has been driven by a combination of economic, political, demographic and environmental trends. Globalization has been a powerful enabler of the transformation, allowing freer trade and capital movement to unlock new sources of competitive advantage. Growing populations and incomes in developing countries will account for most of the rising global consumer spending. Larger workforces will also keep fuelling the developing world’s emergence, while rapid innovation may help the developed world to move up the value chain even as its pre-eminence is being challenged. The long-term impact of the economic crisis is not yet clear. Faster growth in the emerging industrial powers could further tilt the balance in their favour. The failure of laissez-faire policies to prevent the crisis may also encourage them to pursue more active industrial policies. However, the shift of industry to developing countries could be slowed by increased transport costs, changes in exchange rates and a backlash against globalization in developed countries if growth proves elusive and unemployment stays high. The World’s Industrial Transformation Series
Transcript of Mapping the World's Changing Industrial Landscape
www.chathamhouse.org.uk
briefing paper
Mapping the World’s Changing Industrial LandscapeDonald Hepburn
International Economics | July 2011 | IE WIT BP 2011/01
Summary points The world’s industrial landscape has changed dramatically in the past 25 years.
Industries have emerged, evolved and migrated to new countries. This transformation reflects the emergence of China, South Korea, India, Brazil, Mexico and other developing countries as major economic powers.
This transformation has been driven by a combination of economic, political, demographic and environmental trends. Globalization has been a powerful enabler of the transformation, allowing freer trade and capital movement to unlock new sources of competitive advantage.
Growing populations and incomes in developing countries will account for most of the rising global consumer spending. Larger workforces will also keep fuelling the developing world’s emergence, while rapid innovation may help the developed world to move up the value chain even as its pre-eminence is being challenged.
The long-term impact of the economic crisis is not yet clear. Faster growth in the emerging industrial powers could further tilt the balance in their favour. The failure of laissez-faire policies to prevent the crisis may also encourage them to pursue more active industrial policies.
However, the shift of industry to developing countries could be slowed by increased transport costs, changes in exchange rates and a backlash against globalization in developed countries if growth proves elusive and unemployment stays high.
The World’s Industrial Transformation Series
www.chathamhouse.org.uk
page
2
Mapping the World’s Changing Industrial Landscape
IntroductionOver the past 25 years there has been a remarkably rapid transformation in the industrial landscape world-wide. Much production has moved to emerging countries, particularly China, as low wages, lower trade barriers and transport costs have transformed the economics of many industries. New industries based around innovations in IT, biotechnology and new materials are growing fast. Climate change and rising commodity prices are also stimulating the development of new technologies and industries. Many industries have fragmented as value chains have been broken up and their constituent parts outsourced. Big companies based in emerging countries (such as Sinopec, China Mobile, Dongfeng Motor, Lenovo, Haier, Tata, Reliance Industries, Vale) are increasingly challenging multinational companies from developed countries.
All of these trends were accompanied, at least until 2008, by remarkable economic growth, interrupted only by three glitches – in the early 1990s, in the Asian crisis of 1997/98 and in the bursting of the IT bubble in 2001/02. Though unnerving at the time, these proved to be short-term downturns after which rapid growth resumed.
With hindsight, it is clear that this was at the cost of a much sharper recession in 2008/09 as the bubble caused by excessive liquidity, lending, consumption and specula-tion burst and the financial system had to be rescued. The economic crisis left developed countries with much higher public debt and hit countries specializing in industries for which demand was elastic. It also raised important ques-tions about the ability of laissez-faire policies to deliver sustainable growth. Looking ahead, it is necessary to consider whether countries may move away from hands-off reliance on markets towards more state-driven policies and controls.
To address these issues, Chatham House has under-taken a research project that aims to see how the industrial landscape might change by 2020. This is a huge research topic, raising fundamental questions about the causes of
economic development. This brief paper can do no more than present a general framework which traces some of the changes in the world’s industrial landscape over the past 25 years, sets out the research question and provides an overview of the drivers of these trends and how they might develop. Five further papers present detailed case studies of industries that might be growth drivers in future. A final publication will draw out some common threads and suggest how the industrial landscape may change in the next decade.
The historical contextThe opening of the world economy since the Second World War has accelerated over the past 25 years through international trade rounds, the development of interna-tional capital markets, the spread of multinationals and the flow of ideas around the world. This has transformed the world’s economic structure.
Before looking at which industries have driven growth, it is worth noting that industry has been a less important driver of growth than services.1 Industry’s share of world value added fell from 35% in 1985 to 27% in 2008 while over the same period services increased their share from 59% to 70%. This trend is, however, being driven by high-income countries which still account for a large share of world GDP. Disaggregating by income, all groups show services gaining share but only the high-income group shows a falling share for industry. The middle-income group shows a more or less constant share for industry, while the low-income group shows a rising share. All three groups show a declining share for agriculture.
It should be noted, however, that these trends do not show the impact of the economic crisis. A Chatham House paper observed that ‘most countries suffered big losses in industrial output – down 15% or more during the early-2009 trough’,2 although they have bounced back since. Services were less affected – in Japan, for instance, they fell by about 7% while industrial production, which is heavily dependent on exports, plunged 35%.3
1 According to a recent UNIDO report, ‘this can be explained by the decrease in relative prices of consumption goods, in conjunction with the simultaneous
growth of demand for services with higher income elasticity’, UNIDO (2010).
2 Rossi (2009).
3 However, a strengthening yen was probably a contributory factor.
www.chathamhouse.org.uk
page
3
Mapping the World’s Changing Industrial Landscape
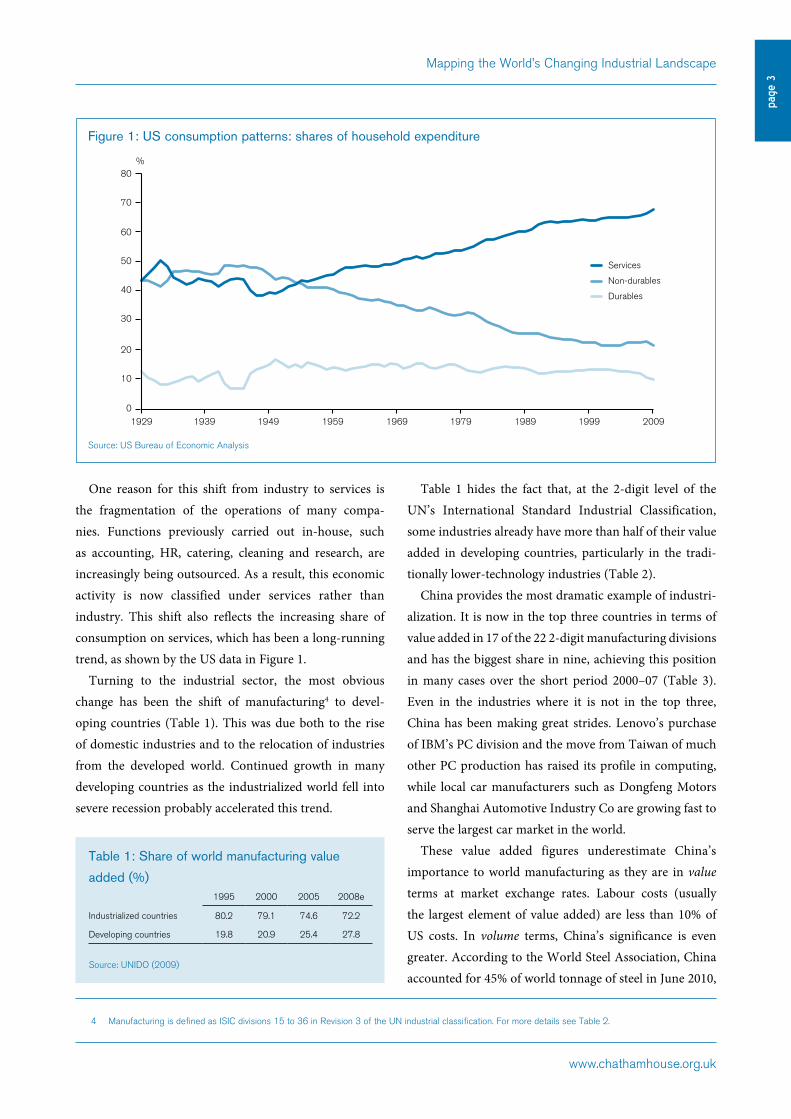
One reason for this shift from industry to services is the fragmentation of the operations of many compa-nies. Functions previously carried out in-house, such as accounting, HR, catering, cleaning and research, are increasingly being outsourced. As a result, this economic activity is now classified under services rather than industry. This shift also reflects the increasing share of consumption on services, which has been a long-running trend, as shown by the US data in Figure 1.
Turning to the industrial sector, the most obvious change has been the shift of manufacturing4 to devel-oping countries (Table 1). This was due both to the rise of domestic industries and to the relocation of industries from the developed world. Continued growth in many developing countries as the industrialized world fell into severe recession probably accelerated this trend.
Table 1 hides the fact that, at the 2-digit level of the UN’s International Standard Industrial Classification, some industries already have more than half of their value added in developing countries, particularly in the tradi-tionally lower-technology industries (Table 2).
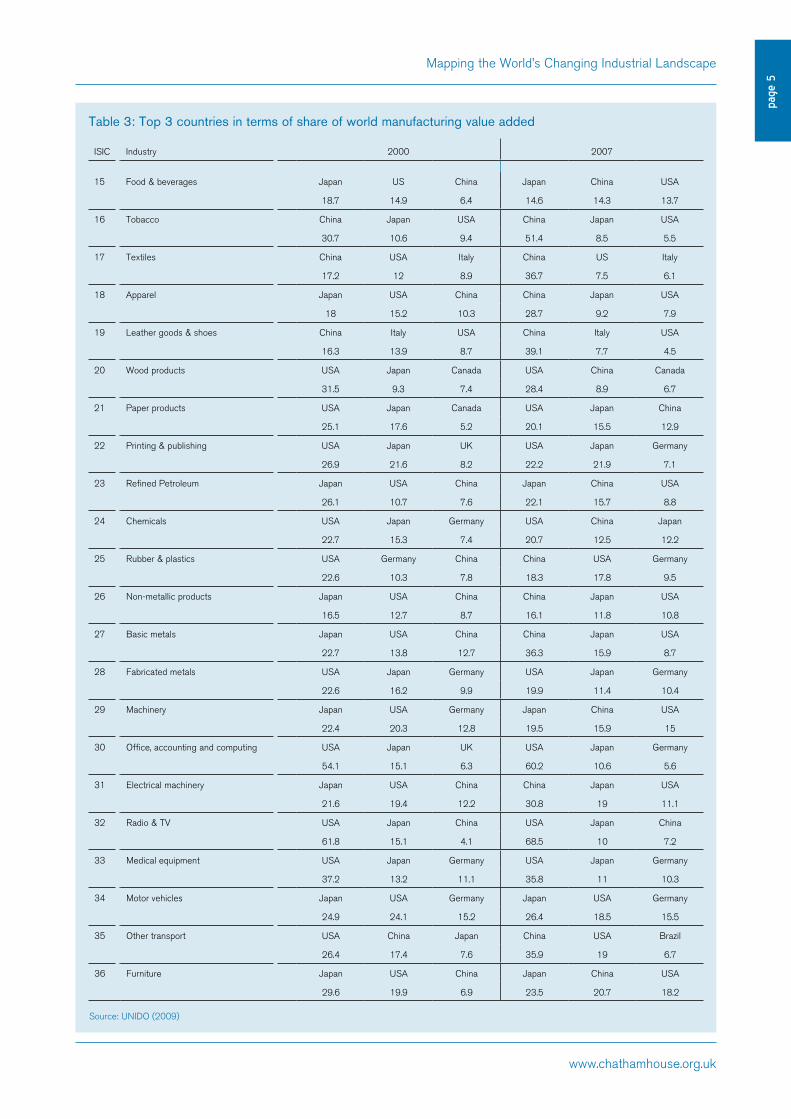
China provides the most dramatic example of industri-alization. It is now in the top three countries in terms of value added in 17 of the 22 2-digit manufacturing divisions and has the biggest share in nine, achieving this position in many cases over the short period 2000–07 (Table 3). Even in the industries where it is not in the top three, China has been making great strides. Lenovo’s purchase of IBM’s PC division and the move from Taiwan of much other PC production has raised its profile in computing, while local car manufacturers such as Dongfeng Motors and Shanghai Automotive Industry Co are growing fast to serve the largest car market in the world.
These value added figures underestimate China’s importance to world manufacturing as they are in value terms at market exchange rates. Labour costs (usually the largest element of value added) are less than 10% of US costs. In volume terms, China’s significance is even greater. According to the World Steel Association, China accounted for 45% of world tonnage of steel in June 2010,
Table 1: Share of world manufacturing value
added (%)1995 2000 2005 2008e
Industrialized countries 80.2 79.1 74.6 72.2
Developing countries 19.8 20.9 25.4 27.8
Source: UNIDO (2009)
19290
10
20
30
40
50
60
70
80
1939 1949 1959 1969 1979 1989 1999 2009
Durables
Non-durables
Services
%
Figure 1: US consumption patterns: shares of household expenditure
4 Manufacturing is defined as ISIC divisions 15 to 36 in Revision 3 of the UN industrial classification. For more details see Table 2.
Source: US Bureau of Economic Analysis
www.chathamhouse.org.uk
page
4
Mapping the World’s Changing Industrial Landscape
while it has been the biggest consumer of many industrial and consumer products for some time.
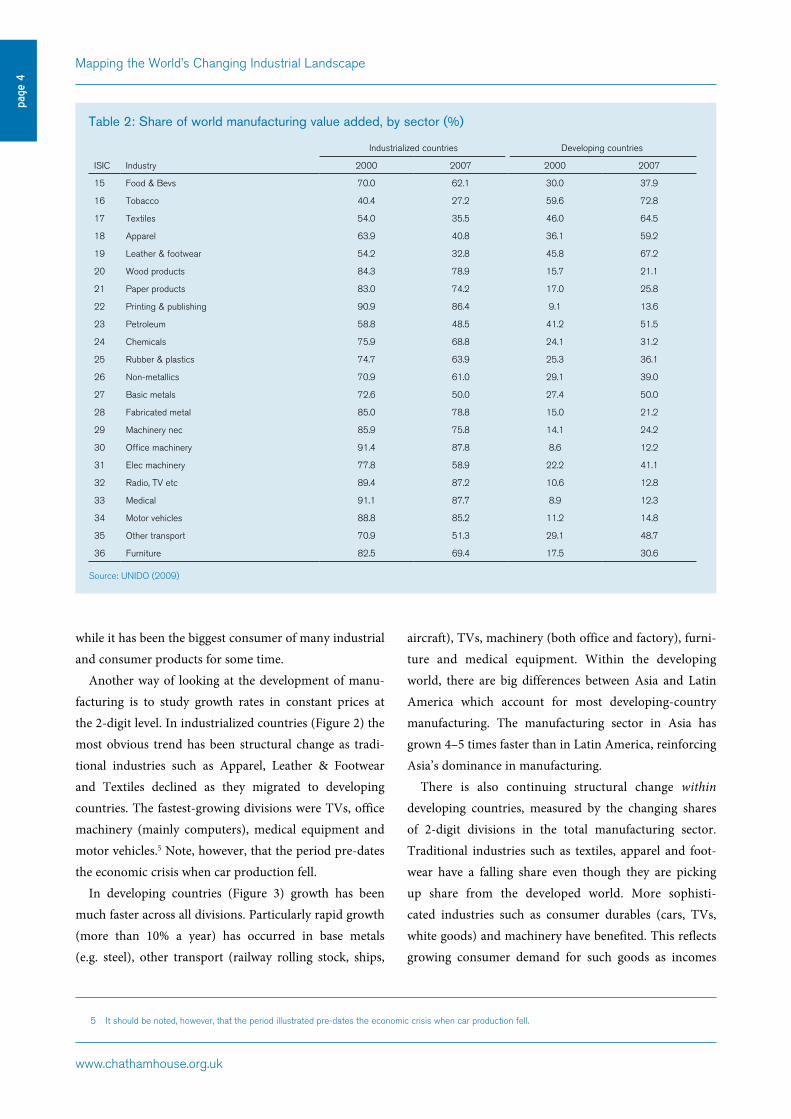
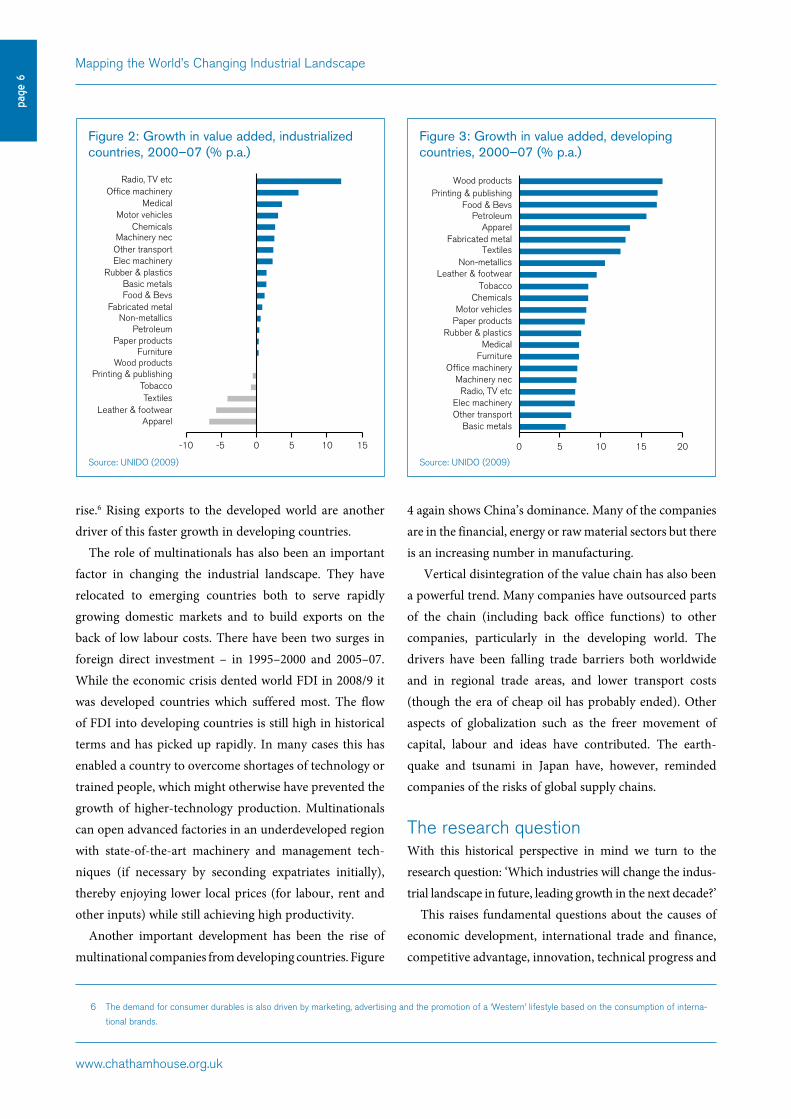
Another way of looking at the development of manu-facturing is to study growth rates in constant prices at the 2-digit level. In industrialized countries (Figure 2) the most obvious trend has been structural change as tradi-tional industries such as Apparel, Leather & Footwear and Textiles declined as they migrated to developing countries. The fastest-growing divisions were TVs, office machinery (mainly computers), medical equipment and motor vehicles.5 Note, however, that the period pre-dates the economic crisis when car production fell.
In developing countries (Figure 3) growth has been much faster across all divisions. Particularly rapid growth (more than 10% a year) has occurred in base metals (e.g. steel), other transport (railway rolling stock, ships,
aircraft), TVs, machinery (both office and factory), furni-ture and medical equipment. Within the developing world, there are big differences between Asia and Latin America which account for most developing-country manufacturing. The manufacturing sector in Asia has grown 4–5 times faster than in Latin America, reinforcing Asia’s dominance in manufacturing.
There is also continuing structural change within developing countries, measured by the changing shares of 2-digit divisions in the total manufacturing sector. Traditional industries such as textiles, apparel and foot-wear have a falling share even though they are picking up share from the developed world. More sophisti-cated industries such as consumer durables (cars, TVs, white goods) and machinery have benefited. This reflects growing consumer demand for such goods as incomes
Table 2: Share of world manufacturing value added, by sector (%)
Industrialized countries Developing countries
ISIC Industry 2000 2007 2000 2007
15 Food & Bevs 70.0 62.1 30.0 37.9
16 Tobacco 40.4 27.2 59.6 72.8
17 Textiles 54.0 35.5 46.0 64.5
18 Apparel 63.9 40.8 36.1 59.2
19 Leather & footwear 54.2 32.8 45.8 67.2
20 Wood products 84.3 78.9 15.7 21.1
21 Paper products 83.0 74.2 17.0 25.8
22 Printing & publishing 90.9 86.4 9.1 13.6
23 Petroleum 58.8 48.5 41.2 51.5
24 Chemicals 75.9 68.8 24.1 31.2
25 Rubber & plastics 74.7 63.9 25.3 36.1
26 Non-metallics 70.9 61.0 29.1 39.0
27 Basic metals 72.6 50.0 27.4 50.0
28 Fabricated metal 85.0 78.8 15.0 21.2
29 Machinery nec 85.9 75.8 14.1 24.2
30 Office machinery 91.4 87.8 8.6 12.2
31 Elec machinery 77.8 58.9 22.2 41.1
32 Radio, TV etc 89.4 87.2 10.6 12.8
33 Medical 91.1 87.7 8.9 12.3
34 Motor vehicles 88.8 85.2 11.2 14.8
35 Other transport 70.9 51.3 29.1 48.7
36 Furniture 82.5 69.4 17.5 30.6
Source: UNIDO (2009)
5 It should be noted, however, that the period illustrated pre-dates the economic crisis when car production fell.
www.chathamhouse.org.uk
page
5
Mapping the World’s Changing Industrial Landscape
Table 3: Top 3 countries in terms of share of world manufacturing value added
ISIC Industry 2000 2007
15 Food & beverages Japan US China Japan China USA
18.7 14.9 6.4 14.6 14.3 13.7
16 Tobacco China Japan USA China Japan USA
30.7 10.6 9.4 51.4 8.5 5.5
17 Textiles China USA Italy China US Italy
17.2 12 8.9 36.7 7.5 6.1
18 Apparel Japan USA China China Japan USA
18 15.2 10.3 28.7 9.2 7.9
19 Leather goods & shoes China Italy USA China Italy USA
16.3 13.9 8.7 39.1 7.7 4.5
20 Wood products USA Japan Canada USA China Canada
31.5 9.3 7.4 28.4 8.9 6.7
21 Paper products USA Japan Canada USA Japan China
25.1 17.6 5.2 20.1 15.5 12.9
22 Printing & publishing USA Japan UK USA Japan Germany
26.9 21.6 8.2 22.2 21.9 7.1
23 Refined Petroleum Japan USA China Japan China USA
26.1 10.7 7.6 22.1 15.7 8.8
24 Chemicals USA Japan Germany USA China Japan
22.7 15.3 7.4 20.7 12.5 12.2
25 Rubber & plastics USA Germany China China USA Germany
22.6 10.3 7.8 18.3 17.8 9.5
26 Non-metallic products Japan USA China China Japan USA
16.5 12.7 8.7 16.1 11.8 10.8
27 Basic metals Japan USA China China Japan USA
22.7 13.8 12.7 36.3 15.9 8.7
28 Fabricated metals USA Japan Germany USA Japan Germany
22.6 16.2 9.9 19.9 11.4 10.4
29 Machinery Japan USA Germany Japan China USA
22.4 20.3 12.8 19.5 15.9 15
30 Office, accounting and computing USA Japan UK USA Japan Germany
54.1 15.1 6.3 60.2 10.6 5.6
31 Electrical machinery Japan USA China China Japan USA
21.6 19.4 12.2 30.8 19 11.1
32 Radio & TV USA Japan China USA Japan China
61.8 15.1 4.1 68.5 10 7.2
33 Medical equipment USA Japan Germany USA Japan Germany
37.2 13.2 11.1 35.8 11 10.3
34 Motor vehicles Japan USA Germany Japan USA Germany
24.9 24.1 15.2 26.4 18.5 15.5
35 Other transport USA China Japan China USA Brazil
26.4 17.4 7.6 35.9 19 6.7
36 Furniture Japan USA China Japan China USA
29.6 19.9 6.9 23.5 20.7 18.2
Source: UNIDO (2009)
www.chathamhouse.org.uk
page
6
Mapping the World’s Changing Industrial Landscape
rise.6 Rising exports to the developed world are another driver of this faster growth in developing countries.
The role of multinationals has also been an important factor in changing the industrial landscape. They have relocated to emerging countries both to serve rapidly growing domestic markets and to build exports on the back of low labour costs. There have been two surges in foreign direct investment – in 1995–2000 and 2005–07. While the economic crisis dented world FDI in 2008/9 it was developed countries which suffered most. The flow of FDI into developing countries is still high in historical terms and has picked up rapidly. In many cases this has enabled a country to overcome shortages of technology or trained people, which might otherwise have prevented the growth of higher-technology production. Multinationals can open advanced factories in an underdeveloped region with state-of-the-art machinery and management tech-niques (if necessary by seconding expatriates initially), thereby enjoying lower local prices (for labour, rent and other inputs) while still achieving high productivity.
Another important development has been the rise of multinational companies from developing countries. Figure
4 again shows China’s dominance. Many of the companies are in the financial, energy or raw material sectors but there is an increasing number in manufacturing.
Vertical disintegration of the value chain has also been a powerful trend. Many companies have outsourced parts of the chain (including back office functions) to other companies, particularly in the developing world. The drivers have been falling trade barriers both worldwide and in regional trade areas, and lower transport costs (though the era of cheap oil has probably ended). Other aspects of globalization such as the freer movement of capital, labour and ideas have contributed. The earth-quake and tsunami in Japan have, however, reminded companies of the risks of global supply chains.
The research questionWith this historical perspective in mind we turn to the research question: ‘Which industries will change the indus-trial landscape in future, leading growth in the next decade?’
This raises fundamental questions about the causes of economic development, international trade and finance, competitive advantage, innovation, technical progress and
-10 -5 0 5 10 15
ApparelLeather & footwear
TextilesTobacco
Printing & publishingWood products
FurniturePaper products
PetroleumNon-metallics
Fabricated metalFood & BevsBasic metals
Rubber & plasticsElec machineryOther transportMachinery nec
ChemicalsMotor vehicles
MedicalOffice machinery
Radio, TV etc
0 5 10 15 20
Wood productsPrinting & publishing
Food & BevsPetroleum
ApparelFabricated metal
TextilesNon-metallics
Leather & footwearTobacco
ChemicalsMotor vehicles
Paper productsRubber & plastics
MedicalFurniture
Office machineryMachinery nec
Radio, TV etcElec machineryOther transport
Basic metals
Figure 2: Growth in value added, industrialized countries, 2000–07 (% p.a.)
Figure 3: Growth in value added, developing countries, 2000–07 (% p.a.)
Source: UNIDO (2009) Source: UNIDO (2009)
6 The demand for consumer durables is also driven by marketing, advertising and the promotion of a ‘Western’ lifestyle based on the consumption of interna-
tional brands.

www.chathamhouse.org.uk
page
7
Mapping the World’s Changing Industrial Landscape
the role of government policy. To keep the exercise within bounds the study was focused mainly on manufacturing industries at the 2-digit level, as illustrated by three case studies (motor vehicles, pharmaceuticals and aircraft), although a different cut was taken in a further two case studies, on retailing and the consequences of ageing. The analysis was also restricted to the developed world and Asia, with less emphasis on Africa and Latin America.
To answer the research question it was necessary to understand what has driven recent changes and then to assess how these or new drivers may develop in future. This in turn required an understanding of what will shape demand, supply and the political and economic outlook.
As a starting point we assume globalization, in the form of free trade and movement of capital and labour, will continue or at least not go into reverse to any significant extent. We also assume economic growth in the devel-oped world will average 2%, below historical rates owing to the legacy of the crisis and ageing populations (at least in Europe and Japan). By contrast, the developing world should grow three times as fast as a result of continuing catch-up and favourable demographics. The contrast is more marked in Asia where developing countries could
grow at 8%, over five times the rate of growth in Japan (1.5%) – Figure 5.
Within these GDP forecasts it needs to be borne in mind that consumption is likely to grow more slowly in the developed world as consumers work off their debts, while it could grow faster than GDP in ‘surplus’ countries such as China if they succeed in rebalancing their economies. There is also a possibility of another kind of rebalancing in some developed countries – from the financial sector to the industrial sector to redress the excessive expansion of the former, possibly through exchange rate adjustment.
There is considerable uncertainty about these forecasts. Another scenario is that the financial crisis continues to roll around the world,7 prompting an end to globaliza-tion and a relapse into recession. There is already plenty of rhetoric about the need to protect domestic jobs from foreign competition, currency wars are in the news and imbalances have yet to be unwound. Political or security shocks8 are another factor that could undermine the posi-tive scenario. There could also be a major realignment of currencies, such as a rise in the Chinese renminbi. Where these political and economic assumptions are critical to the outlook for a case study, both optimistic and pessi-mistic scenarios may be appropriate.
What are the drivers of changes in the industrial landscape?There are both demand and supply drivers at work in the transformation of the industrial landscape. This is neatly
1995
6
2000
18
2005
27
2008
46
2010
67
Russia
Brazil
India
China
0 2 4 6 8 10
ChinaIndia
Other Emerging AsiaSub-Saharan Africa
M East & N AfricaCIS/EE
L AmericaUSA
EUJapan
Figure 4: BRIC companies in Fortune Global 500
Figure 5: GDP growth, 2011–20 (% p.a.)
Source: Fortune
Source: Rossi (2010)
7 The latest concerns being the Eurozone crisis, US government debt and overheating in developing countries.
8 The revolutions in Tunisia, Egypt and Libya are a reminder of the instability of the region.
www.chathamhouse.org.uk
page
8
Mapping the World’s Changing Industrial Landscape
encapsulated in an analysis of the sources of growth in Asia and the United States over the period 1980–2000.9 Political and economic drivers as well as demographic, resource and environmental trends also need to be taken into account.
The demand side
Consumers’ expenditure is often the main determinant of industry growth: industries grow in response to demand for their output. Demand will reflect:
changes in population and income (including changes in income distribution);
income elasticities; changing tastes.
The latest UN population forecasts10 show that less devel-oped countries already account for 82% of the world’s population and will make up 96% of the 766 million increase up to 2020. Asian developing countries already make up 59% of the world’s population and will account for 56% of the increase to 2020.
The world’s population is also ageing, albeit from different starting points. A big increase in the proportion of elderly people will have a significant impact on consumption, both because many of their needs are different and because pension payments will be under pressure in countries with high levels of public debt. Other demographic drivers include falling household size and rising urbanization.
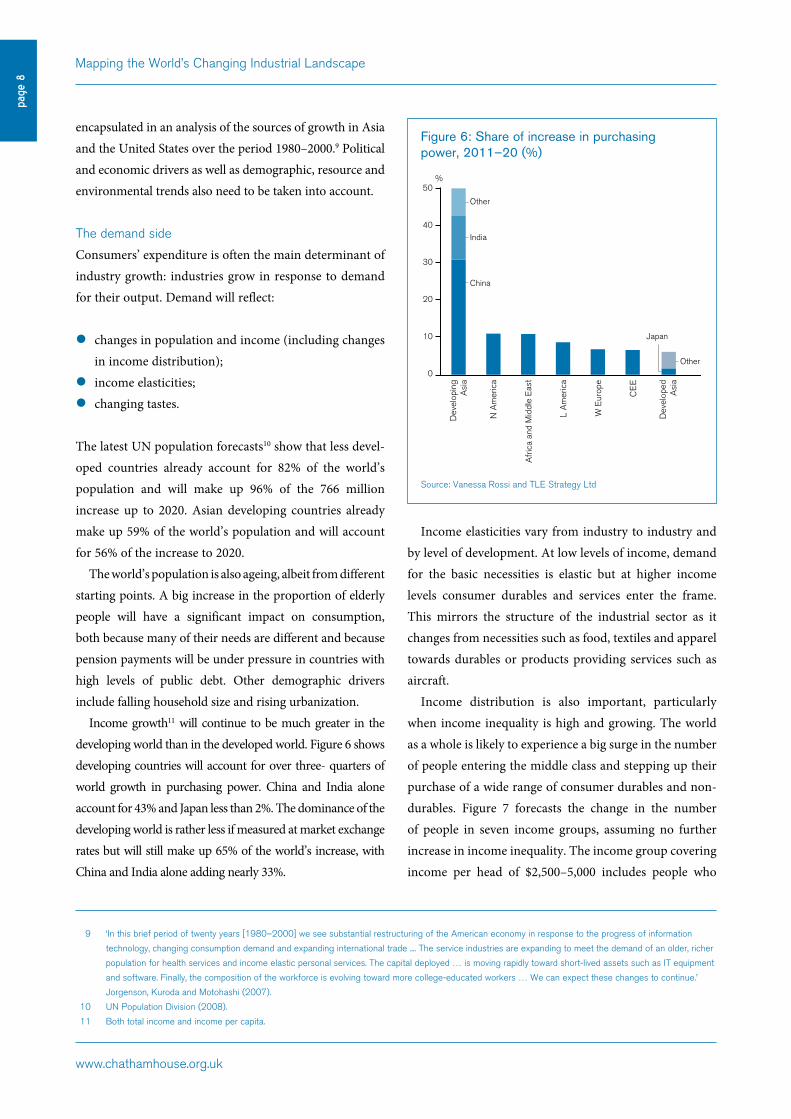
Income growth11 will continue to be much greater in the developing world than in the developed world. Figure 6 shows developing countries will account for over three- quarters of world growth in purchasing power. China and India alone account for 43% and Japan less than 2%. The dominance of the developing world is rather less if measured at market exchange rates but will still make up 65% of the world’s increase, with China and India alone adding nearly 33%.
Income elasticities vary from industry to industry and by level of development. At low levels of income, demand for the basic necessities is elastic but at higher income levels consumer durables and services enter the frame. This mirrors the structure of the industrial sector as it changes from necessities such as food, textiles and apparel towards durables or products providing services such as aircraft.
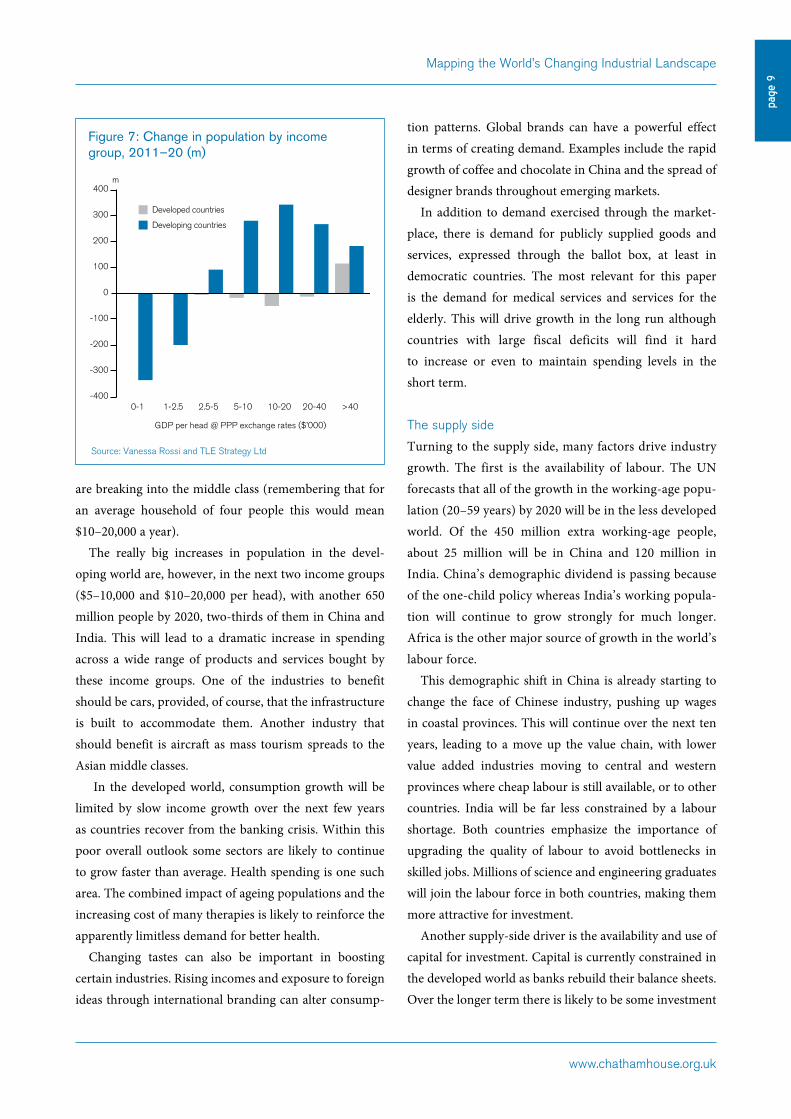
Income distribution is also important, particularly when income inequality is high and growing. The world as a whole is likely to experience a big surge in the number of people entering the middle class and stepping up their purchase of a wide range of consumer durables and non-durables. Figure 7 forecasts the change in the number of people in seven income groups, assuming no further increase in income inequality. The income group covering income per head of $2,500–5,000 includes people who
9 ‘In this brief period of twenty years [1980–2000] we see substantial restructuring of the American economy in response to the progress of information
technology, changing consumption demand and expanding international trade .... The service industries are expanding to meet the demand of an older, richer
population for health services and income elastic personal services. The capital deployed … is moving rapidly toward short-lived assets such as IT equipment
and software. Finally, the composition of the workforce is evolving toward more college-educated workers … We can expect these changes to continue.’
Jorgenson, Kuroda and Motohashi (2007).
10 UN Population Division (2008).
11 Both total income and income per capita.
30
20
10
0
40
50
Other
India
China
Other
Japan
Dev
elop
ing
Asi
a
N A
mer
ica
Afr
ica
and
Mid
dle
Eas
t
L A
mer
ica
W E
urop
e
CE
E
Dev
elop
edA
sia
%
Figure 6: Share of increase in purchasing power, 2011–20 (%)
Source: Vanessa Rossi and TLE Strategy Ltd
www.chathamhouse.org.uk
page
9
Mapping the World’s Changing Industrial Landscape
are breaking into the middle class (remembering that for an average household of four people this would mean $10–20,000 a year).
The really big increases in population in the devel-oping world are, however, in the next two income groups ($5–10,000 and $10–20,000 per head), with another 650 million people by 2020, two-thirds of them in China and India. This will lead to a dramatic increase in spending across a wide range of products and services bought by these income groups. One of the industries to benefit should be cars, provided, of course, that the infrastructure is built to accommodate them. Another industry that should benefit is aircraft as mass tourism spreads to the Asian middle classes.
In the developed world, consumption growth will be limited by slow income growth over the next few years as countries recover from the banking crisis. Within this poor overall outlook some sectors are likely to continue to grow faster than average. Health spending is one such area. The combined impact of ageing populations and the increasing cost of many therapies is likely to reinforce the apparently limitless demand for better health.
Changing tastes can also be important in boosting certain industries. Rising incomes and exposure to foreign ideas through international branding can alter consump-
tion patterns. Global brands can have a powerful effect in terms of creating demand. Examples include the rapid growth of coffee and chocolate in China and the spread of designer brands throughout emerging markets.
In addition to demand exercised through the market-place, there is demand for publicly supplied goods and services, expressed through the ballot box, at least in democratic countries. The most relevant for this paper is the demand for medical services and services for the elderly. This will drive growth in the long run although countries with large fiscal deficits will find it hard to increase or even to maintain spending levels in the short term.
The supply side
Turning to the supply side, many factors drive industry growth. The first is the availability of labour. The UN forecasts that all of the growth in the working-age popu-lation (20–59 years) by 2020 will be in the less developed world. Of the 450 million extra working-age people, about 25 million will be in China and 120 million in India. China’s demographic dividend is passing because of the one-child policy whereas India’s working popula-tion will continue to grow strongly for much longer. Africa is the other major source of growth in the world’s labour force.
This demographic shift in China is already starting to change the face of Chinese industry, pushing up wages in coastal provinces. This will continue over the next ten years, leading to a move up the value chain, with lower value added industries moving to central and western provinces where cheap labour is still available, or to other countries. India will be far less constrained by a labour shortage. Both countries emphasize the importance of upgrading the quality of labour to avoid bottlenecks in skilled jobs. Millions of science and engineering graduates will join the labour force in both countries, making them more attractive for investment.
Another supply-side driver is the availability and use of capital for investment. Capital is currently constrained in the developed world as banks rebuild their balance sheets. Over the longer term there is likely to be some investment
-100
-200
-300
-400
100
0
200
300
400
0-1 2.5-5 5-10 10-20 20-40 >401-2.5
GDP per head @ PPP exchange rates ($’000)
Developed countries
Developing countries
m
Figure 7: Change in population by income group, 2011–20 (m)
Source: Vanessa Rossi and TLE Strategy Ltd
www.chathamhouse.org.uk
page
10
Mapping the World’s Changing Industrial Landscape
recovery in the private sector but public-sector invest-ment will be under pressure for a long time. In contrast, emerging countries have savings to fund domestic invest-ment. A good example recently was the huge boost to China’s investment programme to compensate for lower exports, although in practice the fall in exports proved to be rather short-lived. The big increase in FDI into devel-oping countries also suggests that good projects continue to find backing.
Another supply factor affecting the industrial land-scape will be government provision of infrastructure and a supportive business environment. There are certainly energy and transport bottlenecks in India. Experience suggests that this is not yet holding back overall growth, although it could be skewing it in favour of services such as outsourcing which rely less on infrastructure than industry does.
The pace of innovation and technical progress in both products and manufacturing processes will also affect the shape of industry across the world. Innovations in advanced technologies such as computing, biotech-nology, genomics, nanotechnology, new materials and fuel cells are transforming old industries and creating new ones. Another huge opportunity is in health where these technologies, or combinations of them, are gradually appearing on the market. Over the next ten years they will deliver targeted therapies for serious diseases. They are at first likely to drive industry change in developed countries as the treatments are expensive, but research is also taking place in developing countries in Asia so the effects will be felt there too. The ageing and pharmaceuticals case studies will illuminate these trends.
Innovation can also create entirely new industries built on generating and then meeting needs we never knew we had. The Sony Walkman is the classic example (although, in an interesting demonstration of the speed of change, the end of Walkman production has recently been announced). There are, of course, many other examples of demand being generated by innovation. Computing and the internet have created an enormous industry around social networks.
The supply side is also affected by productivity growth. This has been explored in depth by Jorgenson, Kuroda
and Motohashi (2007). Their book reports on a research project to identify the drivers of growth in Japan, China, Taiwan and Korea and to contrast them with those in the United States. It asks whether productivity is the main driver of growth and concludes that, by and large, it is not – although there are important exceptions at the country and industry level.
Other drivers
The industrial landscape can also be determined by economic factors (e.g. higher commodity prices), by political factors (e.g. industrial policy) and by resource constraints and environmental developments.
Governments have a wide range of policies to guide industrial development e.g. exchange rate policy, promo-tion of exports, investment subsidies, domestic content and technology transfer requirements, protection of domestic industries on infant-industry grounds, support for national champions and protection of strategic indus-tries from hostile takeovers.
The exercise of these powers, which is widespread, varies over time and between countries. In the recent crisis, countries leaped into action when the integrity of the financial system was threatened. Banks were bailed out and/or nationalized and automobile companies rescued in the United States and Europe. In earlier decades the rapid growth of Japan and Korea was based on the promotion of chosen industries using government-supported industrial groups (keiretsus and chaebols).
Another issue is the control of strategically important commodities such as oil or rare earths which are essential for the IT industry or green technology. For example, China currently accounts for 97% of the supply of rare earths and has restricted exports to ensure supplies for domestic industries. Meanwhile, in Russia the govern-ment has reasserted control over its strategic assets in energy and raw materials, and OPEC members have long managed their oil and gas.
State-owned enterprises (SOEs) can also enjoy privi-leged treatment. The recent huge stimulus by the Chinese government to offset the impact of the financial crisis was targeted at SOEs in nine industries most affected – elec-
www.chathamhouse.org.uk
page
11
Mapping the World’s Changing Industrial Landscape
tronics, petrochemicals, metallurgy, steel, automotives, light industry, textiles, shipbuilding and telecoms.12 Other Chinese SOEs invest to secure natural resources in coun-tries such as Sudan, Zimbabwe, Burma and Iran where companies from the United State or Europe find it hard to operate. Sovereign wealth funds can also be used to support industrial strategy.
Another example of the importance of government policy is the development of the car industry in Brazil and China.13 In China, the government made it a ‘pillar industry’ in the 1980s and required foreign companies to have a local joint-venture partner, imposed local content rules and set import tariffs at very high levels (200% initially and then 80–100%). After China joined the World Trade Organization some of these requirements were relaxed but the Five-Year Plan 2005–10 confirmed three goals – the development of an indigenous industry based on domestic brands, design and R&D; the development of cleaner cars less dependent on fossil fuels; and the devel-opment of exports. Government support has played an important part in building the car industry in Shanghai. The municipality of Shanghai, which owns most of the shares of the Shanghai Automotive Industry Co (SAIC), has used this position to determine strategy and the use of preferred suppliers.
The latest Chinese Five-Year Plan 2011–15 identifies seven strategic industries – energy conservation and envi-ronmental protection, next-generation IT, biotechnology, high-end equipment (aircraft, high speed rail), new energy (nuclear, wind solar), new materials and new energy vehicles – in which it intends to succeed on a global scale. The government’s aim is to increase their contribution from approximately 5% of GDP to 8% by 2015 and 15% by 2020.
It should be emphasized that the use of industrial policy for political ends is pervasive. Developed countries have always supported their own companies in a variety of ways. Rolls-Royce was nationalized in 1971 when the
development of a new engine (the RB211) bankrupted the company, and more recently the aircraft industry has been a minefield, with the United States and EU accusing each other of unfair subsidies. The car industry and financial sector are other recent examples, where bailouts of GM and Chrysler and British banks have definitely distorted the shape of those industries.
Government policies can have a powerful effect on international trade, location of production and global supply chains, so the assumption that there will be no major change in such policies needs to be challenged and alternative assumptions explored to understand where different policies might lead.
The case studiesFive case studies were chosen to explore the trends and drivers described above and as possible growth generators over the next decade. Three of them – cars, aircraft and pharmaceuticals – are manufacturing industries fulfilling very different consumer needs. The demand for cars is rising quickly. According to Reuters,14 car sales rose by 31% in India and by 33% in China in 2010. In the devel-oped world, the car market is near saturation and demand is affected by other factors such as the price of oil and the desire to reduce pollution through financial incentives to reduce carbon emissions.
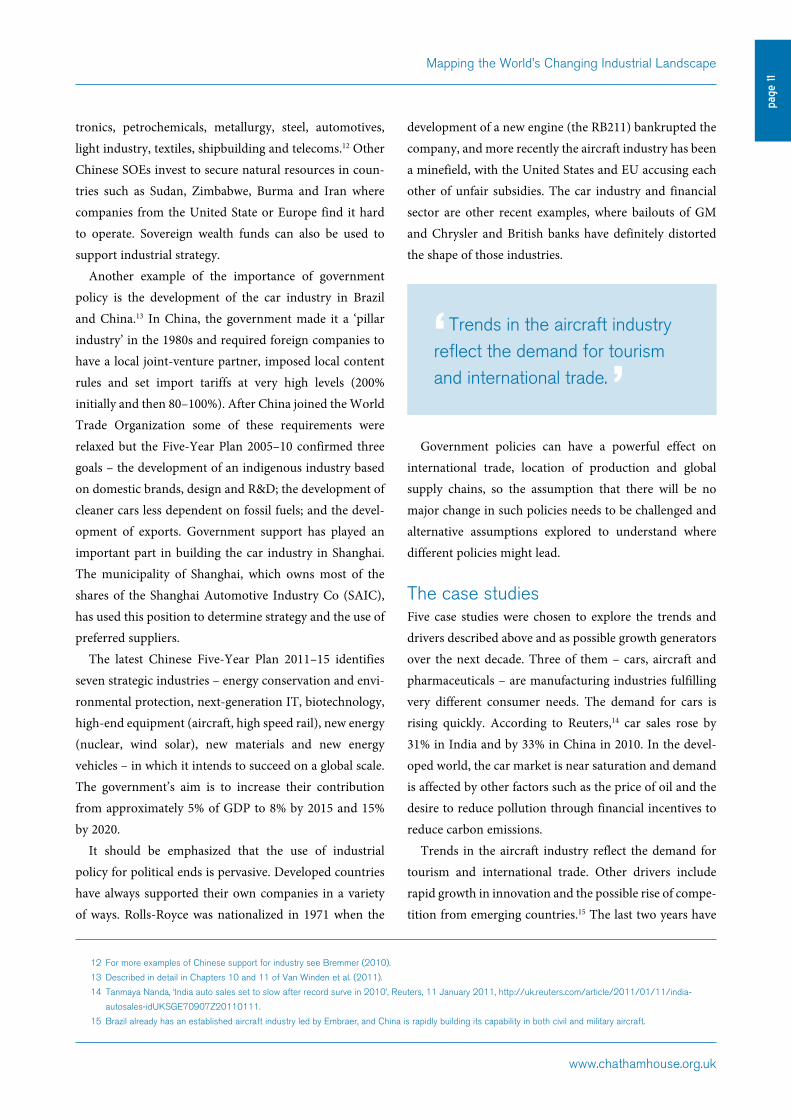
Trends in the aircraft industry reflect the demand for tourism and international trade. Other drivers include rapid growth in innovation and the possible rise of compe-tition from emerging countries.15 The last two years have
‘ Trends in the aircraft industry reflect the demand for tourism and international trade. ’
12 For more examples of Chinese support for industry see Bremmer (2010).
13 Described in detail in Chapters 10 and 11 of Van Winden et al. (2011).
14 Tanmaya Nanda, ‘India auto sales set to slow after record surve in 2010’, Reuters, 11 January 2011, http://uk.reuters.com/article/2011/01/11/india-
autosales-idUKSGE70907Z20110111.
15 Brazil already has an established aircraft industry led by Embraer, and China is rapidly building its capability in both civil and military aircraft.
www.chathamhouse.org.uk
page
12
Mapping the World’s Changing Industrial Landscape
been very challenging for tourism owing to recession and health scares but over a longer timescale tourism has been growing steadily, driven by rising incomes and, at least to 2008, lower transport costs. Provided developed-country economies recover, tourism growth should resume as developing countries follow the developed world in their desire to travel. World tourism is expected to grow faster than world GDP, with growth being led by developing countries (World Travel and Tourism Council, 2010). China alone is expected to provide almost 95 million tour-ists by 2020.
Pharmaceuticals are driven by both private and public demand. The almost limitless demand for better health depends on rising incomes, ageing populations and scientific breakthroughs offering more cures for previously untreatable medical problems. In both developed and developing coun-tries many of these medical problems are due to unhealthy lifestyles or environmental factors. Obesity, coronary heart disease and associated problems such as diabetes are on the rise around the world. Ageing populations are also bringing rapidly increasing rates of age-related diseases such as dementia. Meanwhile poor countries still suffer from water-borne and infectious diseases, malaria and AIDS. The pharmaceuticals industry is, however, struggling to find new blockbuster drugs which pass the regulators. In the United States, R&D pharmaceutical investment has soared while FDA approvals for new medicines have fallen. At the same time, the rise of pharma companies in developing countries and the pressure from public health providers to keep down the bill for drugs has put further pressure on the big drugs companies in developed countries.
The other two case studies take a rather different approach. The first looks at the ramifications of ageing populations around the world. In the past these mainly affected developed countries (especially Japan) where the ratio of non-working-age to working-age population has been rising for some time, but some middle-income countries (Russia, Eastern Europe) are also suffering static or falling populations and rising dependency ratios. China’s dependency ratio will also start to worsen from 2015 owing to the one-child policy. In contrast, India and Africa will continue to enjoy a demographic dividend for
some time, though supportive economic policies will be needed to take advantage of the opportunity provided by a growing labour force. These demographic trends will have an impact on growth rates. Static or falling labour forces in Europe and Japan limit their growth, while many devel-oping countries will continue to grow much faster. Ageing will also continue to change the geographic distribution of labour-intensive industries and have huge implications for public expenditure, especially as the costs of caring for an ageing population rise.
The final case study looks at retailing. In the developed world one big change over the last decade has been the growth of internet shopping. It has transformed some sectors e.g. books, travel, insurance or consumer durables, but in other areas such as grocery it has so far only made fairly small inroads. Other changes such as consolidation and changing retail formats are expected to continue. In the developing world the rapid expansion of the middle class as incomes rise is driving big changes in shopping habits across a wide range of goods and services and is expected to lead to rapid growth in retailing. Urbanization is also an important driver. The UN Population Division expects urbanization in both China and India to continue to rise in the next ten years. The combination of these two changes is mainly responsible for the transformation of retailing in the developing world. Where high levels of urbanization already exist, e.g. in Brazil, there is already a sophisticated retailing sector. In Southeast Asia and China it is developing fast, while in India retailing is still mainly done through the traditional trade characterized by small shops. In some countries supermarket chains such as Wal-Mart, Carrefour and Tesco are important players but in India supermarket growth is likely to be driven by local players.
The aim of these five case studies is to understand what has driven growth and transformation in each area and what factors will apply in the next decade. Each case study has its own particular characteristics, so it is hard to fit them into a single template. In some industries the main driver may be consumer demand; in others technological breakthroughs may be the most important factor, while political considerations may also play their
www.chathamhouse.org.uk
page
13
Mapping the World’s Changing Industrial Landscape
part. The case studies will therefore try to consider all of the possible drivers mentioned above and address the following big questions:
zz What will be the main drivers of growth in the next decade?
zz How fast will the industry grow? zz Where will this growth take place?zz Will the shift of manufacturing to developing coun-
tries, particularly in Asia, continue? Which countries will be the big winners?
zz Does the recent economic crisis affect the outlook for the industry? Does it represent a turning point or will recent trends continue? Will globalization and free market policies continue to predominate or will there be a backlash in favour of more inter-ventionism?
Concluding remarksThere have been very big changes in the world’s industrial landscape over the past 25 years as production expanded in emerging countries to serve rapidly growing domestic demand and to supply developed countries. Lower trade barriers, transport costs and a surge in international capital flows have allowed sources of competitive advan-tage to be exploited. This has particularly been a story about the growth of China, although other emerging countries such as South Korea, India, Brazil, Mexico and others in Southeast Asia have also played their part.
Even before the economic crisis this transformation was reflected in a shift in economic and political power from developed to emerging countries. Just one example is the use by China of its soaring foreign exchange reserves
to finance the US current account deficit. The crisis has accelerated this shift as emerging countries recovered quickly and are growing again at three times the rate of developed countries. China’s new position as the second-largest economy in the world has consolidated its role as a key player in all economic, political and environmental discussions.
It is too early to tell whether the crisis will accelerate or retard the move of industry to emerging countries as there are powerful trends pulling in different directions. Emerging countries’ faster economic growth would, by itself, change the balance in their favour. The failure of laissez-faire policies to prevent the crisis may also encourage emerging countries to pursue more active industrial policies to shape their own industrial develop-ment and build their own industries. On the other hand, there could be a backlash against globalization, particu-larly in developed countries if growth proves elusive and unemployment stays high.
Other factors not directly related to the crisis will shape the world’s industrial landscape. The developed world remains a powerhouse of invention and will adapt to the changing situation by focusing on parts of the value chain where most profit is to be made – i.e. in innovation, advanced manufacturing and in marketing, advertising and branding. High oil prices could change the economics of global supply chains. A fall in the exchange rates of developed countries could also favour domestic produc-tion.
These divergent trends will play out differently across the spectrum of industries. The case studies will throw some light on the development of just five sectors over the next decade or two.
www.chathamhouse.org.uk
page
14
Mapping the World’s Changing Industrial Landscape
References
APCO Worldwide (2010), China’s 12th Five-Year Plan: How It Actually Works and What’s in Store for the Next Five Years.
Bremmer, Ian (2010), The End of the Free Market (Portfolio).
Jorgenson, Dale, Masahiro Kuroda and Kazuyuki Motohashi (2007), Productivity in Asia (Edward Elgar).
Rossi, Vanessa (2010), The Southern Surge: Prospects for Insurance and Financial Services in India and South East Asia. Chartered Insurance Institute.
Rossi, Vanessa (2010), A Remarkably Rosy Economic Outlook for 2020. Chartered Insurance Institute.
Rossi, Vanessa (2009), ‘Which Sectors Will Lead the Recovery?’, Chatham House Briefing Note, October.
United Nations Department of Economic & Social Affairs, Population Division (2008). World Population Prospects, The 2008 Revision.
UNIDO (2010), Structural Change in the World Economy: Main Features and Trends.
UNIDO (2009), International Yearbook of Industrial Statistics.Van Winden, Willem, Leo van den Berg, Luis Carvalho
and Erwin van Tuijl (2011), Manufacturing in the New Urban Economy (Routledge).
World Bank, World Development Indicators online.World Travel & Tourism Council (2010), Travel &
Tourism Economic Impact.
www.chathamhouse.org.uk
page
15
Mapping the World’s Changing Industrial Landscape
International Economics at Chatham House produces policy-
oriented research and analysis of the challenges facing the
global economy today. It maintains links with policy-makers and
researchers around the globe to ensure that our independent
analysis of global economic issues translates into practical and
timely policy insight on the challenges facing the world economy
today. The main themes include the changing world economy and
the G20 framework, reform of the international monetary system,
growth of emerging market financial centres, and international
competitiveness and growth.
A changing world economy and the G20 frameworkIn the wake of the recent financial crisis, the G20 has played an
important role in facilitating international economic policy coopera-
tion. It has yet to be seen, however, if the group can move beyond its
roots as a crisis committee and play a more institutionalized role in
confronting the array of challenges facing the global economy today.
The International Economics team has focused its research
to explore the future prospects for the G20 and set out an
ambitious schedule for international economic policy cooperation
(Preventing Crises and Promoting Economic Growth: A Framework
for International Policy Cooperation). In addition, current research
explores the role of G20 observer countries and those outside the
G20 process in international economic policy cooperation.
Reform of the international monetary systemThe international monetary system is in flux – no longer meeting
the needs of an increasingly unbalanced global economy, but not
yet ready to move beyond the dollar as the world’s reserve currency.
Current research explores the future of the international monetary
system, and assesses the prospects for a range of proposed reforms.
Recent work has explored the prospects for a multi-currency
reserve system (Beyond The Dollar: Rethinking the International
Monetary System) and investigated China’s ambitions for the
renminbi as an international reserve currency (‘One Currency, Two
Systems’: China’s Renminbi Strategy).
Currently, a Chatham House taskforce is leading a review of
the role of gold in the international monetary system, often the
subject of heated debate. Chatham House is exploring the issue
from different angles and perspectives, to focus on reform of the
international monetary system..
Growth of emerging market financial centresAs the epicentre of global economic growth continues to shift
towards emerging markets, Chatham House International Economics
has embarked on a series of studies into the specific challenges and
opportunities facing financial centres in emerging economies.
Recent work has focused on the strengths and weaknesses of the
Gulf as a global financial centre (The Gulf Region: A New Hub of Global
Financial Power) and the outlook for the Japanese financial sector in
the light of recent international trends (The Outlook for Tokyo: New
Opportunities or Long-Term Decline for Japan’s Financial Sector?).
Current research explores the prospects for financial centres
in the Greater China region, including Hong Kong, Taipei and
Shanghai, as well as the challenges and opportunities that shifting
global financial influence may pose for Singapore’s role as an estab-
lished Asian financial centre.
International competitiveness and growthThe past quarter-century has seen massive changes in the world
economy. Trade integration and the globalization of value chains,
with more and more manufacturing now taking place in emerging
economies, have created new challenges together with new oppor-
tunities. As we move forward into the next decade, it is critical to
address the issue of how the industries of the future will look, and
which sectors/industries will lead future growth.
International Economics is undertaking a series of projects to
examine the outlook for key global industries over the next decade.
These include a series of research study groups on the changing
industrial landscape and industry case studies identifying emerging
‘global champions’.
Chatham House is also partnering with the University of
Warwick’s Centre for Competitive Advantage in the Global Economy
(CAGE) to explore how markets, institutions, and public policy
interact to create and sustain competitive advantage in response to
these global changes.
Recent publications: Preventing Crises and Promoting Economic Growth:
A Framework for International Policy Cooperation
Chatham House/CIGI Report
Paola Subacchi and Paul Jenkins, April 2011
Squeezed in Retirement: The Future of Middle Britain
Chatham House Report
Paola Subacchi, William Jackson, Vanessa Rossi, Richard
Varghese, March 2011
‘One Currency, Two Systems’: China’s Renminbi Strategy
Briefing Paper
Paola Subacchi, October 2010
Aiming for New Vigour: The UK in the Global Economy
Briefing Paper
Vanessa Rossi and Jim Rollo, June 2010
The Role of the US in the Post-Crisis Economic Order
Chapter in America and a Changed World: A Question of
Leadership
Paola Subacchi, May 2010
Beyond the Dollar: Rethinking the International
Monetary System
Chatham House Report
Edited by Paola Subacchi and John Driffill, March 2010
International Economics at Chatham House
www.chathamhouse.org.uk
page
16
Mapping the World’s Changing Industrial Landscape
Chatham House has been the home of the Royal
Institute of International Affairs for ninety years. Our
mission is to be a world-leading source of independent
analysis, informed debate and influential ideas on how to
build a prosperous and secure world for all.
Donald Hepburn worked as an economist at Unilever
for twenty years, the last ten as chief economist.
Earlier in his career he was an economist in the public
sector, including in the Department of Transport in the
UK, the Ministry of Finance in Sri Lanka, the Cabinet
Office in the UK and the Ministry of Finance and
Planning in Kenya.
Chatham House10 St James’s SquareLondon SW1Y 4LEwww.chathamhouse.org.uk
Registered charity no: 208223
Chatham House (the Royal Institute of International Affairs) is an independent body which promotes the rigorous study of international questions and does not express opinions of its own. The opinions expressed in this publication are the responsibility of the author.
© The Royal Institute of International Affairs, 2011
This material is offered free of charge for personal and non-commercial use, provided the source is acknowledged. For commercial or any other use, prior written permission must be obtained from the Royal Institute of International Affairs. In no case may this material be altered, sold or rented.
Designed and typeset by Soapbox, www.soapbox.co.uk
Forthcoming Case Study Briefing Papers:
z Ageing, L. Ciferri and P. Ginefra
z Aircraft, S. McGuire
z Cars, A. Goldstein and M. Ferrazzi
z Pharmaceuticals, M. Owen
z Retailing, A. Black and D. Hurst
Financial support for this project from the
Toshiba International Foundation (TIFO) is gratefully
acknowledged.