Mapping the Shadow Banking System Through a Global Flow of
57
WP/14/10 Mapping the Shadow Banking System Through a Global Flow of Funds Analysis Luca Errico, Artak Harutyunyan, Elena Loukoianova, Richard Walton, Yevgeniya Korniyenko, Goran Amidžić, Hanan AbuShanab, Hyun Song Shin
Transcript of Mapping the Shadow Banking System Through a Global Flow of

WP/14/10
Mapping the Shadow Banking System Through
a Global Flow of Funds Analysis
Luca Errico, Artak Harutyunyan, Elena Loukoianova, Richard
Walton, Yevgeniya Korniyenko, Goran Amidžić, Hanan
AbuShanab, Hyun Song Shin

© 2014 International Monetary Fund WP/14/10
IMF Working Paper
Statistics Department
Mapping the Shadow Banking System Through a Global Flow of Funds Analysis
Prepared by Luca Errico, Artak Harutyunyan, Elena Loukoianova, Richard Walton,
Yevgeniya Korniyenko, Goran Amidžić, Hanan AbuShanab, Hyun Song Shin1
January 2014
Abstract
This paper presents an approach to understanding the shadow banking system in the United
States using a new Global Flow of Funds (GFF) conceptual framework developed by the
IMF’s Statistics Department (STA). The GFF uses external stock and flow matrices to map
claims between sector-location pairs. Our findings highlight the large positions and gross
flows of the U.S. banking sector (ODCs) and its interconnectedness with the banking sectors
in the Euro area and the United Kingdom. European counterparties are large holders of U.S.
other financial corporations (OFCs) debt securities. We explore the relationship between
credit to domestic entities and the growth of non-core liabilities. We find that external debt
liabilities of the financial sector are procyclical and are closely aligned with domestic credit
growth.
JEL Classification Numbers: F3, F65, G01, G2, G15,
Keywords: Shadow Banking, Global Flow of Funds, Financial Stability, Data Gaps
Corresponding Authors’ E-Mail Addresses: [email protected]; [email protected]
1 Luca Errico, Artak Harutyunyan, Elena Loukoianova, Richard Walton, Yevgeniya Korniyenko, Goran Amidžić,
Hanan AbuShanab are all with the Financial Institutions Division of the IMF’s Statistics Department. Hyun Song
Shin is the Hughes-Rogers Professor of Economics at Princeton University. A preliminary version of this paper
was presented at the First IMF Statistical Forum “Statistics for Global Economic and Financial Stability,”
Washington, DC, November 12-13, 2013. The authors would like to thank Lars Frisell, Fabrizio Lopez-Gallo Dey,
Benjamin Cohen, and Rasha Cassim for their comments and very helpful discussions of the paper at the
conference, and Laurent Meister for excellent data management assistance.
This Working Paper should not be reported as representing the views of the IMF.
The views expressed in this Working Paper are those of the author(s) and do not necessarily represent
those of the IMF or IMF policy. Working Papers describe research in progress by the author(s) and
are published to elicit comments and to further debate.

2
CONTENTS PAGE
Abstract ......................................................................................................................................2
I. Introduction ............................................................................................................................4
II. Overview of the U.S financial system ...................................................................................9
III. Empirical evidence.............................................................................................................27
IV. Directions for further work ................................................................................................37
References ................................................................................................................................53
Tables
Table 1: BSA matrix for the Unites States for 2012 ................................................................10 Table 2: United States external flow of funds matrix for 2012 ...............................................11 Table 3: Determinants of Domestic Growth of Loans to Non-Financial Sector .....................31
Figures
Figure 1: Lending Boom Financed by Noncore Liabilities. ......................................................6 Figure 2: European global banks and the U.S. banking system...............................................12 Figure 3: USA: external assets/liabilities by counterpart country and main instrument .........13 Figure 4: USA: Financial corporations' assets/liabilities vis-à-vis Euro Area by main
instrument ................................................................................................................................14 Figure 5: Gross external assets and external liabilities of the U.S. banking system (ODC
sector) by instrument................................................................................................................15 Figure 6: Counterparties by location of the “Currency and Deposits” component of the U.S.
banking system (ODC sector) ..................................................................................................16 Figure 7: U.S. annual capital flows by category .....................................................................17 Figure 8: U.S. quarterly capital flows by category ..................................................................18 Figure 9: Net interoffice assets of foreign banks in the United States.....................................18 Figure 10: Amount owed by banks to US prime MMFs (% of total), by nationality of
borrowing bank ........................................................................................................................19 Figure 11: Amount owed by banks to US prime MMFs on June 30, 2011, by nationality of
borrowing bank ........................................................................................................................20 Figure 12: Gross external liabilities of the Other Financial Corporations (OFCs) sector in
“Securities Other Than Shares” by location of counterparty ...................................................21 Figure 13: USA: Total assets of ODCs and OFCs ...................................................................23 Figure 14: USA: Assets and liabilities of ODCs by main instrument .....................................24 Figure 15: USA: Assets and liabilities of OFCs by main instrument ......................................24 Figure 16: Total assets of financial intermediation sectors in the United States .....................25 Figure 17: Relative size of intermediation by the shadow banking system .............................26 Figure 18: Core and noncore liabilities of US financial corporations .....................................27 Figure 19: ODCs+OFCs securities and deposits from nonresidents (non-core liabilities) ......32

3
Figure 20: ODCs securities other than shares liabilities from nonresidents ............................33 Figure 21: ODCs+OFCs deposits from nonresidents ..............................................................34 Figure 22: ODCs deposits from nonresidents ..........................................................................35 Figure 23: ODCs+OFCs domestic loans to corporates ............................................................36
Annexes
1. Balance Sheet Approach Matrix Methodology ....................................................................41 2. External Flow of Funds Matrix Methodology .....................................................................44 3. Mapping Domestic and External Flow of Funds: Data Sources and Data Gaps .................48
Annex Tables
1: Comparison of Euro Area’s and US’ external flow of funds matrices ................................50
2: External flow of funds matrix: data sources, availability and gaps .....................................52

4
I. INTRODUCTION
The financial system channels savings from savers to those who draw on the savers’ funds—
from ultimate lenders to ultimate borrowers. Some credit will be directly provided from the
lender to the borrower, as is the case with Treasury securities, municipal bonds, and
corporate bonds. A large part of the financing in today’s economy is intermediated in
wholesale money markets through banks and other financial intermediaries and lent in the
capital markets. This is nowadays considered as shadow banking.
The Financial Stability Board (FSB, 2011) defines the shadow banking system as “credit
intermediation involving entities and activities (fully or partially) outside the regular banking
system” or nonbank credit intermediation in short. Recent IMF staff work focuses on policy
responses to rising shadow banking activities, arguing that an appropriate set of policies may
lead to a smaller shadow banking system. It also looks at the shadow banking system by
introducing new methods to thinking about financial intermediation.2
Our paper presents an approach to understanding the shadow banking system in the broader
context of the operation of the international capital markets, leveraging work by the IMF’s
Statistics Department (STA) on global flow of funds (GFF).3 In particular, we will use a new
GFF conceptual framework (see Errico, et al., 2013) to map the funding and lending
positions associated with shadow banking in the United States.
In the rest of the paper, we will illustrate the potential usefulness of the GFF approach in the
context of identifying both the directions and the magnitudes of the capital flows associated
with the shadow banking system in the United States. The work in mapping the flows is still
in its early stages, and several simplifying assumptions have been employed due to existing
gaps in the data, on which more below.
2 See Claessens et al, 2012; Pozsar and Singh, 2011; and Singh and Aitken, 2010.
3 In this paper, the shadow banking is defined as a global space concept (matrix), which reaches outside
traditional borders of banks and non-banks, and is quantified using a survey of financial liabilities covering
institutions, markets, and financial instruments. Therefore, the shadow banking defined in this paper combines
non-core liabilities of other depository corporations (ODCs), also more commonly referred to as banks, and
other financial corporations (OFCs).

5
In a nutshell, the new GFF conceptual framework is aimed at constructing a GFF matrix,
mapping domestic and external financial stocks which can be then broken down bilaterally
(potentially) by the 30 or so jurisdictions identified by the IMF as hosting systemically-
important financial sectors.4 The domestic and external financial stocks matrices use existing
IMF and other data sources and, for policy-makers, help strengthen the analysis of
interconnectedness across borders, global liquidity flows and global financial
interdependencies, and support assessments of shadow banking activities.
Shadow banking grew rapidly before the global financial crisis, from an estimated
US $27 trillion in 2002 to US $60 trillion in 2007 (FSB (2011, p. 8)). Adrian, Ashcraft and
Cetorelli (2013) list several reasons for why the shadow banking system may arise, such as
specialization and regulatory arbitrage, and they also list the potential costs of the shadow
banking system, such as the leverage cycle, funding fragilities, and neglected risks. A
broader question is what role the international context plays in the fluctuations in the size of
the shadow banking system. A useful distinction in this regard is that between core and
noncore liabilities of the banking and intermediation sector more generally (Shin and
Shin (2012)). Core liabilities can be defined as the funding that the intermediaries draw on
during normal times, and is sourced (in the main) domestically.
The constituents of core funding will depend on the context and the economy in question, but
retail deposits of the domestic household sector would be a good first conjecture in defining
core liabilities. When banking sector assets are growing strongly during a lending boom, the
core funding available to the intermediary sector is likely to be insufficient to finance the
rapid growth in new lending. That is, the pool of retail deposits is not likely to be sufficient to
fund the increase in bank credit. Other sources of funding must then be tapped to fund
rapidly increasing bank lending. The state of the financial cycle is thus often reflected in the
composition of intermediary liabilities.
4 The identified 30 or so jurisdictions together are responsible for about 90 per cent of global cross-border
claims.

6
Such procyclical behavior of the banking sector has consequences for capital flows. When
credit is expanding rapidly, outstripping the pool of available retail deposits, the bank will
turn to other sources of funding to support its credit growth, typically from other banks
operating as wholesale lenders in the capital market.
Figure 1: Lending Boom Financed by Noncore Liabilities. This figure depicts the banking sector balance
sheet before and after a credit boom. Increased lending during a credit boom is financed by noncore
liabilities.
Source: Hahm, Shin and Shin (2013).
Figure 1 is a schematic illustration of the way that a lending boom will be associated with
shifts in the composition of the balance sheet of the financial intermediary sector. The bottom
panel of Figure 1 is the intermediation sector before a credit boom, while the top panel
illustrates the intermediation sector during the boom. As traditional deposit funding does not
keep up with the credit growth, the banking sector's expansion is funded by noncore
liabilities (in this example, from foreign creditors), building up vulnerabilities to
deleveraging by foreign creditors.5 Hahm, Shin and Shin (2013) show through a cross-
country panel probit study that the incidence of noncore liabilities of the banking system has
value in signaling the onset of financial crises.
5 In this paper, we use the terms “noncore liabilities” and the “capital flows associated with shadow banking
system” interchangeably.
Domestic
DepositorsBorrowers
Banking
Sector
Foreign
Creditors
New
Borrowers
Domestic
DepositorsBorrowers
Banking
Sector
After
Lending
Boom
Before
Lending
Boom

7
The schematic in Figure 1 can be associated with core and noncore liabilities of the financial
corporations sector (as shown in Figure 18 below) and also with current account deficits that
are financed through the increased borrowing by the domestic intermediation sector. For
some instances (e.g., the experience of Spain in the 2000s) such a picture captures the key
elements of the relationship between lending booms and capital flows.
The schematic in Figure 1 misses some crucial aspects. For instance, having a current
account surplus would not be a sufficient condition for avoiding a crisis if the schematic in
Figure 1 applied to the banking sector when viewed in isolation, even if other sectors of the
economy ran surpluses vis-à-vis the rest of the world. If the foreign creditors to domestic
banks are global banks, they may be subject to funding pressures and may withdraw their
lending in the event of a sharp deterioration of capital market conditions. The identity of the
lenders will, therefore, matter when assessing the degree of vulnerability.
Another way to state the same point is that gross flows for each sector will matter, as well as
net flows for the whole economy. Even if the country as a whole is running a current account
surplus, if the intermediation system conforms to the picture in Figure 1, then the
deleveraging by the creditors to the intermediation system will matter for a vulnerability
assessment.6
Our findings address a wider set of issues that have attracted recent attention in international
finance. Whereas current account gaps have traditionally been considered as the determinant
of capital flows, many recent papers have drawn attention to the dramatic increase in gross
capital flows, especially through the banking sector—see Borio and Disyatat (2011), Forbes
and Warnock (2012), Lane and Pels (2011), Obstfeld (2012a, 2012b) and Rey (2013).
Indeed, Obstfeld (2012b p.3) concludes that "large gross financial flows entail potential
stability risks that may be only distantly related, if related at all, to the global configuration of
saving-investment discrepancies." One reason for the caution is that the growth in gross
6 South Korea’s experience in the run-up to the 2008 crisis gives useful lessons in this regard. South Korea ran
either balanced current accounts or saw surpluses in the years leading up to the 2008 crisis, but was one of the
countries most severely affected by the financial turmoil unleashed after the bankruptcy of Lehman Brothers in
September 2008.
8
capital flows was associated with increased leverage and the size of the banking sector as a
whole, as emphasized by Gourinchas and Obstfeld (2012) and Schularick and Taylor (2012).
Our contribution relative to the existing literature is to highlight the interaction of global and
local banks as the driver of fluctuations in financial conditions.
Based on the approach developed by Errico, et al. (2013), the GFF has two dimensions, as we
will explain in more detail below. One dimension is the mapping of the balance sheet of each
sector to other sectors in the domestic economy and the rest of the world. The second
dimension is the mapping of the external sector to all the jurisdictions globally. The two
dimensional mapping allows policy makers to ascertain the answers to questions that relate to
the links between sector j in country A to country B, and can potentially be expanded to also
identify the sector k in country B. (See Table 2 and Figure 3 for illustration.) Such granular
information across sectors and countries will be crucial when we begin to address the
operation of the shadow banking system, as many of the legal entities that make up the
shadow banking system will not be captured as being part of the formal banking system.
In the rest of the paper, we will illustrate the potential usefulness of GFF analysis in the
context of identifying both the directions and the magnitudes of the capital flows associated
with the shadow banking system in the United States. The work in mapping the flows is still
in its early stages, and several simplifying assumptions have been employed, due to existing
data gaps and confidentiality constraints.7
Our illustrative work is retrospective. This exercise provides many useful lessons on what
types of data would have been informative during the boom phase, and directs the policy
makers to ask the right questions. In this sense, even though our exercise is retrospective, it
holds out hopes that a more systematic application of the methods described in our paper
may illuminate the nature of the link between capital flows between sectors. Through such an
exercise, the understanding thus gained would enable national and global policy makers in
identify trends on a timely basis that they may employ in their surveillance work.
7 Annex 3 provides a synopsis of identified data gaps and measurement constraints.

9
We discuss next the extent to which such GFF analysis may help identify the flow of funds
through the U.S. shadow banking system in the context of a national and global financial
system and help identify vulnerabilities associated with current developments in emerging
market economies.
Our paper concludes with a discussion on directions for future work and existing data gaps.
This is followed by a discussion on how closing the identified data gaps will support the GFF
analysis, including mapping the shadow banking.
II. OVERVIEW OF THE U.S. FINANCIAL SYSTEM
The objective of the GFF approach employed in this paper is to produce the full domestic and
external stock matrices. Table 1 and Table 2 show what may be possible in a GFF
framework for the United States which will enable the monitoring of financial positions both
regional/national and cross-border (by country and sector). First results are presented in this
paper.
Table 1 is an illustration of the Balance Sheet Approach (BSA) matrix for the United States
for the end of 2012. The matrix identifies nine sectors: eight domestic sectors and the
nonresidents sector. Each column corresponds to the balance sheet of the sector in question,
and the assets and liabilities are then listed in the rows by instrument with the counterparty
sectors identified for each cell. In Annex 1 we provide a fuller discussion of the methodology
for deriving the BSA matrix.
By way of illustration, the red circled set of entries in Table 1 shows that the OFCs in the
United States held assets of US $2,453 billion against the U.S. banking sector (or ODCs)8
largely in the form of currency and deposits and had liabilities of US$3,920 billion to ODCs
in the form of securities other than shares primarily.
8 For the definitions of other depository corporations (ODCs) and other financial corporations (OFCs) see
International Monetary Fund (2000) and International Monetary Fund (2008).

10
Table 1: BSA matrix for the Unites States for 2012
Source: IMF Statistics Department, BIS International Banking Statistics, U.S. Federal Reserve Board.
11
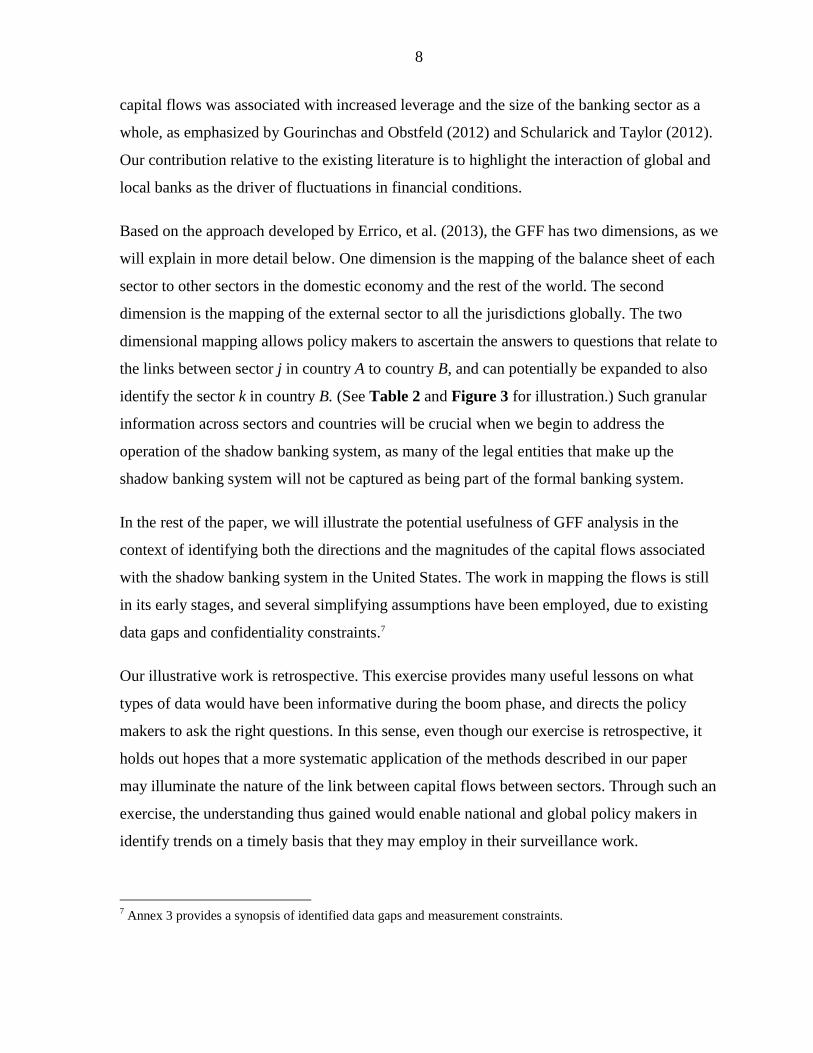
Table 2: United States external flow of funds matrix for 2012
Source: IMF Statistics Department, BIS International Banking Statistics, U.S. Federal
Reserve Board.
Note: Columns 2-4 of the United States external flow of funds matrix are taken from
the last three columns of the Table 1 BSA matrix for the Unites States. Numbers in
column two correspond to the nonresident assets in USA (USA liabilities to
nonresidents) and in column three nonresident liabilities in USA (USA assets abroad).

12
Table 2 is the external flow of funds matrix for the United States for 2012, where the
external assets and liabilities have been disaggregated into the counterpart country, and by
instrument. In Annex 2, we provide a fuller discussion of the methodology for the external
flow of funds matrix.
When the information in Table 1 is combined with that in Table 2 we can map out the
complete bilateral relationships between national/regional economies using stock data. The
matrices could potentially be extended to flow data to quantify gross bilateral flows into:
(i) transactions; (ii) changes in the value of a financial asset/liability; and (iii) other changes
in volume of an asset/liability. For this next step, we would need to break down transactions
data by counterpart country.
Shin (2012) provides additional evidence that some of the funding that was taken out of the
United States by the European banks were recycled back into the United States for the
purchase of non-Treasury securities and shares, so that the European banks became part of
the overall intermediation system linking U.S. savers and U.S. borrowers (Figure 2).
Figure 2: European global banks and the U.S. banking system
Source: Shin (2012).
Although the combination of publicly available information on U.S. balance of payments and
other sources on the European banking sector gives some suggestive insights into the
relationship between capital flows through the banking and nonbank sectors and the shadow
banking system in the United States, the evidence is partial and incomplete in two important
respects.
US
HouseholdsUS
Borrowers
US
Banking
Sector
European
Global
Banks
border
Wholesale
funding market
Shadow banking
system

13
First, although the direction of the arrows in Figure 2 gives some qualitative insights into the
flows, the available evidence is patchy in terms of the quantities. Thus, for instance, we do
not have a good handle on the question of whether the type of “round trip” flows where
money first leaves the United States via the banking sector to return in the shape of the
purchase of non-Treasury securities, formed the bulk of the flows, or only a small proportion.
Second, the flows are not disaggregated into the flows to and from individual countries or
even regions. The publicly available data do not give systematic quantitative evidence on the
activities of some group of banks relative to other banks and nonbanks.
The GFF conceptual framework that pieces together the information on the domestic flow of
funds with the international investment positions gives a potential route to addressing these
issues. In what follows below, we give some preliminary approaches to remedy identified
information gaps. In Annex 3, we summarize the main measurement issues involved in the
GFF approach employed in this paper.
In the aggregate, the bilateral positions between the United States and the Euro area,
Switzerland, and the U.K., are shown in Figure 3 below.
Figure 3: USA: external assets/liabilities by counterpart country and main instrument in 2012
Source: IMF Statistics Department, BIS International Banking Statistics, U.S. Federal Reserve Board, ECB.
14
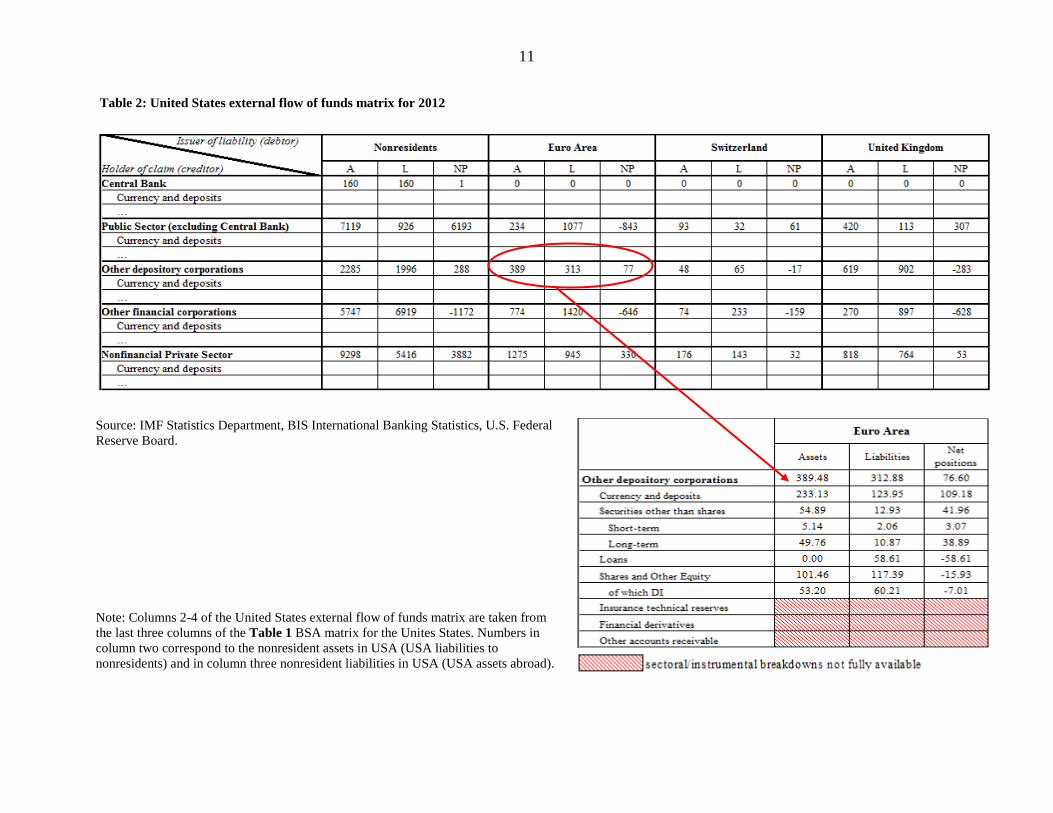
The GFF external matrix then allows presenting external positions for U.S. resident sectors
by counterpart country and by instrument. Figure 4 presents U.S. financial corporations’
assets and liabilities vis-à-vis the Euro Area by type of instrument.
Figure 4: USA: Financial corporations' assets/liabilities vis-à-vis Euro Area by main instrument9
Source: IMF’s Monetary and financial statistics/SRFs.
Although the GFF external matrix aggregates the sectors of the economy into broad
categories, two features make the GFF external matrix informative about the direction of
flows and the quantities behind those flows.
First, the shadow banking system is intimately tied to the workings of the formal banking
system—the ODCs sector, and so tracking the ODCs sector gives information on the
composition of the flows in the shadow banking system.
Second, in spite of the categorization of nonbanks as “Other Financial Corporations” (OFCs),
the legal form of the claim can give estimates of the counterparty in the capital inflows
through the purchase of securitized claims (inward-pointing arrow in Figure 2). We take
these points in turn.
9 Figure 4 shows assets/liabilities of US financial corporations, which includes assets/liabilities of ODCs and
OFCs. Data on Euro Area’s holdings of US financial corporations’ shares are not available.
15
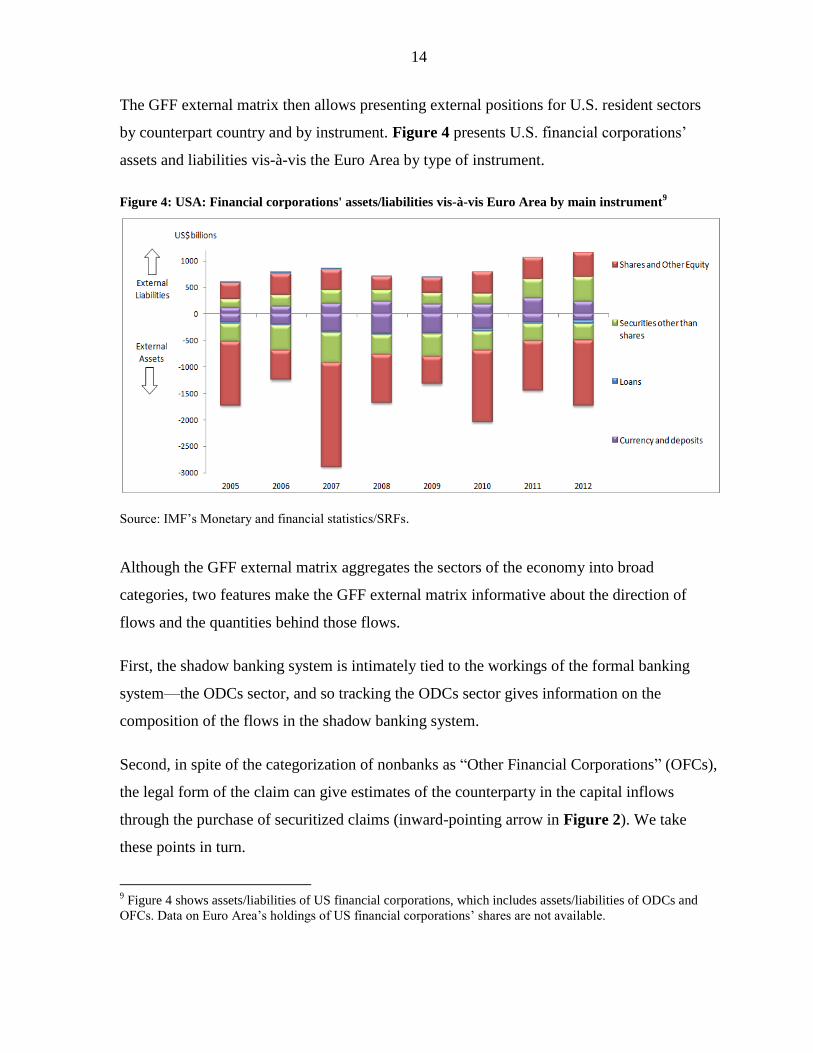
Begin with the U.S. banking system. Consider Figure 5, which shows the gross external
assets and gross external liabilities of the formal U.S. banking system (ODCs sector) by
instrument. The figure covers all the major items on bank balance sheets.
Figure 5: Gross external assets and external liabilities of the U.S. banking system (ODC sector) by
instrument
Source: IMF Statistics Department.
Figure 5 is notable in several respects. Note that the dominant component of the external
claims and liabilities is “currency and deposits.” Loans, securities and shares, and other
equity are each only a small part of the external balance sheet.
The fact that deposits form the main part of the external claims and liabilities suggests that
interbank claims form the bulk of the cross-border linkages for the U.S. banking sector. What
is important to bear in mind is that the external matrix is drawn up on a residence basis. Thus,
the U.S. banking sector includes the U.S.-based branches and subsidiaries of foreign banks.
We will see independent verification later in the paper that a substantial part of the interbank
deposits are the interoffice claims of a branch or subsidiary with its parent bank.
The fact that loans play such a small role in Figure 5 suggests that the role of the U.S.
banking sector in the global financial system has changed greatly from the 1960s and 1970s

16
when the major U.S. banks were large creditors to Latin American sovereigns in the form of
loans, as the sovereign bond market was relatively underdeveloped for emerging economies
then. The funding for the loans to Latin American sovereigns came from the recycled dollar
deposits of the petroleum exporters. Thus, the composition of the external balance sheet of
the U.S. banking system would have been quite different, with loans accounting for the bulk
of the external assets.
If we focus attention only on the “currency and deposits” category in Figure 5, we can
decompose this item by the location of the counterparty. That information is presented in
Figure 6, where we show three counterparties—the U.K., Euro area, and Switzerland. The
notable feature of Figure 6 is the weight of the U.K. in the total. Together with our earlier
point that most of the external claims and liabilities are interbank claims, the combination of
Figure 5 and Figure 6 suggests that banks located in the U.K. play an important role in the
U.S. banking system. Given that the data in these figures are residence based, they also cover
the positions between UK resident banks’ branches and subsidiaries in the United States and
between U.S. resident banks’ branches and subsidiaries in the UK which contribute
significantly to the intermediation of flows between these two countries.
Figure 6: Counterparties by location of the “Currency and Deposits” component of the U.S. banking
system (ODC sector)
Source: IMF Statistics Department.
17
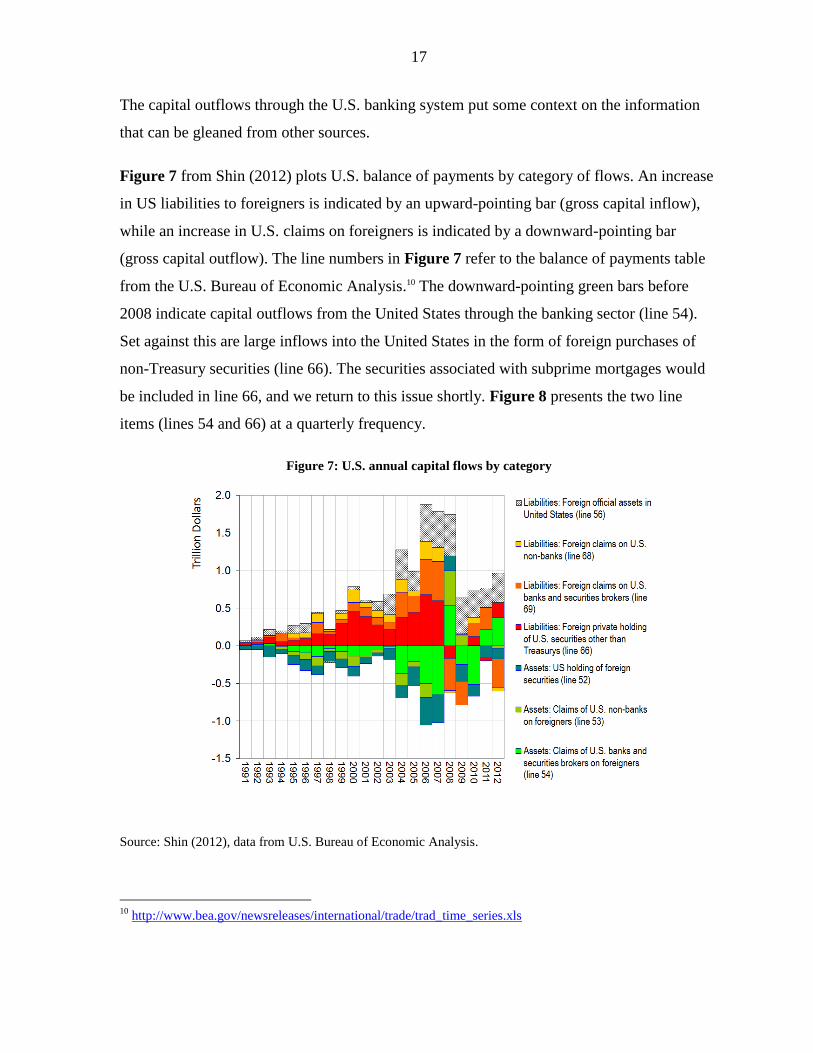
The capital outflows through the U.S. banking system put some context on the information
that can be gleaned from other sources.
Figure 7 from Shin (2012) plots U.S. balance of payments by category of flows. An increase
in US liabilities to foreigners is indicated by an upward-pointing bar (gross capital inflow),
while an increase in U.S. claims on foreigners is indicated by a downward-pointing bar
(gross capital outflow). The line numbers in Figure 7 refer to the balance of payments table
from the U.S. Bureau of Economic Analysis.10 The downward-pointing green bars before
2008 indicate capital outflows from the United States through the banking sector (line 54).
Set against this are large inflows into the United States in the form of foreign purchases of
non-Treasury securities (line 66). The securities associated with subprime mortgages would
be included in line 66, and we return to this issue shortly. Figure 8 presents the two line
items (lines 54 and 66) at a quarterly frequency.
Figure 7: U.S. annual capital flows by category
Source: Shin (2012), data from U.S. Bureau of Economic Analysis.
10
http://www.bea.gov/newsreleases/international/trade/trad_time_series.xls

18
Figure 8: U.S. quarterly capital flows by category
Source: U.S. Bureau of Economic Analysis.
We noted earlier that the external claims and liabilities of the U.S. banking system consist
mainly of interbank claims. We can gain some additional insights on the nature of those
interbank claims from the balance sheets of foreign banks operating in the United States.
Figure 9: Net interoffice assets of foreign banks in the United States
Source: Federal Reserve Board H8 series on commercial banks.

19
Figure 9 plots the assets and liabilities of foreign banks in the United States (left panel) and
their net interoffice assets (right panel) obtained from the Federal Reserve.11
Normally, we would expect net interoffice assets to be negative, as foreign bank branches act
as lending outposts. However, the decade between 2001 and 2011 was exceptional, when net
interoffice assets turned sharply positive, before reversing into negative territory during the
2011. Foreign banks’ branches and subsidiaries in the United States are treated as U.S.
resident banks in the balance of payments, as the balance of payments accounts are based on
residence, not nationality basis. Therefore, Figure 9 suggests that an important component of
the capital outflows from the United States through the banking sector (line 54) is accounted
for by the activity of foreign banks. Shin (2012) points to further evidence from the money
market funds (MMFs) sector that the foreign banks engaged in sending funds to their
headquarters were the European banks.
Figure 10 plots the chart from the IMF’s Global Financial Stability Report of
September 2011 of the amount owed by banks to U.S. prime MMFs based on top 10 prime
MMFs, representing US$755 billion of approximately US$1.66 trillion total prime MMF
assets, classified by nationality of the borrowing bank. As Figure 10 shows, U.S. prime
MMFs have almost completely withdrawn from EU periphery as of the second half of 2011.
Figure 10: Amount owed by banks to US prime MMFs (% of total), by nationality of borrowing bank
Source: IMF GFSR September 2011; and Fitch database.
11
Net interoffice assets measure the net claim of the branch or subsidiary of the foreign bank on its parent.

20
Around 50 percent of the assets of the prime MMFs are the obligations of European banks,
and Figure 11 gives a snapshot of the dollar amounts borrowed by European banks as of
June 30, 2011. In effect, during the decade between 2001 and 2011, European bank offices in
the United States became funding sources for the parent, rather than lending outposts. As
noted in a recent BIS (2010) report, many European banks use a centralized funding model in
which available funds are deployed globally through a centralized portfolio allocation
decision.
Figure 11: Amount owed by banks to US prime MMFs on June 30, 2011, by nationality of borrowing
bank
Source: IMF GFSR September 2011; and Fitch database.
We now turn to the capital inflows, and to the inward-pointing arrow in Figure 2, which
indicates the capital inflows into the United States through the purchase of securitized debt
instruments. The GFF external matrix has the claims and obligations of the OFCs, that is, the
nonbank financial institutions in the United States. This category encompasses a broad group
of financial institutions, such as mutual funds, insurance companies, pension funds and
others. Thus, extracting information from such a broad category may appear to be difficult at
first. However, the legal form of the claim can give us useful clues on the capital inflows
through the purchase of securitized claims (inward-pointing arrow in Figure 2) and the
counterparty in such flows.

21
The external liabilities of the OFCs are broadly divided into two categories: equity (“Shares
and other equity”) and debt securities (“Securities other than shares”). For mutual funds, their
liabilities are mostly equity shares, and so foreign stakes in U.S. mutual funds will not figure
in the “Securities other than shares” category. The same is true for insurance companies and
pension funds. Only a small portion of insurance company liabilities are in the form of debt
securities, and so focusing on debt securities will eliminate from consideration most
insurance company liabilities held by foreigners. This will leave the debt securities issued by
nonbank financial intermediaries, such as the broker dealers, the special purpose vehicles that
hold securities claims on mortgages and other vehicles in the shadow banking system. The
OFC debt security category will also include the Government-Sponsored Enterprises (GSEs),
such as Fannie Mae and Freddie Mac.
Figure 12 shows the gross external liabilities of U.S. OFCs that are in the form of debt
securities, and they are sub-divided into three counterpart countries—the U.K., Euro area,
and Switzerland.
Figure 12: Gross external liabilities of the Other Financial Corporations (OFCs) sector in “Securities
Other Than Shares” by location of counterparty
Source: IMF Statistics Department.
We see that starting in 2008 the U.K. holdings of U.S. OFCs debt securities are small
compared to that of the Euro area. We also see the fluctuations in the holdings of the U.K.

22
and Euro area due to the financial crisis. The amounts held by the U.K. and Euro area fall in
2008, to rebound by 2011. Holdings of OFCs’ debt securities by other counterpart countries
include different groups. On the one hand, this category will contain non-U.K. and non-Euro
area creditors from Europe that hold private label mortgage-backed securities (MBSs). On
the other hand, the bulk will be the current account surplus countries that hold GSE securities
as a substitute for U.S. Treasury securities. To the extent that GSE securities have quite
different attributes from the private label MBSs that were responsible for the subprime crisis,
a careful distinction between the two would shed further light on the capital flows that are
directly related to the subprime securitizations in the middle years of the last decade.
Thus far, we have viewed the capital flows from the U.S. external matrix in the GFF
approach. Nonetheless, the strength of the GFF approach is that the same exercise that we
have done for the United States can be done for other participating regions of the world.
In particular, two additional exercises should shed much light on the quantities and
counterparties involved in the U.S. shadow banking. The first is to construct the external
GFF matrices for the Euro area and the U.K. and then to examine the gross external claims
and liabilities of the banking (ODCs) sector in the two jurisdictions. The “roundtrip” of U.S.
dollar funding depicted in the schematic flow chart in Figure 2 will only be settled if we can
identify not only the residence of the investor, but also the type of the investor. By examining
more closely the external GFF matrix for the Euro area and the U.K., it would be possible to
settle the question of whether the banks in these jurisdictions brought U.S. dollar funding
from their branches and subsidiaries in the United States back to their headquarters location,
and then sent the funds back to the U.S. in order to purchase debt securities issued by the
special purpose entities involved in the U.S. shadow banking system.
The task of disaggregating the external GFF matrix by counterparty location and by
counterparty sector would be the ultimate goal of the approach, so that we can treat each
sector in each location as a node in the network of interconnections. The disaggregation of
the relationships by counterparty location and sector would mean that the two-dimensional
tables that we have used to motivate the exercise would no longer be adequate to visualize
the full set of connections. Clearly, pursuing such an endeavor without focusing on specific
23
pre-defined relationships would result in incidental details and very small quantities that
would not be interesting and instead obscure the key relationships. Thus, any measurement
exercise will need to be guided by careful selection of the pairwise relations between the
(location, sector) nodes in the network.
Leaving this ambitious endeavor for a later time we will, for now, engage in a much more
basic exercise of measuring the broad categories of credit and funding involved in the U.S.
shadow banking system that can be gleaned from the BSA matrix and the external GFF
matrix.
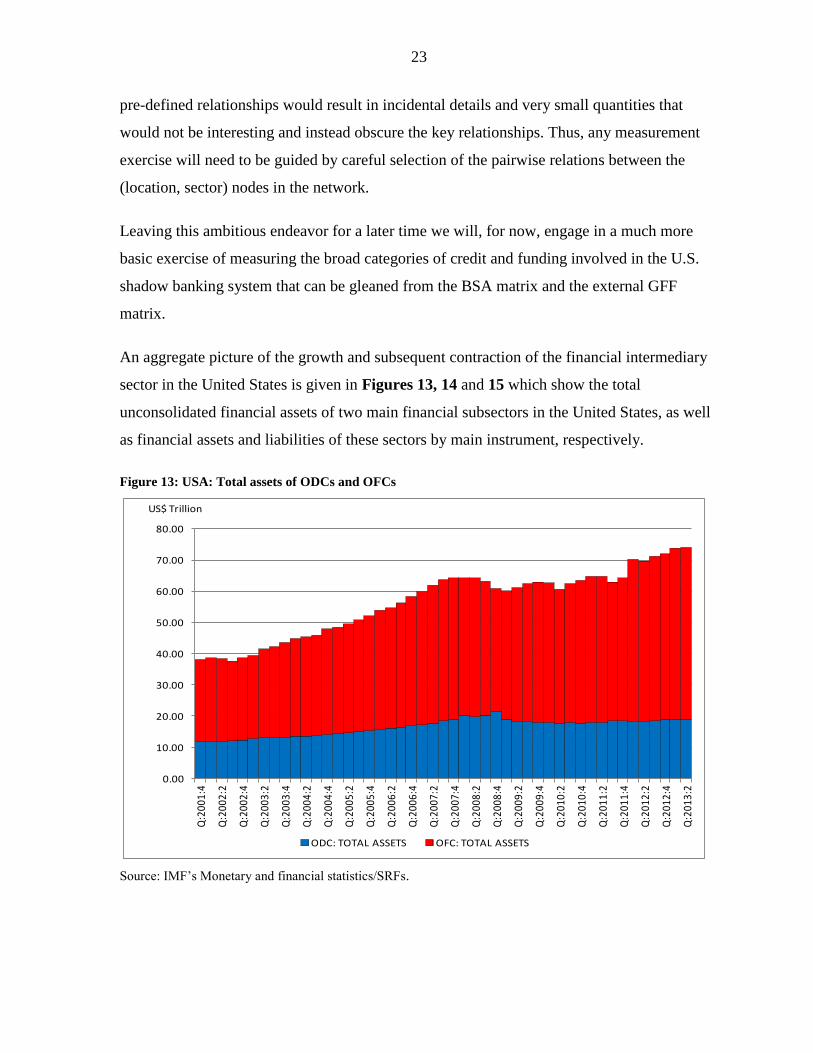
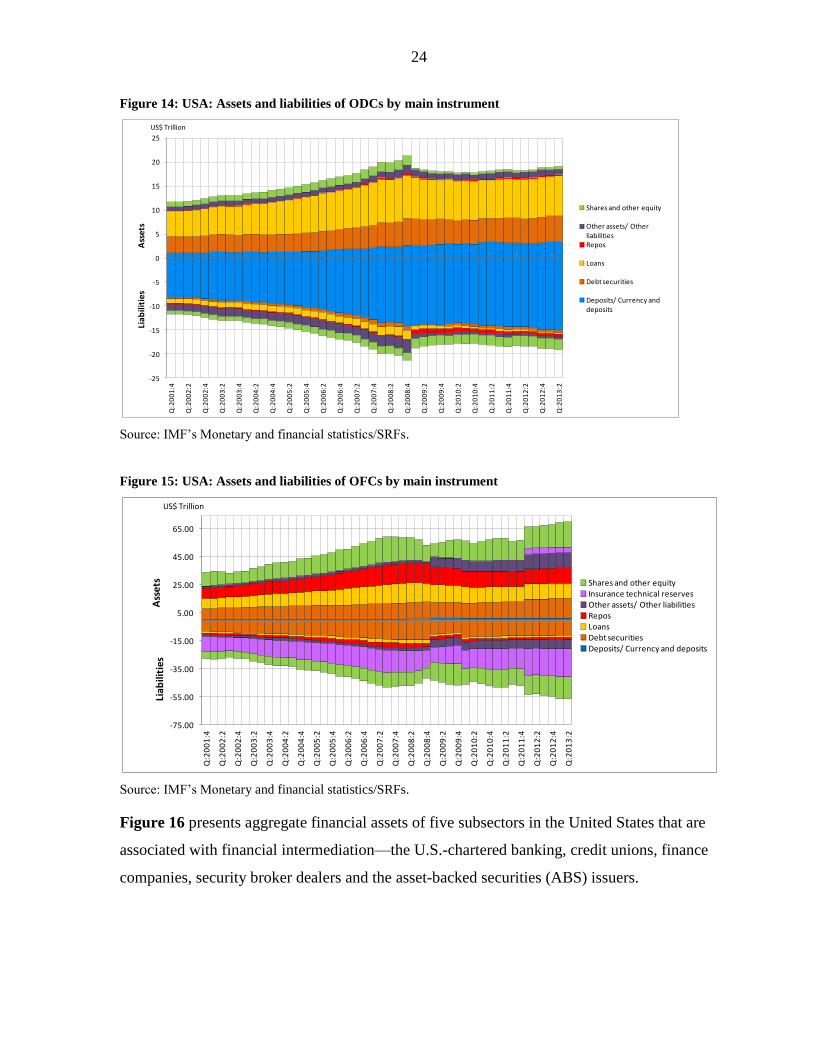
An aggregate picture of the growth and subsequent contraction of the financial intermediary
sector in the United States is given in Figures 13, 14 and 15 which show the total
unconsolidated financial assets of two main financial subsectors in the United States, as well
as financial assets and liabilities of these sectors by main instrument, respectively.
Figure 13: USA: Total assets of ODCs and OFCs
Source: IMF’s Monetary and financial statistics/SRFs.
0.00
10.00
20.00
30.00
40.00
50.00
60.00
70.00
80.00
Q:2
001:
4
Q:2
002:
2
Q:2
002:
4
Q:2
003:
2
Q:2
003:
4
Q:2
004:
2
Q:2
004:
4
Q:2
005:
2
Q:2
005:
4
Q:2
006:
2
Q:2
006:
4
Q:2
007:
2
Q:2
007:
4
Q:2
008:
2
Q:2
008:
4
Q:2
009:
2
Q:2
009:
4
Q:2
010:
2
Q:2
010:
4
Q:2
011:
2
Q:2
011:
4
Q:2
012:
2
Q:2
012:
4
Q:2
013:
2
ODC: TOTAL ASSETS OFC: TOTAL ASSETS
US$ Trillion
24
Figure 14: USA: Assets and liabilities of ODCs by main instrument
Source: IMF’s Monetary and financial statistics/SRFs.
Figure 15: USA: Assets and liabilities of OFCs by main instrument
Source: IMF’s Monetary and financial statistics/SRFs.
Figure 16 presents aggregate financial assets of five subsectors in the United States that are
associated with financial intermediation—the U.S.-chartered banking, credit unions, finance
companies, security broker dealers and the asset-backed securities (ABS) issuers.
-25
-20
-15
-10
-5
0
5
10
15
20
25
Q:2
00
1:4
Q:2
00
2:2
Q:2
00
2:4
Q:2
00
3:2
Q:2
00
3:4
Q:2
00
4:2
Q:2
00
4:4
Q:2
00
5:2
Q:2
00
5:4
Q:2
00
6:2
Q:2
00
6:4
Q:2
00
7:2
Q:2
00
7:4
Q:2
00
8:2
Q:2
00
8:4
Q:2
00
9:2
Q:2
00
9:4
Q:2
01
0:2
Q:2
01
0:4
Q:2
01
1:2
Q:2
01
1:4
Q:2
01
2:2
Q:2
01
2:4
Q:2
01
3:2
Shares and other equity
Other assets/ Other liabilitiesRepos
Loans
Debt securities
Deposits/ Currency and deposits
US$ Trillion
Liabilities
Assets
-75.00
-55.00
-35.00
-15.00
5.00
25.00
45.00
65.00
Q:2
00
1:4
Q:2
00
2:2
Q:2
00
2:4
Q:2
00
3:2
Q:2
00
3:4
Q:2
00
4:2
Q:2
00
4:4
Q:2
00
5:2
Q:2
00
5:4
Q:2
00
6:2
Q:2
00
6:4
Q:2
00
7:2
Q:2
00
7:4
Q:2
00
8:2
Q:2
00
8:4
Q:2
00
9:2
Q:2
00
9:4
Q:2
01
0:2
Q:2
01
0:4
Q:2
01
1:2
Q:2
01
1:4
Q:2
01
2:2
Q:2
01
2:4
Q:2
01
3:2
Shares and other equityInsurance technical reservesOther assets/ Other liabilitiesReposLoansDebt securitiesDeposits/ Currency and deposits
Assets
Liab
ilities
US$ Trillion

25
0.0
5.0
10.0
15.0
20.0
25.0
19
95
Q1
19
96
Q1
19
97
Q1
19
98
Q1
19
99
Q1
20
00
Q1
20
01
Q1
20
02
Q1
20
03
Q1
20
04
Q1
20
05
Q1
20
06
Q1
20
07
Q1
20
08
Q1
20
09
Q1
20
10
Q1
20
11
Q1
20
12
Q1
Trilli
on d
olla
rs
Issuers of asset-backedsecurities; total financialassets
Security brokers and dealers;total financial assets
Finance companies; totalfinancial assets
Credit unions; total financialassets
U.S.-chartered depositoryinstitutions; total financialassets
Figure 16: Total assets of financial intermediation sectors in the United States
Source: U.S. Federal Reserve Flow of Funds.
We see from Figure 16 that the two sectors that saw the greatest fluctuations were the ABS
issuer sector and the security broker dealer sector, both associated with the market-based
intermediation sector where credit intermediation takes place through the securitization of
financial claims.12 The ABS issuers consist of the legal entities (special purpose vehicles) that
are associated with the securitization of financial claims, and so would encompass the entities
that securitized subprime mortgage claims. Figure 16 does not correspond exactly to the total
credit outstanding to the ultimate borrowers. It does not include the GSEs such as Fannie
Mae and Freddie Mac, and so could underestimate total lending. On the other hand there will
also be some double-counting of credit flows, for instance, when a security broker dealer
holds a security issued by an ABS issuer.
Figure 16 above bears some resemblance to the schematic in Figure 1 on the expansion of
the intermediary sector during and upward phase of the credit boom, and the ABS-issuer
sector and broker dealer sector could be seen as an approximation to the noncore liabilities of
the intermediation system. Moreover, since the ABS issuer sector and the security broker
12
See Adrian and Shin (2010) for a survey of the market-based intermediation system in the United States.
26
dealer sector are nonbank financial firms, they would be classified as OFCs under the
classification system used in the monetary statistics and balance of payments, so that even a
coarse decomposition of the sectors would capture the main trends.
We could improve upon Figure 16 if further split of liability side deposits were available for
ODCs. In monetary statistics, liability side short-term repos included in broad money are
classified as deposits, so that liability side deposits may include short-term repos. For ODCs
that saw more stable growth in assets, some of the asset growth may have been funded
through repos or other market-based funding methods that have more in common with the
noncore liabilities of the intermediation sector, but are not clearly disaggregated in monetary
statistics.
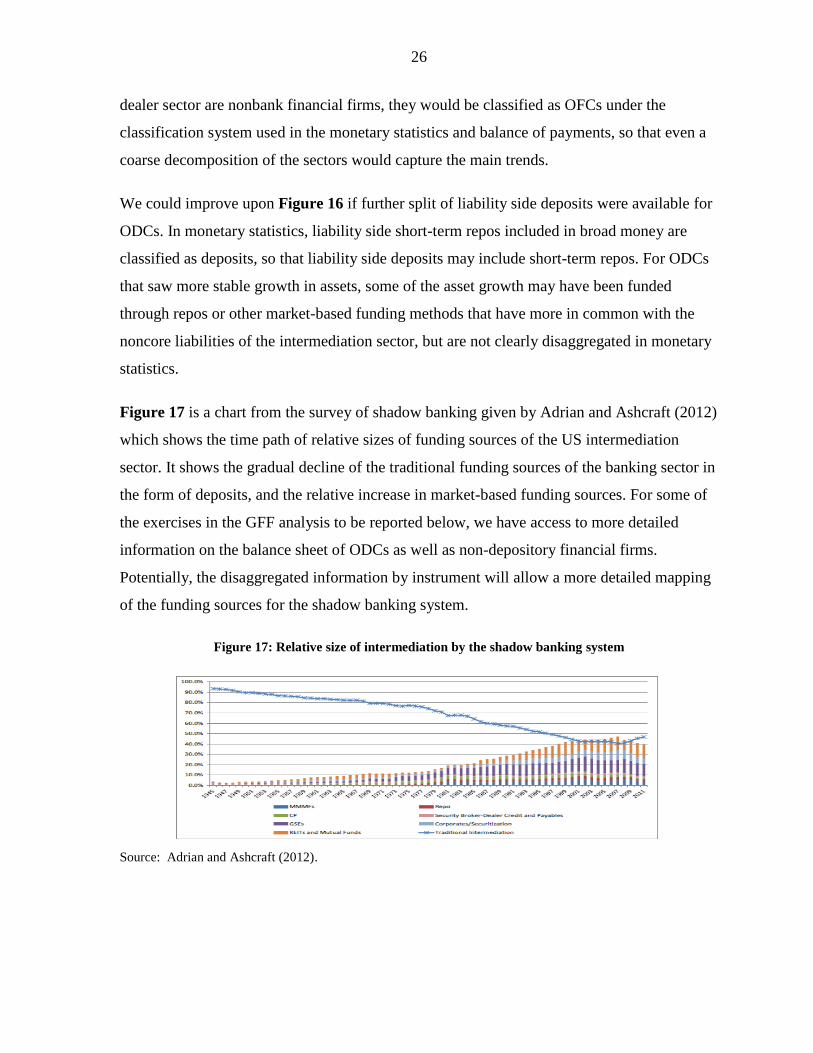
Figure 17 is a chart from the survey of shadow banking given by Adrian and Ashcraft (2012)
which shows the time path of relative sizes of funding sources of the US intermediation
sector. It shows the gradual decline of the traditional funding sources of the banking sector in
the form of deposits, and the relative increase in market-based funding sources. For some of
the exercises in the GFF analysis to be reported below, we have access to more detailed
information on the balance sheet of ODCs as well as non-depository financial firms.
Potentially, the disaggregated information by instrument will allow a more detailed mapping
of the funding sources for the shadow banking system.
Figure 17: Relative size of intermediation by the shadow banking system
Source: Adrian and Ashcraft (2012).
27
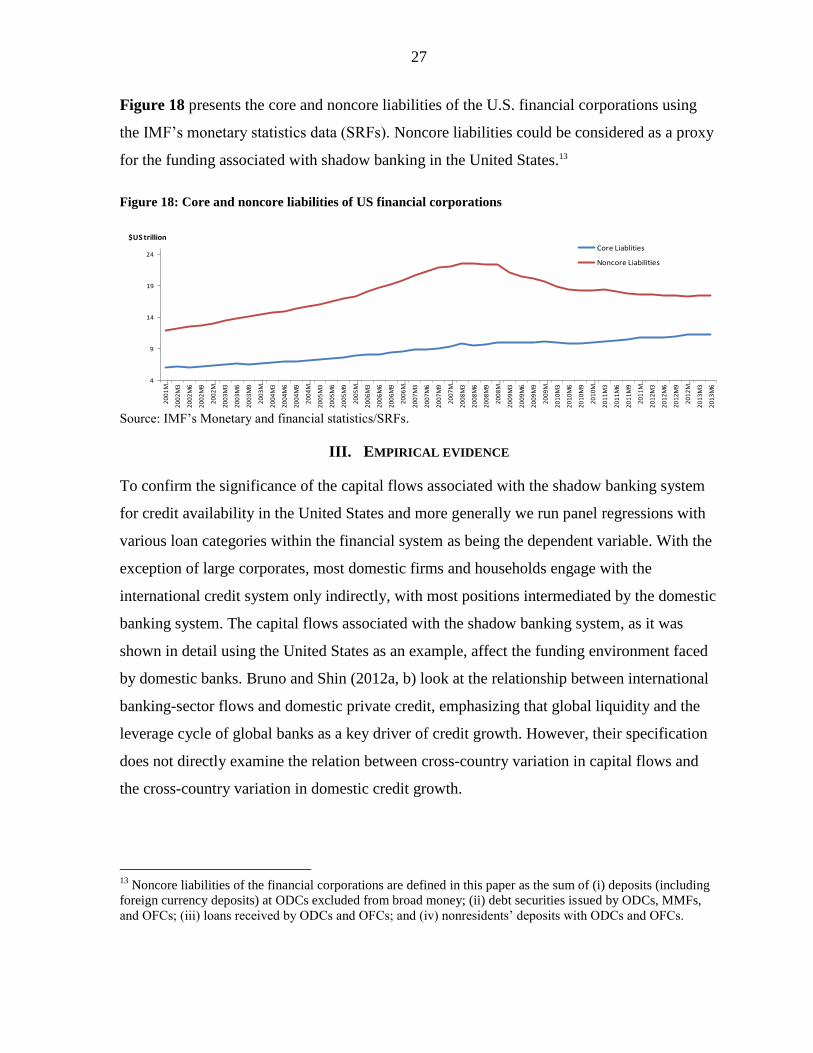
Figure 18 presents the core and noncore liabilities of the U.S. financial corporations using
the IMF’s monetary statistics data (SRFs). Noncore liabilities could be considered as a proxy
for the funding associated with shadow banking in the United States.13
Figure 18: Core and noncore liabilities of US financial corporations
Source: IMF’s Monetary and financial statistics/SRFs.
III. EMPIRICAL EVIDENCE
To confirm the significance of the capital flows associated with the shadow banking system
for credit availability in the United States and more generally we run panel regressions with
various loan categories within the financial system as being the dependent variable. With the
exception of large corporates, most domestic firms and households engage with the
international credit system only indirectly, with most positions intermediated by the domestic
banking system. The capital flows associated with the shadow banking system, as it was
shown in detail using the United States as an example, affect the funding environment faced
by domestic banks. Bruno and Shin (2012a, b) look at the relationship between international
banking-sector flows and domestic private credit, emphasizing that global liquidity and the
leverage cycle of global banks as a key driver of credit growth. However, their specification
does not directly examine the relation between cross-country variation in capital flows and
the cross-country variation in domestic credit growth.
13
Noncore liabilities of the financial corporations are defined in this paper as the sum of (i) deposits (including
foreign currency deposits) at ODCs excluded from broad money; (ii) debt securities issued by ODCs, MMFs,
and OFCs; (iii) loans received by ODCs and OFCs; and (iv) nonresidents’ deposits with ODCs and OFCs.
4
9
14
19
24
20
01
M…
20
02
M3
20
02
M6
20
02
M9
20
02
M…
20
03
M3
20
03
M6
20
03
M9
20
03
M…
20
04
M3
20
04
M6
20
04
M9
20
04
M…
20
05
M3
20
05
M6
20
05
M9
20
05
M…
20
06
M3
20
06
M6
20
06
M9
20
06
M…
20
07
M3
20
07
M6
20
07
M9
20
07
M…
20
08
M3
20
08
M6
20
08
M9
20
08
M…
20
09
M3
20
09
M6
20
09
M9
20
09
M…
20
10
M3
20
10
M6
20
10
M9
20
10
M…
20
11
M3
20
11
M6
20
11
M9
20
11
M…
20
12
M3
20
12
M6
20
12
M9
20
12
M…
20
13
M3
20
13
M6
Core Liablities
Noncore Liabilities
$US trillion

28
In this paper, we look at the relationship between domestic growth of loans to non-banks and
the capital flows associated with the shadow banking system for a sample of 82 countries.
Clearly, there may be two-way causality between domestic growth of loans and the capital
flows associated with the shadow banking system. Since it is difficult to find convincing
instruments that might help establish causality, we simply report OLS regressions
coefficients to establish partial correlations. The primary goal of this exercise is to guide
future theoretical work on the relation between noncore liabilities of banks and other
financial corporations and domestic credit growth.14
The dependent variable is domestic growth in loans to non-financial sector (split into private
and public), measured by the change of ODCs and OFCs loans to corporates in logarithms. A
set of independent variables can be grouped in three blocks (i) core and noncore funding of
financial system proxied by the sum of domestic ODC and OFC’s deposits and the sum of
ODC and OFC’s deposits and debt securities liabilities from nonresidents lagged by one
period correspondently; (ii) controls for global liquidity conditions (market volatility index,
global cross-border credit15 and quantitative easing (QE) dummy variable which takes a value
of one during periods of quantitative easing in the USA (lagged by one period); and (iii) a set
of macro controls that are typically used to control for domestic demand and supply
conditions in this type of regressions, also lagged by one period.16 In addition we use country
fixed effects to control for any additional country specific time-invariant characteristics not
captured by our control variables.
14 Clearly, our empirical approach has several limitations. First of all, the use of macroeconomic data - the
results should be cross-checked with the estimation of a VAR model that can capture the dynamic relationship
between growth of loans and the capital flows associated with the shadow banking system. Furthermore, it
would be desirable to come up with an identification strategy that might be able to establish causal impact of
noncore liabilities of banks and other financial institutions on domestic credit growth (or vice-versa). Finally,
the use of micro data at institution level could be useful in understanding how noncore liabilities influence
funding conditions of banks and other financial corporations and loan growth.
15 This variable is taken from the BIS Global liquidity indicators (BIS website).
16 The choice of independent variables is based on Bruno and Shin (2012a,b) and Shin at el (forthcoming).

29
The regression results are presented in Table 3. We see that both core liabilities (proxied by
domestic deposits) and noncore liabilities of banks and OFCs (proxied by securities and
deposits from nonresidents) have significant and positive correlation with domestic growth of
loans to private sector corporate, but no relationship with lending to the public sector
corporate.17 This relationship holds for banks when we split the total lending into lending by
ODCs and OFCs (no result for OFCs as the sample drops significantly).18
The data for the ODC and OFC deposits and securities liabilities draw on the information
contained in the SRFs submitted by individual country monetary authorities to the IMF and
then used to compile monetary data for publication in the International Financial Statistics
(IFS).
Our confirmation that the noncore liabilities of the intermediary sector is closely associated
with the growth of lending gives support to the schematic given at the outset of our paper
(Figure 1) on the role of noncore liabilities financing the marginal increase in lending during
a boom. As we illustrated in Figure 1, when intermediary assets are growing strongly during
a lending boom, the pool of domestic retail deposits is not likely to be sufficient to fund the
increase in lending. Other sources of funding must then be tapped to fund rapidly increasing
lending, and the state of the financial cycle is thus often reflected in the composition of
intermediary liabilities.
Our results on the information value of noncore liabilities are obtained even when controlling
for global factors of credit availability, domestic demand and risk-on sentiment. In the
absence of a cross-country consistent domestic credit rates, we have used a deposit rate as a
proxy of domestic credit rates or a proxy for the domestic costs of borrowing (see Table 3).
17
There are several plausible explanations of insignificant results for loans to public sector corporates. First of
all the types of available lending products and characteristics (pricing, maturity etc) may differ significantly
between private and public corporates. Also the way they build their relationship with lenders may differ, as
well as the information available for monitoring and analysis. Often, lending to public corporates includes
explicit or implicit government guarantees or special regulation.
18 The results for OFCs are not shown as sample size drops from 82 to 15 countries due to data availability in
SRFs.
30
Additionally, we present a series of scatter charts (Figures 19-23) for various instruments
across pre-crisis, crisis, and post-crisis periods in the form of scatter plots. We consider log-
differences for four different sub-periods: pre-crisis period (Q1:2005-Q1:2007), crisis period
(Q1:2007-Q1:2009), post-crisis period (Q1:2009-Q1:2011), “Greek crisis” (Q1:2011-
Q1:2013), and we examine the behavior of each instrument in the sector.
The rationale for showing scatter charts is that they give a visual summary of the changes
that take place in a quantity over two sub-periods. For a noncore liability, its behavior over
the financial cycle will be associated with a more procyclical behavior. It will rise more
during booms, and fall more during the subsequent downturn. The scatter charts reveal the
extent to which such procyclicality shows through. The prediction is that the noncore
category will show more negatively sloped relationships in the scatter chart. The more the
aggregate has increased, the more it will fall subsequently. The scatter charts reveal
considerable evidence of such reversals in total noncore liabilities of ODCs and OFCs
(Figure 19), at the same time there is no clear pattern for disaggregated data.

31
Table 3: Determinants of Domestic Growth of Loans to Non-Financial Sector
Note: This table represents results from fixed effects panel OLS regressions of determinants of domestic growth of loans to non-financial sector. The dependent
variable is the quarterly growth rate of loans to non-financial sector, split into public and private loans. All right hand side variables are taken with one lag to
account for possible endongeneity. Quarterly dummies are included but not shown to account for possibly seasonality in lending. The coefficients are shown
together with p-values and robust standard errors. *, ** and *** denote significance at the 10%, 5% and 1% level respectively.
VARIABLES (1) (2) (3) (4) (5) (6)
ODCs+OFCs deposits and securities liabilities
from non-residents (log difference) 0.0180*** 0.0157*** 0.0236 0.0188*** 0.0163*** 0.0311
[0.003] [0.008] [0.750] [0.002] [0.005] [0.677]
ODCs+OFCs domestic deposits (log difference) 0.0595** 0.0545** 0.613 0.0588*** 0.0528*** 0.630
[0.028] [0.035] [0.248] [0.031] [0.042] [0.239]
REER (log difference) 0.0152 0.0152 0.224 0.00460 0.00534 0.163
[0.643] [0.615] [0.504] [0.886] [0.858] [0.635]
VIX -0.00672 -0.0119 -0.159 -0.0136 -0.0163 -0.189
[0.710] [0.540] [0.531] [0.473] [0.411] [0.463]
US banks' interoffice cross-border positions (one
period percentage change) 0.000675 -0.000398 -0.0413 0.00122 9.64e-05 -0.0441
[0.756] [0.852] [0.374] [0.564] [0.962] [0.350]
QE dummy -0.00378 -0.00677 -0.0850 -0.00361 -0.00503 -0.0917
[0.656] [0.420] [0.461] [0.758] [0.541] [0.432]
Interaction terms between QE dummy and VIX -0.0189 -0.0162 0.345 -0.0206 -0.0193 0.350
[0.619] [0.666] [0.399] [0.586] [0.601] [0.399]
Real GDP growth 0.133*** 0.0164*** -0.0726 0.136*** 0.168*** -0.0254
[0.003] [0] [0.714] [0.003] [0] [0.898]
Inflation rate -0.0117 -0.0425 0.139 -0.00832 -0.0402 0.141
[0.746] [0.219] [0.641] [0.820] [0.245] [0.640]
Debt-to-GDP ratio -0.0366*** -0.0307*** 0.0310 -0.0349*** -0.0293*** 0.0312
[0] [0.002] [0.516] [0.000] [0.003] [0.518]
Global cross-border credit (log difference) 0.0934 0.0281 -0.294 0.0935* 0.0334 -0.369
[0.109] [0.639] [0.633] [0.0985] [0.564] [0.555]
Domestic deposit rate -0.132** -0.0533 -0.586 -0.151*** -0.0689 -0.645
[0.0189] [0.395] [0.186] [0.009] [0.269] [0.147]
Constant 0.0610*** 0.0584*** 0.0641 0.0626*** 0.0593*** 0.0766
[0] [0] [0.389] [0] [0] [0.313]
Number of observations 2,990 2,990 2,876 2,990 2,990 2,853
Number of countries 0.055 0.052 0.006 0.057 0.054 0.006
R-squared 82 82 80 82 82 80
ODCs+OFCs
loans to
corporates
(ONFCs+PNFCs)
ODCs+OFCs
loans to ONFCs
ODCs+OFCs
loans to PNFCs
ODCs loans to
corporates
(ONFCs+PNFCs)
ODCs loans to ONFCsODCs loans to
PNFCs

32
Figure 19: ODCs+OFCs securities and deposits from nonresidents (non-core liabilities)
Note: log-differences for four different sub-periods: pre-crisis period (Q1:2005-Q1:2007), crisis period
(Q1:2007-Q1:2009), post-crisis period (Q1:2009-Q1:2011), “Greek crisis” (Q1:2011-Q1:2013).
-1.5
-1
-0.5
0
0.5
1
1.5
2
2.5
3
3.5
-1 0 1 2 3 4
Cris
is 2
00
7-0
9
Pre-crisis 2005-07
-2
-1
0
1
2
3
4
-2 -1 0 1 2 3 4
Post
-cris
is 2
00
9-1
1
Crisis 2007-09
-2
-1
0
1
2
3
4
5
-2 -1 0 1 2 3 4
Greek
-cris
is 2
01
1-1
3
Post-crisis 2009-11

33
Figure 20: ODCs securities other than shares liabilities from nonresidents
Note: log-differences for four different sub-periods: pre-crisis period (Q1:2005-Q1:2007), crisis period
(Q1:2007-Q1:2009), post-crisis period (Q1:2009-Q1:2011), “Greek crisis” (Q1:2011-Q1:2013).
-6
-4
-2
0
2
4
6
8
10
12
14
-2 0 2 4 6 8
Cris
is 2
00
7-0
9
Pre-crisis 2005-07
-4
-3
-2
-1
0
1
2
3
4
-5 0 5 10 15
Po
st-c
ris
is 2
009-1
1
Crisis 2007-09
-2
-1
0
1
2
3
4
5
6
-4 -3 -2 -1 0 1 2 3 4
Greek
-cris
is 2
01
1-1
3
Post-crisis 2009-11

34
Figure 21: ODCs+OFCs deposits from nonresidents
Note: log-differences for four different sub-periods: pre-crisis period (Q1:2005-Q1:2007), crisis period
(Q1:2007-Q1:2009), post-crisis period (Q1:2009-Q1:2011), “Greek crisis” (Q1:2011-Q1:2013).
-4
-3
-2
-1
0
1
2
3
-2 -1 0 1 2 3 4
Cris
is 2
00
7-0
9
Pre-crisis 2005-07
-2
-1
0
1
2
3
4
-4 -3 -2 -1 0 1 2 3
Po
st-
cris
is 2
009-1
1
Crisis 2007-09
-2
-1
0
1
2
3
4
5
-2 -1 0 1 2 3 4
Gre
ek-c
risi
s 2
01
1-1
3
Post-crisis 2009-11

35
Figure 22: ODCs deposits from nonresidents
Note: log-differences for four different sub-periods: pre-crisis period (Q1:2005-Q1:2007), crisis period
(Q1:2007-Q1:2009), post-crisis period (Q1:2009-Q1:2011), “Greek crisis” (Q1:2011-Q1:2013).
-4
-3
-2
-1
0
1
2
3
-2 -1 0 1 2 3 4
Cris
is 2
00
7-0
9
Pre-crisis 2005-07
-2
-1
0
1
2
3
4
-4 -3 -2 -1 0 1 2 3
Po
st-
cris
is 2
009-1
1
Crisis 2007-09
-2
-1
0
1
2
3
4
5
-2 -1 0 1 2 3 4
Greek
-cris
is 2
01
1-1
3
Post-crisis 2009-11

36
Figure 23: ODCs+OFCs domestic loans to corporates
Note: log-differences for four different sub-periods: pre-crisis period (Q1:2005-Q1:2007), crisis period
(Q1:2007-Q1:2009), post-crisis period (Q1:2009-Q1:2011), “Greek crisis” (Q1:2011-Q1:2013).
-2.5
-2
-1.5
-1
-0.5
0
0.5
1
1.5
2
-1 -0.5 0 0.5 1 1.5 2 2.5
Cris
is 2
00
7-0
9
Pre-crisis 2005-07
-2
-1
0
1
2
3
4
5
6
7
8
-3 -2 -1 0 1 2
Po
st-
cris
is 2
009-1
1
Crisis 2007-09
-12
-10
-8
-6
-4
-2
0
2
4
6
-2 0 2 4 6 8
Greek
-cris
is 2
01
1-1
3
Post-crisis 2009-11

37
IV. DIRECTIONS FOR FURTHER WORK
The exercise in piecing together the shadow banking system in the United States with the
capital flows that underpin its operation has revealed many interesting details that would
be of potential use for policy makers. The results reported in this paper should be viewed
as the interim report of an on-going program of research.
There are three directions to extend our work so far. The first is to complete the time
series observations by completing the BSA and external matrices for the years that we
have not covered in the paper. In this paper, we have shown evidence based on years—
2005–12. However, examining the BSA and external flow of funds matrices from earlier
years—say 2002 or 2003 would show the state of affairs before the banking sector boom
took off in the middle years of the last decade.
The second task is to construct the external matrices for the Euro area and the U.K. and
then to examine the gross external claims and liabilities of the banking (ODC) sector in
the two jurisdictions. The “roundtrip” of U.S. dollar funding depicted in the schematic
flow chart in Figure 2 will only be settled if we can identify not only the residence of the
investor, but also the type of the investor.
Finally, the most ambitious endeavor would be to disaggregate the external matrices by
counterparty location and by counterparty sector as the ultimate goal, so that we can treat
each sector in each location as a node in the network of interconnections. Given the
dimensionality of the problem, any measurement exercise will need to be guided by
careful selection of the pairwise relations between the (location, sector) nodes in the
network. Furthermore, the BSA and external matrices could potentially be extended to
flow data to identify transactions, revaluation changes, and other changes in volume of an
asset/liability. This may be even a more challenging task given that the flow data would
need to be broken down by counterpart country as relevant.
However, even if the most ambitious endeavor can bear fruit, we should be cognizant of
the inherent limitations of an approach that is based on the residence of the entity in
question. This limitation has been brought to the surface by the market stresses suffered
by many emerging economies in the summer of 2013. One conceptual challenge is to
38
reconcile the small net external debt positions of many emerging market economies with
the disproportionate impact of tighter global monetary conditions on their currencies and
financial markets.
One piece in the puzzle may be the role of nonfinancial corporations as surrogate
financial intermediaries that operate across borders. When corporate activity straddles the
border, measuring exposures at the border itself may not capture the strains on corporate
balance sheets. For instance, if the London subsidiary of a company from emerging
market country A has taken on U.S. dollar debt but the company is holding domestic
currency financial assets at its headquarters, then the company as a whole faces a
currency mismatch and will be affected by currency movements, even if no cross-border
exposures are registered in the official net external debt statistics. Nevertheless, the firm's
fortunes (and hence its actions) will be sensitive to currency movements. In the case of
firms that straddle borders, it may be more illuminating to look at the consolidated
balance sheet that motivates corporate treasurers, rather than the balance of payments
statistics that are organized according to residence. Furthermore, there are some financial
intermediation services which are provided by a wider circle of financial agents as well as
nonfinancial corporations. Shadow banks combine multiple nonbank agents in providing
financial intermediation, in national economies and across borders.
A further insight would be to trace and quantify how much repos of shadow banks fund
credit to the real economy and how much support risk taking and how much support
inter-system liquidity redistribution by market participants. Cash-driven repo between
shadow bank intermediaries has proven to be an important funding and liquidity source in
the rise and fall of shadow banking liquidity.
In such instances, we may need to examine more than simply the financial exposures
measured at the border. We need to look at the role of global banks in offshore financial
centers as the carriers across borders of global liquidity driven by global banks and of
shadow banks, and the role of these centers in providing offshore banking accounts in
foreign currency instruments.

39
Indeed, one aspect of firms’ access to international capital markets is the offshore
issuance of debt securities sold to international investors. If the debt securities issued
offshore are in foreign currency, offshore issuance would mirror currency mismatches on
the consolidated balance sheet. Hence, offshore issuance goes beyond just a
measurement issue on the size of the company's debt and instead addresses the
fundamental issue of how firms will fare when global financial conditions and exchange
rates change. In the recent issue of the BIS Quarterly Review (BIS (2013)), the offshore
issuance of debt securities by nonbank issuers from emerging economies is shown to
account for a large proportion of new international debt securities. To the extent that
consolidated balance sheets give insights into behavior, it would be informative to
overlay the consolidated data by nationality on top of the locational data given by the
external flow of funds matrix.
In this paper we have shown the promising nature of a new GFF approach in which the
national flow of funds matrix is combined with the external flow of funds matrix to yield
insights into the broad direction and size of capital flows. For the U.S. shadow banking
system, such an approach yields important insights into the role of external conditions on
the fluctuations in the size of the U.S. intermediation sector. Among other benefits, the
possible applications of the new GFF approach could support IMF surveillance and
policy analysis by: (i) providing a consistent and comparable official global estimate of
the shadow banking sector to assess what the estimate tells us about repo concentration
risks; maturity and liquidity transformation; leverage and credit risk transfer and the
quality of collateral, to facilitate the monitoring of regulatory boundaries; (ii) measuring
the impact of unconventional monetary policy through core (monetary aggregates) and
noncore (shadow banking) liabilities; (iii) developing and quantifying global liquidity
funding aggregates; and (iv) measuring noncore liabilities as an indicator of financial
crisis vulnerability.19
19
Non-core Bank Liabilities and Financial Vulnerability, Joon-Ho Hahm, Yonsei University, Hyun Song
Shin, Princeton University and Kanho Shin, Korea University, September 2012 investigates the role of non-
core liabilities in signaling financial vulnerability.

40
Several major data gaps remain (Annex 3). A number of G20 economies still do not
provide information on ODCs and OFCs to the IMF in the form of SRFs and it is not
possible to construct a domestic balance sheet for these countries which would enhance
the usefulness of the flow of funds analysis. The provision to the IMF of comprehensive
monetary statistics, through full SRF reporting, including for OFCs, should thus be a
priority. Work in enhancing (frequency, timeliness and widening the scope of the
encouraged items) the CPIS survey; more participation in CPIS and CDIS; additional
analytical position data according to BPM6 reporting; and improved quarterly reporting
of IIP data and consistency with data collected in the CDIS and CPIS will close some of
the gaps in the GFF matrices. There will be enhanced reporting of the BIS locational
banking statistics, but the IMF’s access to these data is restricted.
These obstacles—both in data and in transparency—can be surmounted by the IMF
working closely with countries to fill data gaps and construct bilateral country flow of
funds for their own policy use. Smart ways need to be found to provide to the IMF
bilateral counterparty flow data on IIP and to work together to determine the common
granularity in the split by counterpart sector.
This paper has shown what could be possible drawing on available data. The work has
the potential to cover both domestic/regional and cross-border (by country and sector)
stocks and flows, enabling the monitoring of national/regional and international capital
flows on a regular basis. We have also noted some of the limitations of the purely
locational data approach. When the economic entity that takes decisions has a balance
sheet that straddles the border (as when a financial or nonfinancial company has a
subsidiary in a financial center), then we would need to supplement the locational
information with the complementary consolidated balance sheet information.

41
Annex 1. Balance Sheet Approach Matrix Methodology
The Balance Sheet Approach (BSA) matrix is derived from Standardized Report Forms
(SRFs) data on monetary statistics reported by IMF member countries to the IMF’s
Statistics Department (STA).20 The BSA matrix presents intersectoral asset and liability
positions, showing the issuer of a liability on the horizontal axis and the holder of a
liability on the vertical axis.
SRFs data used in the mapping exercise originate from the balance sheet data of the
central bank (CB sectoral balance sheet), other depository corporations (ODC sectoral
balance sheet) and other financial corporations (OFC sectoral balance sheet). These
figures are the main data source for the BSA matrix and are considered to be most
accurate.21 In addition, data from the IMF’s Government Finance Statistics Yearbook
(GFSY) and international investment position (IIP) have been used to augment the BSA
matrix to show the fullest picture obtainable from IMF-source data. In doing so, we made
some working assumptions on a country by country basis as discussed below.22
IIP data have been used to supplement the data for nonresidents vis-à-vis: (i) general
government; (ii) public nonfinancial corporations (PNFC); and (iii) other nonfinancial
corporations (ONFC). After subtracting SRFs’ data from the corresponding IIP item, the
residual data have been split between PNFCs and ONFCs. This split is based on the ratio
of deposits held by PNFCs and ONFCs with the financial sector.23 We assumed that the
20
Currently, there are 140 SRF-reporting economies, of which 33 extend reporting to OFCs data. Eight
G20 economies, covering about 50 percent of world GDP, report OFCs in SRFs: Australia, Brazil, Euro
Area, Indonesia, Japan, Mexico, South Africa and the United States.
21 The main benefits of the SRFs are: (i) improvement in cross-country comparability of monetary data; and
(ii) higher quality of monetary data given that the instrument and sector classifications in SRFs are based
on the Monetary and Financial Statistics Manual
(http://www.imf.org/external/pubs/ft/mfs/manual/index.htm) and its accompanying MFS Compilation
Guide (http://www.imf.org/external/pubs/ft/cgmfs/eng/pdf/cgmfs.pdf).
22 For this paper, we produced actual BSA matrices for the United States, Euro Area and Mexico, and
actual external flow of funds matrices for the United States vis-à-vis the following counterpart countries:
the United States, Euro Area, Mexico, Switzerland, the United Kingdom, Germany, and France.
23 The percentages used to distribute the residual IIP data into the BSA are working assumptions based on
individual country experiences. For Mexico, the share of deposits held with the financial sector by PNFCs
is 4 percent and by ONFCs is 96 percent for both 2006 and 2009; in 2011, the shares were 3 percent and 97
(continued…)
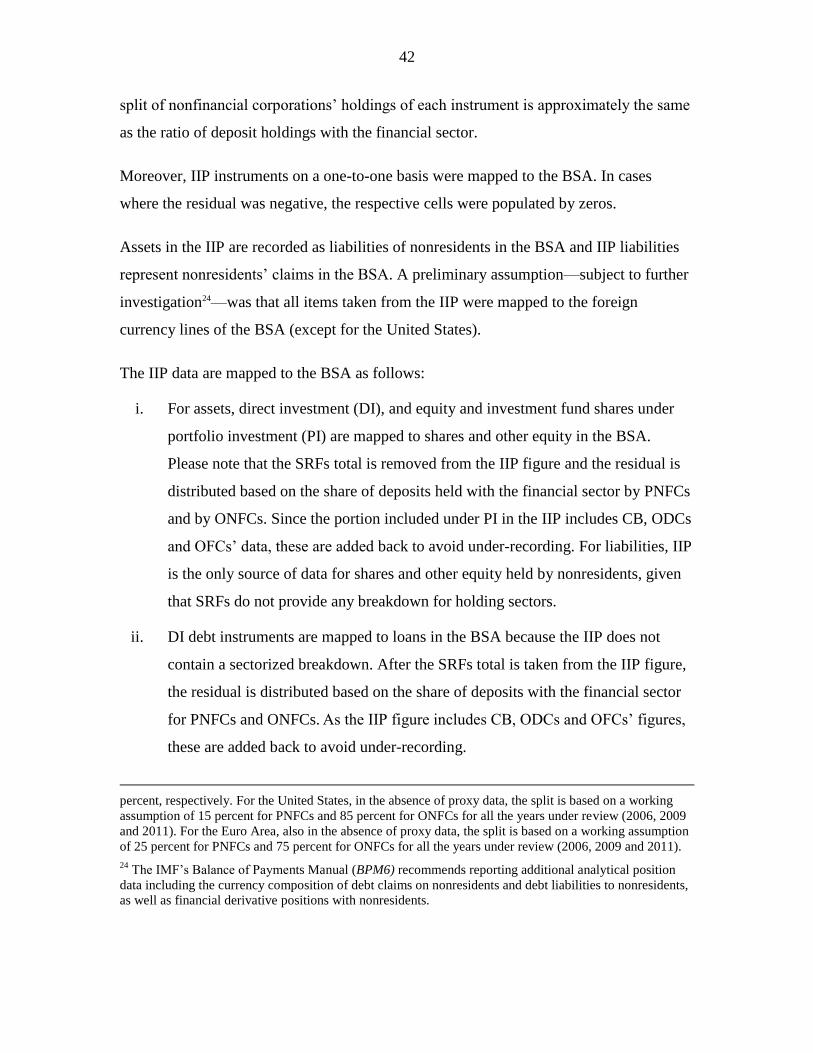
42
split of nonfinancial corporations’ holdings of each instrument is approximately the same
as the ratio of deposit holdings with the financial sector.
Moreover, IIP instruments on a one-to-one basis were mapped to the BSA. In cases
where the residual was negative, the respective cells were populated by zeros.
Assets in the IIP are recorded as liabilities of nonresidents in the BSA and IIP liabilities
represent nonresidents’ claims in the BSA. A preliminary assumption—subject to further
investigation24—was that all items taken from the IIP were mapped to the foreign
currency lines of the BSA (except for the United States).
The IIP data are mapped to the BSA as follows:
i. For assets, direct investment (DI), and equity and investment fund shares under
portfolio investment (PI) are mapped to shares and other equity in the BSA.
Please note that the SRFs total is removed from the IIP figure and the residual is
distributed based on the share of deposits held with the financial sector by PNFCs
and by ONFCs. Since the portion included under PI in the IIP includes CB, ODCs
and OFCs’ data, these are added back to avoid under-recording. For liabilities, IIP
is the only source of data for shares and other equity held by nonresidents, given
that SRFs do not provide any breakdown for holding sectors.
ii. DI debt instruments are mapped to loans in the BSA because the IIP does not
contain a sectorized breakdown. After the SRFs total is taken from the IIP figure,
the residual is distributed based on the share of deposits with the financial sector
for PNFCs and ONFCs. As the IIP figure includes CB, ODCs and OFCs’ figures,
these are added back to avoid under-recording.
percent, respectively. For the United States, in the absence of proxy data, the split is based on a working
assumption of 15 percent for PNFCs and 85 percent for ONFCs for all the years under review (2006, 2009
and 2011). For the Euro Area, also in the absence of proxy data, the split is based on a working assumption
of 25 percent for PNFCs and 75 percent for ONFCs for all the years under review (2006, 2009 and 2011).
24 The IMF’s Balance of Payments Manual (BPM6) recommends reporting additional analytical position
data including the currency composition of debt claims on nonresidents and debt liabilities to nonresidents,
as well as financial derivative positions with nonresidents.
43
iii. PI debt securities in the IIP are classified under securities other than shares in the
BSA. The SRF figures for securities held by OFCs are subtracted from the IIP
data before distribution.
iv. PI equity and investment fund shares for general government are classified under
shares and other equity in the BSA.
v. PI debt securities for the general government are classified under securities other
than shares in the BSA.
vi. Financial derivatives are mapped to financial derivatives in the BSA. Where
financial derivatives are recorded in IIP, but not in the SRFs, they are allocated
between the ODC, OFC and NFC sectors, according to the holdings of securities
other than shares by financial corporations.
vii. Other investment, currency and deposits for the general government and other
sectors are mapped to currency and deposits in the BSA.
viii. Loans for the general government and other sectors are classified under loans in
the BSA.
ix. Trade credit and advances for the general government and other sectors are
mapped to other accounts receivable in the BSA.
x. Other accounts receivable for the general government and other sectors are
recorded under other accounts receivable in the BSA.
For the GFSY data, where the total of securities other than shares and loans are
under “foreign”, they are mapped to nonresidents. For the portion of these
instruments recorded under “domestic,” the corresponding SRF data are
subtracted and the residual is added to PNFCs and ONFCs in the same way as for
the IIP data.

44
Annex 2. External Flow of Funds Matrix Methodology
As noted in Annex 1, the domestic flow of funds matrix is based on the Balance Sheet
Approach (BSA) matrix methodology. The rest of the world sector data are drawn from
the international investment position (IIP); assets in the IIP are recorded as liabilities of
nonresidents in the BSA and IIP liabilities represent nonresidents’ claims in the BSA.
Cross-border liabilities of debtors are along the horizontal axis, and cross-border claims
of asset holders along the vertical axis, for each financial instrument.
The external flow of funds matrix provides a conceptual framework for presenting cross-
border positions by counterpart country and instrument. The first column of the external
flow of funds matrix fully corresponds to the last column in the BSA matrix, only with
reduced number of sectors as all sectors related to the public sector (excluding the central
bank) and related to the private nonfinancial sector are aggregated together. The matrix
presents external financial asset and liability positions, showing what data are available
by IIP category and instrument: direct investment,25 portfolio investment equity and debt
securities (the latter, separately for long-term and short-term debt), other investment
(separately for banks and others), reserve assets, and financial derivatives (other than
reserves).26 These positions are then broken down by counterpart country, by sector of
investor and investee, maturity, and currency. Drawing on IMF and Bank for
International Settlements (BIS) data sources, this matrix has the potential to further
allocate the cross-border liabilities and claims for the destination country and the country
of origin.
Data sources
The external flow of funds matrix is based on IMF and BIS data sources. The datasets
managed by the IMF with bilateral counterpart country detail include the Coordinated
Direct Investment Survey (CDIS) (for "inward" direct investment positions, i.e., direct
25
For intercompany loans in the matrix, we used information from BIS statistics on stocks of
claims/liabilities to affiliated offices (intrabank lending).
26 Financial derivatives other than reserves and employee stock options were not covered in the external
statistics flow of funds matrix.

45
investment into the reporting economy, cross-classified by economy of immediate
investor, and data on "outward" direct investment positions, i.e., direct investment abroad
by the reporting economy, cross-classified by economy of immediate investment) and the
Coordinated Portfolio Investment Survey (CPIS) (for the stock of cross-border holdings
of equities and long- and short-term debt securities broken down by the economy of
residence of the issuer).
For reserve assets, the Data Template on International Reserves and Foreign Currency
Liquidity (RDT) provides country level data based on country of reserves holder. The
Survey of Securities Held as Reserve Assets (SEFER)—a companion survey to the
CPIS—provides holder data on securities held as foreign exchange reserve assets, cross-
classified by country of issuer, and the Currency Composition of Official Foreign
Exchange Reserves (COFER) provides data on holdings of reserve assets cross-classified
by currency composition. COFER and SEFER country level data are reported to the IMF
on a strictly confidential basis and are disseminated in the form of statistical aggregates
only. Therefore, we did not use reserve assets data in the external flow of funds matrix.
Additionally, IIP data for functional categories are available at the individual reporting
country level.
For intercompany loans in the matrix, we used information from BIS statistics on stocks
of claims/liabilities to affiliated offices (interbank lending).
The BIS International Banking Statistics (IBS) is the source of bilateral geographic
details for loans, deposits, and other claims and liabilities.27
Frequency
The frequency of the source data used varies by dataset as follows: IIP–quarterly/annual;
CDIS–annual; CPIS–annual (but, becomes semi-annual, effective with reporting of data
for end-June 2013 in January 2014); RDT–monthly; COFER–quarterly; SEFER–annual;
and BIS IBS–quarterly. New or enhanced data sources (including the planned
27
Other sources such as the U.S. BEA have also been used.

46
enhancements in the CPIS; the additional analytical position data according to BPM6
reporting; and the enhanced reporting of the BIS locational banking statistics) will close
some of the gaps in the external flow of funds matrix.
Supplementing the BSA with source data on external assets and liabilities: mapping
assumptions
In the BSA matrix, the resident sector counterpart breakdown is based on the IMF’s
monetary statistics, namely: central bank, general government, other depository
corporations, other financial corporations, and nonfinancial corporations.28 In BPM6, the
classification of institutional sectors is: central bank, deposit taking corporations except
central bank, general government, other sectors (further broken down into OFC and
nonfinancial corporations, households, and NPISH).
The methodology to supplement the BSA with source data on external assets and
liabilities identified in the external flow of funds matrix is under review. As a first step,
the stock data have been identified as a reference total, and assumptions made on how to
split it into instruments and sectors as presented in the BSA and further into counterpart
countries.
CDIS and CPIS published data are mapped to the sectors and instruments in the IMF’s
monetary statistics (where available) for cross-border exposures at bilateral levels. In the
matrix, the external assets are recorded from the reporting country position and the
external liabilities from the mirror data from the counterpart countries as reporters.
For CPIS, the current “encouraged” breakdown by sector of the resident holder is as
follows: monetary authorities, banks, other financial institutions (of which: insurance,
mutual funds, other), general government, nonfinancial sector (of which: nonfinancial
companies, households, other). Planned CPIS enhancements include additional
extensions and the institutional sector of the nonresident issuer and institutional sector of
resident holder cross-classified by the institutional sector of the nonresident issuers (this
28
Other resident sectors are not included in the matrix.

47
is “from whom-to-whom” positions according to sectors of both the security-issuing and
security-holding economies).
The BIS locational statistics provide quarterly information on claims and liabilities of
banks vis-à-vis banks and nonbanks located in other countries worldwide. They are based
on the economy of location or residence of the creditor bank.
Where there is no breakdown by sector (and no breakdown by short-term and long-term)
in the country data as a reporter of the CDIS and CPIS, by the bilateral country, the
working assumption for “Securities other than shares” and “Shares and other equity” is to
map by the holdings by sectors reported in monetary statistics.
For financial derivatives which are included in the IIP for a country, but are not recorded
in a reporting MFS sector, the working assumption is to allocate according to the
holdings of securities other than shares into the following sectors: other depository
corporations, other financial corporations, and nonfinancial corporations.
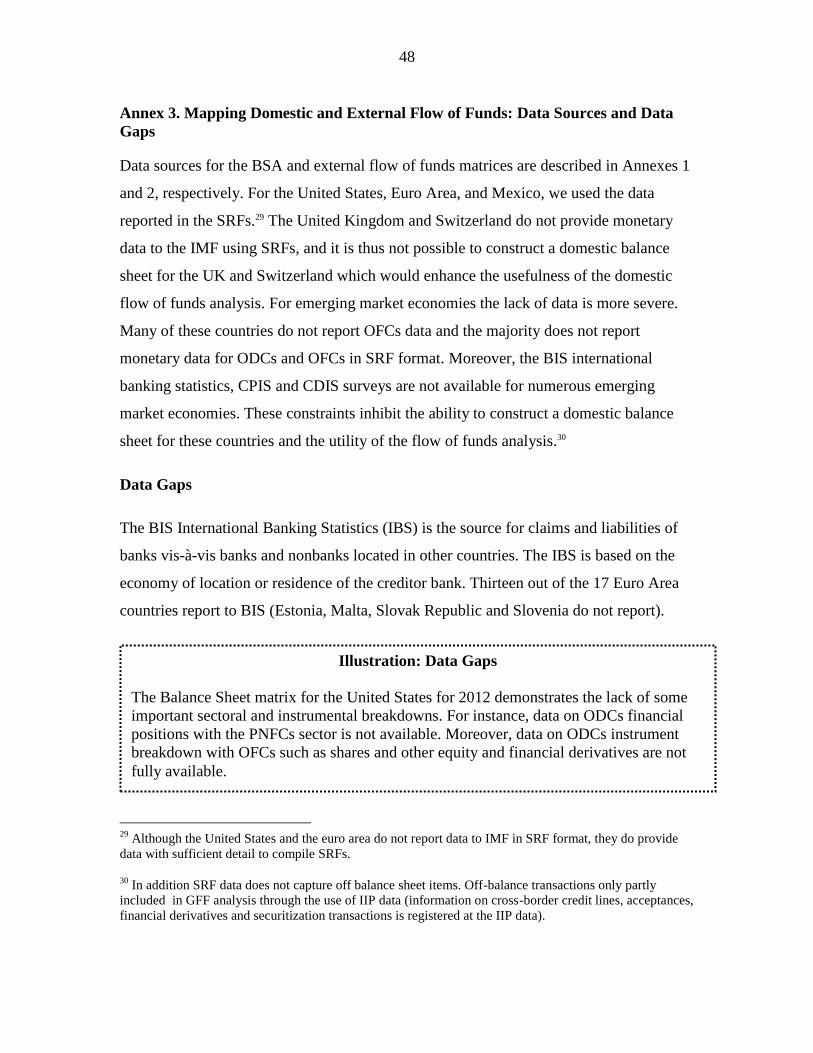
48
Annex 3. Mapping Domestic and External Flow of Funds: Data Sources and Data
Gaps
Data sources for the BSA and external flow of funds matrices are described in Annexes 1
and 2, respectively. For the United States, Euro Area, and Mexico, we used the data
reported in the SRFs.29 The United Kingdom and Switzerland do not provide monetary
data to the IMF using SRFs, and it is thus not possible to construct a domestic balance
sheet for the UK and Switzerland which would enhance the usefulness of the domestic
flow of funds analysis. For emerging market economies the lack of data is more severe.
Many of these countries do not report OFCs data and the majority does not report
monetary data for ODCs and OFCs in SRF format. Moreover, the BIS international
banking statistics, CPIS and CDIS surveys are not available for numerous emerging
market economies. These constraints inhibit the ability to construct a domestic balance
sheet for these countries and the utility of the flow of funds analysis.30
Data Gaps
The BIS International Banking Statistics (IBS) is the source for claims and liabilities of
banks vis-à-vis banks and nonbanks located in other countries. The IBS is based on the
economy of location or residence of the creditor bank. Thirteen out of the 17 Euro Area
countries report to BIS (Estonia, Malta, Slovak Republic and Slovenia do not report).
29
Although the United States and the euro area do not report data to IMF in SRF format, they do provide
data with sufficient detail to compile SRFs.
30 In addition SRF data does not capture off balance sheet items. Off-balance transactions only partly
included in GFF analysis through the use of IIP data (information on cross-border credit lines, acceptances,
financial derivatives and securitization transactions is registered at the IIP data).
Illustration: Data Gaps
The Balance Sheet matrix for the United States for 2012 demonstrates the lack of some
important sectoral and instrumental breakdowns. For instance, data on ODCs financial
positions with the PNFCs sector is not available. Moreover, data on ODCs instrument
breakdown with OFCs such as shares and other equity and financial derivatives are not
fully available.

49
With regard to the geographical breakdown for the euro area, almost full IIP (stocks) and
Balance of Payments (BOP) (flows) data are available for the individual countries of the
Euro area at an annual and quarterly frequency, respectively (the sources are mainly
National Central Banks). Portfolio investment liabilities are not available by the
geographic breakdown of the holder. CDIS and CPIS data are available for France and
Germany vis-à-vis the selected economies. Publicly available data can be found in the
ECB’s Monthly Bulletin Table 7.3.9. A geographical breakdown of the IIP and BOP of
the Euro Area (bilateral stocks and flows) is available for the United States, UK and
Switzerland, but not Mexico.31
For the BIS locational dataset, the IMF’s data access is restricted. For bilateral data
reported by Singapore and other key jurisdictions (e.g., France, UK, Japan), a special
data-request is needed. Japan and UK have some publicly available data, but there are
some important gaps, especially for historical time series. For instance, for the UK, the
IMF does not have access to a breakdown of foreign claims into cross-border and local
claims, which is essential to properly map banks’ global activities.32
The SRF forms comprise an instrument breakdown for each sector; the main instruments
represented are: currency and deposits, shares and other equity, securities other than
shares and loans. Further breakdown on the nature of positions and financial
characteristics would be very useful for this exercise; however such data is not available.
In addition to country-specific data gaps, in several cases full breakdowns by sector and
instrument are not available. In these cases, working assumptions have been used for this
paper to make the necessary allocations, as discussed in Annexes 1 and 2. Closing such
gaps will enable us to sharpen the analysis further. The following initiatives are underway
to address some of the existing data gaps. Planned CPIS enhancements include
extensions to the current “encouraged” breakdown by sector of the resident holder. The
enhanced reporting of the BIS locational banking statistics (Stage 2) will cover new data
on counterparts and maturity for liabilities, and will introduce changes to and
31
See: http://sdw.ecb.europa.eu/reports.do?node=100000215
32 See IMF WP/11/222 which was also published as BIS WP 376 and NBER WP 18531.

50
composition of the reporting population of banks (domestic banks; foreign subsidiaries;
foreign branches; and consortium banks).
Table 2 below presents available data sources, planned enhancements, and main data
gaps for the external flow of funds matrix.
Data comparability
Following the methodology described in Annex 2 and using the “same” data for two
countries, dysfunctional reporting may occur in some critical cases for counterpart
country data (Table 1).
Table 1: Comparison of Euro Area’s and US’ external flow of funds matrices
As presented in Table 1, data for corresponding sectors should match. In the U.S.
external flow of funds matrix,33 the column “Assets” (A) under “Euro Area” presents
Euro Area claims on the U.S. (or U.S. liabilities to euro area), and the column
33
For 2006, United States source data are from the U.S. Department of Commerce, Bureau of Economic
Analysis: U.S. Direct Investment Position Abroad on a Historical-Cost Basis and Country Detail by
Industry and Foreign Direct Investment in the United States: by Country.
51
“Liabilities” presents euro area liabilities to the U.S. (or U.S. claims on the euro area). In
the Euro Area matrix, the column “Liabilities” (L) under “U.S.” presents U.S. liabilities
on the euro area (or Euro area claims on the U.S.), and the column “Assets” presents U.S.
claims on the euro area (or euro area liabilities to the U.S.).
The reasons why this is not the case is three-fold. First, differences can be observed
between the IMF’s International Financial Statistics (IFS) and BIS locational data due to
coverage and/or the underlying methodology of the data. For coverage, the reporting
institutions for the BIS data cover mainly internationally active banks, whereas monetary
data in the IFS cover all resident other depository corporations. Furthermore, other
depository corporations for monetary statistics also include money market funds (e.g., for
the United States), which are excluded in the BIS data. Regarding the United States, the
data for other depository corporations in the IFS is sourced from the Fed’s Flow of Funds
publication and comprises commercial banks, savings institutions, credit unions, and
money market mutual funds. The BIS locational data cover “all balance sheet positions
(and some off-balance sheet positions in the area of trustee business) which represent
financial claims or liabilities vis-à-vis nonresidents, as well as foreign currency positions
vis-à-vis residents” or “International banking business comprises claims and liabilities
vis-à-vis nonresidents in any currency plus claims and liabilities vis-à-vis residents of the
reporting country in foreign currencies.”34 The latter positions vis-à-vis residents are
included as claims on residents in the IFS monetary data, because claims on and
liabilities to residents and nonresidents are based on the counterparty’s residence (center
of predominant economic interest), independent of the currency involved.
Second, survey data undertaken for the CPIS and CDIS are often carried out by different
institutions, statistical offices vis-à-vis central banks; central banks prepare the SRFs.
Third, our assumptions on mapping are country specific, rather than specific across pairs
of countries.
34
March 2013 version of the BIS, Guidelines to the International Locational Banking Statistics.

52
Table 2: External flow of funds matrix: data sources, availability and gaps (Source: Errico et al., 2013)

53
REFERENCES
Adrian, Tobias and Adam B. Ashcraft, 2012, “Shadow Banking: A Review of the Literature,”
Federal Reserve Bank of New York Staff Report No. 580
http://www.newyorkfed.org/research/staff_reports/sr580.pdf
Adrian, Tobias, Adam B. Ashcraft and Nicola Cetorelli, 2013, “Shadow Bank Monitoring,”
Federal Reserve Bank of New York Staff Report No. 638
http://www.newyorkfed.org/research/staff_reports/sr638.pdf
Adrian, Tobias and Hyun Song Shin, 2010, “The Changing Nature of Financial Intermediation
and the Financial Crisis of 2007-09,” Annual Review of Economics, 2, 603-618.
Bakk-Simon, Klara, Stefano Borgioli, Celestino Giron, Hannah Hempell, Angela Maddaloni,
Fabio Recine, Simonetta Rosati, 2012, “Shadow Banking in the Euro Area: An overview.”
European Central Bank, Occasional paper series No. 133
Bank for International Settlements, 2010, “Funding patterns and liquidity management of
internationally active banks,” CGFS paper 39, May 2010, http://www.bis.org/publ/cgfs39.htm
Bank for International Settlements, 2011, "Global liquidity -- concept, measurement and
policy implications," CGFS Papers 45, Committee on the Global Financial System
http://www.bis.org/publ/cgfs45.pdf
Bank for International Settlements, 2013, Quarterly Review, September 2013, Box 2 on
offshore issuance of international debt securities by emerging economy borrowers.
Borio, Claudio and Piti Disyatat, 2011, "Global imbalances and the financial crisis: Link or no
link?" BIS Working Papers No 346, http://www.bis.org/publ/work346.pdf
Bruno, Valentina and Hyun Song Shin, 2012a , Capital Flows, Cross-Border Banking and
Global Liquidity, NBER working paper w19038.
Bruno, Valentina and Hyun Song Shin, 2012b, Capital Flows and the Risk-Taking Channel of
Monetary Policy, NBER working paper w18942 .
Calvo, Guillermo A., Leonardo Leiderman, and Carmen Reinhart, 1993, "Capital Inflows and
Real Exchange Rate Appreciation in Latin America: The Role of External Factors," IMF Staff
Papers, 40 (1), 108-151.
Calvo, Guillermo A., Leonardo Leiderman, and Carmen Reinhart, 1996, "Capital Flows to
Developing Countries in the 1990s: Causes and Effects," Journal of Economic Perspectives,
10, Spring 1996, 123-139.
Chamon, Marcos and Christopher Crowe, 2012, “Evidence on Financial Globalization and

54
Crisis: “Predictive” indicators of crises - macroprudential indicators, institutional
environment, micro” working paper, International Monetary Fund
Cetorelli, Nicola and Linda S. Goldberg, 2012, "Banking Globalization and Monetary
Transmission," Journal of Finance 67(5), 1811-1843
Claessens, Stijn, Giovanni Dell'Ariccia, Deniz Igan and Luc Laeven, 2010, “Cross-Country
Experiences and Policy Implications from the Global Financial Crisis,” Economic Policy, 62,
267-293
Claessens, Stijn, Ratnovski, Lev, Singh, Manmohan, 2012, “Shadow Banking: Economics and
Policy” International Monetary Fund, Staff Discussion Notes No. 12/12:
http://www.imf.org/external/pubs/cat/longres.aspx?sk=40132.0
Edge, Rochelle M., and Ralf R. Meisenzahl, 2011, "The Unreliability of Credit-to-GDP Ratio
Gaps in Real Time: Implications for Countercyclical Capital Buffers," International Journal
of Central Banking, vol. 7, pp. 261-298.
Errico, Luca, Richard Walton, Alicia Hierro, Hanan AbuShanab and Goran Amidzic,
Statistics Department, International Monetary Fund, 2013, “Global Flow of Funds: Mapping
Bilateral Geographic Flows,” 59th International Statistical Institute (ISI) World Statistics
Congress. http://www.statistics.gov.hk/wsc/STS083-P1-S.pdf
Financial Stability Board, 2011, “Shadow Banking: Strengthening Oversight and
Regulation,” http://www.financialstabilityboard.org/publications/r_111027a.pdf
Financial Stability Board, 2013, “Strengthening Oversight and Regulation of Shadow
Banking: An Overview of Policy Recommendations,” August 2013
http://www.financialstabilityboard.org/publications/r_130829a.pdf
Forbes, Kristin J. and Francis E. Warnock, 2012, "Capital Flow Waves: Surges, Stops, Flight
and Retrenchment" Journal of International Economics, 88(2), pp. 235-251
Friedman, Benjamin, M., 1988, "Lessons on Monetary Policy from the 1980s," Journal of
Economic Perspectives, 2, pp. 51-72
Friedman, Milton, 1956, "The Quantity Theory of Money - A Restatement," in Studies in the
Quantity Theory of Money (ed) Milton Friedman, Chicago University Press, Chicago.
Goldstein, Itay, 2010, “Fundamentals or Panic: Lessons from the Empirical Literature on
Financial Crises,” forthcoming in Encyclopedia of Financial Globalization
Gourinchas, Pierre-Olivier and Maurice Obstfeld, 2012, "Stories of the Twentieth Century for
the Twenty-First," American Economic Journal: Macroeconomics, 4(1), pp. 226-65.
Hahm, Joon-Ho, Hyun Song Shin and Kwanho Shin, 2011, “Noncore Bank Liabilities and
Financial Vulnerability,” NBER working paper 18428, forthcoming in the Journal of Money,
Credit and Banking.
55
Hahm, Joon-Ho, Hyun Song Shin and Kwanho Shin, 2013, “Noncore Bank Liabilities and
Financial Vulnerability”
International Monetary Fund, 2009, Handbook on Securities Statistics, Part 1: Debt Securities
Issues, http://www.imf.org/external/np/sta/wgsd/pdf/051309.pdf
International Monetary Fund, 2000, Monetary and Financial Statistics Manual,
http://www.imf.org/external/pubs/ft/mfs/manual/index.htm
International Monetary Fund, 2008, Monetary and Financial Statistics Compilation Guide,
http://www.imf.org/external/pubs/ft/mfs/manual/index.htm
International Monetary Fund, 2010, The IMF-FSB Early Warning Exercise: Design and
Methodological Toolkit, available at www.imf.org/external/np/pp/eng/2010/090110.pdf
Lane, Philip and Barbara Pels, 2011, "Current Account Balances in Europe." working paper,
Trinity College Dublin
Obstfeld, Maurice, 2012a, "Financial Flows, Financial Crises, and Global Imbalances",
Journal of International Money and Finance, 31, pp. 469--480
Obstfeld, Maurice, 2012b, "Does the Current Account Still Matter?", American Economic
Review, 102(3), pp. 1-23.
Pozsar, Zoltan ; Singh, Manmohan, 2011, “The Nonbank-Bank Nexus and the Shadow
Banking System” International Monetary Fund, Working Paper No. 11/289:
http://www.imf.org/external/pubs/cat/longres.aspx?sk=25421.0
Rey, Hélène, 2013, "Dilemma not Trilemma: The global financial cycle and monetary policy
independence" forthcoming in the proceedings of the Federal Reserve Bank of Kansas City
Economic Symposium at Jackson Hole.
Satoru, Hagino and Cavieres, Liliana, 2012, “OECD financial statistics for measuring the
structure and size of the shadow banking system.” IFC Bulletine No. 36
Schularick, Moritz and Alan M. Taylor, 2012, "Credit Booms Gone Bust: Monetary Policy,
Leverage Cycles, and Financial Crises, 1870-2008." American Economic Review 102, pp.
1029-1061
Shin, Hyun Song, 2012, "Global Banking Glut and Loan Risk Premium" Mundell-Fleming
Lecture, IMF Economic Review 60 (2), pp. 155-192.
Shin, Hyun Song and Kwanho Shin, 2010, “Procyclicality and Monetary Aggregates” NBER
working paper w16836

56
Shin, Hyun Song and Yi Zhao, 2013, “Monetary Aggregates and Global Liquidity: Evidence
from Individual Firm Data from Asia” working paper for ADB interim conference, Hong
Kong, January 2013
Singh, Manmohan ; Aitken, James, 2010, “The (sizable) Role of Rehypothecation in the
Shadow Banking System” International Monetary Fund, Working Paper No. 10/172:
http://www.imf.org/external/pubs/cat/longres.aspx?sk=24075.0
Turner, Adair, 2012, “Shadow Banking and Financial Instability.” Cass Business School