Mapping the Agonist Binding Site of GABAB Type 1 subunit sheds ...
Mapping the distribution of HCN1-subunit containing channels on the dendritic trees of trapezius motoneurons
By
Ethan Yichao Zhao
A thesis submitted to the Center for Neuroscience
In conformity with the requirements for the Degree of Master of Science
Queen’s University
Kingston, Ontario, Canada
July 2012
Copyright © Ethan Yichao Zhao, 2012

i
Abstract
Voltage-dependent channels on the dendrites of motoneurons provide additional current
that amplifies or dampens synaptic current en route to the soma. The specific consequences will
depend on the density and distribution of the voltage-dependent channels. HCN channels generate
a positive inward current in response to hyperpolarization. HCN channels are responsible for a
resonance phenomenon in motoneurons where inputs of certain frequencies are preferentially
amplified. Modelling studies indicate that this resonance behaviour only occurs if HCN channels are
uniformly distributed on the dendritic tree. However, the distribution of HCN channels on the
dendrites of motoneurons is unknown. Furthermore, current techniques for measuring channel
density on dendrites suffer from methodological limitations that prevent sampling on a scale
necessary to map the distribution of voltage-dependent channels across the dendritic tree. The goal
of the present study is to develop a high throughput method for measuring the membrane-
associated density of voltage-dependent channels using immunohistochemical, confocal and three-
dimensional image analysis techniques. Secondly, the proximal to distal distribution of membrane-
associated channels formed by the HCN1-subunit on the dendritic trees of trapezius motoneurons
in the adult feline will be compared. Antidromically identified motoneurons innervating the
trapezius muscle were intracellularly stained in order to visualize the entire dendritic tree. HCN1-
subunit containing channels were labeled with a specific antibody. Dendritic segments (n=27 to 92)
of ten trapezius motoneurons at different distances from the soma were acquired using confocal
microscopy and rendered into a three-dimensional volume. The perimeter of the intracellular stain
was used to define the membrane-cytoplasmic border. Analysis of the HCN1 immunoreactivitywas
constrained to this perimeter. This technique provides a means of extracting membrane-associated
HCN1 labeling and therefore the functional distribution of HCN1 channels. The density of
membrane-associated HCN1 immunoreactvity across the dendritic tree was either uniform or

ii
increased with distance from the soma among the ten trapezius motoneurons. The increase in
HCN1 density with distance from the soma was inversely related to the density of HCN1 on the
soma and proximal dendrites. Lastly, the change in HCN1 density with distance from the soma was
inversely related to the total input conductance of the motoneuron.
iii
Co-Authorship
Dr. P.K. Rose was my supervisor throughout this thesis and was instrumental to the design
of the study, data collection, analysis and interpretation of the results. Dr. Keith Fenrich was
responsible for the conception of the technique described in the present study for extracting
membrane-associated immunoreactivity. Monica Neuber-Hess and Ashley Martin assisted in the
surgical procedures described in the methods. Monica Neuber-Hess also assisted in the histological
procedures described in the methods. The first draft of this thesis was written by Ethan Zhao. All
subsequent drafts were written in collaboration with Dr. P.K. Rose who provided critical feedback
and comments.

iv
Acknowledgements
It is difficult to express in words the respect and appreciation I have Dr. P. Ken Rose, my
supervisor and mentor. From the first day of taking LISC 323, a third year undergraduate course
taught by Ken, I realized that he was different from many of the other professors in the Life
Sciences program. Gone were the lectures bombarded by a relentless barrage of bullet points and
dull minutiae. Instead, we were presented with pictures of what seemed to be a neuron with
processes extending out in all different directions, each very complex in structure. Then, Ken posed
a question along the lines of "How do we know what's a dendrite and what's an axon?" These words
struck a chord with me simply because the question seemed so simple and yet I was completely
baffled. I was quite confident in my understanding of the nervous system before the course had
commenced. When asked, I could provide a nice elegant textbook summary of the different roles
dendrites and axons served but with a simple picture laid out in front of me, I could not decipher
between the two after reading so much about dendrites and axons from textbooks. There was no
resemblance between the picture and the simple dendrite and axon model of a neuron that I had in
mind. This lesson like many of the others Ken gave taught me a very important lesson. All too often
we cling on to the facts believing them to be absolute and true in all instances. The picture that Ken
had presented was designed to provoke a general feeling of unease and encourage discussion. The
neuron was in reality not so simple. It broke many of the rules that we believed had to be satisfied
in all cases. In certain regions, the dendrites had physical characteristics expected of axons and in
other regions, the reverse was seen. From this I learned to appreciate that although facts are crucial
to science, revisions are just as important. Science revels in revision. There will always be
exceptions to the rule and accordingly, facts are always undergoing revisions. For the first time, I
was thinking critically about the information that was given to me, no longer just learning passively
and absorbing facts and figures. This was the reason that prompted me to pursue an undergraduate

v
thesis under his supervision and to this day I am grateful that he took a chance on a student that
was by far not the top student in the class and who really did not stand out in any way. From there,
the rest is, well, history.
As a mentor, Ken has played a vital role in my personal development and academic career.
Despite my initial inexperience, Ken treated me as an equal and valued my insight. He would often
come into the lab to share his ideas with us and although at times these discussions were beyond
the reaches of my understanding, I realize that it was these subtle gestures that helped to build my
self-confidence. As a supervisor, Ken has always made the time and effort to address any concerns I
was having despite his demanding schedule. He has an incredible passion for his work that
motivates everyone around him.
I also want to thank the people that I have had the opportunity to work closely with in the
Rose Lab. Keith, thank you for all the guidance and support you have provided before your untimely
departure from the lab. You were instrumental in conceiving the technique for extracting the
density of membrane-associated proteins. What I admire most about you is that you are not afraid
to take an idea on paper and put it into practice. You have such a passion for science and the work
you do, which can only be rivaled by Ken. You have set the highest standards when it comes to the
quality of work done in the lab and although I doubt I can surpass those standards I am quite
content if I can just come close. Anny, thank you for providing the code that would become the basic
skeleton of the masking program used to extract the juxta-membrane region. Without your
assistance and the insight you have provided me, I do not think the masking program could have
taken off the ground. I also value all the incredibly advice you have given me outside of the lab, a lot
of which have changed my outlook on life. Rob, thanks for being the other half of the dynamic duo.
You are an incredibly bright and talented individual and I think we made a pretty good team these
last two years. It will be sad to see you go but I am happy that you are moving onto bigger and

vi
better things. I hope you have a blast in law school and keep me updated on your life, marriage, etc.
Farin, although it has been short I am confident that you will do a great job in the lab. You are really
dedicated to your work and you have the displayed the patience and persistence to continue to
strive for excellence even when you have hit a rough patch, which is extremely often in science I
find. I could not have finished this thesis without the help of great support staff. Thank you Monica
for taking me under your wing and teaching me the ins and outs of immunohistochemistry and
animal surgery. Thank you Ashley for doing so much work behind the scenes and along with Monica
have made the day to day operations of the lab run so smoothly and efficiently that we often take it
for granted.
A big thank you goes out to Abdullah Abunafeesa and Chris Groten. I am really thankful for
all the laughter and great memories we have had in last couple of years but most of all your
friendship. Having you two around really kept my sanity in check when things got really
overwhelming. I am really going to miss you guys when this is all over. To Abdullah, I am thrilled
that you have been accepted into Law School as well. You definitely deserve it and all the future
success that awaits. It is so good to see that all that effort has paid off. You are so humble and
gracious and I have learned so much about the world from the discussions we have had. I cannot
wait to have you and Rob fight it out in a courtroom showdown someday. To Chris, you are the
nicest and most-down-to-earth guy I have met. As with Abdullah, I have enjoyed all the discussions
and time we spent together in the last couple of years. You have my trust and respect and I will
always value your opinion on any matter. I wish you much success and I have no doubt that will
happen especially with a PhD fast in sight. I would also like to thank the numerous summer and 499
students, past and present, who I have been unfortunate to meet. To Katie, Yuan, Moose, Carrol and
Heather, your passion for learning, maturity and remarkable intellect motivates me to continue
learning, improving, and becoming a better person.

vii
I also want to give a special thanks to Dr. Neil Magoski who is always willing to share his
expertise in electrophysiology, who has appeared to accept me as a friend at times and who has put
up with me always disturbing his prized student, Chris Groten, when he is in the middle of running
experiments. I want to thank Dr. Martin Pare for your care, advice and being a wonderful
neuroscience instructor. I would also like to thank Dr. Michael Kawaja for being on my committee
throughout my entire thesis and offering your insight.

viii
Table of Contents
Abstract................................................................................................................................................................................. i
Co-Authorship.................................................................................................................................................................... iii
Acknowledgements.......................................................................................................................................................... iv
List of Figures..................................................................................................................................................................... xii
List of Equations................................................................................................................................................................ xv
List of Symbols and Abbreviations............................................................................................................................ xvi
Chapter 1. Introduction.............................................................................................................................................. 1
1.1 Input-output properties of motoneurons in response to time-invariant inputs................ 3
1.2 The morphology of the motoneuron dendritic tree................................................................................... 4
1.3 Passive properties of dendrites........................................................................................................................ 5
1.4 Active properties of dendrites........................................................................................................................... 6
Chapter 2. Input-output properties of motoneurons in response to time-varying inputs.. 8
2.1 Membrane capacitance alters the time course of transient synaptic potentials........................... 8
2.2 The voltage response to a brief current injection in the dendrite....................................................... 15
2.3 Impedance as an electrical property to describe the input-output relationship of
motoneurons in response to time-varying inputs...............................................................................................
18
2.4 Resonance..................................................................................................................................................................... 21
Chapter 3. Hyperpolarization-Activated Cyclic Nucleotide-Gated (HCN) channels................ 23
3.1 Properties of HCN channels.................................................................................................................................. 23
3.2 HCN channels and neuronal excitability......................................................................................................... 24
3.3 Modulation of HCN channels................................................................................................................................ 25
ix
3.4 Functional Diversity of HCN channels.............................................................................................................. 25
3.5 HCN channels and resonance in motoneurons............................................................................................ 26
3.6 Distribution of HCN channels............................................................................................................................... 28
Chapter 4. Mapping the distribution of voltage-dependent channels on dendritic
membranes........................................................................................................................................................................ 30
4.1 Patch clamp recordings from dendrites.......................................................................................................... 30
4.2 Immunocytochemistry and electron/confocal microscopy.................................................................. 31
4.3 Statement of the problem...................................................................................................................................... 33
4.4 Statement of the goal............................................................................................................................................... 35
Chapter 5. Materials and Methods....................................................................................................................... 36
5.1 Animal preparation.................................................................................................................................................. 36
5.2 Motoneuron identification and intracellular injections........................................................................... 37
5.3 Perfusion and fixation............................................................................................................................................. 38
5.4 Histological processing and visualization of HCN1 and Neurobiotin................................................. 38
5.5 Specificity of antibody............................................................................................................................................. 40
5.6 Visualization of Neurobiotin and HCN1.......................................................................................................... 43
5.7 Reconstruction of motoneuron dendritic trees........................................................................................... 44
Chapter 6. Results Part I: Quantitative measurements of the distribution and density of
membrane-associated proteins on dendrites of intracellularly labeled neurons using
confocal microscopy in conjunction with three dimensional image analysis and
reconstructions of neuronal morphology........................................................................................................
45
6.1 Absorption and scattering of excitation and emission light................................................................... 45
6.2 Penetration of antibodies...................................................................................................................................... 47
x
6.3 Compensating for light attenuation and antibody penetration............................................................ 48
6.4 HCN1 immunoreactivity in the ventral horn................................................................................................. 50
6.5 Distribution of HCN1 immunoreactivity within the spinal accessory nucleus and on
trapezius motoneurons..................................................................................................................................................
51
6.6 Registration of selected dendritic segments observed using confocal microscopy with
reconstructions of the dendritic tree based on epi-fluorescence observations....................................
53
6.7 Extracting membrane-associated HCN1 immunoreactivity................................................................... 55
6.8 Determination of the intracellular to extracellular boundary............................................................... 57
6.9 Creation of a three-dimensional layer of voxels to capture the juxta-membrane region.......... 57
6.10 Independent confirmation of the accuracy of the membrane extraction technique................. 58
Chapter 7. Results Part II: Proximal to distal gradients in the distribution of
membrane-associated HCN1 immunoreactivity on the dendritic trees of trapezius
motoneurons..................................................................................................................................................................
61
7.1 Some trapezius motoneurons display a uniform proximal to distal distribution of
HCN1......................................................................................................................................................................................
61
7.2 Some trapezius motoneurons display a proximal to distal graded increase in HCN1................ 64
7.3 The proximal to distal gradients in HCN1 density is inversely related to the somatic HCN1
density...................................................................................................................................................................................
66
7.4 The proximal to distal gradients in HCN1 density is inversely related to the estimated
input conductance of the motoneuron....................................................................................................................
68
Chapter 8. Discussion 71
8.1 The extraction of the membrane-associated density of voltage-dependent channels............... 72
Limitations of the membrane extraction technique.................................................................................. 72

xi
8.2 The resolution in the z dimension is lower than the x and y: consequences of the
difference in resolution..................................................................................................................................................
73
8.3 The juxta-membrane region invariably includes fluorescence from sources in the
neighboring cytoplasm and extracellular space..................................................................................................
73
8.4 The membrane-associated immunoreactivity extends beyond the bounds of the juxta-
membrane layer................................................................................................................................................................
74
8.5 A larger proportion of cytoplasmic immunoreactivity is capture by the juxta-membrane
layer in small dendrites..................................................................................................................................................
75
Regulation of the anatomical and functional distribution of HCN channels............................... 75
8.6 The anatomical distribution of HCN channels may be highly dynamic............................................. 75
8.7 The functional distribution of HCN channels may be altered by cAMP-dependent
modulation...........................................................................................................................................................................
77
Functional consequences.......................................................................................................................................... 78
8.8 The distribution of HCN1 may not reflect the distribution of all HCN channels........................... 78
8.9 Resonance properties as a function of distance from the soma........................................................... 79
8.10 Functional consequences of a linear and uniform proximal to distal distribution of HCN
channels................................................................................................................................................................................
80
8.11 HCN channels and motor unit type................................................................................................................. 81
8.12 Concluding Statements......................................................................................................................................... 82
References.......................................................................................................................................................................... 83
xii
List of Figures
Figure 1.1 The interaction between synapses and voltage-dependent channels............................... 2
Figure 1.2 The relationship between frequency of action potential discharge and constant
long-lasting currents in motoneurons.....................................................................................................................
3
Figure 1.3 The reconstructed dendritic trees of different motoneuron types..................................... 4
Figure 2.1 The lipid bilayer acts as a capacitor.................................................................................................. 9
Figure 2.2 The delivery of a brief current step to a pure lipid bilayer..................................................... 9
Figure 2.3 The change in membrane potential in response to a brief current step of a pure
lipid bilayer.........................................................................................................................................................................
11
Figure 2.4 Leak channels on the neuronal membrane provide a resistive pathway for current
flow..........................................................................................................................................................................................
11
Figure 2.5 The change in membrane potential in response to a brief current step of the
neuronal membrane........................................................................................................................................................
12
Figure 2.6 The delivery of a brief current step to a spherical neuron...................................................... 13
Figure 2.7 The response of the dendrite to a brief current step................................................................. 16
Figure 2.8 The impedance response to a ZAP current stimulus................................................................. 20
Figure 2.9 The production of resonance due to passive and active neuronal properties............... 22
Figure 3.1 The distribution of HCN channels varies across neuronal types.......................................... 29
Figure 5.1 Methods used to fluorescently label HCN1 and Neurobiotin................................................. 40
Figure 5.2 The anti-HCN1 mouse monoclonal IgG1 antibody produces no immunolabling in
HCN1 knockout mice.......................................................................................................................................................
40
Figure 5.3 HCN1 immunoreactivity in the medial and lateral regions of the ventral horn in
transverse spinal cord sections from the rat and feline..................................................................................
41
xiii
Figure 5.4 HCN1 immunoreactivity in the neocortex of transverse brain sections from the
rat.............................................................................................................................................................................................
42
Figure 6.1 Decay in fluorescence intensity of optical sections attributed to the absorption and
scattering of light..............................................................................................................................................................
46
Figure 6.2 Variation in fluorescence intensity of optical sections attributed to the uneven
penetration of antibodies..............................................................................................................................................
47
Figure 6.3 Optical sections of HCN1 immunoreactivity after correcting for the loss of
fluorescence intensity due to light attenuation and uneven antibody penetration............................
49
Figure 6.4 HCN1 and ChATimmunoreactivity in the cervical spinal cord.............................................. 50
Figure 6.5 HCN1 immunoreactivity in the spinal accessory nucleus....................................................... 51
Figure 6.6 HCN1 immunoreactivity at the soma and proximal dendrites of trapezius
motoneurons.......................................................................................................................................................................
52
Figure 6.7 Comparing HCN1 immunoreactivity across dendritic regions at different distances
from the soma of trapeizus motoneurons..............................................................................................................
54
Figure 6.8 Membrane-associated HCN1 immunoreactivity observed along the perimeter of
the intracellular stain......................................................................................................................................................
55
Figure 6.9 Distribution of voxel intensities for a stack of optical sections in the presence and
absence of the intracellular stain...............................................................................................................................
56
Figure 6.10 Creating a three-dimensional layer of voxels to capture the juxta-membrane
region.....................................................................................................................................................................................
58
Figure 6.11 Comparison of the density of KCC2 and gephyrin fluorescence in the juxta-
membrane and adjacent extracellular and cytoplasmic regions.................................................................
60
Figure 7.1 Uniform proximal to distal distribution of HCN1 on dendrites of some trapezius
motoneurons.......................................................................................................................................................................
62
Figure 7.2 The distribution of HCN1 is uniform across the dendritic tree of three trapezius
motoneurons......................................................................................................................................................................
63

xiv
Figure 7.3 Graded proximal to distal increase of HCN1 on dendrites of other trapezius
motoneurons.......................................................................................................................................................................
64
Figure 7.4 Three trapezius motoneurons display a strong linear increase in HCN1 density
with distance from the soma.......................................................................................................................................
65
Figure 7.5 Four trapezius motoneurons display a moderately strong linear increase in HCN1
density with distance from the soma.......................................................................................................................
66
Figure 7.6 The proximal to distal distribution of HCN1 across the ten trapezius motoneurons
and the change in HCN1 density every 1000 µm plotted against the normalized somatic
density of HCN1.................................................................................................................................................................
67
Figure 7.7 Relationship between the computed total input conductance of each motoneuron
and the change in HCN1 density every 1000 µm................................................................................................
69

xv
List of Equations
1.1 The membrane resistance for a dendritic segment of length l............................................................. 5
1.2 The cytoplasmic resistance for a dendritic segment of length l........................................................... 5
1.3 Ratio of membrane resistance and cytoplasmic resistance with respect to the geometry of
dendrites...............................................................................................................................................................................
6
1.4 The membrane capacitance for a dendritic segment of length l.......................................................... 10
1.5 Relationship between the change in potential across a capacitor and the magnitude and
duration of current flowing onto the capacitor...................................................................................................
10
1.6 Relationship between the change in potential with respect to time and the magnitude of
current flowing onto the capacitor...........................................................................................................................
10
1.7 The membrane ionic current............................................................................................................................... 13
1.8 The membrane capacitive current.................................................................................................................... 13
1.9 The total membrane current................................................................................................................................ 14
1.10 The rising phase of the membrane potential change in response to a step current................. 14
1.11 The membrane time constant.......................................................................................................................... 15
1.12 The membrane potential at steady state..................................................................................................... 15
1.13 The decaying phase of the membrane potential change in response to a step current.......... 15
1.14 The decay in fluorescence intensity of optical sections due to the absorption and
scattering of light..............................................................................................................................................................
46
1.15 The loss of fluorescence intensity of optical sections due to light attenuation and uneven
antibody penetration......................................................................................................................................................
48
1.16 Compensation for loss of fluorescence intensity due to light attenuation and uneven
antibody penetration......................................................................................................................................................
49

xvi
List of Symbols and Abbreviations
Ca2+ calcium ion mg milligrams
Cm specific membrane capacitance ml milliliter
cm membrane capacitance Na+ sodium ion
CNS central nervous system NE norepinephrine
EPSP excitatory postsynaptic potential Ω ohm
HCN hyperpolarization-activated π pi
cyclic nucleotide-gated PIC persistent inward current
Ic membrane capacitive current r radius
Im total membrane current Ri specific intracellular resistivity
Ir membrane ionic current ri cytoplasmic resistance
ICaL slow persistent current mediated Rm specific membrane resistivity
by L-type Ca2+ channels rm membrane resistance
Ih hyperpolarization-activated current SK small conductance Ca2+ activated
mediated by HCN channels K+ channel
INaP fast persistent Na+ current TASK tandem of P domain weak inward
IPSP inhibitory postsynaptic potential related acid sensitive K+ channel
K+ potassium ion t time
kg kilogram 𝜏𝜏 membrane time constant
KCl potassium chloride V voltage
l length Vm membrane potential
MΩ mega ohm ZAP impedance amplitude profile
mm millimeter t time

1
Chapter 1. Introduction
Most neurons in the mammalian central nervous system (CNS) communicate via action
potentials. These actions potentials are conveyed to the neuron by multiple axons, which terminate
to form synapses. The vast majority of synapses in the CNS are positioned on the dendritic tree of
neurons. At the synapse, the arrival of an action potential evokes the release of neurotransmitters.
The binding of neurotransmitters to ligand-gated ion channels on the membrane of the dendrites
produces a local positive or negative current in the dendrite referred to as input. The current
generated at each synapse must travel down to the soma where the amount of current is translated
into specific temporal patterns of action potentials, defined as the output. These action potentials, in
turn, are received as the input of the next neuron in the circuit.
The relationship between synaptic input and neuronal output is not fixed, however.
Dendrites do not simply collect and funnel synaptic current to the soma. It is now clear that
dendrites are endowed with a rich assortment of voltage-dependent channels. These voltage-
dependent channels can provide additional current to either amplify or dampen synaptic current en
route to the soma (see Figure 1.1A). In motoneurons, the density of α1D-subunit containing L-type
Ca2+ channels was shown to increase beyond the second or third dendritic branch points (Carlin et
al., 2000; see Figure 1.1 B & C). Thus, the current generated at synapses located distal to these
regions may be selectively amplified by these L-type Ca2+ channels. To complicate matters, in some
cases the additional current is often the result of complex interactions between different classes of
voltage-dependent channels. For instance, in CA1 pyramidal neurons the current mediated by
hyperpolarization-activated cationchannels, Ih, in combination with the voltage-dependent
potassium current identified as IMresults in the amplification of synaptic current at rest but the
dampening of synaptic current at membrane potentials close to the threshold for action potential
firing (George et al., 2009). Thus, the amount of current delivered to the soma will be highly

2
dependent on precisely arranged interactions between (1) synapses and voltage-dependent
channels and less understood, between (2) different classes of voltage-dependent channels.
The long term goal is to define quantitatively how these interactions shape the input-output
relationship of motoneurons. Motoneurons are the “final common pathway” for movement since
they provide the sole link by which the CNS can communicate with muscles – the effectors of
movement (Sherrington, 1906). Therefore, all premotor and sensory feedback signals from
descending and segmental pathways must converge on the motoneuron before influencing the
activity of muscles. The interactions between synapses and voltage-dependent channels on
motoneurons will be determined in part by their relative location on the dendritic tree. However,
few studies have examined the locations of voltage-dependent channels on the dendrites of
motoneurons. Consequently, descriptions of the dendritic distribution of voltage-dependent
channels are largely absent or restricted to the soma and proximal dendrites (e.g. Muennich and
Fyffe, 2003). Thus, an important first step to address the long term goal is to provide a detailed
account of the locations of voltage-dependent channels on the dendritic tree. The goal of this study
is to map the distribution of subunit 1-containing hyperpolarization-activated cation (HCN1)
channels on the dendritic tree of motoneurons.
Figure 1.1 (A) Voltage-dependent channels on the dendritic tree can either provide additional current to amplify (left) or act as a shunt to dampen synaptic current en route to the soma (right). (B). The density of α1D-subunit containing L-type Ca2+ channels increases distal to the second or third dendritic branch points (white arrows) in motoneurons (Carlin et al., 2000). (C) The corresponding soma and dendrites of the motoneuron shown in (B) are outlined (Carline et al., 2000).

3
1.1 Input-output properties of motoneurons in response to time-invariant inputs
Early electrophysiological studies described the response of motoneurons to constant long-
lasting currents injected into the soma via an electrode. If the current was suprathreshold, the
response consisted of a rhythmic series of action potentials (Granit et al., 1963a, 1963b). The
steady-state frequency of action potential firing increased in proportion to the amount of current
delivered to the soma. Therefore, the transformation of synaptic current to increases or decreases
in action potential frequency was proposed to follow a linear relationship (Schwindt and Calvin,
1973) (see Figure 1.2). However, this description does not account for the geometry of the dendritic
tree, the location of active synapses, and the distribution, type and modulation of voltage-
dependent channels. These factors will influence the delivery of current to the soma and thus the
relationship between input and output.
Figure 1.2 The relationship between the steady-state frequency of action potential discharge and current strength from a rat motoneuron (modified to show curve from one motoneuron) (Granit et al., 1963)
4
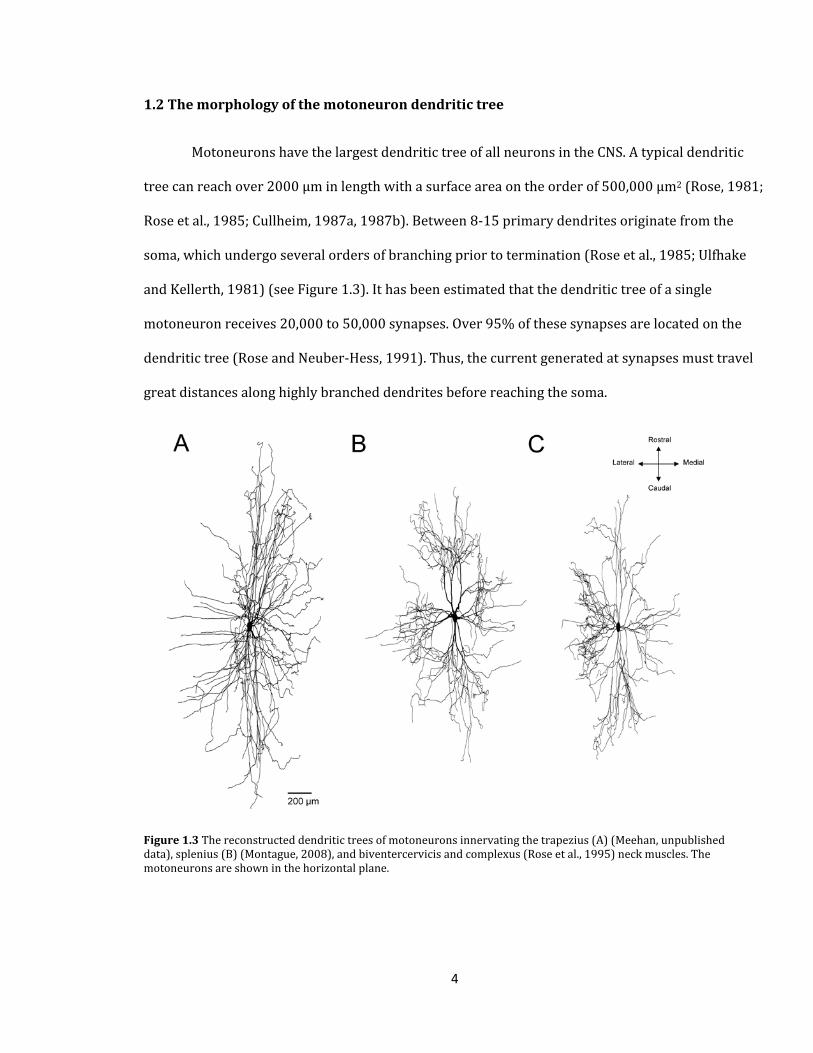
1.2 The morphology of the motoneuron dendritic tree
Motoneurons have the largest dendritic tree of all neurons in the CNS. A typical dendritic
tree can reach over 2000 µm in length with a surface area on the order of 500,000 µm2 (Rose, 1981;
Rose et al., 1985; Cullheim, 1987a, 1987b). Between 8-15 primary dendrites originate from the
soma, which undergo several orders of branching prior to termination (Rose et al., 1985; Ulfhake
and Kellerth, 1981) (see Figure 1.3). It has been estimated that the dendritic tree of a single
motoneuron receives 20,000 to 50,000 synapses. Over 95% of these synapses are located on the
dendritic tree (Rose and Neuber-Hess, 1991). Thus, the current generated at synapses must travel
great distances along highly branched dendrites before reaching the soma.
Figure 1.3 The reconstructed dendritic trees of motoneurons innervating the trapezius (A) (Meehan, unpublished data), splenius (B) (Montague, 2008), and biventercervicis and complexus (Rose et al., 1995) neck muscles. The motoneurons are shown in the horizontal plane.

5
1.3 Passive properties of dendrites
Dendrites have been viewed traditionally as passive structures that serve as a conduit for
current flow. Under these conditions, the transmission of current from dendritic synapses to the
soma can be described using cable theory (Rall, 1977). This theory assumes that the dendrite can
be conceptualized as a conducting core covered with a thin insulating sheath. However, the
membrane is not a perfect electrical insulator. This leads to a loss of synaptic current through the
membrane during its travel to the soma. This loss is determined by the relative values of the
membrane resistance rmand cytoplasmic resistance ri. For a dendritic segment of length l with
constant radius r, the values for rm and riare described below where Rm is the specific membrane
resistivity (Ω∙cm2) and Ri is the specific intracellular resistivity (Ω∙cm). Rm depends on the lipid and
protein composition of the membrane and includes the density and conductance of so-called ‘leak’
channels that are neither voltage nor time-dependent (e.g. TWIK-related Acid-Sensitive K+
channels) (Lesage and Lazdunski, 2000). These channels introduce an inherent leak in the
membrane. Ri depends on the composition of the cytoplasm.
𝑟𝑟𝑚𝑚 =𝑅𝑅𝑚𝑚
2𝜋𝜋𝑟𝑟𝑙𝑙 (1.1)
𝑟𝑟𝑖𝑖 =𝑅𝑅𝑖𝑖𝑙𝑙𝜋𝜋𝑟𝑟2 (1.2)
Current will always follow the path of least resistance. Therefore, the greater the membrane
resistance (higher rm) and the better the conducting properties of the cytoplasm (lower ri), the
further current spreads along the dendrite before leaking across the membrane. These parameters
are governed by the geometry of the dendritic tree. Assuming a constant Rm and Ri, the ratio of rm to
riis directly proportional to the radius as shown below.

6
𝑟𝑟𝑚𝑚𝑟𝑟𝑖𝑖
= 𝑅𝑅𝑚𝑚𝑅𝑅𝑖𝑖
𝑥𝑥𝑟𝑟2
(1.3)
Therefore, large diameter dendrites are able to transmit current over greater distances than
small diameter dendrites. Synaptic current is also lost as it spreads distally from the synapse and
branch points introduce additional paths for current loss. Compartment models based on the
morphology of intracellularly stained motoneurons have shown that the loss of current can be as
high as 80% (Rose and Cushing, 1999; Korogod et al., 2000; Powers and Binder, 2001; Bui et al.,
2003; Cushing et al., 2005). Furthermore, there is a strong correlation between the magnitude of
current loss and the distance between the synapse and the soma.
1.4 Active properties of dendrites
The predictions based on cable theory noted above ignore the presence of voltage-
dependent channels. There is considerable evidence from optical, electrophysiological and
molecular studies that the dendrites of many CNS neurons including motoneurons possess several
different classes of voltage-dependent channels (Hausser et al., 2000; Vacher et al., 2008). The
opening and closing of these channels impose changes to the effective specific membrane resistivity
Rm. The effectiveRm includes the resistance of the membrane due to passive components (as
described in cable theory) and active components like voltage-dependent channels. For instance,
the increased membrane leak introduced by the opening of some voltage-dependent channels
(lower effective Rm) may provide a powerful means to reduce the transfer of synaptic current from
the dendrites to the soma. Moreover, the additional current provided by voltage-dependent
channels can either amplify or dampen the delivery of synaptic current. The amplification may
counteract the loss of current due to the leakiness of the membrane regardless of whether the
leakiness is due to passive or active properties.

7
There are at least 11 different types of voltage-dependent channels present on
motoneurons. Although most of the known channel locations are somatic there is very persuasive
electrophysiological and anatomical evidence for the presence of L-type Ca2+, persistent Na+, Kv2.1,
and small conductance Ca2+ activated K+ (SK) channels on the dendrites of motoneurons
(Heckmann et al., 2005; Muennich and Fyffe, 2004; Li and Bennett, 2007; Ballou et al., 2006).
Computational studies further suggest that L-type Ca2+ channels are restricted to ‘hotspots’
approximately 100 µm long (Bui et al., 2006). The distance between the hotspots and the soma
varied from 180 to 850 µm and increased with the size of the motoneuron (Elbasiouny et al., 2005;
Grande et al., 2007a). Descriptions of the other channels are currently either cursory or absent.
Furthermore, most of the known distributions are described in very simple terms (e.g. dendritic
versus somatic densities). Although the latter is a useful starting point, it fails to take into account
variations within the dendritic tree that are commonly seen in other types of neurons (Vacher et al.,
2008; Nusser, 2009)

8
Chapter 2. Input-output properties of motoneurons in response to time-varying inputs
Thus far, the input-output properties of motoneurons have been described in the context of
steady long-lasting input. However, synapses do not generate signals that are steady or long-lasting.
Typically, ligand-dependent channels open briefly, usually for periods of less than 1 or 2 ms. Thus,
the current crossing the membrane is equally brief. In addition, in rhythmic motor behaviors such
as walking, scratching and swimming, motoneurons are driven by networks of rhythmically active
neurons in the spinal cord called central pattern generators (Cazalets et al., 1996; Hochman and
Schmidt, 1998; Kiehn et al., 2000). The motoneuron membrane potential oscillates between
alternating periods of hyperpolarization and depolarization during these rhythmic locomotor
movements (Cazalets et al., 1996; Hochman and Schmidt, 1998; Berg et al., 2007). These different
phases result from putative changes in the relative activity of excitatory and inhibitory synapses.
The relationship between these transient inputs and motoneuron output is determined by the same
factors described previously for time-invariant inputs and several additional factors that are
described below.
2.1 Membrane capacitance alters the time course of transient synaptic potentials
An electric capacitor is a device that stores charge. It is comprised of two conducting plates
separated by an insulating barrier. Since the lipid bilayer of the neuronal membrane separates an
internal and external conducting medium, the neuronal membrane acts as a capacitor (see Figure
2.1).

9
Figure 2.1(A) A parallel plate capacitor comprised of two conducting plates separated by an insulating barrier. (B) The common schematic symbol for a capacitor in circuit diagrams. (C) The lipid bilayer acts as a capacitor by separating the electrically conductive media of the cytoplasm and extracellular fluid.
When a brief current step mimicking a transient inputis delivered through an electrode
across a pure lipid bilayer, some ions that carry the current will collect on the inner surface. This
leads to an accumulation of charge that will electrostatically repel similar charges lying on the outer
surface. Consequently, an equal and opposite charge will develop on the two surfaces. This charge
separation produces a change in the potential across the pure lipid bilayer (see Figure 2.2).
Figure 2.2 (A) When a brief step of current is delivered through an electrode, a capacitive current (Ic) is generated across the neuronal membrane. (B) The equivalent electrical circuit representing a pure lipid bilayer. The electrode is represented by an ideal current source that delivers a current step (Istep). The current that flows on to the capacitor (Ic) will deposit charge on one conducting plate. This leads to the displacement of similar charges on the other conducting plate resulting in a separation of charge. A potential difference will now exist between the two plates of the capacitor.

10
The membrane capacitance cmmeasures the ability of the neuronal membrane to store
charge and is defined as the amount of charge required to produce a given membrane potential
difference. The membrane capacitance for a dendrite of length lwith constant radius r is described
below where Cm is the specific membrane capacitance and has an approximate value of 1uF/cm2
(see equation 1.4).
𝑐𝑐𝑚𝑚 = 𝐶𝐶𝑚𝑚2𝜋𝜋𝑟𝑟𝑙𝑙 (1.4)
When the contribution of the membrane capacitance is considered alone, a brief current
step will produce a change in the membrane potential that depends on both the magnitude and
duration of the current. This is described below where ∆V is the change in membrane potential
(mV), Ic is the magnitude of the current flowing across the membrane due to the membrane
capacitance (nA), ∆𝑡𝑡 is the current duration and cm is the membrane capacitance (µF) (see equation
1.5).
∆𝑉𝑉 = 𝐼𝐼𝑐𝑐∆𝑡𝑡𝑐𝑐𝑚𝑚
(1.5)
In response to the current step, the membrane potential will continue to increase linearly with time
for as long as the current step is applied (see equation 1.6 and Figure 2.3).
∆𝑉𝑉∆𝑡𝑡
= 𝐼𝐼𝑐𝑐𝑐𝑐𝑚𝑚
(1.6)

11
Figure 2.3 If the membrane had only capacitive properties, the membrane potential (B) would change linearly with time in response to a current step (A). The membrane potential will continue to increase over the duration of the current step. The slope of the rise in membrane potential is given by equation 1.6.
However, the membrane potential of the neuron does not change linearly with time in
response to the same step of current. In addition to acting as a capacitor, the neuronal membrane
also provides a resistive pathway rm for current flow as mentioned previously. Current crossing the
membrane can either flow onto the membrane capacitor to be stored as charge or through the finite
number of ‘leak’ channels present on the neuronal membrane that provide the resistive pathway.
Thus, a patch of membrane can be represented by a simple electrical circuit with the membrane
resistance and capacitance placed in parallel (see Figure 2.4).
Figure 2.4(A) The neuronal membrane is composed of a lipid bilayer. Inserted into this lipid bilayer, there are many ion-conducting ‘leak’ channels that are neither voltage nor time-dependent. Current crossing the membrane can flow either onto the membrane capacitance or through the resistive pathway provided by ‘leak’ channels. Thus, the membrane acts as both a capacitor and resistor in parallel. (B) The equivalent electrical circuit representing the neuronal membrane. The electrode is represented by a current source that delivers a current step (Istep). Current can flow either onto the capacitor (Ic) to be stored as charge across the membrane or through the resistor (Ir) representing ‘leak’ channels.
12
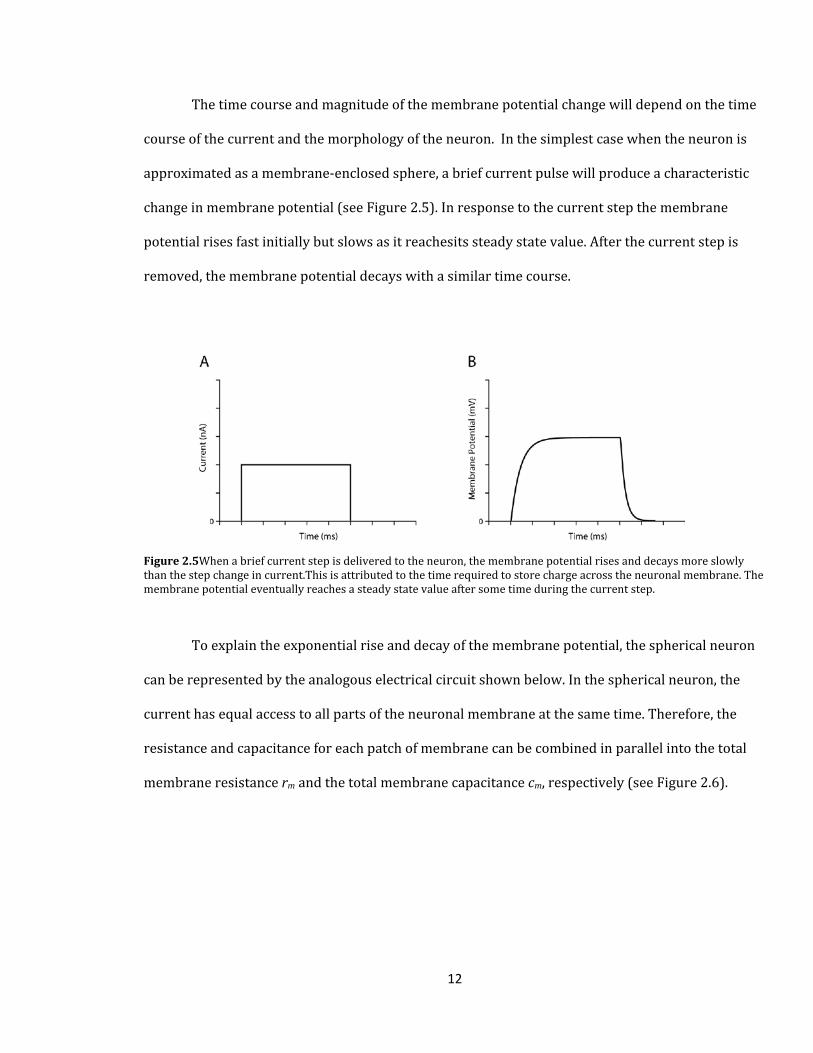
The time course and magnitude of the membrane potential change will depend on the time
course of the current and the morphology of the neuron. In the simplest case when the neuron is
approximated as a membrane-enclosed sphere, a brief current pulse will produce a characteristic
change in membrane potential (see Figure 2.5). In response to the current step the membrane
potential rises fast initially but slows as it reachesits steady state value. After the current step is
removed, the membrane potential decays with a similar time course.
Figure 2.5When a brief current step is delivered to the neuron, the membrane potential rises and decays more slowly than the step change in current.This is attributed to the time required to store charge across the neuronal membrane. The membrane potential eventually reaches a steady state value after some time during the current step.
To explain the exponential rise and decay of the membrane potential, the spherical neuron
can be represented by the analogous electrical circuit shown below. In the spherical neuron, the
current has equal access to all parts of the neuronal membrane at the same time. Therefore, the
resistance and capacitance for each patch of membrane can be combined in parallel into the total
membrane resistance rm and the total membrane capacitance cm, respectively (see Figure 2.6).

13
Figure 2.6 (A) The equivalent electrical circuit representing a spherical neuron. An intracellular electrode delivers a current step to the neuron. (B) Since the injected current has equal access to all parts of the neuronal membrane at the same time, the resistors and capacitors for each membrane patch can be combined in parallel into the total membrane resistance rm and total membrane capacitance cm. The total membrane resistance is determined by dividing the specific membrane resistance Rm by the total membrane area of the spherical neuron (A = 4πr2). The total membrane capacitance is determined by multiplying the specific membrane capacitance Cm by the total membrane area of the spherical neuron. Thus, the schematic shown in (A) can be reduced to a simple electrical circuit (B) with the total membrane resistance and total membrane capacitance lying in parallel, which are connected in series to a current source representing the electrode.
The current flowing through the membrane resistance is referred to as the membrane ionic
current Ir (see equation 1.7) and the current that flows onto the membrane capacitance is referred
to as the membrane capacitive current Ic(see equation 1.8). Vm is the membrane potential and ∆𝑡𝑡 is
the current step duration.
𝐼𝐼𝑟𝑟 = 𝑉𝑉𝑚𝑚𝑟𝑟𝑚𝑚
(1.7)
𝐼𝐼𝑐𝑐 = 𝑐𝑐𝑚𝑚∆𝑉𝑉𝑚𝑚∆𝑡𝑡
(1.8)
The total current crossing the membrane Im is the sum of the membrane ionic current and the
membrane capacitive current (see equation 1.9).

14
𝐼𝐼𝑚𝑚 = 𝑉𝑉𝑚𝑚𝑟𝑟𝑚𝑚
+ 𝑐𝑐𝑚𝑚∆𝑉𝑉𝑚𝑚∆𝑡𝑡
(1.9)
The capacitance of the membrane has the effect of reducing the rate at which the membrane
potential changes in response to a current step. If the membrane had only resistive properties, a
current step would produce an instantaneous change in the membrane potential. Since the
membrane has both capacitive and resistive properties, the actual change in membrane potential
combines features of both.
At the onset of the current step, all of the current initially flows onto the membrane
capacitance (Im = Ic). As a result of the large initial capacitive current Ic, the potential across the
membrane capacitance will rapidly increase. Since the membrane resistance and capacitance are in
parallel, the potential across each must always be the same and equal to the membrane potential
Vm. The increase in membrane potential will drive progressively more current across the
membrane resistance (this is Ohm’s law). Consequently, increasingly less current flows onto the
membrane capacitance (since Im= Ir+ Ic) and its rate of charging will decrease. This in turn will
decrease the rise of the membrane potential and accounts for the exponential time course.
The rising phase of the membrane potential change is described below by solving equation
1.9 for Vm where 𝜏𝜏 is the membrane time constant and is given by the product of the membrane
resistance rm and membrane capacitance cm (see equations 1.10 and 1.11). The membrane time
constant represents the time taken for the membrane potential to rise to (1 – 1/e) or 63% of its
steady state value.
𝑉𝑉𝑚𝑚 (𝑡𝑡) = 𝐼𝐼𝑚𝑚𝑟𝑟𝑚𝑚 (1 − 𝑒𝑒−𝑡𝑡𝜏𝜏 ) (1.10)

15
𝜏𝜏 = 𝑟𝑟𝑚𝑚𝑐𝑐𝑚𝑚 (1.11)
Eventually, steady state is reached and the membrane potential no longer changes. When
this occurs, the capacitive current is zero and all of the current crossing the membrane will flow
through the membrane resistance (Im= Ir and Ic = 0). The membrane potential at steady state is
described below (see equation 1.12).
𝑉𝑉𝑚𝑚 = 𝐼𝐼𝑟𝑟𝑟𝑟𝑚𝑚 (1.12)
When the current step is removed, the potential difference across the membrane
capacitance Vmwill drive current out of the membrane through the resistive pathway rm. This flow
of current serves to reduce the charge separation across the membrane capacitance. As charge on
the membrane capacitance dissipates the membrane potential Vmwill decrease. The decay in the
membrane potential also follows an exponential time course and is described below (see equation
1.13).
𝑉𝑉𝑚𝑚 (𝑡𝑡) = 𝑉𝑉𝑚𝑚𝑚𝑚𝑥𝑥 (𝑒𝑒−𝑡𝑡𝜏𝜏 ) (1.13)
2.2 The voltage response to a brief current injection in the dendrite
In a spherical neuron, the effect of distance can be ignored since the injected current flows
equally through the resistance and capacitance in all parts of the membrane at the same time.
However, when a brief current step is delivered to the dendrite, the current does not have equal
access to all parts of the membrane. In order to reach distant sites, current must flow along the
length of the cylindrical dendrite. As mentioned previously, the cytoplasmic core of the dendrite
offers afinite resistance to the longitudinal flow of current. Consequently, this resistance to current
flow will lead to some current leaking across the neuronal membrane during travel. However,

16
unlike the previous description, some of the current will cross the membrane via the membrane
capacitance.
The response of the dendrite to a brief current step can be described by dividing an
infinitely long dendrite into smaller unit length cylindrical compartments (see Figure 2.7A).The
membrane of each individual compartment is represented by a simple electrical circuit with the
membrane capacitance and membrane resistance placed in parallel (see Figure 2.7B). The length of
each compartment is very short such that changes in current or voltage are continuous when
examined on a scale of 10’s or 100’s of microns. Neighboring compartments are connected to each
other by an internal resistor, which represents the cytoplasmic resistance of ½ of each
compartment.
Figure 2.7 (A) The response of the dendrite to a brief step of current can be described by dividing an infinitely long dendrite into smaller unit length cylindrical compartments. (B) The equivalent electrical circuit representing an infinitely long dendrite. Each compartment is connected to the next by a resistor that represents the cytoplasmic resistance between.

17
When a brief current step is delivered to a site on the dendrite, some current will flow back
through the membrane in the immediate region (e.g. closest compartment) but most willflow into
the neighboring compartments via the cytoplasmic resistance.This process will continue foreach
successive compartment. Due to the current crossing the membrane, the time course of the
membrane potential change will closely resemble Figure 2.5B. This has important consequences for
the time course of current arriving at adjacent compartments. Since this current must flow through
the cytoplasmic resistance, represented by a simple resistor, the exponential rise and fall in the
membrane potential of the preceding compartment will produce a similar exponential rise and fall
in the current arriving in the subsequent compartment. As a result, the time course of current
reaching distant sites will be slower than at the current injection site.Furthermore, since some
current is lost through the membrane there will be less current arriving at the next
compartment.The cumulative slowing in the time course of the current step combined with the loss
of current results in a progressively slower rate of rise and a smaller peak value for current
travelling along the dendrite.
Lastly, the duration of the initial current step must be considered. If the time required for
the change in membrane potential to reach steady state exceeds the duration of the current step,
the local membrane potential change will be lower and disproportionate to the magnitude of the
current step. This smaller change in membrane potential at the site of injection will drive less
current into neighboring compartments. Since frequency and duration are inversely related, less
current will reach neighboring compartments from transient inputs of short duration (high
frequency) compared to transient inputs of longer duration (low frequency). Modeling studies have
reported a greater than 40 fold difference in the peak of the local membrane potential change in
response to the same brief current step injected at a distal dendritic site compared to the soma.
This arises from differences in the membrane time constant between the two locations. The

18
membrane time constant governs the rate and thus the time taken for the membrane potential to
reach steady state (Rinzel and Rall, 1974).
2.3 Impedance as an electrical property to describe the input-output relationship of
motoneurons in response to time-varying inputs
The previous section described the factors that determine the input-output properties of
motoneurons where the input is defined as a single somatic or dendritic synapse. An important
principle to emerge from this description is the ability of neurons to change the time course and
amplitude of electrical signals (e.g. current and membrane potential changes) due to the electrical
properties (e.g. resistance and capacitance) of neuronal membranes. As a consequence, the change
in membrane potential in response to inputswith high frequency components is selectively reduced.
This behavior is referred to as low-pass filtering since low frequency inputs yield relatively large
voltage responses compared to high frequency inputs.
The brief current step described above was a simple case of a time-varying input. In reality,
the time-varying inputs that a neuron receives are more complex in shape. However, regardless of
their shape, all time-varying inputs are composed of combinations of sine waves with different
frequencies. For example, if the input varies slowly such as oscillations in excitatory or inhibitory
inputs associated with slow walking (approximately 1 Hz), the time course of these oscillations can
be mimicked by the sum of a finite number of sine waves with frequencies between 0.5 and 5 Hz.
On the other hand, the frequencies of sine waves required to mimic fast inputs such as the
asynchronous activation of excitatory or inhibitory synapses lasting 10 to 100 ms will be in the 10
to 1000 Hz range.

19
The impedance of a neuron provides a direct measure of the response of a neuron to time-
varying inputs, expressed in terms of the frequency of the input. Impedance is a concept similar to
resistance. Whereas resistance is generally defined as the opposition to the flow of current,
impedance is a special case of the opposition to current flow when the current varies with time.
Stated formally, impedance is the resistance to the flow of current at a particular frequency
measured in ohms (Ω). The impedance of a neuron at a specific range of frequencies can be
determined by injecting a sinusoidal current of constant amplitude that increases linearly in
frequency with time. This type of time-varying current that sweeps through many frequencies is
referred to as a ‘ZAP’ current (see Figure 2.8 left). The ZAP current is useful because each frequency
in the current is isolated briefly in time so that the voltage response at each frequency can be easily
observed. Since the amplitude of the ZAP current is constant, any changes in the voltage response
will be attributed to changes in the frequency of the current.
Unlike resistance, the impedance cannot be determined simply by the ratio of the voltage
and current at a given point in time. As mentioned previously, the change in membrane potential
‘lags’ behind changes in the inputdue to the finite time required to charge and discharge the
membranecapacitance. As a result, the membrane potential change is ‘out-of-phase’ with the timing
of the input. Thus, it would not be possible to calculate the impedance at a given time point due to
the delay between the current and the corresponding voltage response. Instead, the impedance can
be calculated by the ratio of the voltage and current, each expressed as a function of frequency,
thereby avoiding the problem described above (see Figure 2.8 right).
Consider the case of a simple resistor. When a ZAP current is delivered to a circuit whose
only component is a resistor, the amplitude of the voltage response is the same for all frequencies.
Furthermore, the instantaneous voltage and current at any point in time are ‘in-phase’ since the

20
current and voltage rise and fall simultaneously. Here, the impedance is constant with a value equal
to the resistance of the circuit (see Figure 2.8A).
The outcome is different for a circuit containing a resistor and capacitor in parallel
representing the passive electrical properties of the neuronal membrane (see Figure 2.8B). The
amplitude of the voltage response decreases as the frequency of the current increases. Moreover,
the instantaneous voltage and current at any point in time are ‘out-of-phase’ since the time course
of the current is altered by the capacitor. These effects are seen as a decline in the impedance with
increasing frequency (see Figure 2.8B right) and an increasing phase shift between current and
voltage with increasing frequency. The circuit, therefore, acts as a low-pass filter.
Figure 2.8 (A) ZAP current delivered to a circuit containing a resistor (left), the corresponding voltage response (middle) and the impedance curve (right). (B) ZAP current delivered to a capacitor and resistor in parallel (left), the corresponding voltage response (middle) and impedance curve (right). (C) ZAP current delivered to a circuit containing a capacitor, resistor, and a non-ohmic resistor (Gchannel) mimicking a voltage-dependent channel (left) in parallel. The peak in the voltage response occurs at the resonance frequency (middle) and corresponds to the peak in the impedance curve (right) (Figure adapted from Hutcheon and Yarom, 2000).

21
2.4 Resonance
A distinct property noted in some neurons is a peak in the impedance curve referred to as
resonance (Puil et al., 1994; Gutfreund et al., 1995; Hutcheon et al., 1996; Lampl and Yarom, 1997;
Narayanan and Johnston, 2007; Manuel et al., 2007) (see Figure 2.8C right). Resonance is an
emergent property that results from the interaction between the active and passive properties of a
neuron. When a ZAP current is delivered to a circuit with a capacitor, resistor and non-ohmic
resistor (representing a voltage-dependent channel) placed in parallel, the voltage response is
greatest within a narrow band of current frequencies (see Figure 2.8C left and middle). The
existence of resonance indicates that a neuron is able to discriminate inputs on the basis of their
frequency content and responds best to inputs at preferred frequencies. Specifically, inputs with
frequency components near the resonance frequency will produce the largest changes in
membrane potential.
To create resonance, it is necessary to have two processes that operate selectively at
specific frequency domains – one that reduces the voltage response to high frequency inputs and
another that reduces the voltage response to low frequency inputs. The resulting combination of
low and high-pass filtering creates an intermediate range of preferred input frequencies (see Figure
2.9). As mentioned previously, the voltage response to high frequency inputs is selectively reduced
due to the passive electrical properties of the membrane. The mechanisms that selectively reduce
the voltage response to low frequency inputs are less well understood. However,
electrophysiological studies have shown that changes in the membrane potential at low frequencies
can be reduced by specific classes of voltage-dependent channels. To be effective, these classes of
voltage-dependent channels must display two important features. They must (1) activate slowly
and (2) produce currents that oppose voltage changes (Gutfreund et al., 1995; Hutcheon et al.,
1996; Lampl and Yarom, 1997; Narayanan and Johnston, 2007; Manuel et al., 2007).

22
Figure 2.9 Resonance is produced by the interaction between the passive and active properties of a neuron (black line). At very high frequencies, the voltage response is selectively reduced by passive properties resulting in small impedance values (grey line). At very low frequencies, the voltage response is selectively reduced by specific classes of voltage-dependent channels resulting in small impedance values (dotted black line)(Figure adapted from Hutcheon and Yarom, 2000).

23
Chapter 3. Hyperpolarization-Activated Cyclic Nucleotide-Gated (HCN) channels
3.1 Properties of HCN channels
The hyperpolarization-activated cyclic nucleotide-gated (HCN) channels belong to the
superfamily of voltage-dependent K+ channels (McCormick and Pape, 1990). HCN channels are
unique among voltage-dependent channels in that they activate at hyperpolarized potentials and
deactivate at depolarized potentials. When activated, HCN channels produce a mixed cation current
termed Ihthat is carried by Na+ and K+. This mixed permeability to Na+ and K+ results in a reversal
potential of approximately -40 to -20 mV. Thus, in the range of membrane potentials that are
physiological relevant, Ih is directed inwardwhich will depolarize the membrane potential.
The effect of HCN channels on motoneurons were first described in 1965 by Ito and Oshima.
In response to a hyperpolarizing current step, the membrane potential fell exponentially, but unlike
a strictly passive response, there was a slow depolarizing rebound of the membrane potential
towards the resting membrane potential. When the current step is removed, a small depolarizing
overshoot in the membrane potential occurred. This overshoot recovered slowly back towards the
resting membrane potential with a time course similar to the rebound (Ito and Oshima, 1965) (see
Figure). The depolarizing rebound or “sag” in the membrane potential is a characteristic
consequence of HCN channels and is attributed to the Ih current that activates slowly during a
maintained hyperpolarization. Upon termination of the hyperpolarizing current step, the
depolarizing overshoot occurs from the continued current flow through the slowly deactivating
HCN channels. Furthermore, the onset and amplitude of the sag increases with hyperpolarization,
owing to a faster rate of Ih activation and greater Ihcurrent.

24
3.2 HCN channels and neuronal excitability
The previous section described the unique properties of HCN channels. These properties
contribute to the excitability and responsiveness of the neuron to inputs. Based on measurements of
its voltage dependence, HCN channels begin to activate at membrane potentials between -45 to -60
mV. Half-activation of the channels (V1/2) occurs between -75mV to -85 mV and at membrane
potentials negative to -110 mV, HCN channels are maximally activated (Bayliss et al., 1994). Since
the resting membrane potential of the neuron lies within the voltage range of Ih activation (between
-45 to -110 mV), a subset of HCN channels are active at rest and therefore partially determine the
resting membrane potential. Consequently, the sustained inward current carried through HCN
channels sets the resting membrane potential at more depolarized voltages and thus closer to the
threshold for action potential firing. This increases the excitability of the neuron.
Paradoxically, the opening of HCN channels at rest introduces additional membrane leak,
which lowers the effective membrane resistance Rm. Therefore in the presence of HCN channels,
any given input will produce a smaller local change in the membrane potential (due to Ohm’s law)
and more current will be the lost through the membrane as synaptic current travels from dendritic
synapses towards the soma. This has the effect of reducing the excitability of the neuron and the
responsiveness at the soma to inputs arriving from the dendrites.
Furthermore, the activation and deactivation of HCN channels actively oppose changes in
the membrane potential. This property is a consequence of the unusual relationship between the
activation curve and the reversal potential of HCN channels (approximately -20 mV). In contrast to
voltage-dependent Ca2+ and Na+ channels, the reversal potential of HCN channels falls near the base
of its activation curve. Consequently, when the membrane is hyperpolarized from the resting value,
the fraction of HCN channels that are open increases. This leads to more Ih, which acts to drive the
membrane potential towards the reversal potential of HCN channels thereby restoring the

25
membrane potential back to rest. Conversely, the HCN channels active at rest are deactivated in
response to membrane depolarization. The loss of an inward depolarizing current (Ih ) results in an
effective outward current that hyperpolarizes the membrane potential thus returning it back to
rest.
3.3 Modulation of HCN channels
As the name implies, HCN channels are also regulated by cyclic nucleotides. HCN channels
posses a cyclic nucleotide-binding domain and are thus targets for neurotransmitters and second
messenger systems. Studies have shown that binding of cyclic adenosine monophosphate (cAMP) to
the cyclic nucleotide-binding domain facilitates the activation of HCN channels by shifting the
voltage dependence of activation to more depolarized values, typically by 10 mV or more. This
results in the activation of a greater fraction of HCN channels at a given membrane potential.
Furthermore, the shift in the voltage dependence of activation accelerates the activation kinetics of
HCN channels (DiFrancesco and Tortora, 1991). Later studies presented evidence of an increase in
HCN channel activation upon stimulation of β-adrenergic and serotonergic receptors (Takahashi
and Berger, 1990; Larkman and Kelly, 1992; Hsiao et al., 1997). These receptors are positively
coupled to adenylyl cyclase, which elevates intracellular levels of cAMP. Conversely,
neurotransmitters that downregulatecAMP levels depress the activation of HCN channels by
shifting its activation curve to more hyperpolarized potentials. Thus, the modulation of the voltage
dependence and activation kinetics of HCN channels by external influences confers an additional
level of complexity to the functional properties of HCN channels.
3.4 Functional Diversity of HCN channels
As mentioned previously, HCN channels are members of the voltage-dependent K+ channel
family. Sharing a similar structure, HCN channels are composed of four subunits arranged around a
central pore, each comprised of six membrane-spanning domains (S1 – S6). In mammals, these

26
subunits exist as four different isoforms (HCN1-4) that are widely expressed in the CNS. These HCN
isoforms have been systematically characterized and differ from each other with respect to their
voltage dependence, activation time constants and extent of cAMP-dependent modulation. For
instance, homotetramers of the HCN1 subunit activate at relatively lower hyperpolarized potentials
(V1/2 between -70 to -90 mV) compared to the other isoforms. In addition, HCN1 homotetramers
respond rapidly to hyperpolarization (in tens of milliseconds) and show a minimal response to
cAMP (Santoro et al., 1998). HCN2 and HCN3 homotetramers activate more slowly (hundreds of
milliseconds). However, HCN2 homotetramers are modulated strongly by cAMP whereas HCN3
homotetramers were found to be insensitive to cAMP (Ludwig et al., 1998; Ludwig et al., 1999;
Santoro and Tibbs, 1999; Mistrik et al., 2005; Stieber et al., 2005). HCN4 homotetramers activate
very slowly (seconds) and respond strongly to cAMP (Ishii et al., 1999; Seifert et al., 1999).
Furthermore, different HCN subunit isoforms may coassemble into heterotetramers. For
instance, HCN1 and HCN2 subunits can combine to form stable heterotetramers that carry an Ih
current with kinetics intermediate to that of homotetrameric HCN1 and HCN2 channels (Ulens and
Tytgat, 2001). Thus, the composition of subunits in addition to modulation by neurotransmitters
and second messengers leads to a great diversity in the properties of HCN channels (Chen et al.,
2001; Ulens and Tytgat, 2001).
3.5 HCN channels and resonance in motoneurons
The slow activation and deactivation kinetics of HCN channels (tens to hundreds of
milliseconds) and their opposition to changes in the membrane potential effectively limits the
duration and amplitude of hyperpolarizing and depolarizing responses to low frequency inputs. Due
to these properties, HCN channels act as a high-pass filter. Together with the low-pass filtering
attributed to passive membrane properties, this leads to resonance behavior in some neurons.

27
HCN channels are essential for the emergence of resonance behavior in CA1 hippocampal
and layer 5 pyramidal neurons (Hutcheon et al., 1996; Luthi and McCormick, 1998; Hu et al., 2002;
Narayanan and Johnston, 2007). These pyramidal neurons are tuned to produce the greatest
membrane potential response to inputs with frequencies near 5 Hz and it was demonstrated that
this resonance frequency was dependent on the activation properties and density of HCN channels
(Narayanan and Johnston, 2007). Most importantly, the resonance was abolished after
pharmacological block of HCN channels (Buzsaki, 2002; Ulrich, 2002; Leung and Yu, 1998; Pike et
al., 2000).
Recent work has shown that motoneurons also display resonance behavior that is
attributed HCN channels (Manuel et al., 2007). In resonant motoneurons, EPSPs induced by muscle
stretches with high frequency components were preferentially amplified by the fast persistent
sodium current, INaP. These high frequency components were associated with the velocity of the
muscle stretch. In contrast, the low frequency components of EPSPs induced by muscle stretches
were preferentially amplified in non-resonant motoneurons by a slow persistent calcium current,
ICaL, mediated by L-type Ca2+ channels. These low frequency components were associated with
maintained changes in muscle length.
Furthermore, resonant motoneurons may belong to fast fatigable (FF-type) or fast fatigue-
resistant (FR-type) motor units. The muscle fibers of these motor units are characteristically fast
contracting and develop large forces (Burke, 1981). On the other hand, non-resonant motoneurons
displaying little Ih may belong to slow contracting (S-type) motor units that are resistant to fatigue
(Burke, 1981; Gustafsson and Pinter, 1984). Thus, the presence and absence of this resonance
behavior may offer a potential strategy to facilitate motor unit recruitment. The amplification of
high frequency inputs induced by rapid muscle stretches lowers the recruitment threshold of FF-
type and FR-type motoneurons. These motor units may in turn produce ballistic movements in
28
response to rapid muscle stretches (e.g. to restore balance). In non-resonant motoneurons, the
preferential amplification of low frequency inputs may promote the recruitment of S-type
motoneurons during sustained muscle stretches. Since S-type motor units are resistant to fatigue,
the resulting sustained contraction might contribute to the maintenance of posture.
In order to replicate the experimental findings, simulations based on a simple motoneuron
model suggest that HCN channels must be present on the motoneuron dendritic tree to produce this
effect (Manuel et al., 2007). However, these models assume a uniform density of HCN channels
across the dendritic tree and this assumption has not been verified.
3.6 Distribution of HCN channels
The distribution of HCN channels in the CNS is one of the best studied among voltage-
dependent channels and is remarkably diverse across neurons. In both hippocampal CA1 and layer
5 neocortical pyramidal neurons, dendritic patch-clamp recordings have revealed a gradient of Ih
that increases over six-fold in density with distance from the soma along the apical dendrite
(Magee, 1998; Williams and Stuart, 2000; Berger et al., 2001; Kole et al., 2006). A similar gradient
(but up to 70 fold) has recently been confirmed at the ultrastructural level using immunogold
electron microscopy (Lorincz et al., 2002; Notomi and Shigemoto, 2004) (see Figure 3.1B).
In contrast, a reverse gradient of Ih is displayed by a class of hippocampal neurons with
pyramidal morphology (Bullis et al., 2007). These pyramidal-like principal (PLP) neurons express a
high density of Ih at the soma that declined with distance along the apical dendrite (see Figure
3.1C). Moreover, the biophysical properties of Ih (e.g. voltage-dependence of activation and
activation kinetics) were similar in both PLP neurons and CA1 pyramidal neurons suggesting that a
similar composition of HCN subunits underlie the different gradients of Ih. This finding
demonstrates that an increasing somatodendritic gradient of Ih is not a general feature of pyramidal
neurons.

29
A different Ih distribution is seen in cerebellar Purkinje neurons where the density of Ih is
uniform on the dendritic tree (see Figure 3.1A). Dendritic patch-clamp recordings at different
distances from the soma yielded similar densities of Ih (Hausser and Clark, 1997; Angelo et al.,
2007). The voltage-dependent properties of Ih in Purkinje neurons were similar to those of Ih in
pyramidal neurons; however, the activation and deactivation kinetics were slower. The discrepancy
in the kinetics suggests that other slower HCN subunits may also be expressed in Purkinje neurons
(Notomi and Shigemoto, 2004).
The functional significance of these different distributions of HCN channels observed across
neurons remains poorly understood. Motoneurons express the HCN1 and HCN2 subunits with an
apparent predominance of the HCN1 subunit and dense HCN1 immunoreactivity has been reported
at the soma and proximal dendrites of motoneurons (Moosmang et al., 1999; Monteggia et al., 2000;
Santoro et al., 2000; Chen et al., 2005; Milligan et al., 2006). However, no efforts have been made to
Figure 3.1 Yellow circles represent arbitrary units of density. (A) The density of HCN channels is uniform on the dendritic tree of cerebellar Purkinjes neurons (Hausser and Clark, 1997; Angelo et al.., 2007). (B) The density of HCN channels increases with distance from the soma along the apical dendrites of layer 5 pyramidal and hippocampal CA1 neurons. The highest densities are observed on the distal tuft dendrites (Magee, 1998; Williams and Stuart, 2000; Berger et al., 2001; Lorincz et al., 2002; Kole et al., 2006). (C) The density of HCN channels decreases with distance along the apical dendrite of another class of hippocampal neurons with pyramidal morphology (Bullis et al., 2007).
30
systematically describe the distribution of HCN channels across the entire motoneuron dendritic
tree.
Chapter 4.Mapping the distribution of voltage-dependent channelson dendritic membranes
Few studies have quantitatively examined the distribution of voltage-dependent channels
across the entire dendritic tree and thus descriptions of the distribution pattern of voltage-
dependent channels are sparse. This absence of a detailed account has hindered efforts to
determine the influence of voltage-dependent channels on the input-output properties of neurons.
As will be explained, mapping the distribution of voltage-dependent channels across the dendritic
tree is not a trivial task. Current descriptions rely on two techniques, dendritic patch-clamp
recordings or the high-resolution immunolocalization of channel subunits using electron or
confocal microscopy. Although both techniques have yielded useful insights, they also have
limitations, which are described below.
4.1 Patch clamp recordings from dendrites
Descriptions of the distribution of voltage-dependent channels based on dendritic patch-
clamp recordings rely on the ability to record the current carried by channels located in small
membrane patches on the dendritic tree in response to voltage-clamp commands. Thus, the power
of this technique is based on direct measurements from channels engaged in the very function that
gives them their name. Provided each channel has the same conductance, the magnitude of the
current measured from a patch of dendritic membrane is directly proportional to the number of
open channels open and area of membrane within the patch (Magee and Johnston, 1995; Colbert
and Johnston, 1996; Hoffman et al., 1997; Schwindt and Crill, 1997; Stuart and Spruston, 1998;
Bekkers and Stuart, 1998; Magee, 1998). It is also possible to describe key functional properties of
the channels such as voltage dependence, kinetics, and modulation by second messenger systems.
These advantages are partially offset by other factors. The dendrites of many neurons including

31
motoneurons taper and branch profusely giving rise to smaller diameter daughter branches. Unless
these dendrites occupy discrete regions close to their parent branches (e.g. tuft dendrites of layer 5
pyramidal neurons)(Nevian et al., 2007; Larkum et al., 2009), small diameter dendrites at great
distances from the soma remain inaccessible to patch clamp techniques. In addition, the number of
channels estimated in a given patch may be highly variable due to the limited area of the membrane
patch, especially for channels that are present at low density. Furthermore, this approach does not
necessarily measure the total number of voltage-dependent channels. For instance, as will be
discussed later the activity of many voltage-dependent channels can be regulated by
neuromodulators such as serotonin. In the absence of these neuromodulators, few channels may
open regardless of the membrane potential (Hounsgaard and Kiehn, 1989; Harvey et al., 2006).
Lastly, a limited number of patch clamp recordings can be taken before the viability of the neuron is
compromised. Thus, it is common practice to pool observations from many neurons to form one
data set. This inherently assumes that all neurons of that population display the same distribution
pattern of the voltage-dependent channel under study.
4.2 Immunocytochemistry and electron/confocal microscopy
The application of electron or confocal microscopy in conjunction with
immunohistochemistry is also a powerful tool for describing the distribution of voltage-dependent
channels (Lorincz et al., 2002;Muennich and Fyffe,2003; Lorincz et al., 2010). In principle, if these
techniques are combined with intracellular staining and three-dimensional reconstructions of
dendritic segments found on adjacent serial sections, it should be possible to compare the density
of voltage-dependent channels throughout the dendritic tree of single neurons. However, the
realization of this goal faces several obstacles.
The high spatial resolution provided by electron and confocal microscopy permits the
visualization of voltage-dependent channels and other proteins present on the surface of the

32
membrane. However, the immunohistochemical identification and localization of voltage-
dependent channels have been hampered by the scarcity of rigorously-verified antibodies specific
for channel subunits. In addition, intracellular staining techniques and methods to reconnect
dendritic segments found on multiple serial histological sections are required to sample
immunoreactive labeling from different dendritic regions across a single neuron. Furthermore, the
limited field of view that is inherent to electron microscopy restricts the dendritic surface area that
can be quantitatively examined for channel density. As a result, studies of the distribution of
voltage-dependent channels on motoneuron dendrites havebeen limited carefully selected regions
usually a few hundred microns from the soma (Milligan et al. 2006;Muennich and Fyffe, 2004).
Lastly, some anatomical descriptions of the distribution of voltage-dependent channels
report the total channel density observed within a dendritic volume (Zhang et al., 2006; Ballouet al.,
2006).These measurements include immunoreactivity due to channels in both the membrane and
cytoplasmic compartments of the dendrite. To obtain the density of voltage-dependent channels
that are localized to the membrane and thus responsive to changes in the membrane potential, the
immunoreactivity occurring in the cytoplasm must be excluded from the measurement. In principle,
this approach should yield the distribution of functional voltage-dependent channels and be
comparable to measurements of channel density collected from patch clamp recordings.

33
4.3 Statement of the problem
The dendrites of neurons in the CNS are the principal sites for receiving synaptic input.
Traditionally, dendrites were viewed as passive structures that served to funnel the current
generated at each synapse to the soma. However, the advent of techniques to voltage-clamp small
patches of dendritic membrane and the high resolution imaging provided by electron and confocal
microscopy have revealed that dendrites are endowed with a rich assortment of voltage-dependent
channels (Magee and Johnston, 1995; Colbert and Johnston, 1996; Hoffman et al., 1997; Schwindt
and Crill, 1997; Stuart and Spruston, 1998; Bekkers and Stuart, 1998; Magee, 1998; Lorincz et al.,
2002; Muennich and Fyffe, 2004; Lorincz et al., 2010). Voltage-dependent channels can either
amplify or dampen synaptic current en route to the soma. Thus, the amount of current delivered to
the soma and the resulting train of action potentials, defined as the output, will depend on the
density and distribution of voltage-dependent channels across the dendritic tree.
The relationship between synaptic input and neuronal output is crucial to an understanding
of motor control. To produce purposeful movement, the CNS must activate muscles in a highly
coordinated fashion. The amount of force generated by muscles is determined by either varying the
number of muscle fibers activated or by varying the rate at which these muscle fibers discharge
(Denny-Brown and Sherrington, 1928; Adrian and Bronk, 1929). Both of these mechanisms are
dependent on the activity of motoneurons, which provide the sole link by which the CNS can
communicate with muscles. Thus, all premotor and sensory feedback signals must be processed by
the motoneuron before influencing the activity of muscles. Understanding the role that voltage-
dependent channels play in this step is central to understanding how voltage-dependent channels
govern the input-output relationship of motoneurons. This study examines one the key factors that
will define this role, the distribution of voltage-dependent channels on the dendritic tree. However,
current imaging and recording techniques that provide direct measurements of channel density on

34
dendrites suffer from methodological limitations that preclude sampling on a scale necessary to
comprehensively map the distribution of voltage-dependent channels across the dendritic tree.
The distribution of hyperpolarization-activated cyclic nucleotide-gated (HCN) channels is
one of the best studied among voltage-dependent channels in the CNS (Johnston et al., 1996; Reyes,
2001; Migliore and Shepherd, 2002; Lai and Jan, 2006; Vacher et al., 2008). HCN channels are an
unorthodox class of voltage-dependent channels that activate at hyperpolarized potentials to
produce a positive inward current (Ih) and deactivate at depolarized potentials. The distribution of
HCN channels across neurons is remarkably diverse. There is a pronounced increased in HCN
channel density from soma to distal dendrites in CA1 hippocampal and neocortical pyramidal
neurons (Magee, 1998; Williams and Stuart, 2000; Berger et al., 2001; Kole et al., 2006; Lorincz et
al., 2002; Notomi and Shigemoto, 2004). In contrast, a reverse gradient is present in another class of
hippocampal neurons (Bullis et al., 2007). Lastly, the density of HCN channels is uniform across the
dendritic tree of cerebellar Purkinje neurons (Hausser and Clark, 1997; Angelo et al., 2007). The
functional significance of these fundamental differences remains poorly understood. In
motoneurons, HCN channels underlie resonance behavior whereby EPSPs induced by muscle
stretches at a frequency near the resonance frequency of motoneurons produce a larger change in
the membrane potential. Simulations of these experimental findings based on anatomically reduced
models of the motoneuron suggest that HCN channels must be present on the dendritic tree.
However, these models assume a uniform distribution of HCN channels and this assumption has not
been verified (Manuel et al., 2007). It is known that two of the four HCN subunits, HCN1 and HCN2,
are expressed in motoneurons; however, the distribution of these subunits on the motoneuron
dendritic tree is unknown (Moosmang et al., 1999; Monteggia et al., 2000; Santoro et al., 2000).

35
4.4 Statement of the goal
The goals of this thesis are the following:
1) To develop a high throughput method for measuring the membrane-associated density of
voltage-dependent channels on dendrites of intracellularly stained neurons.
2) To compare the proximal to distal distribution of channels formed by the HCN1-subunit on the
dendritic trees of trapezius motoneurons in the adult feline.
36
Chapter 5.Materials and Methods
5.1 Animal preparation
Experiments were performed on 10 adult female felines weighing 3.1-4.6 kg (Liberty
Research Inc., Waverly New York USA). All experimental protocols were approved by the Queen’s
University Animal Care Committee and conducted in accordance with guidelines established by the
Canadian Council on Animal Care. Animals were pre-medicated with a combination of butorphanol
(0.2 mg/kg; Torbugesic; Wyeth), acepromazine (0.05 mg/kg; Altravet; Ayerst Veterinary
Laboratories), glycopyrrolate (0.01 mg/kg; Sanoz) and hydromorphone (0.075 mg/kg; Purdue
Pharma Inc.) administered subcutaneously. Anesthesia was induced with ketamine (6.25 mg/kg;
Vetalar; Bioniche Animal Health Canada Inc.), medetomidine (0.03 mg/kg; Pfizer) and midazolam
(0.15 mg/kg; Sandoz) administered intravenously. Deep anaesthesia was maintained with
supplementary doses of sodium pentobarbital (2.5-5 mg/kg; Ceva Santé Animale) administered
intravenously in response to sudden increases in heart rate. This protocol maintained the heart rate
between 140-160 beats per minute. Heart rate, O2saturationand end-tidal CO2were continuously
monitored with a digital Cardell Veterinary Monitor 9500 HD monitor (Benson Medical Industries
Inc., Markham, Ontario, Canada). Rectal temperature was monitored using a YSI tele-thermometer
system and maintained at 35-37°C with a heating blanket under negative feedback control (Benson
Medical Industries Inc., Markham, Ontario, Canada). Normosol-R (Hospira Healthcare Corporation,
Montréal, Quebec, Canada) was administered intravenously at a constant rate (10 ml/kg/hour) to
maintain body fluids.
A dorsal laminectomy extending from C1 to C4 was performed to access the underlying
spinal cord. The animals were subsequently secured in a stereotaxic frame (Transvertex, AB). The
vertebra at T2 was clamped to stabilize the upper cervical cord. By adjusting the height of the head
holder, the angle of the upper cervical cord was aligned with the horizontal plane. The spinal

37
accessory nerves innervating the left and right trapezius neck muscle were isolated and positioned
on bipolar stimulating electrodes. The animals were paralyzed with gallaminetriethiodide (2.5-5.0
mg/kg/hour) and artificially respired to maintain end tidal CO2 between 3.7-4.5% as measured
with a medical gas analyzer (LB-2 Beckman). A bilateral pneumothorax was performed to reduce
respiratory-related movement of the spinal cord. The dura and pia mater were removed to facilitate
insertion of the microelectrode into the exposed dorsal surface of the spinal cord.
5.2 Motoneuron identification and intracellular injections
Intracellular recordings were obtained with sharp glass micropipettes broken to yield tip
diameters ranging from 1.5-2.0 µm. The micropipettes were filled with 12% Neurobiotin™ (Vector
Laboratories) in 0.5 M KCL and 0.1 M Trizma buffer (pH 8.2). After advancing the micropipette
several 100 μm, the electrode resistance varied from 9-15 MΩ. To prevent leakage of the positively
charged Neurobiotin, a negative holding current of 5 nA was passed through the microelectrode
while searching for trapezius motoneurons. Trapezius motoneurons in C2 to C4 were
antidromically identified by stimulating the spinal accessory nerve that innervates all three heads
of the trapezius muscle (0.1 ms duration, 2.0-5.0 V). The extracellular field potentials evoked by
antidromic stimulation were used to guide the microelectrode towards the spinal accessory nucleus
where trapezius motoneurons are located (Holomanova et al., 1972; Rapoport, 1978; Keane and
Richmond, 1981; Vanner and Rose, 1984). Advancing the microelectrode in steps of 16-20 µm in
regions with large field potentials often resulted in the impalement of a trapezius motoneuron.
Trapezius motoneurons were injected with Neurobiotin by passing positive current pulses
(450ms at 2 Hz) of 6-10 nA for 3.5-5min. The total charge delivered varied from 10.8-36.9nA∙min.
To minimize overlap of dendritic trees from adjacent trapezius motoneurons, each Neurobiotin-
filled motoneuron was separated by a minimum of 3 to 4 mm. At least one hour was allowed to

38
elapse between intracellular injection and fixation to provide sufficient time for the transport of
Neurobiotin through the motoneuron dendritic tree.
5.3 Perfusion and fixation
Several minutes prior to perfusion, animals were intravenously administered heparin (5
ml) and euthanized with a lethal dose of sodium pentobarbital (3 ml). Animals were subsequently
perfused through the thoracic aorta with 1 liter of saline followed with 1 to 2 liters of fixative (4%
paraformaldehyde in 0.1 sodium phosphate buffer (pH 7.4)). The upper cervical spinal cord was
removed and stored overnight (5-9 hours) at 4°C in 100 ml of the fixative. The tissue was
subsequently stored in 15% sucrose in 0.1 M sodium phosphate buffer for a minimum of 3 days.
This sucrose solution removes water from the tissue through osmosis thus minimizing freezing
artefact when the tissue is cut with the freezing microtome.
5.4 Histological processing and visualization of HCN1 and Neurobiotin
The block of spinal cord containing the Neurobiotin-filled motoneurons was cut into 50 µm
thick serial sections in the horizontal plan using a freezing microtome (LeitzWetzlar Germany;
Model 44011). The tissue sections were rinsed with 0.1 M sodium phosphate buffer and incubated
in 1% sodium borohydride in 0.05M KPBS for 25 minutes to reduce tissue autofluorescence arising
from the fixative (Clancy and Cauller 1998). This was followed with incubation in 0.3% hydrogen
peroxide in 0.05M KPBS for 30 minutes to quench the endogenous peroxidases present in the
tissue. After appropriate rinsing, the sections were incubated in 10% goat serum and 0.4% Triton-
X-100 in 0.05M KPBS pH 7.4 overnight at 4˚C. The goat serum blocks non-specific interactions
between the tissue and the constant (Fc) region of the secondary antibody. Triton-X-100, a
detergent, disrupts the cell membrane thereby improving penetration of the anti-HCN1 primary
antibody, horse radish peroxidase (HRP) conjugated secondary antibody, Cy3 conjugated

39
tyramideandStrept-Avidin DyLight649 conjugate (Jackson ImmunoResearch Laboratories Inc.,
West Grove, PA, USA).
To stain for the HCN1 subunit, tissue sections were incubated for 48 hours in a well
characterized mouse monoclonal anti-HCN1 IgG1 antibody (1:5000, clone #N70/28,LOT#: 444-
1LC-69, NeuroMab Antibodies Inc., Davis, CA, USA) in 0.05M KPBS and 0.5% goat serum at 4˚C.
Sections were then incubated with a HRP conjugated goat anti-mouse IgG1 (1:1000; C#: 115-035-
205, LOT#: 88198, Jackson ImmunoResearch Laboratories Inc., West Grove, PA, USA) for 2 hours at
room temperature in 0.05M KPBS and 0.4% Triton-X-100. This was followed by incubation in the
Cy3 conjugated tyramide reagent (1:50; Perkin Elmer, Waltham, MA, USA) for 9 mins at room
temperature. Compared to using a Cy3 conjugated secondary antibody alone, the intensity of the
Cy3 fluorescence was greatly enhanced by the covalent binding of HRP-activated tyramide
molecules to sites where the primary-secondary antibody complex is bound. This reaction serves to
further amplify the immunofluorescent staining of HCN1 (Bobrow et al., 1992; Adams, 1992;
Shindler and Roth, 1996)(see Figure 5.1 left).
Neurobiotin was visualized by incubating the tissue sections in a Strept-AvidinDylight649
conjugate (1:100; C#: 016-490-084, Jackson ImmunoResearch Laboratories Inc., West Grove, PA,
USA) in 0.05 M KPBS and 0.4% Triton-X-100 for 3 hours at room temperature with constant
agitation (see Figure 5.1 right). After appropriate rinsing, the tissue sections were mounted on
subbed slides with Vectashield® (Vector Laboratories, Burlingame, CA) aqueous mounting
medium.

40
Figure 5.1Methods used to label HCN1 and Neurobiotin. The HCN1 subunit was stained by the covalent binding of tyramide molecules to sites where the primary-secondary antibody complex is bound. Tyramide is converted to a reactive intermediate by the peroxidase and is conjugated to the Cy3 fluorochrome. Neurobiotin was stained using a Strept-Avidin DyLight649 conjugate.
5.5 Specificity of antibody
Themouse monoclonal IgG1 antibody (clone #N70/28) used in the present study was raised
against amino acid residues 778-910 (cytoplasmic C-terminus) of rat HCN1. The antibody satisfies
the gold standard test of specificity by producing noimmunolabeling in HCN1 knockout mice (data
provided by NeuroMab) (see Figure 5.2). The antibody stains a single band of approximately 100
kDa molecular weight on Western blot using membrane fractions prepared from the adult rat and
mouse brain. This band corresponds to the molecular weight of the HCN1 subunit.
Figure 5.2 Western blot using membrane preparations from the adult rat brain (RBM) and adult mouse brain (MBM). The mouse monoclonal IgG1 antibody stains a single band approximately 100 kDa that corresponds to the molecular weight of HCN1 in the rat and wild-type mouse. The band is absent in the HCN1 knockout mouse. (data provided by NeuroMab).

41
To establish a similar level of confidence in the specificity of the antibody for HCN1 in the
adult feline, a battery of tests were conducted. The antibody produced a similar pattern of
immunoreactivity in the cervical spinal cord from the rat and feline cut in the transverse plane (see
Figure 5.3). Notably, immunoreactivity associated with the somatic and dendritic membrane of
motoneurons in the medial and lateral regions of the ventral horn was observed in both the rat and
feline (see Figure 5.3 A3 (rat) and B3 (feline)). These motoneurons were identified by the presence
of choline acetyltransferase (ChAT). Moreover, these observations were consistent with previous
descriptions of the HCN1 immunoreactivity in the spinal cord where an antibody raised against a
different part of the HCN1 subunit was used (Milligan et al., 2006).
Furthermore, the same pattern of immunoreactivity in the rat and feline spinal cord was
produced by an antibody directed to a different epitope of the HCN1 subunit (see Figure 5.3 A1
(rat) and B1 (feline)). This rabbit polyclonal antibody (C#: APC-056, LOT#: AN-09, Alomone Labs,
Ltd., Jerusalem, Israel) was raised against a synthetic peptide corresponding to amino acid residues
6-24 (cytoplasmic N-terminus) of rat HCN1. The immunoreactivity disappears when the rabbit
antibody was preadsorbed with the control antigenic peptide (C#: APC-056, LOT#: AG-04, Alomone
Labs, Ltd., Jerusalem, Israel) (see Figure 5.3 A2 (rat) and B2 feline)).
Figure 5.3. HCN1 immunoreactivity in the (A) medial and (B) lateral regions of the ventral horn in transverse spinal cord sections from the rat (top row) and feline (bottom row) viewed under an epifluorescence light microscope using a 40x objective. (A1 and B1) Immunoreactivity is associated with the somatic and dendritic membrane of motoneurons in both the rat (A1) and feline (B1) using a rabbit polyclonal antibody directed against a different non-overlapping region of the HCN1 subunit. (A2 and B2) The immunoreactivity disappears when the rabbit antibody is pre-incubated with the control antigenic peptide. (A3 and B3) Same pattern of immunoreactivity is observed in the rat (A3) and feline (B3) using the mouse monoclonal IgG1 antibody.

42
Lastly, the mouse monoclonal IgG1 antibody and the rabbit polyclonal antibody both
produced the same regional distribution of HCN1 immunoreactivity across pyramidal neurons in
the rat neocortex (see Figure 5.4 A1 and A2). Strong HCN1 immunoreactivity was present on the
apical dendrites of pyramidal neurons that increased in intensity with distance from the soma
(white arrow). The intensity of HCN1 immunoreactivity was highest on the distal tuft dendrites
(white crossed arrow). In comparison, HCN1 immunoreactivity was not detected on the soma and
proximal dendrites of pyramidal neurons. This pattern of staining matches previous descriptions of
the HCN1 immunoreactivity in rat neocortex using a guinea pig polyclonal antibody recognizing
amino acid residues 850-910 (cytoplasmic C-terminus) of rat HCN1 (Lorincz et al., 2002). Thus,
these sets of observations confirm that the mouse monoclonal IgG1 antibody is (1) specific for the
HCN1 subunit and (2) is cross-reactive in the adult feline.
Figure 5.4HCN1 immunoreactivity in the (A) neocortex of transverse brain sections from the rat viewed under an epifluorescence light microscope using a 20x objective. (A1) HCN1 immunoreactivity using the rabbit polyclonal antibody. (A2) HCN1 immunoreactivity using the mouse monoclonal IgG1 antibody. The intensity of staining was strong on the apical dendrites (white arrow) and highest on the distal tuft dendrites (white crossed arrow) of pyramidal neurons.

43
5.6 Visualization of Neurobiotin and HCN1
Tissue sections containing Neurobiotin-filled motoneurons were initially examined using
standard epifluorescence with appropriate bandpass excitation and emission filters (Chroma
Technology Corp., VT, USA) on an Olympus BX60 microscope. These observations were used to
assess the quality of the staining of HCN1 (e.g. signal to background labelling) and identify
intracellularly stained cells for further examination using confocal microscopy. Only motoneurons
that met the following criteria were selected for further study: 1) the ratio of signal to background
labelling of HCN1in the tissue section was high and 2) small diameter distal dendrites more than
1500 μm rostral or caudal to the soma were easily visualized using a X40 objective.
A Carl Zeiss LSM 710 NLO Laser Scanning Confocal microscope equipped with a 63x oil
immersion DIC objective (Plan-Apochromat, NA 1.4, pixel size = 0.219 µm x 0.219 µm) was used to
collect images of HCN1 immunoreactivity and stained dendrites. Tissue sections were scanned
from top to bottom to yield stacks of 0.4 µm thick optical sections. Ten to sixteen stacks of optical
sections, 224.7 µm x 224.7 µm in the x and y axis, containing dendrites at different rostral and/or
caudal distances from the soma were collected from one to two serial sections for each
motoneuron. One or more of these sections contained the soma.
The Dylight649 and Cy3 were excited with 633 nm and 543 nm helium-neon lasers,
respectively. Light from each fluorochrome was separated using a dichroic mirror. Cross-talk
between the channels was minimized by setting appropriate cut-off wavelengths for the Dylight649
and Cy3 emission filters. Acquisition settings (laser power, detector gain, digital offset, pinhole size)
were identical for all stacks of optical sections.
44
5.7 Reconstruction of motoneuron dendritic trees
All trapezius motoneurons were reconstructed with the aid of an Olympus BX60 microscope
equipped with a digital monochromatic camera (QImagingRetigaEXi Fast 1394) and Neurolucida
(V9.03; Microbrightfield Inc., Williston, Vt, USA) neuron tracing software. Image stacks of regions
containing dendrites from each motoneuron were collected using the Dylight649 filter (Olympus
UPlanFl 40x objective, NA 0.75 dry, pixel size = 0.32 µm x 0.32 µm) and tiled. In order to capture all
of the dendrites on a single tissue section, image stacks from up to fifteen regions were acquired.
After the images were taken, the trajectories of the dendrites were traced by placing a series of
connected points along each dendritic segment. Each point has an associated diameter that
corresponds to the diameter of the dendrite at that location. The dendritic segments that were
connected to the dendritic segments examined under the confocal microscope were followed from
section to section until each dendritic segment examined under the confocal microscope was linked
to the soma. Calculations of the distance to the soma were corrected for tissue shrinkage along the
z-axis.

45
Chapter 6.Results
Part I: Quantitative measurements of the distribution and density of membrane-associated
proteins on dendrites of intracellularly labeled neurons using confocal microscopy in
conjunction with three dimensional image analysis and reconstructions of neuronal
morphology
6.1 Absorption and scattering of excitation and emission light
Light distortion is a problem inherent to confocal microscopy. When a specimen is optically
sectioned to produce a stack of images, the captured fluorescence intensities decline with depth
dueto the absorption and scattering of both the excitation and emission light. The loss of intensity is
readily apparent using confocal microscopy in the epi-fluorescence mode where the objective
serves both to pass excitation light onto the specimen and focus emitted light back to the light
detector. As the excitation light leaves the objective to reach the deeper layers of the specimen,
some of the light is absorbed and scattered in the specimen during travel. This attenuation of the
excitation light will result in less fluorescence emitted from the deeper layers. Furthermore, some
of the emitted light will be lost in the specimen on its return to the objective.
Consequently, optical sections taken from the bottom of the tissue section will appear
darker with some loss of detail compared to optical sections taken from the surface of the tissue
section (See Figure6.1A-D). Thus, accurate quantitative analysis of the fluorescence intensity of
images taken at different tissue depths is not possible without compensating for the absorption and
scattering of light by the tissue. In the presence of light attenuation, the fluorescence intensity with
depth can be described empirically by an exponential decay function (Rigaut and Vassy, 1991;
Rigaut et al., 1996; Conchello, 1995; Kervrann et al., 2004) (see equation 1.14),

46
𝐼𝐼(𝑧𝑧) = 𝐼𝐼𝑜𝑜 𝑒𝑒−𝑏𝑏𝑧𝑧 + 𝑘𝑘 (1.14)
whereI(z) is the mean fluorescence intensity of sequential optical sections as a function of z, z is the
distance from the surface, b is the extinction coefficient, Io is the mean fluorescence intensity of the
optical section at the surface, and k is a constant representing the minimum fluorescence intensity.
Figure 6.1E shows an example of the decay in fluorescence intensity associated with the
HCN1 immunoreactivity in the white matter of the spinal cord. This region was selected because
there is little variation in the distribution of HCN1 in the x, y, and z planes. In addition, the thickness
of the tissue section used in the example was deliberately reduced from the standard thickness of
50 µm to minimize uneven antibody penetration, which is discussed below. Thus, all changes in the
intensity of fluorescence could be attributed to absorption and scattering of light by the tissue. As
indicated by the high correlation coefficient (r2 = 0.99), these changes were precisely predicted by
equation 1.14.
Figure 6.1(A – D) Optical sections of the immunofluorescent HCN1 staining in the white matter of the spinal cord. The fluorescence intensities of optical sections in deeper layers are weaker than optical sections near the surface of the tissue. (E) The loss of intensity with depth can be described empirically by an exponential decay function.

47
6.2 Penetration of antibodies
The penetration of antibodies into fixed tissue is an inherent problem of
immunohistochemistry. The fixation process produces extensive crosslinking between proteins due
to the formation of covalent bonds between adjacent amine-containing groups. This creates a
compact protein network that impedes the penetration of antibodies. As a result, the speed and
depth of antibody penetration are inversely related to the degree of fixationand thickness of the
tissue.
Despite post-fixation treatment with reagents to reduce protein crosslinking and the use of
permeabilizing detergents, the limited ability of antibodies to reach the middle of the tissue section
may reduce the fluorescence intensity of optical sections located midway between the top and
bottom of the tissue section. If not accounted for, the decrease in fluorescence will be attributed
incorrectly to less HCN1 immunoreactivity. In the absence of absorption and scattering of light by
the tissue, the fluorescence intensity as a function of z should follow a parabolic curve where the
intensity is highest at the top and bottom surface and lowest at the center of the tissue (see
Figure6.2).
Figure 6.2 In the absence of light attenuation, the uneven penetration of antibodies results in higher fluorescence intensities in optical sections near the top and bottom surface of the tissue section and lower intensities in optical sections near the tissue center. This variation in fluorescence intensity along the thickness of the tissue section can be described by a parabolic function.

48
6.3 Compensating for light attenuation and antibody penetration
The loss of fluorescence intensity due to absorption and scattering of light and limited
antibody penetration, floss, with depth, z, can be described by the combination of an exponential
decay (representing the loss due to absorption and scattering of light) and a parabolic function
(representing the loss due to limited antibody penetration), such that:
𝑓𝑓𝑙𝑙𝑜𝑜𝑙𝑙𝑙𝑙 (𝑧𝑧) = 𝐴𝐴𝑒𝑒−𝑏𝑏𝑧𝑧 + 𝑐𝑐𝑧𝑧2 + 𝑑𝑑𝑧𝑧 + 𝑘𝑘 (1.15)
Figure 3G1 shows the mean HCN1 fluorescence intensity of each optical section as a
function of z in a region of the spinal accessory nucleus containing an intracellularly stained
trapezius motoneuron. These data were precisely matched by the relationship described by
Equation 1.15 (for this example r2 = 0.99). For all tissue sections examined r2 was always greater
than 0.92. We therefore determined the values of the parameters in equation 1.15 (A, b, c, d, k) for
each tissue section and used equation 1.16 to estimate the mean HCN1 fluorescence intensity for
each optical section in the absence of light absorption and scattering and limited antibody
penetration. All voxels of each optical section were assumed to suffer the same loss of fluorescent
intensity.
The optical section at the top surface of the tissue was selected as the reference section
since the effect of light attenuation and antibody penetration are kept to a minimum (depth ≈ 0).
The mean HCN1 fluorescence intensity for each optical section was calculated with respect to the
reference section. The ratio of the mean HCN1 fluorescence intensity of the reference section, Io, to
the fluorescence intensity predicted at a given optical section due to light absorption and scattering
and antibody penetration, Iofloss(z), was used as a correction factor to compensate for the intensity
lost in that optical section. The observed fluorescence intensity of each voxel belonging to the
optical section was multiplied by the correction factor for that optical section (see equation 1.16and

49
Figure6.3). This is described below where Iobserved[x, y, z] and Icorrected[x, y, z] denote the observed and
corrected fluorescence intensity of the (x, y)th voxel in optical section z.
𝐼𝐼𝑐𝑐𝑜𝑜𝑟𝑟𝑟𝑟𝑒𝑒𝑐𝑐𝑡𝑡𝑒𝑒𝑑𝑑 [𝑥𝑥,𝑦𝑦, 𝑧𝑧] = 𝐼𝐼𝑜𝑜
𝐼𝐼𝑜𝑜𝑓𝑓𝑙𝑙𝑜𝑜𝑙𝑙𝑙𝑙 (𝑧𝑧) . 𝐼𝐼𝑜𝑜𝑏𝑏𝑙𝑙𝑒𝑒𝑟𝑟𝑜𝑜𝑒𝑒𝑑𝑑 [𝑥𝑥,𝑦𝑦, 𝑧𝑧] (1.16)
Figure 6.3 (A1 – F1) Optical sections located at different depths, which capture the HCN1 immunofluorescent staining of the soma and proximal dendrites of a trapezius motoneuron. (A2 – F2) The corresponding optical sections after compensating for the loss of fluorescence intensity due to light attenuation and uneven antibody penetration. (G1) The function f(z) describing the extent of intensity loss (black line) is fitted to the observed mean HCN1 intensity plotted against depth (open red circle). (G2) Corrected mean intensity plotted against depth (solid red circle).

50
6.4 HCN1 immunoreactivity in the ventral horn
Previous studies have reported the expression of HCN1 mRNA in the ventral horn of the
spinal cord and HCN1 immunoreactivity has been detected on the somatic and proximal dendritic
membranes of motoneurons (Santoro et al., 2000; Milligan et al., 2006). Consistent with these
observations, the mouse anti-HCN1 monoclonal antibody stained neuronsin the ventral horn (See
Figure 6.4A1 & B1). This staining was largely attributed to labelling of somatic and dendritic
processes belonging to motoneurons, which wereidentified by their immunoreactivity to choline
acetyltransferase (ChAT) (see Figure6.4A2 & B2). However, labelling of HCN1 was absent on the
soma and proximal dendrites of some motoneurons suggesting that HCN1 is either absent or the
amount of HCN1 expressed in these regions is below the detection limit of the assay (see Figure
6.4D). These motoneurons may be γ-motoneurons due to their small somatic diameter. These
observations match previous descriptions of HCN1 immunoreactivity across motoneurons in the
ventral horn (Milligan et al., 2006).
Figure 6.4 (A1-A2) HCN1 and ChATimmunoreactivity in the cervical spinal cord at low magnification. (B1-B2) Higher magnification of HCN1 and ChATimmunoreactivity in the ventral horn. (C) ChAT-positive motoneurons containing HCN1 immunoreactivity. (D) HCN1 immunoreactivity was not detected on some motoneurons immunoreactive for ChAT.

51
6.5 Distribution of HCN1 immunoreactivitywithin the spinal accessory nucleus and on
trapezius motoneurons
In the spinal accessory nucleus, the HCN1 immunoreactivitytended to outline the soma and
proximal dendrites of trapezius motoneurons (see Figure6.5A & B). In sections where motoneuron
dendrites could be traced distally within the plane of the section, HCN1 immunoreactivity could be
detected on dendrites several hundred µm from the soma. However, the intensity of labelling on the
soma and proximal dendrites varied among trapezius motoneurons with large somata suggesting
differences in HCN1 between alpha motoneurons. In the surrounding neuropil, the HCN1
immunoreactivity also outlined the circumference of dendritic processes cut perpendicular to the
plane of the section.
Higher magnifications revealed that the HCN1 immunoreactivity was punctate and
organized into clusters ranging in size from 0.5 – 3.0 µm2(see Figure 6.6B). Some of the HCN1
clusters werearranged along the perimeter of the soma and proximal dendrites as defined by the
edge of the intracellular stain (see Figure 6.6C). These clusters are most likely associated with the
Figure 6.5 (A) Single optical section containing the soma of a trapezius motoneuron (white arrow) and dendritic processes oriented perpendicular to the plane of the section (white crossed arrow) that are immunoreactive for HCN1. (B) Single optical section containing proximal dendrites of trapezius motoneurons that immunoreactive for HCN1 (white arrow).
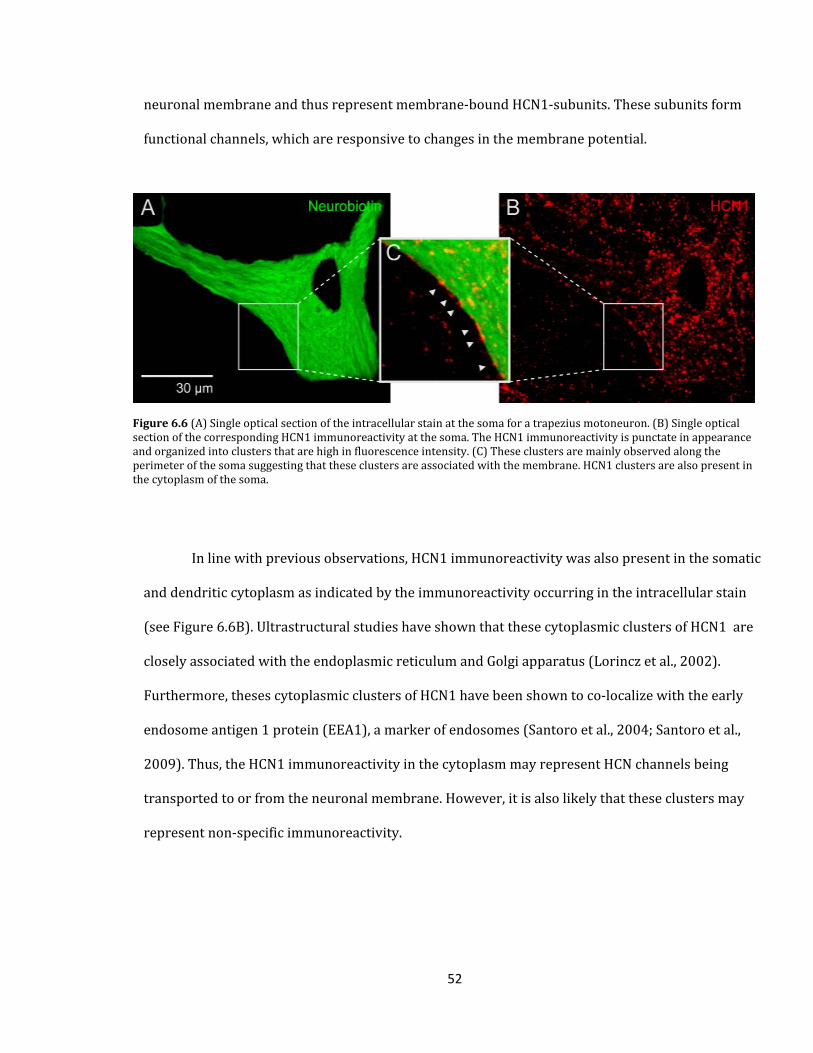
52
neuronal membrane and thus represent membrane-bound HCN1-subunits. These subunits form
functional channels, which are responsive to changes in the membrane potential.
In line with previous observations, HCN1 immunoreactivity was also present in the somatic
and dendritic cytoplasm as indicated by the immunoreactivity occurring in the intracellular stain
(see Figure 6.6B). Ultrastructural studies have shown that these cytoplasmic clusters of HCN1 are
closely associated with the endoplasmic reticulum and Golgi apparatus (Lorincz et al., 2002).
Furthermore, theses cytoplasmic clusters of HCN1 have been shown to co-localize with the early
endosome antigen 1 protein (EEA1), a marker of endosomes (Santoro et al., 2004; Santoro et al.,
2009). Thus, the HCN1 immunoreactivity in the cytoplasm may represent HCN channels being
transported to or from the neuronal membrane. However, it is also likely that these clusters may
represent non-specific immunoreactivity.
Figure 6.6 (A) Single optical section of the intracellular stain at the soma for a trapezius motoneuron. (B) Single optical section of the corresponding HCN1 immunoreactivity at the soma. The HCN1 immunoreactivity is punctate in appearance and organized into clusters that are high in fluorescence intensity. (C) These clusters are mainly observed along the perimeter of the soma suggesting that these clusters are associated with the membrane. HCN1 clusters are also present in the cytoplasm of the soma.

53
6.6 Registration of selected dendritic segments observed using confocal microscopy with
reconstructions of the dendritic tree based on epi-fluorescence observations
The morphology of the dendritic tree of stained trapezius motoneurons was visualized
using a standard epi-fluorescence microscope under the appropriate DyLight649 bandpass
excitation and emission filters (Olympus BX60, 20x/0.50 NA objective).To obtain a quantitative
description of the dendritic distribution of HCN1, segments of stained dendrites (40 - 60 µm in
length) at different distances from the soma and the corresponding HCN1 immunoreactivitywere
collected as stacks of optical sections using confocal microscopy. Dendritic segments were sampled
predominantly from dendrites projecting rostrally and caudally since the dendritic tree of trapezius
motoneurons located between mid C2 and C4 are fusiform in shape with the majority of dendrites
oriented in the rostrocaudal direction (see Figure 6.7) (Vanner and Rose, 1984; Rose et al., 1985).
The distance of each dendritic segment from the soma was determined from detailed
reconstructions of the dendritic tree whereby the dendrites on each serial section were traced and
converted into a series of XYZ coordinates with corresponding diameters (Rose and Cushing, 2004).
Each dendritic segment examined under the confocal microscope was linked to the soma by
connecting these points.

54
Figure 6.7 (Left) A stained trapezius motoneuron from a horizontal tissue section captured using a standard epi-fluorescence microscope under the appropriate DyLight649 bandpass excitation and emission filters. Each boxed area corresponds to a dendritic region where the HCN1 immunoreactivity and stained dendrites were collected into stacks of optical sections using confocal microscopy. (Right) Optical sections of the HCN1 immunoreactivity and intracellular stain at the soma and various dendritic regions.

55
6.7 Extracting membrane-associated HCN1 immunoreactivity
As shown in Figure 6.8, the membrane-associated HCN1immunoreactivityoccurs in a small
region less than 1 µm wide at the edge of the intracellular stain where the fluorescence intensity of
the intracellular stain declines abruptly. In order to capture the membrane-associated HCN1
immunoreactivity, a threshold-based approach was used to detect the edge of the intracellular
stain.
As shown in Figure 6.9, the fluorescence intensity of the intracellular stain from all voxels
within each stack of images was bimodal. The peak at 100 arbitrary units invariably corresponded
to voxels that were located within intracellularly stained somata and dendrites. In contrast, the
lower intensity peak at 0 arbitrary units was always associated with voxels located outside
intracellularly stained somata and dendrites. The low fluorescence in these voxels was attributed to
background staining.
Figure 6.8 (A) Membrane-associated HCN1 immunoreactivity observed along the perimeter. (B) The fluorescence intensity of HCN1 and the intracellular stain plotted against distance along the line shown in (A), which crosses over a cluster of HCN1 immunoreactivity.

56
To determine the range of voxel intensities that corresponded to regions outside of the
intracellularly stained somata and dendrites, we measured the fluorescence intensity of all voxels
collected from 9-16 stacks of optical sections that did not contain any intracellularly stained
dendrites or somata (see Figure 6.9B). The majority of the voxels hadafluorescence intensity of
zero, however, a number of voxels had non-zerofluorescence intensities. These non-zero
fluorescence intensities were attributed to the Poisson noise inherent to the stochastic detection of
photons during image formation. The maximum voxel intensity of these image stacks was defined
as, Ithreshold, and was used to separate thetwomodes of fluorescence intensity. Due to variability in
histological processing, the range of background voxel intensities varied from cell to cell. Thus, a
separate Ithresholdwas applied to each trapezius motoneuron.
The voxels contained in stacks of optical sections containing intracellularly stained
dendrites and/or somata were separated into two non-overlapping sets. One set contained voxels
with intensities greater than Ithreshold and the other set contained voxels with intensities less than or
equal to Ithreshold. Voxels with intensities higher than Ithreshold were assigned a grey-level intensity of
Figure 6.9 (A) The number of voxels plotted against voxel intensity for a stack of optical sections containing the intracellular stain. (B) The number of voxels plotted against voxel intensity from 9-16 stacks of optical sections that did not contain any intracellularly stained dendrites or somata.

57
255 whereas voxels with intensities lower than or equal to Ithreshold were assigned a grey-level
intensity of 0. This resulted in a binary image stack containing two objects of different intensities.
The background was represented by the set of voxels with a grey-level intensity of 0 and the
intracellular stain was represented by the set of voxels with a grey-level intensity of 255. This
process was repeated for each dendritic segment.
6.8 Determination of the intracellular to extracellular boundary
For most dendritic segments, the application of Ithresholdproved to be a robust means of
partitioning the stack of optical sections into voxels belonging to the background and voxels
belonging to the intracellular stain. However, rigid application of a single, fixed Ithresholdled to
obviouserrors if the dendrite was either very strongly stained or weakly stained. The extent of
strongly stained dendrites was overestimated and the extent of weakly stained dendrites was
underestimated. Thus, all dendritic segments were subsequently visually inspected using ImagePro
Plus (MediaCypernetics, Silverspring, MD, USA)and the threshold manually adjusted to ensure that
the intracellular to extracellular boundary was correctly assigned.
6.9 Creation of a three-dimensional layer of voxels to capture the juxta-membrane region
The membrane-cytoplasmic border was defined by the perimeter of the volume containing
voxels that were assigned to the intracellular stain. To constrain the analysis of HCN1
immunoreactivity to within the juxta-membrane zone, the volume was expanded by 1 voxel in the x,
y and z planes and all interior voxels were removed except those adjacent to the perimeter. This
produced a two voxel (0.44 µm) wide layer that captures the region immediately adjacent to the
perimeter. This layer most likely contains the membrane. The HCN1 immunoreactivity located
within this layer was measured and was defined as membrane-associated HCN1 immunoreactivity.
The density of membrane-associated HCN1 immunoreactivity was determined by dividing the sum

58
of the fluorescence intensities observed within the membrane layer by the number of voxels
contained in the membrane layer. These steps are shown in Figure 6.10.
6.10 Independent confirmation of the accuracy of the membrane extraction technique
The accuracy of the method described above was validated by staining for gephyrin, an
anchor protein for GABA and glycinergic receptors, and KCC2, a chloride-potassium cotransporter.
Both of these membrane proteins produce similar staining patterns where the majority of the
immunoreactivity is concentrated around the perimeter of the motoneuron with little or no
cytoplasmic staining (see Figure 6.11 B1 & B2). This suggests that the immunoreactivity is localized
specifically to the neuronal membrane. To determine whether the membrane extraction technique
captures the gephyrin and KCC2 immunoreactivity outlining the soma and dendrites, the densities
of gephyrin and KCC2 fluorescence located within the juxta-membrane layer and adjacent
Figure 6.10 (A) Serial optical sections of the intracellularly stained dendritic segment were rendered into a 3-dimensional volume. (B) The stack of optical sections from (A) were partitioned into voxels belonging to the intracellular stain and voxels belonging to the background. (C) The volume containing voxels belonging to the intracellular stain in (B) was expanded by 1 voxel in the x, y and z planes. All interior voxels were removed except those adjacent to the perimeter. This produced a two voxel (0.44 µm) wide layer. (E) The HCN1 immunoreactivity from (D) that was located within the layer in (C) was considered for analysis.
59
extracellular and cytoplasmic layers were compared. The extracellular and cytoplasmic layers were
produced using the same method described above with the exception that the membrane-
cytoplasmic border was deliberately chosen 1 voxel away from the perimeter of the intracellular
stain into the exterior or interior.
As shown in Figure 6.11 E1 & E2 the mean density of KCC2 fluorescence from 8 dendritic
segments was significantly greater in the juxta-membrane layer (43 a.u./voxel ± 6 SEM) compared
to the adjacent extracellular layer (23 a.u./voxel ± 3 SEM) according to a student's test (P<0.05).
However, the density of KCC2 fluorescence in the juxta-membrane layer was not significantly
greater compared to the adjacent cytoplasmic layer (33 a.u./voxel ± 4 SEM). This finding is
consistent with the observation that the KCC2 immunoreactivity located along the perimeter of the
intracellular stain extends approximately 1 µm (4 voxels) into the interior of the intracellular stain
(see Figure 6.11 D1). Since the layer capturing the adjacent cytoplasmic region is restricted to two
voxels in width (0.44 µm), the likelihood of capturing membrane-associated KCC2
immunoreactivity in is high. A similar results were obtained for comparisons of gephyrin densities
between the juxta-membrane layer and adjacent extracellular and cytoplasmic layers. The mean
density of gephyrin fluorescence from 10 dendritic segments was significantly greater in the juxta-
membrane layer (5 a.u./voxel ± 0.5 SEM) compared to the adjacent extracellular layer (3 a.u./voxel
± 0.4 SEM) (P<0.05, student's t-test). The density of gephryin fluorescence in the juxta-membrane
layer was not significantly greater compared to the adjacent cytoplasmic layer (4 a.u./voxel ± 0.4
SEM). Similarly, the gephyrinimmunoreactivity near the perimenter of the intracellular stain
extends approximately 1 µm into the interior of the intracellular stain (see Figure 6.11 D2).

60
Figure 6.11 (A1-B1) An optical section of the intracellular stain and KCC2 immunoreacitivty at the soma. (C1) Enlarged view of the region shown in A1. (D1) The fluorescence intensity of KCC2 and the intracellular stain plotted against distance along the line shown in C1. (E1) The mean density of KCC2 fluorescence in the juxta-membrane region was significantly greater than the adjacent extracellular region (P<0.05, t-test) but was not significantly greater than the adjacent cytoplasmic region. Error bars represent SEM. (A2-B2) An optical section of the intracellular stain and gephyrinimmunoreacitivty at a proximal dendrite. (C2) Enlarged view of the region shown in A2. (D2) The fluorescence intensity of gephryin and the intracellular stain plotted against distance along the line shown in C2. (E2) The mean density ofgephyrin fluorescence in the juxta-membrane region was significantly greater than the adjacent extracellular region (P<0.05, t-test) but was not significantly greater than the adjacent cytoplasmic region. Error bars represent SEM.
61
Chapter 7 Part II: Proximal to distal gradients in the distribution of membrane-associated
HCN1 immunoreactivity on the dendritic trees of trapezius motoneurons
Ten trapezius motoneurons from six adult felines were stained and the densities of
membrane-associated HCN1immunoreactivity of dendritic segments at different distances from the
soma were compared. Between 25 and 92 dendritic segments were sampled for each trapezius
motoneuron using the membrane extraction technique. These ten trapezius motoneurons were
selected based on the quality of intracellular stain and the HCN1 staining. Dendritic segments were
selected based on the quality of the intracellular stain. Specifically, the entire volume of the
dendrite was uniformly stained by Neurobiotin and the segment of dendrite was not distorted by
histological sectioning and processing.
7.1 Some trapezius motoneuron display a uniform proximal to distal distribution of HCN1
The proximal to distal distribution of HCN1 across the dendritic tree for one of the ten
intracellularly stained trapezius motoneurons is shown in Figure 7.1A. The distance of each
dendritic segment from the soma is plotted against the density of membrane-associated HCN1
immunoreactivity of that segment. The locations of the 39 dendritic segments relative to the
location of all dendrites found within four adjacent tissue sections are shown in Figure 7.1B. The
density of membrane-associated HCN1 immunoreactivity was highly variable across dendritic
segments. The average density of membrane-associated HCN1 immunoreactivity within 0 - 200 µm
from the soma was 21 a.u./voxel ± 6 S.D. (n = 12), from 200 - 800 µm from the soma it was 32
a.u./voxel ± 7 S.D. (n = 9) and greater than 800 µm from the soma it was 25 a.u./voxel ± 7 S.D. (n =
18). A linear regression to the data demonstrated that HCN1 has a uniform distribution (slope = 0.1
a.u./voxel/1000 µm; not significantly different from zero, P>0.5 ANOVA) (see Figure 7.1).

62
The proximal to distal distribution of HCN1 was uniform on the dendrites of three of the ten
trapezius motoneurons examined. The slope of the relationship between distance and membrane-
associated HCN1 density for these motoneurons was not significantly different from zero. In order
to minimize the effect of variability in HCN1 labelling due to local differences in fixation and more
accurately compare data collected from different motoneurons, the densities of membrane-
associated HCN1 for each trapezius motoneuron were divided by the density of HCN1 in the tissue
section from which the dendritic segments were selected. The HCN1 density of the tissue section
Figure 7.1 Uniform proximal to distal distributionof HCN1on the dendrites of trapezius motoneurons.(A) The distance of each dendritic segment from the soma is plotted against the density of membrane-associated HCN1 fluorescence for that segment. The density of membrane-associated HCN1 fluorescence is also represented by different colours. Low fluorescence intensities are shown in blue and high fluorescence intensities are shown in red. (B) The locations of the dendritic segments (n=39) shown relative to the positions of other dendrites and the somata. (C1-C3) Membrane-associated HCN1 immunoreactivity from dendritic segments located at 0-200 µm, 200-800 µm, and >800µm from the soma.

63
was calculatedbased on the average density of HCN1 observed in all image stacks (224.7 µm x
224.7 µm in the x and y axes) containing stained dendrites. This served as a means of
normalization. Figure 7.2 compares the normalized densities of membrane-associated HCN1 for all
three motoneurons that had a uniform proximal to distal distribution of HCN1. Since the
normalized density of membrane-associated HCN1 is expressed as a ratio, a logarithmic scale is
used for the normalized densities whereby a value of 1 indicates that the density of HCN1 is equal
to the average density of HCN1 for the tissue section.
Figure 7.2 The distribution of HCN1 is uniform across the dendritic tree of three trapezius motoneurons. The distance of each dendritic segment from the soma is plotted against the normalized density of membrane-associated HCN1 fluorescence for that segment. The slopes of the relationship between distance and normalized density of membrane-associated HCN1 for these motoneurons were not significantly different from zero.

64
7.2 Some trapezius motoneurons display a proximal to distal graded increase in HCN1
The distribution of HCN1 across the dendritic tree of another trapezius motoneuron is
shown in Figure 7.3. For this cell, the density of membrane-associated HCN1 immunoreactivity
increased from 8 a.u./voxel at a distance of 119 µm from the soma to 16 a.u./voxel at a distance of
1301 µm from the soma. Overall, the density of membrane-associated HCN1
immunoreactivityincreased 7.9a.u./voxel/1000 µm (significantly different from zero; P<0.05
ANOVA).
Figure 7.3 Graded proximal to distal increase of HCN1 on the dendrites of trapezius motoneurons. (A) The distance of each dendritic segment is plotted against the density of membrane-associated HCN1 fluorescence for that segment. The density of membrane-associated HCN1 fluorescence is also represented by different colours. Low fluorescence intensities are shown in blue and high fluorescence intensities are shown in red. (B) The locations of the dendritic segments (n=35) shown relative to the positions of other dendrites and the somata. (C1-C3) Membrane-associated HCN1 immunoreactivity from dendritic segments located at 0-200 µm, 200-800 µm, and >800µm from the soma.
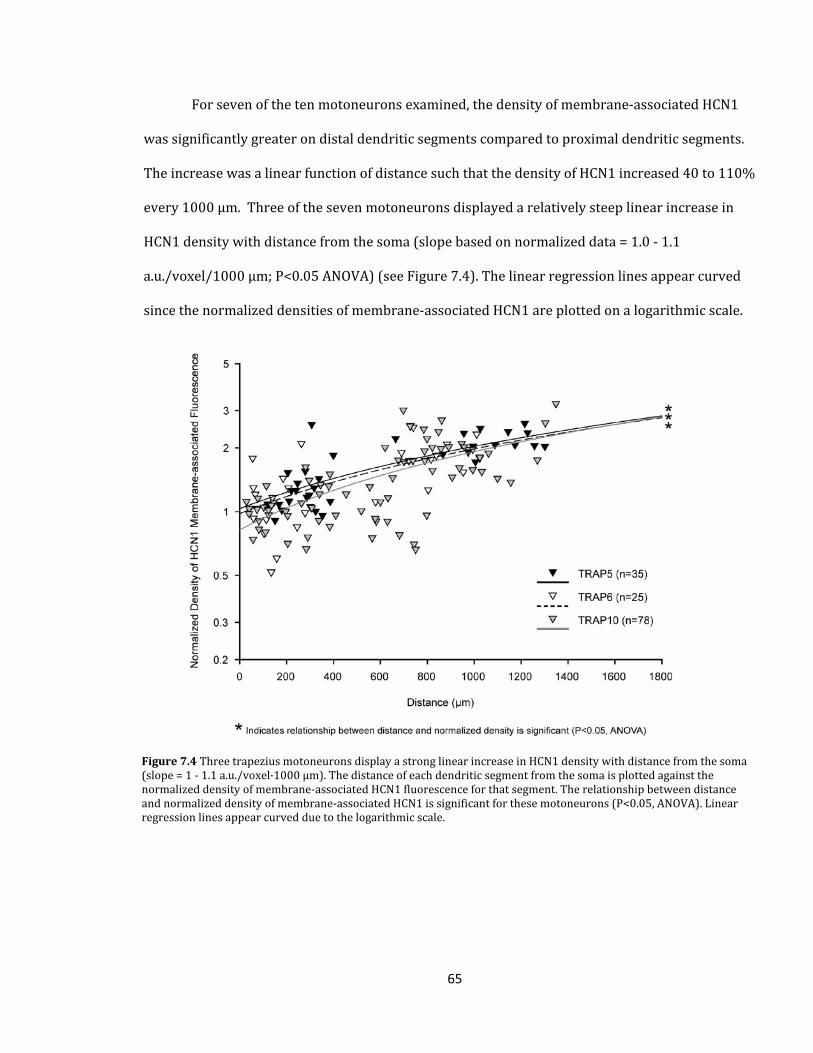
65
For seven of the ten motoneurons examined, the density of membrane-associated HCN1
was significantly greater on distal dendritic segments compared to proximal dendritic segments.
The increase was a linear function of distance such that the density of HCN1 increased 40 to 110%
every 1000 µm. Three of the seven motoneurons displayed a relatively steep linear increase in
HCN1 density with distance from the soma (slope based on normalized data = 1.0 - 1.1
a.u./voxel/1000 µm; P<0.05 ANOVA) (see Figure 7.4). The linear regression lines appear curved
since the normalized densities of membrane-associated HCN1 are plotted on a logarithmic scale.
Figure 7.4 Three trapezius motoneurons display a strong linear increase in HCN1 density with distance from the soma (slope = 1 - 1.1 a.u./voxel·1000 µm). The distance of each dendritic segment from the soma is plotted against the normalized density of membrane-associated HCN1 fluorescence for that segment. The relationship between distance and normalized density of membrane-associated HCN1 is significant for these motoneurons (P<0.05, ANOVA). Linear regression lines appear curved due to the logarithmic scale.
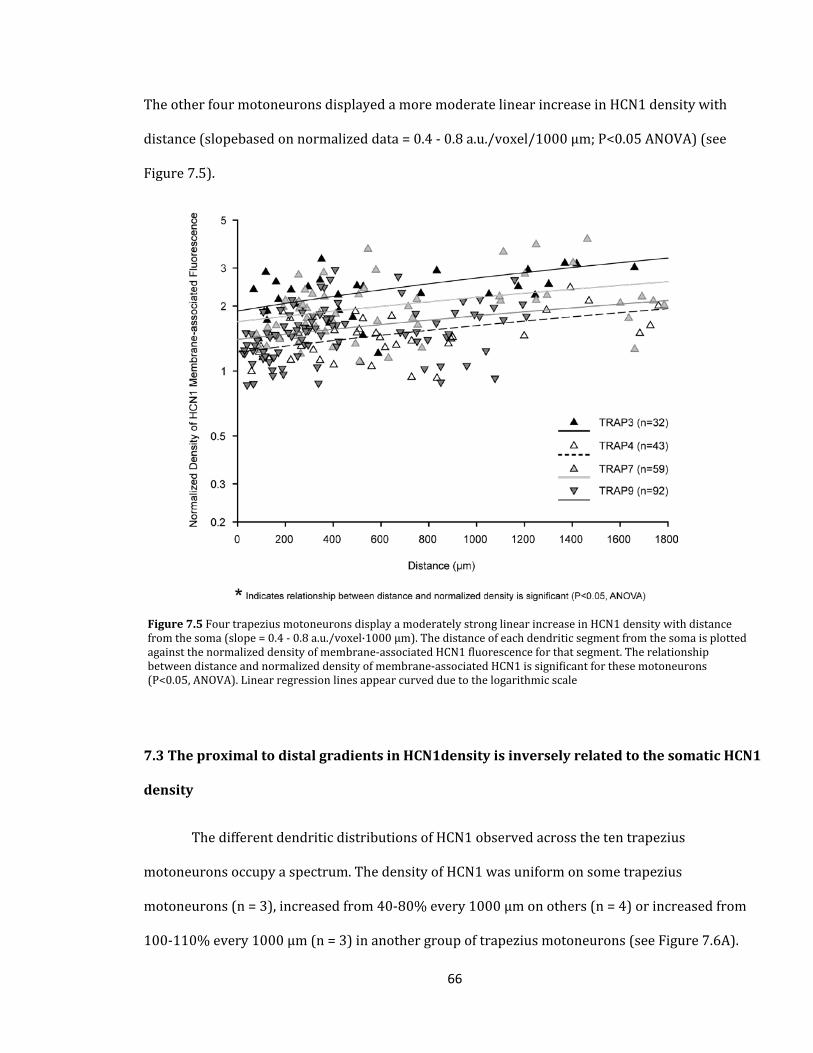
66
The other four motoneurons displayed a more moderate linear increase in HCN1 density with
distance (slopebased on normalized data = 0.4 - 0.8 a.u./voxel/1000 µm; P<0.05 ANOVA) (see
Figure 7.5).
7.3 The proximal to distal gradients in HCN1density is inversely related to the somatic HCN1
density
The different dendritic distributions of HCN1 observed across the ten trapezius
motoneurons occupy a spectrum. The density of HCN1 was uniform on some trapezius
motoneurons (n = 3), increased from 40-80% every 1000 µm on others (n = 4) or increased from
100-110% every 1000 µm (n = 3) in another group of trapezius motoneurons (see Figure 7.6A).
Figure 7.5 Four trapezius motoneurons display a moderately strong linear increase in HCN1 density with distance from the soma (slope = 0.4 - 0.8 a.u./voxel·1000 µm). The distance of each dendritic segment from the soma is plotted against the normalized density of membrane-associated HCN1 fluorescence for that segment. The relationship between distance and normalized density of membrane-associated HCN1 is significant for these motoneurons (P<0.05, ANOVA). Linear regression lines appear curved due to the logarithmic scale

67
This increase in HCN1 density with distance from the soma is inversely related to the HCN1 density
at the soma (represented by the y-intercept of the proximal to distal distance versusdensity
regression analysis) such that the largest proximal to distal gradients of HCN1 were observed on
trapezius motoneurons with low somatic densities of HCN1. In contrast, trapezius motoneurons
with a high somatic density of HCN1 displayed a uniform density of HCN1. This relationship was
significant (P<0.037 ANOVA) (see Figure 7.6B).
Figure 7.6 (A) The proximal to distal distribution of HCN1 across the ten trapezius motoneurons. The density of HCN1 is either uniform (n = 3; black), increases moderately with distance (n = 4; blue) or strongly increases with distance (n = 3; red). (B) The change in HCN1 density every 1000 µm is plotted against the normalized somatic density of HCN1. A significant negative relationship exists (P<0.05 ANOVA).

68
7.4 The proximal to distal gradient in HCN1density is inversely related to the estimated
input conductance of the motoneuron
Based on the mechanical response of the innervated muscle fibers, motor units can be
classified as slow twitch fatigue-resistant (S-type), fast twitch fatigue-resistant (FR-type) or fast
twitch fast fatiguing (FF-type) (Burke, 1967; Burke et al., 1973). Past studies have shown that
motor units differ on the basis of the input conductance of the motoneuron (Fleshman et al., 1981;
Burke et al., 1982; Zengel et al., 1985). S-type motoneurons have a low input conductance whereas
FR-type and FF-type motoneurons have higher input conductances. The input conductance of a
motoneuron is largely determined by the specific membrane resistivity of the dendritic tree and the
size and branching pattern of dendrites(Rall, 1977). If the specific membrane resistivity is known,
an accurate estimate of the input conductance of a motoneuron can be obtained by reconstructing
and measuring the geometry of the whole dendritic tree (Fleshman et al., 1988; Clements and
Redman, 1989).
Rall has shown that the electrical behavior of dendritic trees can be roughly approximated
by a simple uniform cylinder of finite length (Rall, 1959; Rall, 1977). For a uniform cylinder, the
input conductance is proportional to the 3/2 power of the dendritic stem diameter, which is
defined as the diameter of proximal dendrites measured at a distance of 40 µm from the soma-
dendrite border (Zwaagstra and Kernell, 1981; Kernell and Zwaastra, 1989). For each of the ten
trapezius motoneurons, the total input conductance was computed from the dendritic stem
diameters. In Figure 7.7A, the computed total input conductance of the motoneuron is plotted
against the change in HCN1 density every 1000 µm. A trend emerges whereby motoneurons
displaying a proximal to distal gradient of HCN1 had low input conductances whereas motoneurons
with a uniform density of HCN1 had high input conductances.To examine whether the proximal to

69
distal distribution of HCN1 was related to motor unit type, hierarchical and k-means clustering
analyses were performed to determine if among the 10 trapezius motoneurons two groups
emerged , which correspond to presumably S-type motoneruons or FR- and FF-type motoneurons.
The 10 trapezius motoneurons were organized into the two groupsaccording to the change in HCN1
density per 1000 µm and the computed total input conductance. As shown in Figure 7.7B, the 10
trapezius motoneurons could be segregated into two groups, one group containing the four
trapezius motoneuons shown in the top left of Figure 7.7A displaying a steep increase in HCN1
density with distance from the soma (slopes >= 0.8 a.u./voxel/1000 µm) and the other group
containing the rest. For the first group containing motoneurons that displayed a proximal to distal
gradient of HCN1, the density of HCN1 increased on average 1.0a.u./voxel/1000 µm and the
average total computed input conductance was 0.5µS. For the second group containing
motoneurons that displayed either a unifom or weak increase in HCN1 density with distance from
the soma, the density of HCN1 increased on average 0.3 a.u./voxel/1000 µm and the average total
computed input conductance was 0.7µS. These differences between the two groups were significant
(P<0.05 for both the average change in HCN1 density per 1000 µm and the average total computed
input conductance according to a Mann-Whitney-U test). Thus, motoneurons that displayed a
relatively steep proximal to distal increase in HCN1 density had a low total computed input
conductance and are presumably S-type motoneurons. On the other hand, motoneurons that
displayed a uniform or weak proximal to distal increase In HCN1 density had a higher total
computed input conductance and are presumably FR- or FF-type motoneurons.
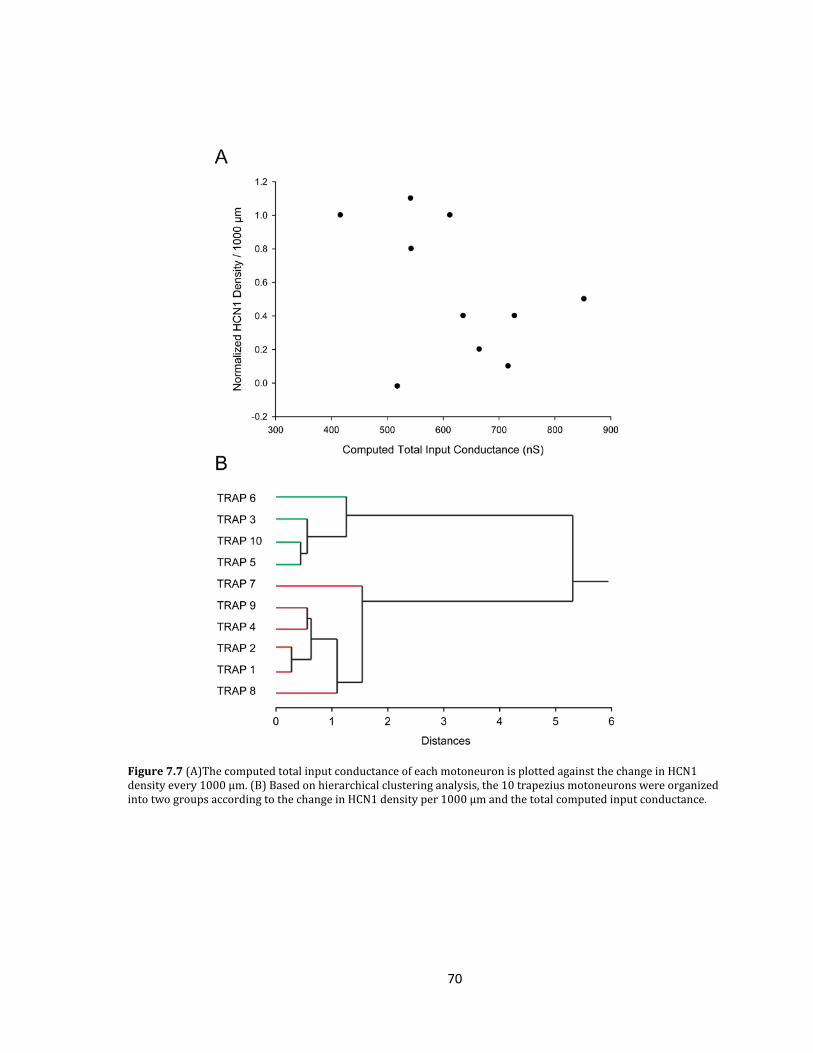
70
Figure 7.7 (A)The computed total input conductance of each motoneuron is plotted against the change in HCN1 density every 1000 µm. (B) Based on hierarchical clustering analysis, the 10 trapezius motoneurons were organized into two groups according to the change in HCN1 density per 1000 µm and the total computed input conductance.

71
Chapter 8. Discussion
The goals of this study were to develop a high throughput method for extracting the
membrane-associated density of voltage dependent channels on dendritesand subsequently to map
the proximal to distal distribution of channels formed by the HCN1-subunit on the dendritic tree of
trapezius motoneuons.The accuracy and robustness of the method were independently confirmed
by the staining of two other membrane proteins, gephyrin and KCC2. The proximal to distal
distribution of membrane-associated HCN1 immunoreactivity across the dendritic tree was either
uniform or increased with distance from the soma among trapezius motoneurons. The increase in
the density of HCN1 with distance from the soma was inversely related to the density of HCN1 on
the soma and proximal dendrites such that the largest proximal to distal gradients of HCN1 were
observed on trapezius motoneurons with a low proximal density of HCN1. In contrast, trapezius
motoneurons with a high proximal density of HCN1 displayed a uniform density of HCN1 across the
dendritic tree. Given this arrangement, it is possible that the average density of HCN1, definedasthe
total number of HCN1-subunit containing channels divided by the surface area of the motoneuron,
maybe the same among the two populations of trapezius motoneurons. Lastly, the distribution of
HCN1 was related to the total input conductance of motoneurons. There was an inverse
relationship between the change in HCN1 density with distance from the soma and the total input
conductance. Motoneurons displaying a prominent proximal to distal gradient of HCN1 had low
input conductances whereas motoneurons with a uniform density of HCN1 had high input
conductances. Past studies have shown that motor units differ based on the input conductance of
the motoneuron such that S-type motoneurons have low input conductances and FR-type and FF-
type motoneurons have higher input conductances. Thus, the differences in HCN1 distribution
across the motoneuron dendritic tree may be related to the type of motor unit.
72
8.1 The extraction of the membrane-associated density of voltage-dependent channels
The study of the membrane distribution of voltage-dependent channels currently employ
anatomical techniques such as freeze fractureelectron microscopy, immunogold electron
micoscopy, confocal microscopyor electrophysiological techniques such as dendritic patch clamp
recordings. The high spatial resolution provided by electron microscopy permits the visualization
of voltage-dependent channels directly on the membrane surface but offers a limited field of view
thus restricting the dendritic surface area that can be sampled. Dendritic patch clamp recordings
provide a direct measurement of the functional density of voltage-dependent channels and it is
possible to describe properties such as the voltage dependence and kinetics of the channels.
However, small dendrites at great distances from the soma remain inaccessible. Furthermore, the
number of dendritic recordings that can be performed on a single neuron is limited. In the present
study, we have developed a high throughput method for measuring the membrane-associated
density of voltage-dependent channels from many dendritic locations regardless of diameter on the
same neuron. This technique allows for a large scale sampling of the dendritic tree, which is
necessary to comprehensively map the distribution of voltage-dependent channels. The technique
is also not restricted to only the study of voltage-dependent channels. As evidenced by the
application of the technique on both gephyrin and KCC2 immunoreactivity, the technique is able to
extract the membrane-associated of any membrane bound protein. Thus, the distribution of anchor
proteins, receptors and transporters on the membrane can be determined using the membrane
extraction technique.
73
Limitations of the membrane extraction technique
8.2 The resolution in the z dimension is lower than the x and y: consequences of the
difference in resolution
In confocal microscopy, light is focused to illuminate a single point in the specimen. As the
beam of light is scanned point by point across the x, y and z planes of the specimen, a stack of
images is produced. However, the light emitted from an infinitely small point does not appear as an
infinitely small point in the captured image. Rather, the point appears as a larger spot due to the
diffraction of light. In the x- y plane, the spot is comprised of a central bright circular region
surrounded by a series of concentric bright and dark rings. In the x-z and y-z planes, the spot is
elliptical in shape. The dimensions of this spot, which are determined by the numerical aperture of
objective lens and the wavelength of the beam of light, define the lateral (x-y) and axial (z) resolving
limits of the lens system (Nathan et al., 1979). Since the spot is elongated along the z-axis, the axial
resolution is lower compared to the lateral resolution. This difference in resolution leads to an
elongation of features and greater loss of detail along the z-axis. In the present study, confocal
images were acquired using a 63x oil immersion objective with a numerical aperture of 1.4
resulting in lateral and axial resolutions of 0.22 µm and 0.40 µm, respectively. To avoid
overestimations of the membrane surface area when determining the density of membrane-
associated HCN1 immunoreactivity, densities were deliberately expressed as per voxel rather than
per µm3.
8.3 The juxta-membrane region invariably includes fluorescence from sources in the
neighboring cytoplasm and extracellular space
Studies have shown that the thickness of the neuronal membrane falls within the range of 4-
8 nm depending on the method of measurement (Stoeckenius, 1962; Huang and Thompson, 1965).
Given that the thickness of the juxta-membrane layer used to extract-membrane associated HCN1

74
immunoreactivity is approximately 0.44 µm in the x-y plane and 0.80 µm in the x-z and y-z planes, it
must be acknowledged that the juxta-membrane region captured by the membrane layer invariably
includes the fluorescence emitted from sources in the cytoplasm and extracellular space that are
closely apposed to the membrane. Thus, the diffraction-limited resolution of confocal microscopy
cannot resolve channel localization at the ultrastructural level, which can only be achieved with
electron microscopy.
8.4 The membrane-associated immunoreactivity extends beyond the bounds of the juxta-
membrane layer
Although it was demonstrated that the densities of gephyrin and KCC2 fluorescence were
significantly greater in the juxta-membrane layer compared to the adjacent extracellular layer, the
same was not true for the adjacent cytoplasmic layer. This was consistent with the observation that
the membrane-associated immunoreactivity of HCN1, gephyrin and KCC2 all extend approximately
1 µm or more from the edge of the intracellular stain towards the interior. This is not unexpected
given that the antibodies raised against these membrane proteins are directed towards epitopes
located on the intracellular surface of these proteins. Furthermore, given the finite size of the
primary-secondary antibody complex that has been reported to be approximately 14 nm in length,
the fluorochrome, which is the source of the fluorescence, may be located distant to the site of the
antigen (Ban et al., 1994). This may provide another reason as to why the observed membrane-
associated immunoreactivity expands approximately 1 µm into the interior. Studies using electron
microscopy have shown that the HCN1 immunogold particles associated with neuronal membrane
were mainly present on the cytoplasmic side of the membrane (Lorincz et al., 2002). Thus, it must
be acknowledged that although the immunoreactivity captured by the juxta-membrane layer is
membrane-associated, some of the immunoreactivity located along the perimeter of the
75
intracellular stain is excluded from the measurement. Since this occurs for all sampled dendritic
segments, the relative comparisons provided in this study remain valid.
8.5 A larger proportion of cytoplasmic immunoreactivity is captured by the juxta-membrane
layer in small diameter dendrites
As mentioned previously, the stacks of optical sections were collected using a lens system
that provided a spatial resolution of 0.22 µm and an axial resolution of 0.40 µm. Thus, the two voxel
(0.44 µm) wide juxta-membrane layer will inevitably capture the fluorescence from sources in the
adjacent extracellular and cytoplasmic compartments. This problem is more severe in small
diameter distal dendrites where the diameters can be less than 1 µm. Compared to large proximal
dendrites that can range from 8 - 12 µm in diameter, the juxta-membrane layer will include a larger
proportion of cytoplasmic HCN1 immunoreactivity in small diameter dendrites.This confound may
potentially skew the extacted membrane-associated density of HCN1.
Regulation of the anatomical and functional distribution of HCN channels
8.6 The anatomicaldistributionof HCN channels may be highly dynamic
Studies have examined the kinetics of HCN channel trafficking and their rapid regulation by
neuronal activity. Live imaging in cultured hippocampal neurons revealed that endogenous HCN1
subunit-containing channels resided in vesicle-like organelles that moved bi-directionally along the
length of the dendrite. This movement was arrested by the activation of ionotropic glutamate
receptors. At the same time, the membrane expression of HCN1subunit-containing channels
increased within minutes (Noam et al., 2010). Thus, the decreased longitudinal movement of HCN1
subunit-containing channels in the cytoplasm may result in their increased insertion into the
neuronal membrane. Similar findings for other proteins have been reported suggesting that the
mobility of vesicles containing membrane proteins is reduced upon vesicular insertion into the
76
membrane (Bezzerides et al., 2004; de Wit et al., 2009). This might be the result of the action of
anchoring complexes. Given these findings, it is possible that trapezius motoneurons displaying a
proximal to distal gradient of HCN1 receive a greater proportion of excitatory activity on distal
dendrites compared to proximal dendrites compared to trapezius motoneurons displaying a
uniform proximal to distal distribution of HCN1.
The increased membrane expression of HCN1 subunit-containing channels by neuronal
activity within a time scale of minutes suggests that the trafficking of these channels to the
membrane can be a rapid and dynamic process. This finding suggests that the distribution of HCN1
subunit-containing channels across the dendritic tree is highly variable and will change with
respect to time due to ongoing neuronal activity. Thus, the dendritic distributions of channels
formed by the HCN1 subunit reported in the present study may only reflect the distribution at a
given point in time. However, the changes in the membane expression of HCN1 subunit-containing
channels described above were based on a very small sample (n = 3) of dendritic segments that
were approximaley 35 µm in length. Furthermore, the observation ofseveralwell characterized
distributions of HCN channels across the dendritic tree suggests that the maintenance of specific
distributions may be critical to the function of the neuron. For instance, the increasing proximal to
distal gradient of HCN channels along the apical dendrite of hippocampal CA1 and layer 5
neocortical pyramidal neurons has been reported and independently confirmed by several studies
(Magee, 1998; Williams and Stuart, 2000; Berger et al., 2001; Lorincz et al., 2002; Kole et al., 2006).
In hippocampal CA1 neurons, perforant path synapses from the cortex selectively terminate on the
distal dendrites whereas schaffer collateral synapses from hippocampal CA3 neurons terminate on
more proximal dendrites. Studies have shown that an intact entorhinal cortex, which projects to
distal dendrites of hippocampal CA1 neurons is critical for the establishment and maintenance of a
distal dendritic enrichment of HCN1 (Shin and Chetkovich, 2007). Removal of the entorhinal cortex

77
lead to significant reductions in HCN1 density on distal dendrites resulting in a uniform distribution
of HCN1 across the dendritic tree.
Thus, the local membrane expression of HCN channels may be subject to rapid continuous
changes due to the changes in the activity of nearby synapses. This may provide an explanation for
the punctate organization of the HCN1 immunoreactivity whereby the flourescence intensity of
HCN1 was highly variable on a voxel by voxel basis. On the other hand, the maintenance of specific
distributions of HCN channels across the dendritic tree may be attributed to differences in synaptic
activity between different synaptic pathways. These sets of synapses may bearranged in a specific
pattern across the denditic tree that would give rise to a specific distribution of HCN channels. This
does not, however, exclude a different interpretation. The targeting of HCN channels to dendritic
regions may also be govened by the source of the synaptic input but this would require studying the
influence of different synaptic pathways on the membrane expression of HCN channels
independent of activity.
8.7 The functional distribution of HCN channels may be altered by cAMP-dependent
modulation
Studies have presented evidence of an increase in Ih activation upon stimulation of β-
adrenergic and serotonergic receptors (Bobker and Williams, 1989; Pape and McCormick, 1989).
This facilitation relies on a depolarizing shift of the voltage dependence of activation. The
intracellular messenger system mediating this response involves stimulation of adenylyl cyclase
and a resulting increase in intracellular cAMP levels (Pape and McCormick, 1989; McCormick and
Pape; 1990; Tokimasa and Akasu, 1990). The regulation of HCN channels by cAMP in motoneurons
likely involves the HCN2 subunit, either in a homotetrameric or heterotetrameric configuration,
since the HCN2 subunit is more sensitive to cAMP modulation compared to the HCN1 subunit. In a
recent study, the distributions of serotonin (5-HT) and noradrenaline (NA) synapses on neck

78
extensor motoneurons were investigated. 5-HT and NA synapses were found to be widely
distributed across the motoneuron dendritic tree with a strong bias to distal small diameter
dendrites (Montague et al., 2012). Given this finding, the functional distribution of HCN channels
may be altered in the presence of neuromodulators such a 5-HT and NA.Trapezius motoneurons
that may display a uniform density of Ih across the dendritic tree may have a higher density of Ih on
distal small diameter dendrites, which are more densely innervated by 5-HT and NA. Trapezius
motoneurons that may display a graded proximal to distal increase of Ih may exhibit a steeper
gradient in the presence of neuromodulators. However, the predominate 5-HT receptors on
motoneurons are the 5-HT2A, 5-HT2B, and 5-HT2C receptors, which are present on dendrites. These
receptors are coupled to the Gq/llα subunit, which activates a cAMP-independent signaling pathway
involving the production of inositol triphosphate (IP3) and diacylglycerol (DAG) (Bockaert et al.,
2006). Nonetheless, 5-HT has recently been shown to work through 5-HT7 receptors on
motoneurons, which are positively coupled to Gs α subunit leading to the production of cAMP
(Inoue et al., 2002). Pharmacological studies provide evidence that NA exerts its effects via the α1
NA receptor (Lee and Heckman, 1999; Harvey et al., 2006). Similar to 5-HT2 receptors, the α1 NA
receptor is linked to the Gq/llα subunit, which activates a cAMP-independent signaling pathway.
Functional consequences
8.8 The distribution of HCN1 may not reflect the distribution of all HCN channels
It must be mentioned that the HCN1 subunit is not the only subunit expressed in
motoneurons. Motoneurons also express the HCN2 subunit (Moosmang et al., 1999; Monteggia et
al., 2000; Santoro et al., 2000). It has been shown that HCN1 and HCN2 subunits can coassemble
into heterotetrameric channels that carry an Ih current with activation kinetics, steady-state voltage
dependence, and sensitivity to cAMP intermediate to that of homotetrameric HCN1 and HCN2
channels (Chen et al., 2001; Ulens and Tytgat, 2001). In hippocampal and thalamic neurons,

79
discrepancies between the activation kinetics of the Ih current native to these neurons and the
activation kinetics recorded from homotetrameric HCN1, HCN2, and HCN4 channels was attributed
to differences in the expression of these HCN subunit isoforms. The activation of the native Ih
current in hippocampal CA1 neurons occurred on a time scale that spanned between the activation
of HCN1 and HCN2 homotetrameric channels. In thalamic relay neurons, the native Ih current
activates on a time scale that spanned between the activation of HCN2 and HCN4 homotetrameric
channels (Santoro et al., 2000). Neither the kinetics, voltage-dependence and sensitivity to cAMP in
these cases could be reproduced by the linear sum of independent populations of HCN1, HCN2 and
HCN4 homotetrameric channels. In hypoglossal motoneurons, the properties of the native Ih
current did not match the properties of either homotetrameric HCN1 or HCN2 channels. Given that
the distribution of the HCN2 subunit across the dendritic tree of motoneurons is unknown, the
distribution of HCN1-subunit containing channels observed in the present study may not necessary
reflect the distribution of HCN channels.It is likely that the population of HCN channels on trapezius
motoneurons is largely comprised of heterotetrameric channels containing both the HCN1 and
HCN2 subunit. However, the possibility that some HCN channels may exists as homotetrameric
HCN1 and HCN2 channels cannot be ruled out.
8.9 Resonance properties as a function of distance from the soma
Studies have shown that resonance is not a fixed property but instead is highly variable.
The resonance frequency across the dendritic tree of pyramidal neurons was revealed to be
location-dependent due to regional differences in the density of HCN channels. Anatomical and
electrophysiological studies have demonstrated that the density of HCN channels along the apical
dendrite increases with distance from the soma (Lorincz et al., 2002; Magee, 1998). Similarly, the
injection of a ZAP current stimulus to the soma and sites along the apical dendrite at different
distances from the soma revealed that the resonance frequency increased considerably with

80
increasing distance from the soma (Narayanan and Johnston, 2007). In accordance with the
reported change in HCN channel density, the resonance frequency increased more than 3-fold
between the soma and distal regions of the apical dendrites. Furthermore, the resonance strength
(Q), defined as the ratio of the maximum impedance amplitude to the impedance amplitude at 0 Hz,
increased with distance from the soma. To support a direct graded relationship between the
density of HCN channels and resonance properties, the resonance frequency and resonance
strength were shown based on modeling studies to be dependent on both density of HCN channels
via changes in the conductance of HCN channels and on the voltage-dependence of HCN channels
via changes in V1/2. Lastly, the experimentally measured gradient in resonance properties was
replicated in a morphologically realistic model of a pyramidal neuron with a known gradient in
HCN channel density along the apical dendrite (Narayanan and Johnston, 2007).
These findings suggest that the resonance frequency and resonance strength may be
conserved across the dendritic tree of trapezius motoneurons with a uniform distribution of HCN1.
On the other hand, these properties may be location-dependent across the dendritic tree of
trapezius motoneurons that display a proximal to distal gradient of HCN1. Specifically, the
resonance frequency and resonance strength may be higher on distal dendrites compared to
proximal dendrites. Thus, distal dendrites may be tuned to inputs with high frequency components
whereas proximal dendrites may be tuned to inputs with low frequency components.
8.10 Functional consequences of a linear and uniform proximal to distal distribution of HCN
channels
Motoneurons possess a fast persistent sodium current, INaP, and a slow persistent calcium
current, ICaL. The two persistent inward currents (PICs) have been shown to differentially amplify
synaptic input based on the frequency content of the synaptic input. Synaptic inputs with high
frequency components were preferentially amplifed by INaP whereas synaptic inputs with low
81
frequency components were preferentially amplified by ICaL. This frequency-dependent
amplification arises from a subthreshold resonance attributed to HCN channels. However, these
findings were based on measurements of the voltage response to a ZAP current stimulus injected at
the soma and the two PICs were simulated by a dynamic conductance clamp applied through the
somatic recording electrode. Given strong evidence suggesting that PICs are located on the
dendritic tree (Carlin et al., 2000; Bui et al., 2005) and differences in resonance frequency are
attributed to differences in HCN channel density, the frequency-dependent amplification of synaptic
inputs distributed across the motoneuron dendritic tree in the presence of physiological PICs
remains unclear.
8.11 HCN channels and motor unit type
Burke and colleagues have shown that motor units may be classified based on the
contractile properties of their muscle units (Burke, 1967; Burke et al., 1973). S-type motor units
contain muscle fibers that display slow contraction times, produce small twitch forces and are
highly resistant to fatigue. Among motor units containing muscle fibers that display fast contraction
times and produce large twitch forces, FR-type motor units are resistant to fatigue whereas FF-type
motor units have a low resistance to fatigue. Evidence has also shown that the membrane electrical
properties of motoneurons are tightly coupled with the muscle fiber type. The input conductance of
motoneurons was found to differ significantly among motor units and can reliably predict motor
unit type (Zengel et al., 1985). The measured input conductances from motoneurons belonging to S-
type motor units were considerably lower compared to FR-type and FF-type motor units. Of the ten
trapezius motoneurons, those with a low computed input conductance displayed a graded proximal
to distal increase in the density of HCN1 across the dendritic tree. In contrast, those with a higher
computed input conductance displayed a uniform density of HCN1 across the motoneuron dendritic
tree. This suggests that motor units may also differ based on the distribution of HCN1.

82
8.12 Concluding Statements
The present study provides the first description of the distribution of HCN channels on
trapezius motoneurons. Although some trapezius motoneurons display a uniform proximal to distal
distribution of HCN1 comfirming earlier prediction from computational studies, other trapezius
motoneurons display a proximal to distal gradient of HCN1. Based on resonance studies in
pyramidal neurons, it is possible that motoneurons may share in common with pyramidal neurons
the ability to locally tune the response at the dendrite to synaptic input based on differences in
density of HCN channels. Furthermore, the optimal reponse to synaptic input at a specific location
may be changed by local changes in the density of HCN channels or by changing the functional
properties of Ih such as the voltage-dependence and kinetics.

83
References
Angelo K, London M, Christensen SR, Häusser M (2007) Local and Global Effects of Ih Distribution in Dendrites of Mammalian Neurons. J Neurosci 27:8643–8653.
Ballou EW (n.d.) Measuring dendritic distribution of membrane proteins. J Neurosci Methods 156:257–266.
Ban N, Escobar C, Garcia R, Hasel K, Day J, Greenwood A, McPherson A (1994) Crystal Structure of an Idiotype-Anti-Idiotype Fab Complex. PNAS 91:1604–1608.
Bayliss DA, Viana F, Bellingham MC, Berger AJ (1994) Characteristics and Postnatal Development of a Hyperpolarization-Activated Inward Current in Rat Hypoglossal Motoneurons in Vitro. J Neurophysiol 71:119–128.
Berg AP, Talley EM, Manger JP, Bayliss DA (2004) Motoneurons Express Heteromeric TWIK-Related Acid-Sensitive K+ (TASK) Channels Containing TASK-1 (KCNK3) and TASK-3 (KCNK9) Subunits. J Neurosci 24:6693–6702. Berg RW, Alaburda A, Hounsgaard J (2007) Balanced Inhibition and Excitation Drive Spike Activity in Spinal Half-Centers. Science 315:390–393.
Berger T, Larkum ME, Lüscher H-R (2001) High I H Channel Density in the Distal Apical Dendrite of Layer V Pyramidal Cells Increases Bidirectional Attenuation of EPSPs. J Neurophysiol 85:855–868.
Bezzerides VJ, Ramsey IS, Kotecha S, Greka A, Clapham DE (2004) Rapid vesicular translocation and insertion of TRP channels. Nature Cell Biol 6:709–720.
Bobker DH, Williams JT (1989) Serotonin augments the cationic current Ih in central neurons. Neuron 2:1535–1540.
Bockaert J, Claeysen S, Bécamel C, Dumuis A, Marin P (2006) Neuronal 5-HT metabotropic receptors: fine-tuning of their structure, signaling, and roles in synaptic modulation. Cell and Tissue Res 326:553–572.
Bui TV, Cushing S, Dewey D, Fyffe RE, Rose PK (2003) Comparison of the Morphological and Electrotonic Properties of Renshaw Cells, Ia Inhibitory Interneurons, and Motoneurons in the Cat. J Neurophysiol 90:2900–2918.
Bui TV, Ter-Mikaelian M, Bedrossian D, Rose PK (2006) Computational estimation of the distribution of L-type Ca(2+) channels in motoneurons based on variable threshold of activation of persistent inward currents. J Neurophysiol 95:225–241.
Bullis JB, Jones TD, Poolos NP (2007) Reversed somatodendriticIh gradient in a class of rat hippocampal neurons with pyramidal morphology.J Physiol 579:431 –443.
Burke RE (1967) Motor Unit Types of Cat Triceps Surae Muscle. J Physiol 193:141–160.
84
Burke RE (2011) Motor Units: Anatomy, Physiology, and Functional Organization. In: Comprehensive Physiology. John Wiley & Sons, Inc.
Burke RE, Levine DN, Tsairis P, Zajac FE (1973) Physiological Types and Histochemical Profiles in Motor Units of the Cat Gastrocnemius. J Physiol 234:723–748.
Buzsáki G (2002) Theta Oscillations in the Hippocampus. Neuron 33:325–340.
Carlin KP, Jones KE, Jiang Z, Jordan LM, Brownstone RM (2000) Dendritic L-type calcium currents in mouse spinal motoneurons: implications for bistability. Eur J Neurosci 12:1635–1646.
Cazalets J, Borde M, Clarac F (1996) The synaptic drive from the spinal locomotor network to motoneurons in the newborn rat. J Neurosci 16:298 –306.
Chen S, Wang J, Siegelbaum SA (2001) Properties of Hyperpolarization-Activated Pacemaker Current Defined by Coassembly of Hcn1 and Hcn2 Subunits and Basal Modulation by Cyclic Nucleotide. J Gen Physiol 117:491–504.
Chen X, Sirois JE, Lei Q, Talley EM, Lynch C, Bayliss DA (2005) HCN Subunit-Specific and cAMP-Modulated Effects of Anesthetics on Neuronal Pacemaker Currents. J Neurosci 25:5803–5814.
Claxton NS, Fellers T, Davidson MW (2008) Laser scanning confocal microscope. Department of optical microscopy and digital imaging, National High Magnetic Field Laboratory, Florida State University, 37p., unpublished.
Cullheim S (1987a) Membrane area and dendritic structure in type-identified triceps surae alpha motoneurons. J Comp Neurol 255:68–81.
Cullheim S (1987b) Three-Dimensional architecture of dendritic trees in type-identified α-motoneurons. J Comp Neurol 255:82–96.
Cushing S, Bui T, Rose PK (2005) Effect of Nonlinear Summation of Synaptic Currents on the Input–Output Properties of Spinal Motoneurons. J Neurophysiol 94:3465–3478.
DiFrancesco D, Tortora P (1991) Direct activation of cardiac pacemaker channels by intracellular cyclic AMP. Nature 351: 145-147
ElBasiouny SM, Bennett DJ, Mushahwar VK (2005) Simulation of Dendritic CaV1.3 Channels in Cat Lumbar Motoneurons: Spatial Distribution. J Neurophysiol 94:3961–3974.
ElBasiouny SM, Bennett DJ, Mushahwar VK (2006) Simulation of Ca2+ persistent inward currents in spinal motoneurones: mode of activation and integration of synaptic inputs. J Physiol 570:355–374.
George MS, Abbott LF, Siegelbaum SA (2009) HCN hyperpolarization-activated cation channels inhibit EPSPs by interactions with M-type K(+) channels. Nat Neurosci 12:577–584.
Grande G, Bui TV, Rose PK (2007) Estimates of the Location of L-type Ca2+ Channels in Motoneurons of Different Sizes: A Computational Study. J Neurophysiol 97:4023–4035.

85
Granit R, Kernell D, Shortess GK (1963a) Quantitative aspects of repetitive firing of mammalian motoneurones, caused by injected currents. J Physiol 168:911–931.
Granit R, Kernell D, Smith RS (1963b) Delayed depolarization and the repetitive response to intracellular stimulation of mammalian motoneurones. J Physiol 168:890–910.
Gustafsson B, Pinter MJ (1984) An Investigation of Threshold Properties Among Cat Spinal Alpha-Motoneurones. J Physiol 357:453–483.
Gutfreund Y, yarom Y, Segev I (1995) Subthreshold oscillations and resonant frequency in guinea-pig cortical neurons: physiology and modelling. J Physiol (Lond) 483 ( Pt 3):621–640.
Harvey PJ, Li X, Li Y, Bennett DJ (2006) Endogenous Monoamine Receptor Activation Is Essential for Enabling Persistent Sodium Currents and Repetitive Firing in Rat Spinal Motoneurons. J Neurophysiol 96:1171–1186.
Häusser M, Clark BA (1997) Tonic Synaptic Inhibition Modulates Neuronal Output Pattern and Spatiotemporal Synaptic Integration. Neuron 19:665–678.
Häusser M, Spruston N, Stuart GJ (2000) Diversity and Dynamics of Dendritic Signaling. Science 290:739–744.
Heckmann CJ, Gorassini MA, Bennett DJ (2005) Persistent inward currents in motoneuron dendrites: implications for motor output. Muscle Nerve 31:135–156.
Hochman S, Schmidt BJ (1998) Whole Cell Recordings of Lumbar Motoneurons DuringLocomotor-Like Activity in the In Vitro Neonatal Rat Spinal Cord. J Neurophysiol 79:743 –752.
Hoffman DA, Magee JC, Colbert CM, Johnston D (1997) K+ channel regulation of signal propagation in dendrites of hippocampal pyramidal neurons. Nature 387:869–875.
Hounsgaard J, Kiehn O (1989) Serotonin-Induced Bistability of Turtle Motoneurones Caused by a Nifedipine-Sensitive Calcium Plateau Potential. J Physiol 414:265–282.
Hsiao CF, Trueblood PR, Levine MS, Chandler SH (1997) Multiple Effects of Serotonin on Membrane Properties of Trigeminal Motoneurons In Vitro. J Neurophysiol 77:2910–2924.
Hu H, Vervaeke K, Storm JF (2002) Two forms of electrical resonance at theta frequencies, generated by M-current, h-current and persistent Na+ current in rat hippocampal pyramidal cells. J Physiol 545:783–805.
Huang C, Thompson TE (1965) Properties of lipid bilayer membranes separating two aqueous phases: Determination of membrane thickness. J Mol Biol 13:183–193.
Hutcheon B, Miura RM, Puil E (1996) Subthreshold membrane resonance in neocortical neurons. J Neurophysiol 76:683–697.

86
Hutcheon B, Yarom Y (2000) Resonance, oscillation and the intrinsic frequency preferences of neurons. Trends Neurosci 23:216–222.
Inoue T, Itoh S, Wakisaka S, Ogawa S, Saito M, Morimoto T (2002) Involvement of 5-HT7 receptors in serotonergic effects on spike afterpotentials in presumed jaw-closing motoneurons of rats. Brain Res 954:202–211.
Ishii TM, Takano M, Xie L-H, Noma A, Ohmori H (1999) Molecular Characterization of the Hyperpolarization-Activated Cation Channel in Rabbit Heart Sinoatrial Node. J BiolChem 274:12835–12839.
Ito M, Oshima T (1965) Electrical behaviour of the motoneurone membrane during intracellularly applied current steps. J Physiol 180:607–635.
Johnston D, Magee JC, Colbert CM, Christie BR (1996) Active Properties of Neuronal Dendrites. Annual Review of Neurosci 19:165–186.
Kiehn O, Kjaerulff O, Tresch MC, Harris-Warrick RM (2000) Contributions of intrinsic motor neuron properties to the production of rhythmic motor output in the mammalian spinal cord. Brain Res Bulletin 53:649–659.
Kole MHP, Hallermann S, Stuart GJ (2006) Single Ih Channels in Pyramidal Neuron Dendrites: Properties, Distribution, and Impact on Action Potential Output. J Neurosci 26:1677–1687.
Korogod SM, Kulagina IB, Horcholle-Bossavit G, Gogan P, Tyc-Dumont S (2000) Activity-dependent reconfiguration of the effective dendritic field of motoneurons. J Comp Neurol 422:18–34.
Lampl I, Yarom Y (1993) Subthreshold oscillations of the membrane potential: a functional synchronizing and timing device. J Neurophysiol 70:2181–2186.
Larkman PM, Kelly JS (1992) Ionic Mechanisms Mediating 5-Hydroxytryptamine- and Noradrenaline-Evoked Depolarization of Adult Rat Facial Motoneurones. J Physiol 456:473–490.
Larkum ME, Nevian T, Sandler M, Polsky A, Schiller J (2009) Synaptic Integration in Tuft Dendrites of Layer 5 Pyramidal Neurons: A New Unifying Principle. Science 325:756–760.
Lee RH, Heckman CJ (1999) Paradoxical Effect of QX-314 on Persistent Inward Currents and Bistable Behavior in Spinal Motoneurons In Vivo. J Neurophysiol 82:2518–2527.
Lesage F, Lazdunski M (2000) Molecular and functional properties of two-pore-domain potassium channels. Am J Physiol Renal Physiol 279:F793–801.
Leung LS, Yu H-W (1998) Theta-Frequency Resonance in Hippocampal CA1 Neurons In Vitro Demonstrated by Sinusoidal Current Injection. J Neurophysiol 79:1592–1596.
Li Y, Bennett DJ (2003) Persistent sodium and calcium currents cause plateau potentials in motoneurons of chronic spinal rats. J Neurophysiol 90:857–869.

87
Lörincz A, Notomi T, Tamás G, Shigemoto R, Nusser Z (2002) Polarized and compartment-dependent distribution of HCN1 in pyramidal cell dendrites. Nat Neurosci 5:1185–1193.
Lorincz A, Nusser Z (2010) Molecular Identity of Dendritic Voltage-Gated Sodium Channels. Science 328:906–909.
Ludwig A, Zong X, Jeglitsch M, Hofmann F, Biel M (1998) A family of hyperpolarization-activated mammalian cation channels. Nature 393:587–591.
Ludwig A, Zong X, Stieber J, Hullin R, Hofmann F, Biel M (1999) Two pacemaker channels from human heart with profoundly different activation kinetics. Eur Mol Biol Journal 18:2323–2329.
Lüthi A, McCormick DA (1998) Periodicity of Thalamic Synchronized Oscillations: the Role of Ca2+-Mediated Upregulation of Ih. Neuron 20:553–563.
Magee JC (1998) Dendritic Hyperpolarization-Activated Currents Modify the Integrative Properties of Hippocampal CA1 Pyramidal Neurons. J Neurosci 18:7613–7624.
Magee JC, Johnston D (1995) Characterization of single voltage-gated Na+ and Ca2+ channels in apical dendrites of rat CA1 pyramidal neurons. J Physiol 487:67–90.
Manuel M, Meunier C, Donnet M, Zytnicki D (2007) Resonant or Not, Two Amplification Modes of Proprioceptive Inputs by Persistent Inward Currents in Spinal Motoneurons. J Neurosci 27:12977–12988.
McCormick DA, Pape HC (1990) Properties of a Hyperpolarization-Activated Cation Current and Its Role in Rhythmic Oscillation in Thalamic Relay Neurones. J Physiol 431:291–318.
Migliore M, Shepherd GM (2002)Emerging rules for the distributions of active dendritic conductances. Nature Reviews Neurosci 3:362–370.
Milligan CJ, Edwards IJ, Deuchars J (2006) HCN1 ion channel immunoreactivity in spinal cord and medulla oblongata. Brain Res 1081:79–91.
Mistrík P, Mader R, Michalakis S, Weidinger M, Pfeifer A, Biel M (2005) The Murine HCN3 Gene Encodes a Hyperpolarization-Activated Cation Channel with Slow Kinetics and Unique Response to Cyclic Nucleotides. J BiolChem 280:27056–27061.
Monteggia LM, Eisch AJ, Tang MD, Kaczmarek LK, Nestler EJ (2000) Cloning and localization of the hyperpolarization-activated cyclic nucleotide-gated channel family in rat brain. Brain Res Mol Brain Res 81:129–139.
Moosmang S, Biel M, Hofmann F, Ludwig A (1999) Differential Distribution of Four Hyperpolarization-Activated Cation Channels in Mouse Brain. J BiolChem 380:975–980.
Muennich EAL, Fyffe REW (2004) Focal aggregation of voltage-gated, Kv2.1 subunit-containing, potassium channels at synaptic sites in rat spinal motoneurones. J Physiol (Lond) 554:673–685.

88
Narayanan R, Johnston D (2007) Long-term potentiation in rat hippocampal neurons is accompanied by spatially widespread changes in intrinsic oscillatory dynamics and excitability. Neuron 56:1061–1075.
Nevian T, Larkum ME, Polsky A, Schiller J (2007) Properties of basal dendrites of layer 5 pyramidal neurons: a direct patch-clamp recording study. Nature Neurosci 10:206–214.
Noam Y, Zha Q, Phan L, Wu R-L, Chetkovich DM, Wadman WJ, Baram TZ (2010) Trafficking and Surface Expression of Hyperpolarization-Activated Cyclic Nucleotide-Gated Channels in Hippocampal Neurons. J BiolChem 285:14724–14736.
Notomi T, Shigemoto R (2004) Immunohistochemical localization of Ih channel subunits, HCN1–4, in the rat brain. J Comp Neurol 471:241–276.
Nusser Z (2009) Variability in the subcellular distribution of ion channels increases neuronal diversity. Trends Neurosci 32:267–274.
Pape H-C, McCormick DA (1989) Noradrenaline and serotonin selectively modulate thalamic burst firing by enhancing a hyperpolarization-activated cation current. Nature 340: 715-718
Pike FG, Goddard RS, Suckling JM, Ganter P, Kasthuri N, Paulsen O (2000) Distinct frequency preferences of different types of rat hippocampal neurones in response to oscillatory input currents. J Physiol 529:205–213.
Powers RK, Binder MD (2001) Input-output functions of mammalian motoneurons. Rev PhysiolBiochemPharmacol 143:137–263.
Puil E, Meiri H, Yarom Y (1994) Resonant behavior and frequency preferences of thalamic neurons. J Neurophysiol 71:575–582.
Rall W (1977). Core conductor theory and cable properties of neurons. In: Handbook of Physiology. The nervous System, vol I.Cellular biology of neurons. Part I. edited by Kandel ER. Bethesda, MD: American Physiological Society
Rose PK (1981) Distribution of dendrites from biventercervicis and complexus motoneurons stained intracellularly with horseradish peroxidase in the adult cat. J Comp Neurol 197:395–409.
Rose PK, Cushing S (1999) Non-linear summation of synaptic currents on spinal motoneurons: lessons from simulations of the behaviour of anatomically realistic models. Prog Brain Res 123:99–107.
Rose PK, Keirstead SA, Vanner SJ (1985) A quantitative analysis of the geometry of cat motoneurons innervating neck and shoulder muscles. J Comp Neurol 239:89–107.
Rose PK, Neuber-Hess M (1991) Morphology and frequency of axon terminals on the somata, proximal dendrites, and distal dendrites of dorsal neck motoneurons in the cat. J Comp Neurol 307:259–280.

89
Santoro B, Chen S, Lüthi A, Pavlidis P, Shumyatsky GP, Tibbs GR, Siegelbaum SA (2000) Molecular and Functional Heterogeneity of Hyperpolarization-Activated Pacemaker Channels in the Mouse CNS. J Neurosci 20:5264 –5275.
Santoro B, Liu DT, Yao H, Bartsch D, Kandel ER, Siegelbaum SA, Tibbs GR (1998) Identification of a Gene Encoding a Hyperpolarization-Activated Pacemaker Channel of Brain. Cell 93:717–729.
Santoro B, Tibbs GR (1999) The HCN Gene Family: Molecular Basis of the Hyperpolarization-Activated Pacemaker Channels. Annals of the New York Academy of Sciences 868:741–764.
Schwindt PC, Calvin WH (1973) Equivalence of synaptic and injected current in determining the membrane potential trajectory during motoneuron rhythmic firing. Brain Res 59:389–394.
Schwindt PC, Crill WE (1997) Modification of Current Transmitted From Apical Dendrite to Soma by Blockade of Voltage- and Ca2+-Dependent Conductances in Rat Neocortical Pyramidal Neurons. J Neurophysiol 78:187–198.
Seifert R, Scholten A, Gauss R, Mincheva A, Lichter P, Kaupp UB (1999) Molecular Characterization of a Slowly Gating Human Hyperpolarization-Activated Channel Predominantly Expressed in Thalamus, Heart, and Testis. PNAS 96:9391–9396.
Sherrington CS (1906). The Integrative Actions of the Nervous System. New York: Charles Scribner’s Sonsa.
Shin M, Chetkovich DM (2007) Activity-Dependent Regulation of H Channel Distribution in Hippocampal CA1 Pyramidal Neurons. J BiolChem 282:33168–33180.
Stieber J, Stöckl G, Herrmann S, Hassfurth B, Hofmann F (2005) Functional Expression of the Human HCN3 Channel. J BiolChem 280:34635–34643.
Stoeckenius W (1962) Structure of the Plasma Membrane: An Electron-Microscope Study. Circulation 26:1066–1069.
Stuart G, Spruston N (1998) Determinants of Voltage Attenuation in Neocortical Pyramidal Neuron Dendrites. J Neurosci 18:3501–3510.
Takahashi T, Berger AJ (1990) Direct Excitation of Rat Spinal Motoneurones by Serotonin. J Physiol 423:63–76.
Tokimasa T, Akasu T (1990) Cyclic AMP Regulates an Inward Rectifying Sodium-Potassium Current in Dissociated Bull-Frog Sympathetic Neurones. J Physiol 420:409–429.
Ulens C, Tytgat J (2001) Functional Heteromerization of HCN1 and HCN2 Pacemaker Channels. J BiolChem 276:6069–6072.
Ulfhake B, Kellerth JO (1981) A quantitative light microscopic study of the dendrites of cat spinal alpha-motoneurons after intracellular staining with horseradish peroxidase. J Comp Neurol 202:571–583.

90
Ulrich D (2002) Dendritic Resonance in Rat Neocortical Pyramidal Cells. J Neurophysiol 87:2753–2759.
Vacher H, Mohapatra DP, Trimmer JS (2008) Localization and Targeting of Voltage-Dependent Ion Channels in Mammalian Central Neurons. Physiol Rev 88:1407–1447.
Williams SR, Stuart GJ (2000) Site Independence of EPSP Time Course Is Mediated by DendriticI H in Neocortical Pyramidal Neurons. J Neurophysiol 83:3177–3182.
de Wit H, Walter AM, Milosevic I, Gulyás-Kovács A, Riedel D, Sørensen JB, Verhage M (2009) Synaptotagmin-1 Docks Secretory Vesicles to Syntaxin-1/SNAP-25 Acceptor Complexes. Cell 138:935–946.
Zengel JE, Reid SA, Sypert GW, Munson JB (1985) Membrane electrical properties and prediction of motor-unit type of medial gastrocnemius motoneurons in the cat. J Neurophysiol 53:1323 –1344.
Zhang H, Fu Y, Altier C, Platzer J, Surmeier DJ, Bezprozvanny I (2006) CaV1.2 and CaV1.3 neuronal L-type calcium channels: differential targeting and signaling to pCREB. Eur J Neurosci 23:2297–2310.