Mapping Temperature and Radiant Geothermal Heat...
8
GRC Transactions, Vol. 36, 2012 1403 Keywords Thermal infrared, remote sensing, ASTER, geothermal heat flux, Yellowstone, thermal anomalies ABSTRACT The purpose of this work was to use satellite-based thermal infrared (TIR) remote sensing data to measure, map, and monitor geothermal activity within the Yellowstone geothermal area to help meet the missions of both the U.S. Geological Survey Yel- lowstone Volcano Observatory and the Yellowstone National Park Geology Program. Specifically, the goals were to: 1) address the challenges of remotely characterizing the spatially and temporally dynamic thermal features in Yellowstone by using nighttime TIR data from the Advanced Spaceborne Thermal Emission and Re- flection Radiometer (ASTER) and 2) estimate the temperature, geothermal radiant emittance, and radiant geothermal heat flux (GHF) for Yellowstone’s thermal areas (both Park wide and for individual thermal areas). ASTER TIR data (90-m pixels) acquired at night during Janu- ary and February, 2010, were used to estimate surface temperature, radiant emittance, and radiant GHF from all of Yellowstone’s thermal features, produce thermal anomaly maps, and update field-based maps of thermal areas. A background subtraction technique was used to isolate the geothermal component of TIR radiance from thermal radiance due to insolation. A lower limit for the Yellowstone’s total radiant GHF was established at ~2.0 GW, which is ~30-45% of the heat flux estimated through geochemical (Cl-flux) methods. Additionally, about 5 km 2 was added to the geodatabase of mapped thermal areas. This work provides a framework for future satellite-based thermal monitoring at Yellowstone as well as exploration of other volcanic / geothermal systems on a global scale. Introduction Yellowstone National Park (YNP), Wyoming, contains one of the world’s largest geothermal systems, which was the pri- mary reason for its designation as a National Park in 1872. The geothermal system is the surface manifestation of a partly mol- ten magma reservoir beneath the 0.64 Ma Yellowstone Caldera Mapping Temperature and Radiant Geothermal Heat Flux Anomalies in the Yellowstone Geothermal System Using ASTER Thermal Infrared Data R. Greg Vaughan 1 , Jacob B. Lowenstern 2 , Laszlo P. Keszthelyi 1 , Cheryl Jaworowski 3 , and Henry Heasler 3 1 U.S. Geological Survey, Astrogeology Science Center, Flagstaff AZ, USA 2 U.S. Geological Survey, Volcano Science Center, Yellowstone Volcano Observatory, Menlo Park CA, USA 3 Yellowstone Center for Resources, Yellowstone National Park WY, USA Thermal Areas Lakes Park Boundary Continental Divide Major Rivers Yellowstone Caldera Inner Ring Fracture Zone Resurgent Domes Montana Wyoming Montana Wyoming Wyoming Idaho 0 10 20 30 5 Kilometers ± Figure 1. Yellowstone National Park location map. Thermal areas, shown in shades of red, are located and digitized based on field mapping (R. Hutchinson, unpublished data), digitized mapping based on digitization from 1-m color orthhophotos, and updated based on ASTER hot spot map- ping. The Yellowstone Caldera boundary, ring fracture zone, and resurgent domes are adapted from Christensen (2001). All other features are from the Yellowstone Center for Resources GIS geodatabase. (Modified from Vaughan et al., 2012)
Transcript of Mapping Temperature and Radiant Geothermal Heat...
GRC Transactions, Vol. 36, 2012
1403
KeywordsThermal infrared, remote sensing, ASTER, geothermal heat flux, Yellowstone, thermal anomalies
ABSTRACT
The purpose of this work was to use satellite-based thermal infrared (TIR) remote sensing data to measure, map, and monitor geothermal activity within the Yellowstone geothermal area to help meet the missions of both the U.S. Geological Survey Yel-lowstone Volcano Observatory and the Yellowstone National Park Geology Program. Specifically, the goals were to: 1) address the challenges of remotely characterizing the spatially and temporally dynamic thermal features in Yellowstone by using nighttime TIR data from the Advanced Spaceborne Thermal Emission and Re-flection Radiometer (ASTER) and 2) estimate the temperature, geothermal radiant emittance, and radiant geothermal heat flux (GHF) for Yellowstone’s thermal areas (both Park wide and for individual thermal areas).
ASTER TIR data (90-m pixels) acquired at night during Janu-ary and February, 2010, were used to estimate surface temperature, radiant emittance, and radiant GHF from all of Yellowstone’s thermal features, produce thermal anomaly maps, and update field-based maps of thermal areas. A background subtraction technique was used to isolate the geothermal component of TIR radiance from thermal radiance due to insolation. A lower limit for the Yellowstone’s total radiant GHF was established at ~2.0 GW, which is ~30-45% of the heat flux estimated through geochemical (Cl-flux) methods. Additionally, about 5 km2 was added to the geodatabase of mapped thermal areas.
This work provides a framework for future satellite-based thermal monitoring at Yellowstone as well as exploration of other volcanic / geothermal systems on a global scale.
Introduction
Yellowstone National Park (YNP), Wyoming, contains one of the world’s largest geothermal systems, which was the pri-
mary reason for its designation as a National Park in 1872. The geothermal system is the surface manifestation of a partly mol-ten magma reservoir beneath the 0.64 Ma Yellowstone Caldera
Mapping Temperature and Radiant Geothermal Heat Flux Anomalies in the Yellowstone Geothermal System Using ASTER Thermal Infrared Data
R. Greg Vaughan1, Jacob B. Lowenstern2, Laszlo P. Keszthelyi1, Cheryl Jaworowski3, and Henry Heasler3
1U.S. Geological Survey, Astrogeology Science Center, Flagstaff AZ, USA2U.S. Geological Survey, Volcano Science Center,
Yellowstone Volcano Observatory, Menlo Park CA, USA3Yellowstone Center for Resources, Yellowstone National Park WY, USA
Thermal Areas
Lakes
Park Boundary Continental Divide Major Rivers Yellowstone Caldera Inner Ring Fracture Zone Resurgent Domes
Montana Wyoming
Mon
tana
W
yom
ing
Wyo
min
g Idah
o
0 10 20 30 5 Kilometers
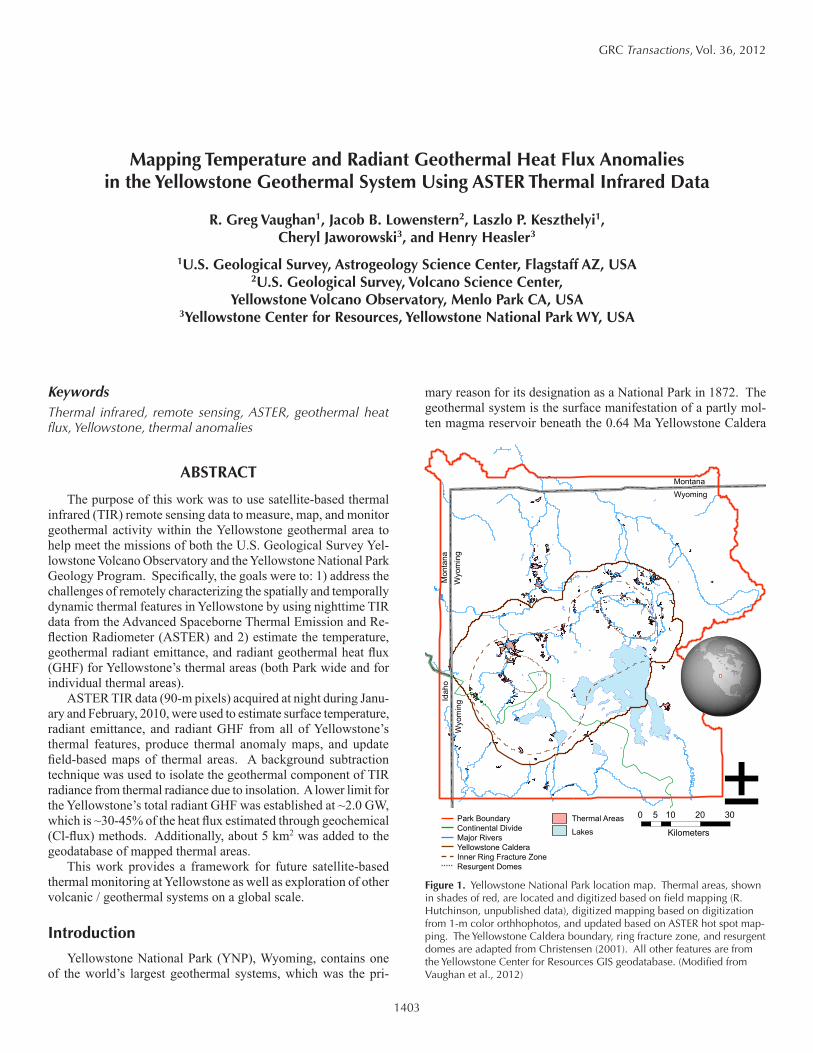
±Figure 1. Yellowstone National Park location map. Thermal areas, shown in shades of red, are located and digitized based on field mapping (R. Hutchinson, unpublished data), digitized mapping based on digitization from 1-m color orthhophotos, and updated based on ASTER hot spot map-ping. The Yellowstone Caldera boundary, ring fracture zone, and resurgent domes are adapted from Christensen (2001). All other features are from the Yellowstone Center for Resources GIS geodatabase. (Modified from Vaughan et al., 2012)
1404
Vaughan, et al.
(Christiansen, 2001) (Figure 1). Heat from the cooling magma is transferred to the overlying rock and meteoric water reservoirs. Scientific drilling in the 1960s found that water temperatures increased with depth along the water boiling curve, along a near-hydrostatic pressure gradient beneath most of the thermal areas, and measured water temperatures up to 240°C, which are inferred to be >300°C within hydrothermal reservoirs at depth (White et al., 1975; Fournier, 1989).
At the surface, there are >10,000 individual thermal features, including hot springs, geysers, fumaroles, and mud pots. These features range in size from a few centimeters to tens of meters across; and they range in temperature up to, and occasionally above, the boiling point of water, which is 92-94 ºC at elevations in Yellowstone (~2440 m or ~8000 ft). There are also large areas of diffusely venting warm ground and thermal drainages that carry warm water away from the thermal areas. Most of the thermal features are clustered together into 100 or so distinct thermal areas (Figure 1), mostly concentrated along pre-existing structures such as the ring fracture system of the 0.64 Ma Yellowstone Caldera, along edges of resurgent domes, or along edges of dozens of <0.64 Ma intra-caldera rhyolite flows (Christiansen, 2001).
The goals of monitoring Yellowstone’s geothermal system are focused on characterizing normal, seasonal and/or diurnal, thermal fluctuations so that significant abnormal geothermal changes can be detected and recognized should they ever occur. Abnormal geothermal changes could be caused by human activi-ties, such as geothermal, oil/gas, or groundwater development outside the Park, or could indicate the beginning of renewed volcanic activity.
The challenges of geothermal monitoring in Yellowstone are: 1) the large number of individual thermal features, their relative inaccessibility, and the large area of their distribution, making it infeasible to regularly use field-based monitoring instruments; 2) the temporal variability in surface temperatures and geothermal heat flux on time scales that range from minutes, to daily, to seasonal; and 3) with respect to satellite-based remote sensing measurements, the subtle magnitude of thermal features in both size and temperature.
Most estimates of Yellowstone’s heat flux are based on measurements of Cl- ion concentrations exiting the hydrothermal system. This technique, based on the relationship between Cl discharge from hydrothermal systems and an enthalpy flux (Ellis and Wilson, 1955), produces estimates of advective heat flux for Yel-lowstone that range from 4.5 to 6.0 GW (Fournier et al., 1976; Ingebritsen et al., 2001; Friedman and Norton, 2007; Hurwitz et al., 2007; Lowenstern and Hurwitz, 2008).
In Yellowstone, surface thermal fea-tures have been studied and monitored with in situ thermocouples and data loggers, airborne- and field-based FLIR (forward looking infrared) surveillance, Landsat ETM+ data, and thermal infrared (TIR) data from the Advanced Space-
borne Thermal Emission and Reflection Radiometer (ASTER) (Heasler et al., 2009; Jaworowski et al., 2010, Neale et al., 2011; Watson et al., 2008; Vaughan et al., 2012). This paper summarizes and expands on work by Vaughan et al. (2012) using space borne ASTER TIR data to measure, map, and monitor Yellowstone’s thermal areas (see BOX 1).
ASTER Data and Analysis Methods
Satellite-based TIR remote sensing tools have been used in numerous previous studies to characterize volcanic and geother-mal features ranging from lava lakes to crater lakes (Harris and Stevenson, 1997; Oppenheimer, 1993; Harris et al., 1999; Pieri and Abrams, 2005; Vaughan and Hook, 2006; Davies et al., 2008; Trunk and Bernard, 2008; Vaughan et al., 2010). The physical basis for TIR remote sensing, including Planck’s Law and the equations describing TIR radiance measured at the sensor, at-mospheric correction, and temperature retrieval, are described in many of these aforementioned papers and their references.
The ASTER instrument is mounted on the Terra spacecraft, which was launched in December 1999. ASTER measures radiance in three visible and near infrared (VNIR; 0.5-0.8 μm) channels with 15-m pixels; six short-wave infrared (SWIR; 1.6-2.4 μm) channels with 30-m pixels; and five thermal infrared (TIR; 8.2-11.5 μm) channels with 90-m pixels (Yamaguchi et al., 1998). ASTER images cover an area of 60 x 60 km2, thus multiple scenes are required to cover the Yellowstone area (~9000 km2). Since its launch, ASTER data have been acquired over Yellowstone on >150 dates. Of these acquisition dates, ~40% were clear, 20% were partly cloudy (such that some of the thermal areas could be clearly viewed), and the rest were too cloudy to be useful. About 14% of these observations were acquired at night, between 10:30 and 11:30 pm local time. Nighttime data are ideal for isolating the geothermal component of the surface emitted radiance from thermal areas because of increased thermal contrast at night, particularly in the winter months when the lakes are frozen (Vaughan et al., 2012). The five ASTER acquisition dates used
in this work, which cover Yellowstone’s thermal areas under ideal nighttime, winter time conditions, are: 2002/11/04; 2010/01/28; 2010/02/11; 2010/02/20; and 2010/03/01. The 2002/11/04 image is an exception as it is not a winter time image, but was needed to cover several thermal areas in the southwest part of Yellowstone that were not covered by any other night-time scenes (Vaughan et al., 2012). The ASTER data products used in this study are described by Vaughan et al. (2012).
Thermal area locations (Figure 1) were extracted from a GIS geodatabase provided by the Spatial Analysis Group of the Yellowstone Center for Resources. The database was initially based on field mapping overlain on 1-m color digital georegistered orthophotos, although several updates to this map have been made as a result of this work. Although
BOX 1:
We adapt the following definitions from Jaworowski et al. (2010): A thermal area is a contiguous geologic unit generally including one or more thermal features, bounded by the maximum aerial extent of hydrothermally altered ground, thermal deposits, geothermal gas emissions, or heated ground. A thermal group is a subdivision of a thermal area that contains one or more hydrothermal features and can be isolated from other groups based on physiographic, hydrologic, or geochemical parameters. A thermal feature is a vent, or small cluster of related vents, emitting gases and/or hot water. A thermal drainage is a physiographic/hydrologic drainage to which heated waters are contributed by adjacent thermal areas.
1405
Vaughan, et al.
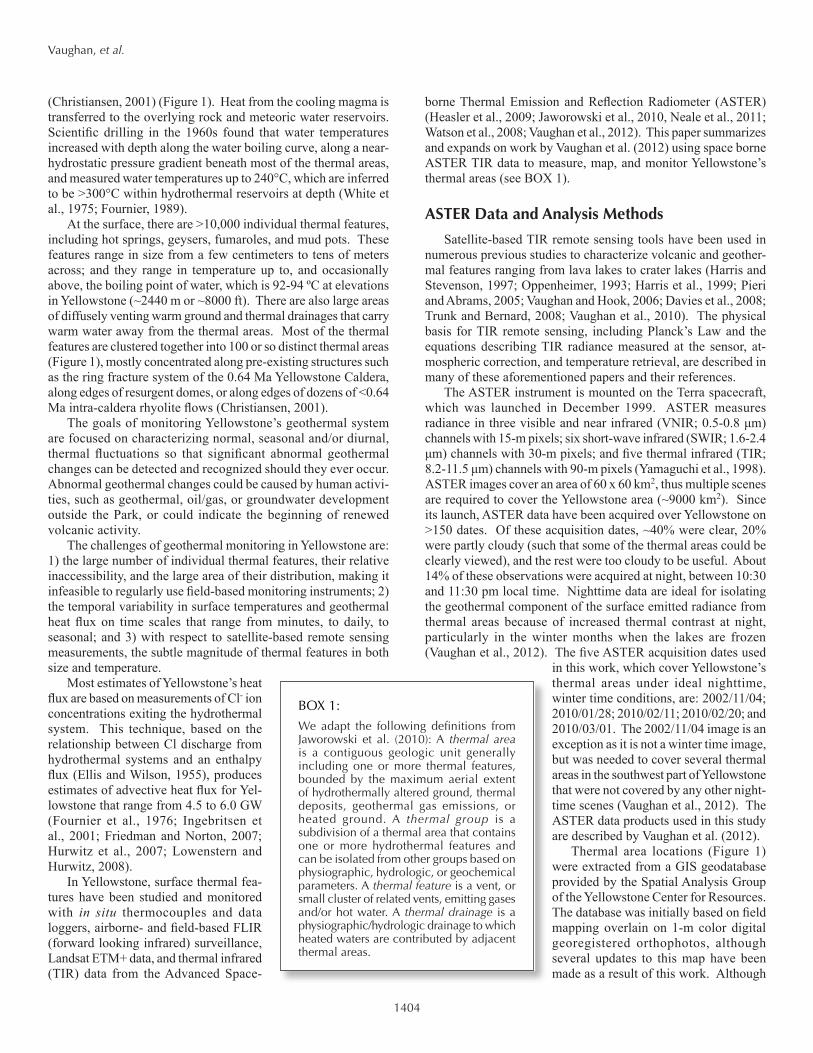
the georegistration information in the nighttime ASTER data can have some uncertainties, these data were geocorrected without pixel resampling, and there was a remarkable spatial correspondence between ASTER TIR hot pixels and the mapped thermal areas (Figure 2).
The average nighttime TIR radiative heat flux summed over the entire Yellowstone area (>9000 km2) is mostly due to daily solar heating, and is estimated to be between 2400 and 3200 GW depending on the time of year (Vaughan et al., 2009). Such solar heating is a function of topography (eleva-tion, slope, and aspect); land surface cover (e.g., vegetation, soil, rock, water, snow, etc.); and previous weather condi-tions. The geothermal component of this total radiant heat flux is three orders of magnitude lower (<1% of the total) and comes from an area (~65 km2) that is <1% of the total area, and is thus a challenge to isolate and measure (Vaughan et al., 2012). The use of nighttime TIR data minimizes, but does not completely eliminate, the effects of the Sun. This is partly because nighttime data (acquired ~11 pm local time) still contain a component of surface emitted radiance that is not geothermal in origin, but related to solar heating earlier in the day.
A simple background (BG) subtraction method was used to remove the effects of seasonal insolation variations and other environmental effects, and isolate the subtle geother-mal component of the radiative heat flux. Radiant emittance (in W/m2) from a proximal, non-geothermal BG area with similar topographic and land surface cover characteristics, and of equal area, was subtracted from the total radiant emit-tance to derive the geothermal radiant emittance component from a thermal area. It was assumed that thermal radiance emitted from the BG due to solar heating was similar to that of the proximal geothermal area. BG areas were chosen based on: 1) proximity to thermal area, 2) similar elevation and topographic characteristics as the thermal area (to mini-mize the effects of differential elevation, slope and aspect), 3) similar surface cover as the thermal area (to minimize the effects of variable surface emissivities and transpiration in vegetation), and 4) same pixel size as the thermal area (Vaughan et al., 2012).
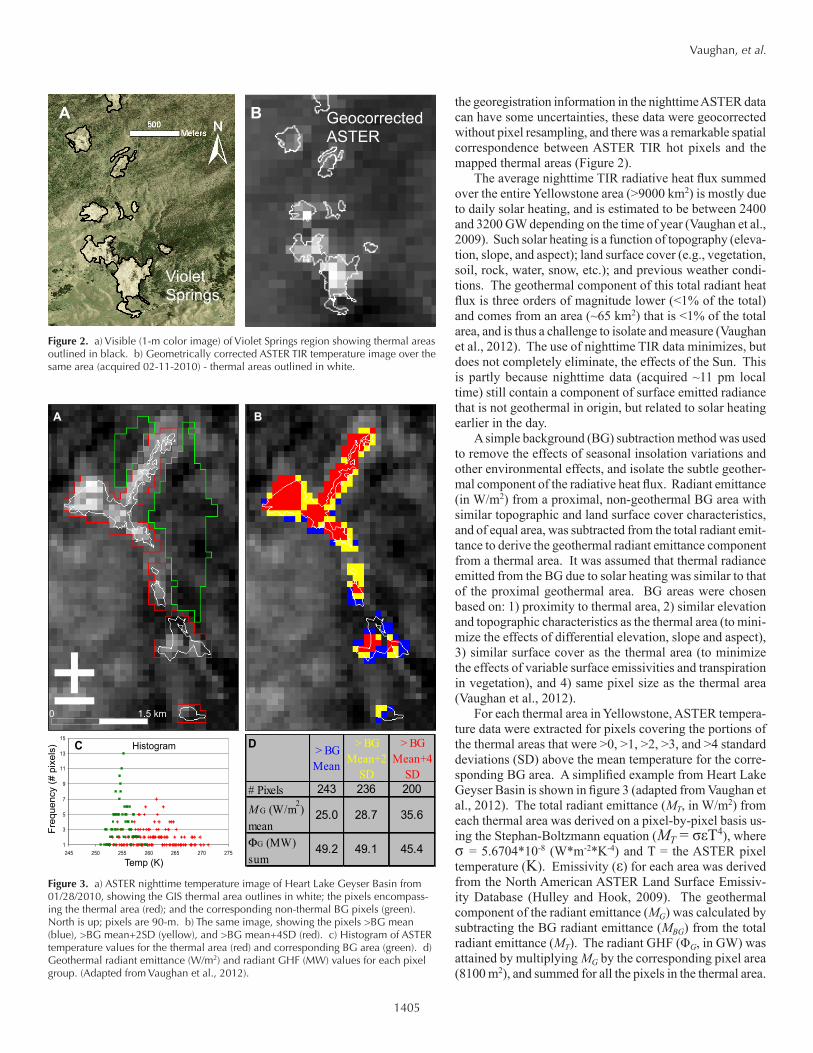
For each thermal area in Yellowstone, ASTER tempera-ture data were extracted for pixels covering the portions of the thermal areas that were >0, >1, >2, >3, and >4 standard deviations (SD) above the mean temperature for the corre-sponding BG area. A simplified example from Heart Lake Geyser Basin is shown in figure 3 (adapted from Vaughan et al., 2012). The total radiant emittance (MT, in W/m2) from each thermal area was derived on a pixel-by-pixel basis us-ing the Stephan-Boltzmann equation (MT = σεT4), where σ = 5.6704*10-8 (W*m-2*K-4) and T = the ASTER pixel temperature (K). Emissivity (ε) for each area was derived from the North American ASTER Land Surface Emissiv-ity Database (Hulley and Hook, 2009). The geothermal component of the radiant emittance (MG) was calculated by subtracting the BG radiant emittance (MBG) from the total radiant emittance (MT). The radiant GHF (ΦG, in GW) was attained by multiplying MG by the corresponding pixel area (8100 m2), and summed for all the pixels in the thermal area.
Figure 2. a) Visible (1-m color image) of Violet Springs region showing thermal areas outlined in black. b) Geometrically corrected ASTER TIR temperature image over the same area (acquired 02-11-2010) - thermal areas outlined in white.
Violet Springs
Geocorrected ASTER
A B
1
3
5
7
9
11
13
15
245 250 255 260 265 270 275
Temp (K)
Histogram
Freq
uenc
y (#
pix
els)
A B
C
± 0 1.5 km
> BG Mean
> BG Mean+2
SD
> BG Mean+4
SD# Pixels 243 236 200
M G (W/m2) mean
25.0 28.7 35.6
G (MW) sum
49.2 49.1 45.4
D
Figure 3. a) ASTER nighttime temperature image of Heart Lake Geyser Basin from 01/28/2010, showing the GIS thermal area outlines in white; the pixels encompass-ing the thermal area (red); and the corresponding non-thermal BG pixels (green). North is up; pixels are 90-m. b) The same image, showing the pixels >BG mean (blue), >BG mean+2SD (yellow), and >BG mean+4SD (red). c) Histogram of ASTER temperature values for the thermal area (red) and corresponding BG area (green). d) Geothermal radiant emittance (W/m2) and radiant GHF (MW) values for each pixel group. (Adapted from Vaughan et al., 2012).
1406
Vaughan, et al.
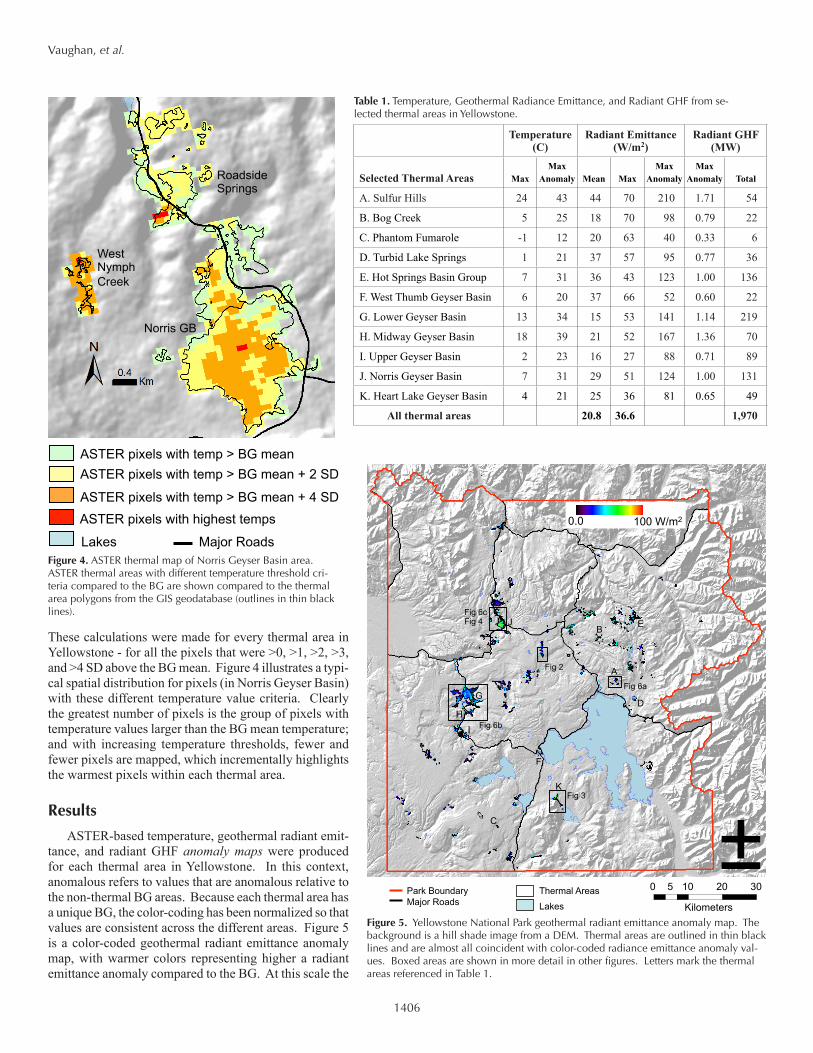
These calculations were made for every thermal area in Yellowstone - for all the pixels that were >0, >1, >2, >3, and >4 SD above the BG mean. Figure 4 illustrates a typi-cal spatial distribution for pixels (in Norris Geyser Basin) with these different temperature value criteria. Clearly the greatest number of pixels is the group of pixels with temperature values larger than the BG mean temperature; and with increasing temperature thresholds, fewer and fewer pixels are mapped, which incrementally highlights the warmest pixels within each thermal area.
Results
ASTER-based temperature, geothermal radiant emit-tance, and radiant GHF anomaly maps were produced for each thermal area in Yellowstone. In this context, anomalous refers to values that are anomalous relative to the non-thermal BG areas. Because each thermal area has a unique BG, the color-coding has been normalized so that values are consistent across the different areas. Figure 5 is a color-coded geothermal radiant emittance anomaly map, with warmer colors representing higher a radiant emittance anomaly compared to the BG. At this scale the
Norris GB
West Nymph Creek
Roadside Springs
ASTER pixels with temp > BG mean
Lakes
ASTER pixels with temp > BG mean + 2 SD
ASTER pixels with temp > BG mean + 4 SD ASTER pixels with highest temps
Major Roads
Table 1. Temperature, Geothermal Radiance Emittance, and Radiant GHF from se-lected thermal areas in Yellowstone.
Temperature
(C) Radiant Emittance
(W/m2)Radiant GHF
(MW)
Selected Thermal Areas MaxMax
Anomaly Mean MaxMax
AnomalyMax
Anomaly Total
A. Sulfur Hills 24 43 44 70 210 1.71 54
B. Bog Creek 5 25 18 70 98 0.79 22
C. Phantom Fumarole -1 12 20 63 40 0.33 6
D. Turbid Lake Springs 1 21 37 57 95 0.77 36
E. Hot Springs Basin Group 7 31 36 43 123 1.00 136
F. West Thumb Geyser Basin 6 20 37 66 52 0.60 22
G. Lower Geyser Basin 13 34 15 53 141 1.14 219
H. Midway Geyser Basin 18 39 21 52 167 1.36 70
I. Upper Geyser Basin 2 23 16 27 88 0.71 89
J. Norris Geyser Basin 7 31 29 51 124 1.00 131
K. Heart Lake Geyser Basin 4 21 25 36 81 0.65 49
All thermal areas 20.8 36.6 1,970
Figure 4. ASTER thermal map of Norris Geyser Basin area. ASTER thermal areas with different temperature threshold cri-teria compared to the BG are shown compared to the thermal area polygons from the GIS geodatabase (outlines in thin black lines).
Thermal Areas
Lakes
Park Boundary Major Roads
0.0 100 W/m2
Fig 6a
Fig 6b
Fig 6c Fig 4
± 0 10 20 30 5
Kilometers
Fig 2
Fig 3
A
B
C
D
E
F
G
H I
J
K
Figure 5. Yellowstone National Park geothermal radiant emittance anomaly map. The background is a hill shade image from a DEM. Thermal areas are outlined in thin black lines and are almost all coincident with color-coded radiance emittance anomaly val-ues. Boxed areas are shown in more detail in other figures. Letters mark the thermal areas referenced in Table 1.
1407
Vaughan, et al.
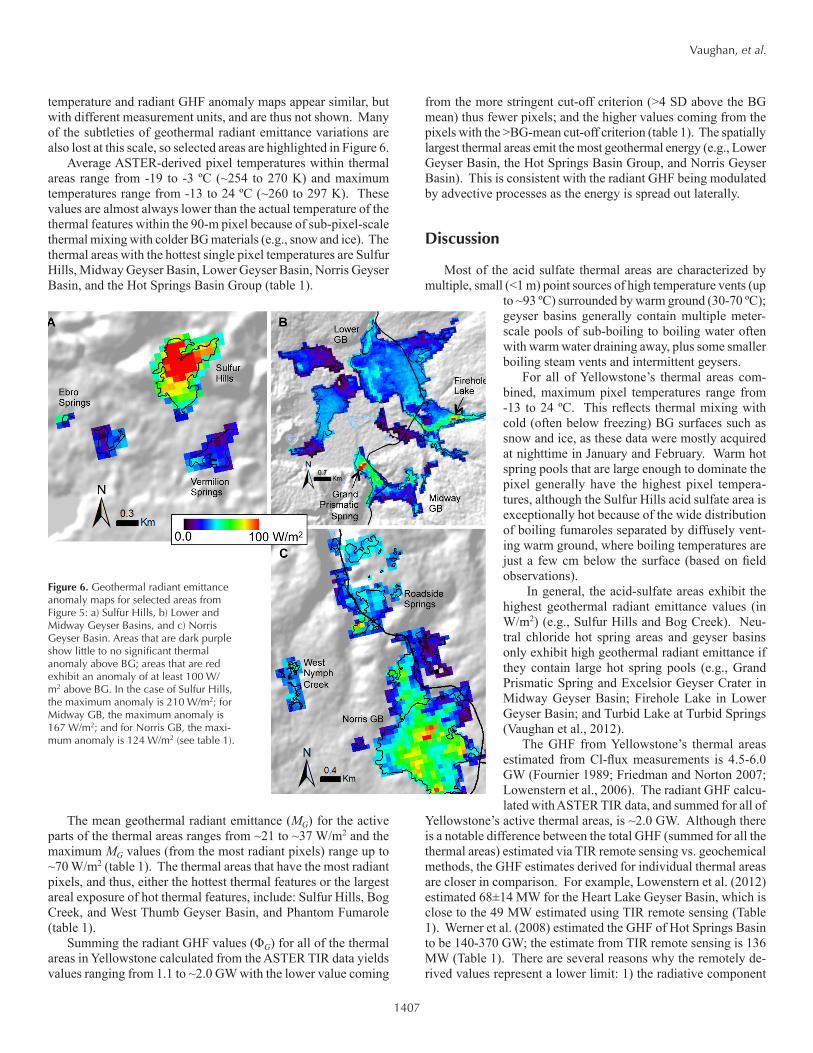
temperature and radiant GHF anomaly maps appear similar, but with different measurement units, and are thus not shown. Many of the subtleties of geothermal radiant emittance variations are also lost at this scale, so selected areas are highlighted in Figure 6.
Average ASTER-derived pixel temperatures within thermal areas range from -19 to -3 ºC (~254 to 270 K) and maximum temperatures range from -13 to 24 ºC (~260 to 297 K). These values are almost always lower than the actual temperature of the thermal features within the 90-m pixel because of sub-pixel-scale thermal mixing with colder BG materials (e.g., snow and ice). The thermal areas with the hottest single pixel temperatures are Sulfur Hills, Midway Geyser Basin, Lower Geyser Basin, Norris Geyser Basin, and the Hot Springs Basin Group (table 1).
The mean geothermal radiant emittance (MG) for the active parts of the thermal areas ranges from ~21 to ~37 W/m2 and the maximum MG values (from the most radiant pixels) range up to ~70 W/m2 (table 1). The thermal areas that have the most radiant pixels, and thus, either the hottest thermal features or the largest areal exposure of hot thermal features, include: Sulfur Hills, Bog Creek, and West Thumb Geyser Basin, and Phantom Fumarole (table 1).
Summing the radiant GHF values (ΦG) for all of the thermal areas in Yellowstone calculated from the ASTER TIR data yields values ranging from 1.1 to ~2.0 GW with the lower value coming
from the more stringent cut-off criterion (>4 SD above the BG mean) thus fewer pixels; and the higher values coming from the pixels with the >BG-mean cut-off criterion (table 1). The spatially largest thermal areas emit the most geothermal energy (e.g., Lower Geyser Basin, the Hot Springs Basin Group, and Norris Geyser Basin). This is consistent with the radiant GHF being modulated by advective processes as the energy is spread out laterally.
Discussion
Most of the acid sulfate thermal areas are characterized by multiple, small (<1 m) point sources of high temperature vents (up
to ~93 ºC) surrounded by warm ground (30-70 ºC); geyser basins generally contain multiple meter-scale pools of sub-boiling to boiling water often with warm water draining away, plus some smaller boiling steam vents and intermittent geysers.
For all of Yellowstone’s thermal areas com-bined, maximum pixel temperatures range from -13 to 24 ºC. This reflects thermal mixing with cold (often below freezing) BG surfaces such as snow and ice, as these data were mostly acquired at nighttime in January and February. Warm hot spring pools that are large enough to dominate the pixel generally have the highest pixel tempera-tures, although the Sulfur Hills acid sulfate area is exceptionally hot because of the wide distribution of boiling fumaroles separated by diffusely vent-ing warm ground, where boiling temperatures are just a few cm below the surface (based on field observations).
In general, the acid-sulfate areas exhibit the highest geothermal radiant emittance values (in W/m2) (e.g., Sulfur Hills and Bog Creek). Neu-tral chloride hot spring areas and geyser basins only exhibit high geothermal radiant emittance if they contain large hot spring pools (e.g., Grand Prismatic Spring and Excelsior Geyser Crater in Midway Geyser Basin; Firehole Lake in Lower Geyser Basin; and Turbid Lake at Turbid Springs (Vaughan et al., 2012).
The GHF from Yellowstone’s thermal areas estimated from Cl-flux measurements is 4.5-6.0 GW (Fournier 1989; Friedman and Norton 2007; Lowenstern et al., 2006). The radiant GHF calcu-lated with ASTER TIR data, and summed for all of
Yellowstone’s active thermal areas, is ~2.0 GW. Although there is a notable difference between the total GHF (summed for all the thermal areas) estimated via TIR remote sensing vs. geochemical methods, the GHF estimates derived for individual thermal areas are closer in comparison. For example, Lowenstern et al. (2012) estimated 68±14 MW for the Heart Lake Geyser Basin, which is close to the 49 MW estimated using TIR remote sensing (Table 1). Werner et al. (2008) estimated the GHF of Hot Springs Basin to be 140-370 GW; the estimate from TIR remote sensing is 136 MW (Table 1). There are several reasons why the remotely de-rived values represent a lower limit: 1) the radiative component
Figure 6. Geothermal radiant emittance anomaly maps for selected areas from Figure 5: a) Sulfur Hills, b) Lower and Midway Geyser Basins, and c) Norris Geyser Basin. Areas that are dark purple show little to no significant thermal anomaly above BG; areas that are red exhibit an anomaly of at least 100 W/m2 above BG. In the case of Sulfur Hills, the maximum anomaly is 210 W/m2; for Midway GB, the maximum anomaly is 167 W/m2; and for Norris GB, the maxi-mum anomaly is 124 W/m2 (see table 1).
1408
Vaughan, et al.
represents only a portion of the total GHF, 2) much geothermal heat from depth is lost (i.e., not measureable with TIR remote sensing) through evaporative cooling, steam interference, heat transfer to the atmosphere, advection of hot water at the surface or at depth (leading to a spatially broad, but undetectable increase in surface temperature within the proximal BG areas). However, despite these uncertainties, for detecting geothermal changes that may be related either to an impending eruption or to other significant environmental changes, regular satellite-based TIR measurements of these thermal characteristics may be the most relevant and use-ful measurements to make in this regard, particularly with a good characterization of Yellowstone’s thermal areas.
Conclusions and Future Directions
There are currently no measurement techniques that regularly provide a direct measurement of the total GHF from the Yellow-stone geothermal system and how it varies on different temporal and spatial scales. Satellite-based TIR measurements that provide synoptic observations at a variety of temporal and spatial scales are well-suited to overcome these challenges provided we un-derstand the limitations. While remote TIR measurements may provide only a lower limit estimate of GHF, we argue that this estimate is one that can be derived and monitored consistently, regularly, and nearly simultaneously over the entire Yellowstone geothermal system. These measurements can be sensitive to subtle changes that may be related to volcanic, tectonic, or hydrothermal processes, or human activities, for both volcano / geothermal monitoring. The possibility of using these data and techniques for geothermal exploration applications has potential and remains to be investigated.
In general, satellite TIR measurements of thermal areas are one of many important tools we have for identifying, monitoring, and potentially forecasting, volcanic and geothermal activity around the world. High spatial resolution measurements (<100 m pixels) are also useful for exploring and monitoring geothermal features that are too subtle to be clearly detected by the more abundant coarser resolution satellite TIR data.
This work also establishes a procedural framework for the remote characterization of subtle geothermal features and regu-lar thermal monitoring of Yellowstone, as well as for exploring volcanic / geothermal features on a global scale. The simplified nature of these methods lends itself to the potential for automated data processing, and these methods can be applied to TIR measure-ments made by future Earth observing satellite missions that are now being planned to follow and improve upon the aging satellite instruments that are currently being used.
Acknowledgements
This work was carried out at the USGS Astrogeology Science Center in Flagstaff, AZ, with support from the USGS Volcano Hazards Program, Yellowstone Volcano Observatory, and the NASA ROSES New Investigator Program in Earth Sciences. Many thanks to: Trent Hare, Fred Kruse, Candi Kruse, Betsy Littlefield, Dan Mahony, Leon Maldonado, Dave Pieri, Richard Vaughan, and Rick Wessels. Also thanks to Chris Okubo, Colin Dundas, and Janet Richie for internal reviews.
References
Christiansen RL (2001) The Quaternary and Pliocene Yellowstone Plateau Volcanic Field of Wyoming, Idaho, and Montana. U.S. Geological Survey Professional Paper 729-G, 145 pp.
Davies, A.G., Calkins, J., Scharenbroich, L., Vaughan, R.G., Wright, R., Kyle, P., Castańo, R., Chien, S., and Tran, D. (2008) Multi-instrument Remote and in situ Observations of the Erebus Volcano (Antarctica) Lava Lake in 2005: a Comparison with the Pele Lava Lake on the Jovian Moon Io. Journal of Volcanology and Geothermal Research, 177(3), 705–724.
Ellis, A.J. and Wilson, S.H. (1955) The Heat from the Wairakei-Taupo Thermal Region Calculated from the Chloride Output, New Zealand Journal of Science and Technology, B, 36, 622-631.
Fournier, R.O., White, D.E., and Truesdell, A.H. (1976) Convective Heat Flow in Yellowstone National Park. In: Proceedings of the 2nd U.N. Symposium on the Development and Use of Geothermal Resources, San Francisco, 731-739.
Fournier, R.O. (1989) Geochemistry and Dynamics of the Yellowstone Na-tional Park Hydrothermal System. Annual Review of Earth and Planetary Sciences, 17, 13-53.
Friedman, I. and Norton, D.R. (2007) Is Yellowstone Losing its Steam? Chloride Flux out of Yellowstone National Park. In: Morgan, L.A. (ed.) Integrated Geoscience Studies in the Greater Yellowstone Area: Volcanic, Hydrothermal and Tectonic Processes in the Yellowstone Geoecosystem. U.S. Geological Survey Professional Paper 1717, 271-298.
Harris, A.J.L. and Stevenson, D.S. (1997) Thermal Observations of Degassing Open Conduits and Fumaroles at Stromboli and Vulcano using Remotely Sensed Data. Journal of Volcanology and Geothermal Research, 76, 175–198.
Harris, A.J.L., Wright, R., and Flynn, L.P. (1999) Remote Monitoring of Mount Erebus Volcano, Antarctica, Using Polar Orbiters: Progress and Prospects. International Journal of Remote Sensing, 20, 3051–3071.
Heasler, H.P., Jaworowski, C., and Foley, D. (2009) Geothermal Systems and Monitoring Hydrothermal Features. In Young, R., and Norby, L., eds., Geological Monitoring: Boulder CO, Geological Society of America, 105-140.
Hulley, G.C. and Hook, S.J. (2009) The North American ASTER Land Sur-face Emissivity Database (NAALSED) Version 2.0., Remote Sensing of Environment, 113, 1967-1975.
Hurwitz, S., Lowenstern, J.B., and Heasler, H. (2007) Spatial and Temporal Geochemical Trends in the Hydrothermal System of Yellowstone National Park: Inferences from River Solute Fluxes: Journal of Volcanology and Geothermal Research, v.162, p. 149-171.
Ingebritsen, S.E., Galloway, D.L., Colvard, E.M., Sorey, M.L., and Mariner, R.H. (2001) Time-Variation of Hydrothermal Discharge at Selected Sites in the Western United States: Implications for Monitoring: Journal of Volcanology and Geothermal Research, 111, 1-23.
Jaworowski, C., Heasler, H.P., Neale, C.M.U. and Sivarajan, S. (2010) Using Thermal Infrared Imagery and LiDAR in Yellowstone Geyser Basins. Yellowstone Science, 18(1), 8-19.
Lowenstern, J.B., Smith, R.B., and Hill, D.P. (2006) Monitoring Super-volcanoes: Geophysical and Geochemical Signals at Yellowstone and Other Large Caldera Systems. Philosophical Transactions of the Royal Society, A364, 2055-2072.
Lowenstern, J.B. and Hurwitz, S. (2008) Monitoring a Supervolcano in Repose: Heat and Volatile Flux at the Yellowstone Caldera. Elements, 4, 35-40.
Lowenstern, J.B., Bergfeld, D., Evans, W.C., and Hurwitz, S. (2008) Gen-eration and Evolution of Hydrothermal Fluids at Yellowstone: Insights from the Heart Lake Geyser Basin. Geochemistry, Geophysics, and Geosystems, 13(1), 20 pp.
Neale, C.M.U., Sivarajan, S., Masih, A., Jaworowski, C., and Heasler, H. (2011) Estimating Heat Flow of Thermal Features in Yellowstone Na-
1409
Vaughan, et al.
tional Park Using Airborne Thermal Infrared Remote Sensing, American Geophysical Union, Fall Meeting 2011, abstract #H51C-1225.
Oppenheimer, C. (1993) Infrared Surveillance of Crater Lakes Using Satellite Data. Journal of Volcanology and Geothermal Research, 55, 117-128.
Pieri, D.C. and Abrams, M.J. (2005) ASTER Observations of Thermal Anoma-lies Preceding the April 2003 Eruption of Chikurachki Volcano, Kurile Islands, Russia. Remote Sensing of Environment, 99, 84–94.
Trunk, L. and Bernard, A. (2008) Investigating Crater Lake Warming Us-ing ASTER Thermal Imagery: Case Studies at Ruapehu, Poás, Kawah Ijen, and Copahué Volcanoes. Journal of Volcanology and Geothermal Research, 178, 259–270.
Vaughan, R.G. and Hook, S.J. (2006) Using Satellite Data to Characterize the Temporal Thermal Behavior of an Active Volcano: Mount St. Helens, WA. Geophysical Research Letters, 33, L20303. doi:10.1029/2006GL027957.
Vaughan, R.G., Keszthelyi, L.P., Heasler, H., Jaworowski, C., Lowenstern, J.B., and Schneider, D.J., 2009. Thermal Infrared Remote Sensing of the Yellowstone Geothermal System. American Geophysical Union, Fall Meeting 2009, abstract #V21B-1993.
Vaughan, R.G., Keszthelyi, L.P., Davies, A.G., Schneider, D.J., Jaworowski, C., Heasler, H. (2010) Exploring the Limits of Identifying Sub-pixel
Thermal Features using ASTER TIR Data. Journal of Volcanology and Geothermal Research, 189(3-4), 225-237.
Vaughan, R.G., Keszthelyi, L.P., Lowenstern, J.B., Jaworowski, C., Heasler, H. (2012) Use of ASTER and MODIS Thermal Infrared Data to Quantify Heat Flow and Hydrothermal Change at Yellowstone National Park. Journal of Volcanology and Geothermal Research, In Press.
Watson, R.G.R., Lockwood, R.E., Newman, W.B., Anderson, T.N., and Gar-rott, R.A. (2008) Development and Comparison of Landsat Radiometric and Snowpack Model Inversion Techniques for Estimating Geothermal Heat Flux. Remote Sensing of Environment, 112, 471-481.
Werner, C., Hurwitz, S., Evans, W.C., Lowenstern, J.B., Bergfeld, D., Heasler, H., Jaworowski, C., and Hunt, A. (2008) Volatile Emissions and Gas Geochemistry of Hot Spring Basin, Yellowstone National Park, USA. Journal of Volcanology and Geothermal Research, 178, 751–762.
White, D.E., Fournier, R.O., Muffler, L.J.P., and Truesdell, A.H. (1975) Physi-cal Results of Research Drilling in Thermal Areas of Yellowstone National Park, Wyoming. U.S. Geological Survey Professional Paper, 1456, 84 p.
Yamaguchi, Y., Kahle, A.B., Tsu, H., Kawakami, T., Pniel, M. (1998) Overview of Advanced Spaceborne Thermal Emission and Reflection Radiometer (ASTER). IEEE Transactions on Geoscience and Remote Sensing, 36(4), 1062-1071.

1410