
Mapping Moderate Depth Habitats of the U.S. Pacifi c...
23
Mapping Moderate Depth Habitats of the U.S. Pacific Islands with Emphasis on the Northwestern Hawaiian Islands: an Implementation Plan About this Document This Mapping Implementation Plan (MIP) presents a comprehensive framework for the development of moderate depth (~20–200fm) bathymetric and habitat maps of the Northwestern Hawaiian Islands (NWHI). It also discusses the need to develop similar bathymetric and habitat maps for the main Hawaiian Islands and U.S.-affiliated Pacific Islands (American Samoa, Guam, and the Northern Marianas). The plan has been developed with extensive input from the National Marine Fisheries Service–Pacific Islands Fisheries Science Center (PIFSC), the Western Pacific Regional Fisheries Management Council (WPRFMC), the office of the Northwestern Hawaiian Islands Coral Reef Ecosystem Reserve (CRER), and the National Ocean Serviceʼs Office of the Coast Survey (OCS). This MIP has been developed to complement the Coral Reef Mapping Implementation Plan (2 nd Draft) released in 1999 by the U.S. Coral Reef Task Forceʼs Mapping and Information Synthesis Working Group. While recognizing the need to produce bathymetry and habitat maps of deepwater areas, that Plan focused on using remote sensing technologies, such as aerial photography and satellite imagery, to map the shallow- water (< 20 fm) areas of the U.S. The completion of the mapping activities described in both this MIP and the 1999 Plan will result in comprehensive, detailed maps of all U.S. coral reef ecosystems. Before the NWHI portion of this MIP can be finalized, further input will be needed to address the overlapping mapping requirements of other organizations, especially the Hawaii Department of Land and Natural Resources, the U.S. Fish and Wildlife Service, and the University of Hawaii. Some of that input was obtained at the recently held “Information Needs for Conservation and Management: A Workshop on the Northwestern Hawaiian Islands.” Once available, the results of that workshop, held on 13-15 May 2003 in Hawaii and attended by over 100 people, will be incorporated into this MIP. Before the main Hawaiian Islands and U.S.-affiliated Pacific Islands portion of this MIP is finalized, input will be needed from organizations responsible for managing and conserving the coral reef ecosystems of Hawaii, American Samoa, Guam, and the Northern Marianas. Input will be obtained through review of this draft MIP and ongoing discussions related to bathymetric and habitat mapping priorities in these areas. This MIP presents a framework for mapping the U.S. Pacific region and should be considered an evolving document. As priorities change, funding varies, new data are collected, and Version 2 August 2003 1
Transcript of Mapping Moderate Depth Habitats of the U.S. Pacifi c...

Mapping Moderate Depth Habitats of the U.S. Pacifi c Islandswith Emphasis on the Northwestern Hawaiian Islands:
an Implementation Plan
About this Document
This Mapping Implementation Plan (MIP) presents a comprehensive framework for the development of moderate depth (~20–200fm) bathymetric and habitat maps of the Northwestern Hawaiian Islands (NWHI). It also discusses the need to develop similar bathymetric and habitat maps for the main Hawaiian Islands and U.S.-affi liated Pacifi c Islands (American Samoa, Guam, and the Northern Marianas). The plan has been developed with extensive input from the National Marine Fisheries Service–Pacifi c Islands Fisheries Science Center (PIFSC), the Western Pacifi c Regional Fisheries Management Council (WPRFMC), the offi ce of the Northwestern Hawaiian Islands Coral Reef Ecosystem Reserve (CRER), and the National Ocean Serviceʼs Offi ce of the Coast Survey (OCS).
This MIP has been developed to complement the Coral Reef Mapping Implementation Plan (2nd Draft) released in 1999 by the U.S. Coral Reef Task Forceʼs Mapping and Information Synthesis Working Group. While recognizing the need to produce bathymetry and habitat maps of deepwater areas, that Plan focused on using remote sensing technologies, such as aerial photography and satellite imagery, to map the shallow-water (< 20 fm) areas of the U.S. The completion of the mapping activities described in both this MIP and the 1999
Plan will result in comprehensive, detailed maps of all U.S. coral reef ecosystems.
Before the NWHI portion of this MIP can be fi nalized, further input will be needed to address the overlapping mapping requirements of other organizations, especially the Hawaii Department of Land and Natural Resources, the U.S. Fish and Wildlife Service, and the University of Hawaii. Some of that input was obtained at the recently held “Information Needs for Conservation and Management: A Workshop on the Northwestern Hawaiian Islands.” Once available, the results of that workshop, held on 13-15 May 2003 in Hawaii and attended by over 100 people, will be incorporated into this MIP.
Before the main Hawaiian Islands and U.S.-affi liated Pacifi c Islands portion of this MIP is fi nalized, input will be needed from organizations responsible for managing and conserving the coral reef ecosystems of Hawaii, American Samoa, Guam, and the Northern Marianas. Input will be obtained through review of this draft MIP and ongoing discussions related to bathymetric and habitat mapping priorities in these areas.
This MIP presents a framework for mapping the U.S. Pacifi c region and should be considered an evolving document. As priorities change, funding varies, new data are collected, and
Version 2August 2003
1

new technologies become available, the information presented herein will change.
Some Defi nitions
Several general categories of mapping data or products are used in this MIP and brief descriptions of these are provided. Also, various technical phrases are used when discussing the acquisition and processing of data to produce bathymetry and associated habitat maps. These are presented below.
—Bathymetric Maps: Maps that provide information about the depth of water in a water body.
—Bathymetric Data: Digital data measuring water depth collected by remote sensing technologies, such as multibeam sonar, single-beam sonar, LIDAR (Light Detection and Ranging) and satellite imagery.
—Imagery Data: Digital data that provide an indirect indication of the character of the seafl oor. Sources of imagery data include backscatter data from multibeam sonar systems, side-scan sonar data, and other remotely sensed data, such as satellite or airborne imagery.
—Optical Observation Imagery: Information that represents direct observation of the seafl oor and can be used to directly characterize the features found on the seafl oor. When combined with bathymetric data and imagery data, optical observation imagery can be used to develop benthic habitat maps. Sources of optical observation imagery include Remotely operated vehicles (ROVs), Autonomous Underwater Vehicles (AUVs), manned submersibles, Laser Line Scanning (LLS) technologies, drop cameras, and SCUBA divers. These optical validation data are important for producing benthic habitat maps.
—Benthic Habitat Maps: Maps that provide information about the area or environment where an organism or ecological community normally lives or occurs.
—Multibeam data: multibeam swath bathymetry data; multibeam acoustic data; multibeam sonar data.
—Backscatter data: multibeam backscatter data; multibeam backscatter swath data; backscatter acoustic data; backscatter sonar data.
Why Map?
Bathymetric data are needed throughout the NWHI to a depth of ~500 fm (~910 m), while habitat maps are needed throughout the NWHI to a depth of ~200 fm (~370 m). Similar requirements exist for the main Hawaiian Islands and U.S.-affi liated Pacifi c Islands. NOAA has, in 2003, completed the Bathymetric Atlas of the Northwestern Hawaiian Islands: Bathymetric Atlas of the Northwestern Hawaiian Islands: A Planning Document for Benthic Habitat Mapping–DraftA Planning Document for Benthic Habitat Mapping–Draft. This draft Atlas presents a summary of the currently available sonar and satellite-based bathymetric data available for the NWHI. In 2003, NOAA published the Atlas of Shallow-water Benthic Habitats of the Northwestern Hawaiian Islands–Draft. That Atlas provided estimated depth, as well as detailed habitat maps, for areas where water depth reaches ~10–15 fm. However, a signifi cant portion of the NWHI remains uncharacterized. Table 1 provides some estimates of overall shallow- and deep-water area within the NWHI, main Hawaiian Islands, and the U.S.-affi liated Pacifi c Islands. Estimated areas inside the 10 fm and 100 fm contours were derived from NOAA nautical charts. Estimated areas inside the 1000 fm (~1,830 m) contour were derived from NOAA GEODAS data from the National Geophysical Data Center. Estimates of the area mapped inside and outside the 10 fm isobath for these locations were derived from shallow-water benthic habitat maps recently produced by NOAA. Not all of the area inside the 10 fm isobath was mapped, due primarily to either a lack of imagery or problems with the available imagery (e.g., turbidity, sun glint, clouds, or cloud shadows).
Accurate and, in some cases, detailed bathymetric data and habitat maps are needed in order to support mandated and
A mosaic depicting the extent of multibeam and backscatter data collected during a 25-day mission by the University of Hawaii vessel Kilo Moana in 2002.
2

other critical conservation and management objectives in the NWHI, main Hawaiian Islands, and U.S.-affi liated Pacifi c Islands. For example, the WPRFMC needs these data and maps to: (1) illustrate the extent of essential fi sh habitat (EFH) and habitat areas of particular concern (HAPC) designations; (2) delineate the boundaries of marine protected areas; and (3) display the spatial and temporal distribution of fi shery catch and effort in localized areas.
Other uses of the maps include depicting management and conservation boundaries, characterizing essential marine organism habitat, monitoring the baseline condition of the reef ecosystems and factors affecting their condition, enforcing regulations on fi shing and similar activities and, where applicable, assessing the extent and impact of marine debris on the reefs. In addition, maps will be critical for assessing changes taking place in the reef ecosystems of these areas over time. Finally, the resulting maps also will support other objectives, including the U.S. Coral Reef Task Forceʼs mandate to complete comprehensive coral reef ecosystem maps of the U.S. by 2007. The NOAA Coral Reef Conservation Program, established to support the objectives of the Task Force,
provides a signifi cant portion of the funds used to collect the data and develop the maps described in this plan. A more detailed description of agencies responsible for managing and protecting the NWHI and U.S.-affi liated Pacifi c Islands can be found in Appendix 2.
Mapping Priorities
Table 2 presents a summary, by geographic region, of those depth regimes considered to be most important for bathymetric data acquisition and habitat mapping activities. Priorities range from 1 (high priority) to 4 (low priority). This list of priorities was developed based on input from representatives of the WPRFMC, PIFSC, CRER, American Samoan Government, University of Hawaii, OCS, and NOAA̓ s Offi ce of Ocean Exploration. Input from other organizations, such as the Governments of Hawaii, Guam, and the Northern Marianas, will be incorporated into the table following a review of this document by these organizations.All organizations have identifi ed the acquisition of bathymetric data to a depth of 200 fm (~370 m) as their highest priority. Many also indicate that having habitat maps in water to a depth of 200 fm (~370 m) is a high priority. Also, Congress has expressed an interest in the completion of bathymetric maps of the NWHI for water to 200 fm (~370 m) deep.
Mapping Technologies
Several types of maps are required to meet the needs of the organizations responsible for the conservation and management of the coral reef ecosystems of the NWHI, main Hawaiian Islands, and the U.S.-affi liated Pacifi c Islands, and a suite of technologies will be used to collect the data needed to produce those maps. The platforms on which these technologies are deployed also are important. Some of the technologies, such as active sonar (multibeam/backscatter) instruments, are deployed on small vessels (launches) or ships, depending on the depth of the water being surveyed. LIDAR (Light Detection and Ranging) technologies are deployed on airborne platforms. This MIP will briefl y describe some of these technologies, their deployment, and their strengths and weaknesses for collecting the types of data needed to produce the required maps. Other technologies, such as side-scan sonar, will not be described because their application to support this MIP is limited.
Table 1. Estimates of area, by depth contour, in the Northwestern Hawaiian Islands, main Hawaiian Islands, and U.S.-affi liated Pacifi c Islands. All area estimates are in sq kms. Note: the 1000 fm depth contour for Guam includes both Guam and the Northern Marianas. Contours depicting the 500 fm depth range are not available for all areas. As a result, area within the 1000 fm contour is provided as a reference.
area area areainside inside inside
1000 fm 100 fm 10 fmcontour contour contour
NWHI 60,143 13,708 1,541main Hawaiian Islands 37,494 6,666 1,233Am. Samoa 1,610 464 54Guam 30,555 203 91Northern Marianas (see Guam) 476 124Remote Pacifi c Islands N/A 436 252
Table 2. Mapping priorities, based on depth regime, for the U.S. Pacifi c. Priorities range from 1 (high priority) to 4 (low priority).
map map map mapinside inside inside outside
0–10 fm 10–100 fm 100–200 fm 200 fmisobath isobath isobath isobath
NWHI 2 1 1 4main Hawaiian Islands 2 1 1 4American Samoa 2 1 1 4Guam 2 1 1 4Northern Marianas 2 1 1 4Remote Pacifi c Islands 3 2 3 4
3

Sonar Technology
Active sonar instruments are based on the principle of emitting sound and detecting echoes returned from seafl oor features. Multibeam sonars have many sending and receiving transducers that provide up to 150 highly accurate and precisely located measurements of water depth spread over the swath of the instrument beneath the vessel. The information from sonar technologies that is useful for producing bathymetry and benthic habitat maps falls into two basic categories—time and intensity of the echo.
Water depth is determined by measuring the time required for an underwater sound wave to refl ect off the seafl oor and return to the sonar instrument, and the angle of the sound wave as it leaves the sonar instrument. The intensity of the returned echo also has valuable information. The strength of the echo that gets bounced off the seafl oor, termed “backscatter,” is a function of the incident angle of the initial sound pulse, the roughness or surface characteristics of the sea fl oor (e.g., coral, sand, or seagrass), and the composition or density of the bottom (e.g., rock or mud).
By understanding those bottom features that correspond to specifi c depth and backscatter signatures, it is possible to create benthic maps. This is typically done by collecting multibeam and backscatter sonar data over a region of interest and piecing together the various track lines into a sonar “image mosaic.” The specifi c types and number of categories of benthic features that can be mapped are a function of the sound frequencies of the sonar instruments used, the spatial resolution of the data collection, and the characteristics of the bottom. Generally, sonar mapping can produce maps having between three and six (3–6) habitat classes (e.g., soft bottom; hard bottom; high relief; low relief).
Multibeam and backscatter data can be collected simultaneously using the same active sonar instrument. As mentioned earlier, these instruments generally are deployed on vessels. The depth of the water to be surveyed determines the size of the vessel and the specifi c characteristics of instrument deployed. Smaller vessels are used in shallow water; larger vessels are used in deeper water. High frequency multibeam and backscatter instruments are typically used to measure shallow water depths; Low frequency instruments are used to measure deeper water depths. When collecting multibeam and backscatter data, the general rule of thumb is that the width of the swath is approximately equal to three times the depth of the water. For example, if the water is 10 fm (~18 m), the swath width is 30 fm (~55 m). If the water depth is 200 fm (~366 m), the swath width is 600 fm (~1,100 m). When collecting data, the typical speed of the vessel is 5–10 knots (~9.2–18.5 km/hr). Multibeam and backscatter data collection instruments can collect data up to 7.5 times the depth of the water. Most data collection activities assume that the swath width is between 3 and 5 times the depth of the water.
Once the data are acquired, post-processing of the data is conducted. Some of this processing, such as corrections of the multibeam data for sound velocity, pitch, roll, heave, tide, and ship draft is conducted aboard the ship. Other processing, such
Table 3. Cost estimates for gathering and initial shipboard processing of multibeam and backscatter data. These estimates assume the following: IHO Level 2 data will be collected; the ship is traveling at 10 km/hr.; the ship costs $30,000/day; the ship collects data for 10 hr/day; and the swath width is fi ve (5) times the depth of the water. All computations were made using a 100 sq km (10,000 m X 10,000 m) area of interest. Estimates of the cost of post-processing of data are based on a cost of ~$1,000/day and two (2) days is required to process one (1) day of multibeam data.
map map map map0–10 fm 10–100 fm 100 fm 100–1000 fm(0–18 m) (18–183 m) (183 m) (183–1,830 m)
depthdepth depthdepth depthdepth depthdepthaverage water depth (m) 15 50 183 350swath width (m) 75 250 915 1750number of swaths required 134 40 11 6number of hours required 134 40 11 6number of days required 14 4 2 1total cost $420,000 $120,000 $60,000 $30,000cost per sq km. $4,200 $1,200 $600 $300post processing cost (per day) $1,000 $1,000 $1,000 $1,000cost to post-process data $22,000 $8,000 $4,000 $2,000
These estimates do not include any vessel mobilization and demobilization costs or the costs of time at sea during bad weather (which could reduce or halt data collection. Swath width can range from 3X to 7.5X the water depth.
4

as the removal of artifacts (anomalies in the data) or biases in the multibeam data is completed once the ship returns to port. Similar processing is performed on the backscatter data. Additional processing may be required if anomalies, such as along-line stripping, are found in the backscatter data.
Several references are available that provide estimates of the cost to collect multibeam and backscatter and, in some cases, side-scan sonar data. These references tend to support the estimates found in Table 3. Evans et al. determined that the collection of multibeam and backscatter data with side-scan sonar for three locations in the Gulf of Mexico cost an average of $4,900/sq km. NOAA Fisheries spent about $350,000 (~$310/sq km) to collect multibeam data over about 1,130 sq km of 100 m deep water in the Gulf of Mexico. Axelsson and Alfredsson report that the acquisition of Order 2 multibeam data in water 8 m deep costs an estimated $6,620/sq km. Similar data in water 16 m deep costs an estimated $1,939/sq km. Order 2 multibeam data collection in water 150 m deep costs an estimated $150 sq km.
Using the cost estimates presented in Table 3 and the area estimates presented in Table 1, the following table provides
very rough estimates of the cost to complete the collection of bathymetric data within the 10–100 fm (18–183 m) isobaths for areas in the U.S. Pacifi c.
In Table 4, the estimated percentages of area remaining to be mapped are very rough approximations. While considerable multibeam mapping was recently completed in the NWHI, no estimates of the actual area characterized are available at this time. For the other areas, inventories of available bathymetric data have not been completed. As inventories are completed and bathymetric data collection activities are quantifi ed, Table 4 will be updated.
Table 5 (please see the next page) presents very rough estimates of the cost to complete the collection of bathymetric data within the 10 fm (18 m) isobaths for areas in the U.S. Pacifi c.
LIDAR Technology
LIDAR is an acronym for Light Detection and Ranging, which is the science of using a laser to measure distances to specifi c points. Airborne LIDAR systems direct a short pulse of laser
Table 4. Estimated cost to map the area inside the 10–100 fm depth areas of the U.S. Pacifi c. The cost values presented could overestimate or underestimate actual costs by 25 percent or more. Please see explanatory notes provided with Table 4.
estimated estimated estimatedcost estimated area percent
to map area inside of area10–100 fm inside 10–100 fm remaining
isobath 10–100 fm remaining to be estimated($/sq km)($/sq km) isobath to be mappedto be mapped mappedmapped cost
NWHI $1,200 12,167 10,357 85 $12,428,000main Hawaiian Is. $1,200 5,430 4,890 90 $5,868,000Am. Samoa $1,200 410 369 90 $443,000Guam and N. Marianas $1,200 464 418 90 $502,000
In Table 4, the area inside 10–100 fm isobath is computed by subtracting the area inside the 10 fm isobath from the area inside the 100 fm isobath, as shown in Table 1. For example, in the NWHI, 13,708 sq km are inside the 100 fm isobath and 1,541 sq km are inside the 10 fm isobath. The area inside the 10–100 fm isobath equals 13,708 minus 1,541, or 12,167 sq km. Multibeam data have been collected for an estimated 1,810 sq km of reef area in water less than 100 fm in the NWHI. For this analysis, the estimated depth information derived from IKONOS satellite imagery was not included. Also, no data processing costs are included in these estimates. Generally, for every data spent collecting day, two days are needed to process the collected data.
5

light from an aircraft toward the surface below. Bathymetric LIDAR measures the distance to the surface of the water and the distance to the bottom of the water body. The difference between these two measurements is the depth of the water. The LIDAR return signal does not, however, provide information about the composition of the bottom and it is this information that is important for creating benthic habitat maps.
LIDAR technologies typically are deployed on aircraft. Depending on the type of data needed (i.e., the sounding density, swath width, and swath overlap), the aircraft fl ies at 140–210 kts (260–390 km/hr). In clear water, LIDAR can gather bathymetry data to depths of ~20–35 fm (~35–65 m). Turbidity, clouds, and sea state can affect the ability of the LIDAR technology to map the sea fl oor.Airborne LIDAR costs in very shallow water (0–15 fm) have been shown to be 25% to 50% of multibeam costs. However, the cost advantage decreases as water depth increases (Axelsson, R. and Alfredsson, Capacity and Capability for Hydrographic Missions, Saab Dynamics AB). In addition,
costs increase signifi cantly for deployment (mobilization and demobilization) in remote areas such as the NWHI where facilities and infrastructure are lacking. Other studies indicate that the collection and processing of LIDAR data to produce bathymetry can cost as much as $2,330–$2,915/sq km (Final Report: Early Implementation of Near-shore Ecosystem Database Project, 1999; Moss Landing Marine Laboratories and California State University, Monterey Bay, CA.).
Table 7 (next page) provides a brief summary of the types of technologies that can be used to collect bathymetric, imagery, and optical validation data to support the production of bathymetric and benthic habitat maps.
If only bathymetric data are required, airborne LIDAR is a viable technology in water down to ~30 fm depths. However, LIDAR does not provide imagery data required for benthic habitat mapping. The only three feasible technologies that can provide the simultaneous bathymetry and imagery data needed for benthic habitat maps are IKONOS satellites, single-beam
Table 5. Estimated cost to map the area inside the 10 fm depth areas of the U.S. Pacifi c. The cost values presented could overestimate or underestimate actual costs by 25 percent or more. Please see explanatory notes provided with Table 5. Also, the estimated percentages of the area that remains to be mapped at each location may be off by 25 percent or more.
estimated estimated estimatedcost estimated area percent
to map area inside of area<10 fm inside 10 fm remainingisobath 10 fm remaining to be estimated
($/sq km)($/sq km) isobath to be mappedto be mapped mappedmapped costNWHI $4,200 1,541 1,531 99 $6,430,000main Hawaiian Is. $4,200 1,233 370 30 $1,554,000Am. Samoa $4,200 54 44 80 $185,000Guam and N. Marianas $4,200 212 170 80 $714,000
In Table 5, the area inside 10 fm isobath is taken from Table 1. For the NWHI, the estimated area remaining to be mapped is taken from Table 1. The area remaining to be mapped for the other locations is a very rough estimate. While some bathymetric data have been collected for some portions of these locations, no complete inventory is available. For this analysis, the estimated depth information derived from IKONOS satellite imagery was not included. As inventories are completed and bathymetric data collection activities are quantifi ed, these numbers will change.
Table 6. Cost estimates for gathering and initial processing of aircraft-based LIDAR data. These estimates assume that the average cost to collect and process LIDAR data to produce bathymetry maps is $1,015/sq km. For this analysis, the average depth is 15 m. The cost values presented could overestimate or underestimate actual costs by 25 percent or more.
estimated estimated estimatedcost estimated area percent
to map area inside of area<10 fm inside 10 fm remainingisobath 10 fm remaining to be estimated
($/sq km)($/sq km) isobath to be mappedto be mapped mappedmapped costNWHI $1,015 1,541 1,531 99 $1,554,000main Hawaiian Is. $1,015 1,233 370 30 $376,000Am. Samoa $1,015 54 44 80 $45,000Guam and N. Marianas $1,015 212 170 80 $71,000
For this analysis, the estimated depth information derived from IKONOS satellite imagery was not included. These estimates include some, but not all, aircraft mobilization and demobilization costs or the costs when the aircraft sits on the tarmac during bad weather (which would halt data collection). These estimates were derived from cost ranges in a current NOS contract to acquire LIDAR data.
6

sonars, and multibeam sonars. IKONOS satellite technology has already been used to map extensively in the 0–15 fm depth range and benthic habitat maps from these data are available. IKONOS cannot be used to provide the data needed to develop the deeper water bathymetry and benthic habitat maps discussed in this MIP.
Single-beam sonar technology has been and continues to be used for bathymetric mapping in the Pacifi c. It is less expensive than multibeam technologies and can provide both bathymetry data and information on the character of the seafl oor. However, the density and resolution of single-beam bathymetry data is insuffi cient to provide the detailed information needed to make accurate, detailed bathymetry maps. In addition, the use of the bottom characterization data from single-beam sonar for benthic habitat mapping is still in the developmental phases.
Typically, side-scan sonars are towed vehicles that provide high quality imagery data, but not bathymetric information (although a few very expensive systems for deep water survey do provide both types of data). Because side-scan sonars
are towed vehicles, the exact positioning of the data is very diffi cult to determine. Also, most side-scan sonars do not provide bathymetric data.
Optical Validation Data
Once collected, the bathymetric and imagery data can be used, in combination with optical validation data—actual imagery—of the seafl oor, to derive benthic habitat maps. Direct observations and optical technologies are generally used to observe and collect validation data—imagery—of the seafl oor. Remotely operated vehicles (ROVs), Autonomous Underwater Vehicles (AUVs), manned submersibles, Laser Line Scanning (LLS) technologies, drop cameras, as well as SCUBA divers can collect data of the seafl oor. SCUBA divers are generally able to collect imagery in shallow water (less than 15 fm). ROVs, AUVs, drop cameras, LLSs, and manned submersibles can collect imagery down to greater depths. The challenge is to determine how many observations are needed in order to adequately characterize a region of the seafl oor. When regions of the seafl oor are homogeneous, relatively few images may be needed. Complex regions of the seafl oor may require many observations for adequate characterization. Before undertaking any effort to acquire seafl oor optical imagery, an evaluation of the bathymetric data should be completed. Such an evaluation could result in identifying priority areas for direct observation and collection of optical data. Every effort must be made to take advantage of “ships of opportunity” to collect validation data and optical imagery.
Costs for acquisition of optical data vary widely. A ship equipped with an ROV or manned submersible can cost as much as $30,000/day. Safe and effi cient operation of these vehicles is contingent on having accurate, detailed bathymetric data. Prioritization of areas to be surveyed also is important. Simple drop cameras or ROVs are much less expensive (~$50,000/system), can readily be used down to ~1000+ m, and are easily deployed from a variety of vessels. Diver
7
Table 7. Technologies available for acquiring data to support the development of bathymetric or benthic habitat maps.
Data Type TechnologyData Type Technology 0-10 fm0-10 fm 10-100 fm10-100 fm 100-500 fm100-500 fm >500 fm>500 fmBathymetryBathymetry
IKONOSIKONOS xLIDAR x to ~ 30 fmto ~ 30 fm
MultispectralMultispectral x to ~25 fmto ~25 fmSingle -beamSingle -beam x x x x
MultibeamMultibeam x x x xImageryImagery
IKONOSIKONOS x to ~15 fmto ~15 fmAerial PhotosAerial Photos x to ~15 fmto ~15 fmSingle-beamSingle-beam x x to ~300 fm to ~300 fm
Multibeam BackscatterMultibeam Backscatter x x x xSide-scanSide-scan x x x x
Validation DataValidation DataDiver Obs.Diver Obs. x x
Cameras, ROVsCameras, ROVs x xLaser Line ScanLaser Line Scan x x x
SubmersiblesSubmersibles from ~ 50 fmfrom ~ 50 fm x x

observations and photographs are inexpensive and the most common source of validation data in depths down to ~15 fm, but are depth and in-the-water time limited and can be dangerous, particularly in the remote island areas where no diver facilities, such as hyperbaric chambers, are available.
Classifi cation Scheme
A draft hierarchical marine habitat classifi cation scheme has been developed for the NWHI (Coyne et al., 2001). Building on this work and that of Holthus and Maragos (1995), NOAA, 1999, and Kendall et al, 2003, the scheme needs to be modifi ed to include deeper water benthic habitats that can be identifi ed in the acoustic data and optical imagery. Using acoustic data as the source of information, as many as fi ve (5) or more habitat types can be identifi ed accurately. As mentioned earlier, sonar mapping can typically produce maps having between three and six (3–6) habitat classes (e.g., soft bottom; hard bottom; high relief; low relief).
Data Processing and Habitat Mapping
Collection of bathymetric, imagery, and optical validation data represents a signifi cant commitment of resources and funds. However, data collection alone does not ensure that benthic habitat maps are produced. A signifi cant commitment of resources and funds also is required to process bathymetry, imagery, and optical validation data and to synthesize these data with the critical biological information. The resulting maps are needed to create the complete picture of an ecosystem in order to describe and determine EFH and HAPC. A complete assessment of the cost to process the bathymetric and imagery data, incorporate the validation data, and develop maps suitable for EFH and HAPC characterization and implementation needs to be completed.
Data Acquisition Assets
Completing the bathymetric and optical data collection efforts is dependent on the availability of ship and aircraft assets. NOAA has a contract in place to acquire LIDAR data anywhere in the U.S. NOAA also has a contract in place to acquire multibeam data anywhere in the U.S. Several other
ships are available to support the acquisition and processing of acoustic data and optical imagery. A brief summary of ship assets and their mapping capabilities is presented here:
NOAA ship Oscar E. Sette: can deploy launch AHI and AHI and AHIbottom camera system from this vessel. Also supports diving operations. No shipboard multibeam, but does have single-beam water column mapping capability.
NOAA ship Hiʼialakai: can deploy launch AHI and bottom camera system from this vessel. Also supports diving operations. A multibeam/backscatter system will be installed in FY04.
NOAA ship Kaimiʼmoana primarily supports buoy deployment.
NOAA launch AHI (Acoustic Habitat Investigator) with Reson 8101 multibeam (5–100 fm)
University of Hawaii R/V Kilo Moana, with Simrad EM1002 multibeam (10-500 fm) and Simrad EM120 multibeam (50-5000+ fm)
University of Hawaii R/V Kaiʼimikai-O-Kanaloa (KoK), with “Classic SeaBeam” multibeam (50-5000+ fm) capability. The KOK cannot acquire backscatter data and the multibeam system has narrow swath width. KOK does support ROV and submersible work.
Other ship assets that could be used to acquire the acoustic data include:
NOAA ship Rainier with 4 launches. Currently the Rainier with 4 launches. Currently the Rainier Rainierhas two Reson 8101 multibeam sonars that provide both bathymetry and imagery and three Elac multibeam sonars that provide only bathymetry. Launch AHI with Reson 8101 AHI with Reson 8101 AHImultibeam could also be deployed from Rainier. The NOS has submitted a request for the Rainier to work in the NWHI in the Rainier to work in the NWHI in the RainierFall of 2004 (FY05).
NOAA ship Fairweather is currently being renovated and Fairweather is currently being renovated and Fairweatherwill have a shipboard multibeam and 2 or 3 launches with
8

multibeam, with both bathymetry and imagery capabilities. Launch AHI with Reson 8101 multibeam could also be AHI with Reson 8101 multibeam could also be AHIdeployed from Fairweather. Fairweather is scheduled for Fairweather. Fairweather is scheduled for Fairweather. Fairweatherpermanent deployment to Alaska in 2004.
Current Status
Over the last 20+ years, a considerable amount of data have been collected throughout the U.S. Pacifi c that could be used to develop bathymetric and, in some cases, habitat maps. Some of the data were collected using fathometers on NOAA ships and launches. Other data were collected by multibeam systems on University ships. LIDAR data have been collected around many of the main Hawaiian Islands, Guam, and the Northern Marianas by federal and state agencies and the Navy. Estimated depth has been derived from satellite imagery for the islands and atolls of the NWHI. CREI has recently compiled the Bathymetric Atlas of the Northwestern Hawaiian Islands: Bathymetric Atlas of the Northwestern Hawaiian Islands: A Planning Document for Benthic Habitat Mapping–DraftA Planning Document for Benthic Habitat Mapping–Draft. This Atlas graphically summarizes the extent of multibeam and single-beam bathymetric data, LIDAR, and IKONOS-based estimated depth data for that area. Similar Atlases need to be developed for the main Hawaiian Islands, American Samoa, Guam, and the Northern Marianas.
Table 8 provides estimates developed by CREI of what percentage of the NWHI has been mapped using all bathymetric data acquisition technologies (i.e., multibeam, single-beam, or IKONOS satellite technologies). The categories refl ect either depth regimes (e.g., 0–10 fm) or other specifi c information needed (e.g., approximate location of the 25 fm isobath). The Bathymetric Atlas of the NWHI will be used to develop future bathymetric data acquisition efforts.
Much of the bathymetric data available for the NWHI, summarized in Table 8, were collected by the University of
Hawaii ship Kilo Moana in the Fall of 2002. Considerable resources will be required to complete the acquisition of data to defi ne the 25 fm isobath at Nihoa Island and the 100 fm isobaths at Kure Island and Pearl and Hermes Atoll. CREI intends to map the 100 fm contours at Kure and Pearl and Hermes during an upcoming cruise in summer 2003. It has not yet been determined how the 25 fm isobath requirement at Nihoa Island will be met.
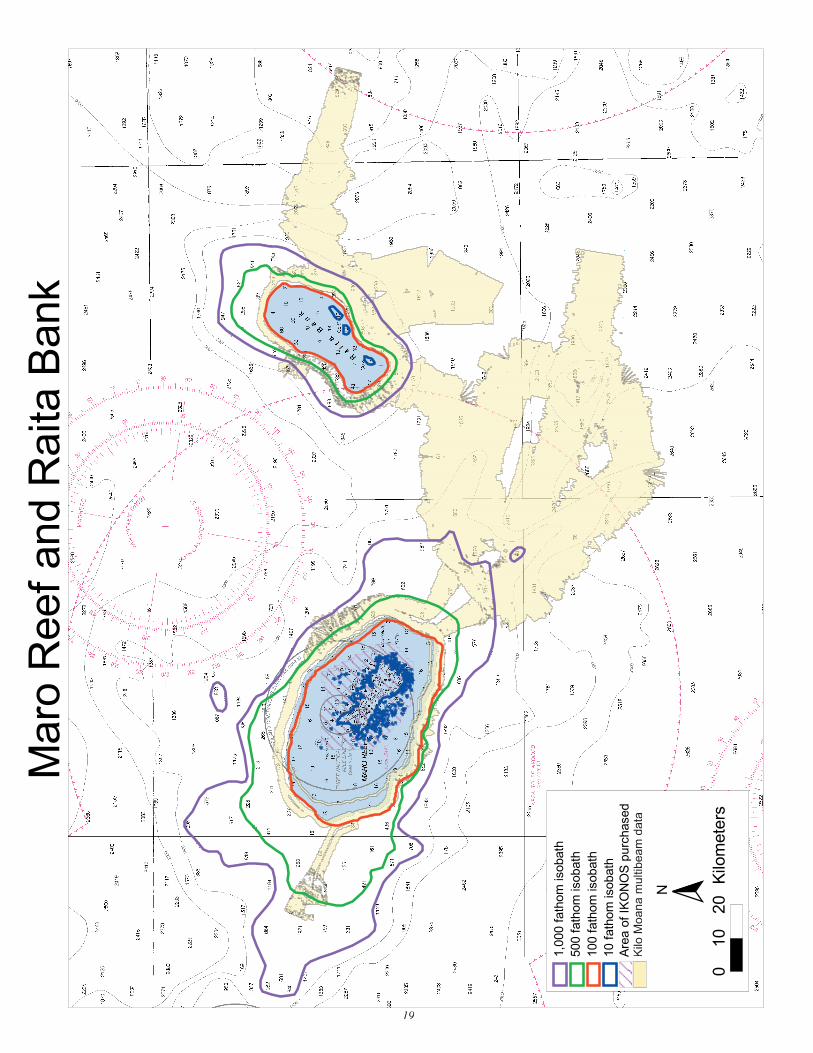
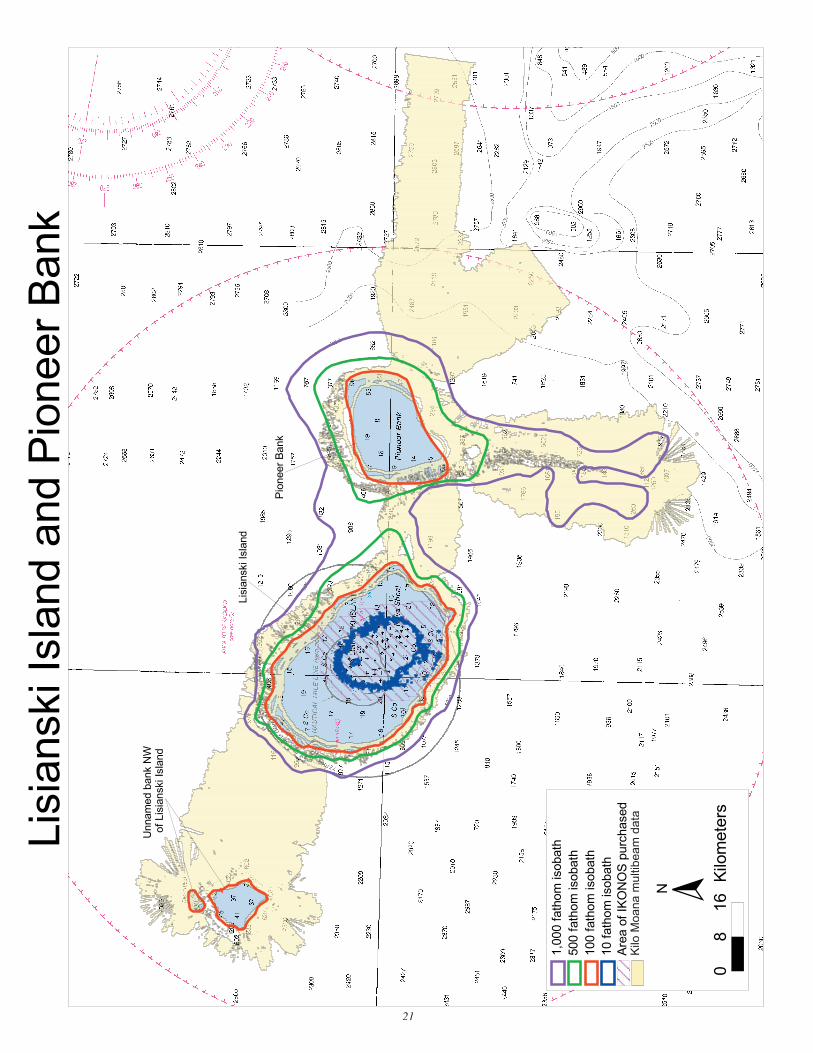
Maps depicting the extent of Kilo Moana multibeam data collected in the NWHI and 10, 100, 500, and 1000 fm depth contours are presented in Appendix 1. Table 9 (next page) presents the results of an analysis to better determine the area (in sq km) and percent of the NWHI that has been covered by multibeam data collections using the Kilo Moana. These estimates do not include any single-beam or IKONOS estimated depth information. Please refer to the maps in Appendix 1 to better visualize the work completed and what remains to be done related to multibeam data acquisition.
Table 8. Estimates of the percentages of the Northwestern Hawaiian Islands that have bathymetric data available. TBD = To Be Determined.
LocaleLocale
% Mapped 0-10 fm % Mapped
10-25 fm10-25 fm
% Mapped 25 fm
contourcontour% Mapped 25-100 fm25-100 fm
% Mapped 100 fm contourcontour
% Mapped 100-200 fm100-200 fm
Nihoa IslandNihoa Island 85% 2%2% 5%5% 10%10% 100%100% 100%100%Necker IslandNecker Island 22% 1%1% 80%80% 60%60% 100%100% 60%60%French Frigate ShoalsFrench Frigate ShoalsFrench Frigate ShoalsFrench Frigate Shoals 79% 3%3% 50%50% 50%50% 100%100% 50%50%Brooks BanksBrooks Banks 0% 3%3% 50%50% 50%50% 100%100% 50%50%St. RogatienSt. RogatienSt. RogatienSt. Rogatien 0% 3%3% 50%50% 50%50% 100%100% 50%50%Gardner PinnaclesGardner Pinnacles 100% 1%1% 95%95% 70%70% 100%100% 50%50%Raita BankRaita Bank 0% 1%1% 99%99% 85%85% 100%100% 90%90%Maro ReefMaro Reef 89% 1%1% 85%85% 40%40% 100%100% 60%60%Laysan IslandLaysan IslandLaysan IslandLaysan Island 99% 1%1% 95%95% 90%90% 100%100% 75%75%North Hampton SeamountsNorth Hampton SeamountsNorth Hampton SeamountsNorth Hampton Seamounts 0% 5%5% 50%50% 100%100% 100%100% 100%100%Pioneer BankPioneer Bank 0% 1%1% 95%95% 50%50% 100%100% 100%100%Lisianski IslandLisianski Island 86% 1%1% 95%95% 75%75% 95%95% 95%95%Pearl and Hermes AtollPearl and Hermes Atoll 87% 0%0% 0%0% 0%0% 0%0% 0%0%Midway IslandsMidway IslandsMidway IslandsMidway Islands 97% 0%0% 0%0% 0%0% 0%0% 0%0%Kure IslandKure Island 77% 0%0% 0%0% 0%0% 0%0% 0%0%Other banksOther banks TBD TBD TBD TBD TBD TBD
9

Limited amounts of bathymetric data and backscatter data are available for American Samoa, Guam, and the Northern Marianas. A considerable amount of these data are available for the Main Hawaiian Islands, but have not yet been fully inventoried. NOAA and Oregon State University have worked with the Fagatele Bay National Marine Sanctuary in American Samoa, the National Park Service, and the American Samoa Government to acquire multibeam data for much of Tutuila and parts of Ofu, Olosega, and Tau. The Navy has acquired LIDAR data for portions of Guam, Saipan, and Tinian. A recent NOAA Ocean Exploration mission acquired bathymetric data in 50 fm and greater depths in Guam and the Northern Marianas Archipelago. Additional University of Hawaii data are available for these areas as well. These data will be compiled into a GIS as part of the planning for upcoming survey missions to these areas.
Seafl oor Characterization Information
Optical validation information also has been collected throughout the region for many years. Much of these data have been collected in water < 15 fm deep. In particular, CREI has collected shallow-water (~5–15 fm) tow board video data throughout the NWHI. A limited number of digital photographs, taken with a drop/tow camera in water down to 10–50 fm, are available for the NWHI and American Samoa. CREI also has a considerable amount of tow board video for the islands of American Samoa. CREI intends to collect drop camera and tow board imagery in the NWHI, Guam and the Northern Marianas during the summer of 2003. Similar activities will be conducted in American Samoa in 2004.
Optical validation information is very sparse for the deeper areas (> 50 fm) throughout the U.S. Pacifi c. Several ROV or submersible surveys have been conducted, most recently one by the University of Hawaii that visited several bank areas in the NWHI. An inventory of available optical validation information, including its format and where it is stored, needs to be completed.
Planned Activities
Tables 10 and 11 summarize U.S. Pacifi c mapping activities that have been completed or are scheduled in FY03 (see Table 10 on page 12) or planned for FY04 (see Table 11 on page 13). Green text indicates cruises that have been completed and blue text indicates that the status of the operational funding for these cruises is unknown.
For more information on this plan, please contact:
Joyce MillerCoral Reef Ecosystem InvestigationNOAA Fisheries1125B Ala Moana BoulevardHonolulu, HI [email protected]
or
Steve RohmannSpecial Projects Offi ceNOAA Oceans and Coasts1305 East West Hwy., #9653Silver Spring, MD [email protected]
References
Axelsson, R and M Alfredsson. Capacity and Capability for Hydrographic Missions. Saab Dynamics AB. 9 pp.
Coyne, MS, TA Battista, M Anderson, J Waddell, W Smith, P Jokiel, MS Kendall, and ME Monaco. 2003. NOAA Technical Memorandum NOS NCCOS CCMA 152 (On-line). Benthic Habitats of the Main Hawaiian Islands URL: http://biogeo.nos.noaa.gov/projects/mapping/pacifi c/. Also available on U.S. National Oceanic and Atmospheric Administration. National Ocean Service, National Centers for Coastal Ocean Science, Biogeography Program. 2003. (CD-ROM). Benthic Habitats of the Main Hawaiian Islands. Silver Spring, MD: National Oceanic and Atmospheric Administration.
Classifi cation Scheme for Benthic Habitat: Northwestern Hawaiian Islands–Draft. 2002. National Oceanic and Atmospheric Administration, National Ocean Service. 11 pp.
Evans, RE, SA Lemke, RW Morton, and WS Simmons. The Outsourcing of Hydrographic Survey by NOAA: An Industry Perspective of a Partnership in the Making for a New Millennium. Science Applications International Corporation.
Holthus, PF, and JE Maragos. 1995. Marine ecosystem classifi cation for the tropical island Pacifi c. In: Maragos, J.E., Peterson, M.N.A., Eldredge, L.G., Bardach, J.E., Takeuchi, H.F. Eds.), Marine and Coastal Biodiversity in the Tropical Island Pacifi c Region, East-West Center, Honolulu, pp 239–278.
Kendall, MS, CR Kruer, KR Buja, JD Christensen, M Finkbeiner, and ME Monaco. 2001. Methods used to map the benthic habitats of Puerto Rico and the U.S. Virgin Islands. National Ocean Service, Center for Coastal Monitoring and Assessment, Biogeography Program, Silver Spring, MD. 45pp.
Kendall, MS, OP Jensen, G McFall, R. Bohne, D. Field, C. Alexander, and ME Monaco 2003. Benthic Habitats of Grayʼs Reef National Marine Sanctuary. NOAA/NOS/NCCOS/CCMA Biogeography Team Technical Report. 16 pp.
Mapping and Informations Synthesis Working Group. 1999. Coral Reef Mapping Implementation Plan (2nd Draft). U.S. Coral Reef Task Force. Washington, DC: NOAA, NASA and USGS (Work Group Co-chairs). 17pp.
Miller, JE, RK Hoeke, TB Appelgate, and PJ Johnson. 2003. Bathymetric Atlas of the Northwestern Hawaiian Islands–Draft. May 2003. National Oceanic and Atmospheric Administration and Hawaii Mapping Research Group. 65 pp.
10

Table 9. Estimated area where multibeam data have been collected inside the 10-fm and 100-fm depth contours in the Northwest-ern Hawaiian Islands. Area estimates were derived by GIS using Kilo Moana multibeam data and depth contours digitized from NOAA nautical charts.
11
LocationLocation
area of multibeam
collection (sq km) inside 10
fm contour
area without multibeam
collection (sq km) inside 10
fm contour
area (sq km) inside 10 fm
contour
area of multibeam
collection (sq km) inside 100
fm contour
area without multibeam collection (sq km)
inside 100 fm contour
area (sq km) inside 100 fm contour
Bank E of Nihoa Island* 0.0 0.0 0.0 0.0 147.7 147.7Nihoa Island 4.8 0.8 5.6 84.5 488.7 573.2Bank SW of Nihoa Island* 0.0 0.0 0.0 41.8 296.0 337.8Unnamed Bank 1 NW of Nihoa Island 0.0 0.0 0.0 12.2 51.6 63.8
Unnamed Bank 2 NW of Nihoa Island 1.2 1.1 2.3 2.5 2.8 5.3
Unnamed Bank 3 NW of Nihoa Island 0.0 0.0 0.0 9.5 57.1 66.6
Necker Island 0.0 9.1 9.1 278.4 1,279.7 1,558.1Unnamed Bank N of Necker Island 3.2 0.0 3.2 6.4 0.1 6.5Unnamed bank NE of French Frigate ShoalsFrigate Shoals 0.0 0.0 0.0 0.0 9.5 9.5
French Frigate Shoals 0.3 469.1 469.4 159.3 784.1 943.4Brooks Bank 4 (most SE of St. Rogatien Bank)* 0.0 0.0 0.0 0.0 29.8 29.8
Brooks Bank 3 (more SE of St Rogaiten)* 0.0 0.0 0.0 48.9 93.1 142.0
Brooks Bank 2 (just SE of St. Rogatien)* 0.0 0.0 0.0 56.8 102.0 158.8
Brooks Bank 1 (very small bank E of St. Rogatien Bank)* 0.0 0.0 0.0 3.6 0.0 3.6
Brooks Bank (NW of St. Rogatien Bank)*Bank)* 0.0 0.0 0.0 0.8 67.4 68.2
St. Rogatien Bank*St. Rogatien Bank* 0.0 0.0 0.0 83.3 300.6 383.9Gardner Pinnacles 0.0 0.7 0.7 244.5 2,201.7 2,446.2Raita Bank 0.0 16.0 16.0 0.0 571.1 571.1Maro Reef 0.0 188.9 188.9 267.5 1,667.8 1,935.3Laysan Island 0.0 25.8 25.8 99.3 485.2 584.5Northhampton Seamounts*Northhampton Seamounts* 0.0 0.0 0.0 93.3 311.0 404.3Pioneer Bank* 0.0 0.0 0.0 103.6 331.0 434.6Lisianski Island 0.0 215.6 215.6 198.5 1,049.7 1,248.2Unnamed Bank NW of Lisianski Island*Island* 0.0 0.0 0.0 27.1 79.4 106.5Unnamed Bank SSE of Pearl and Hermes Atoll* 0.0 0.0 0.0 0.0 5.5 5.5
Unnamed Bank ESE of Pearl and Hermes Atoll* 0.0 0.0 0.0 0.0 4.8 4.8
Pearl and Hermes Atoll# 0.0 374.5 374.5 0.0 816.6 816.6Salmon Bank* 0.0 0.0 0.0 0.0 163.2 163.2Gambia Shoal* 0.0 0.0 0.0 0.0 0.5 0.5Ladd Seamount** 0.0 54.2 54.2 0.0 144.1 144.1Midway IslandsMidway Islands 0.0 85.4 85.4 0.0 344.1 344.1Kure Atoll***,^ 0.0 90.2 90.2 0.0 0.0 0.0TOTALTOTAL 9.5 1,531.4 1,540.9 1,821.8 11,885.9 13,707.7
* 10-fm contour is not available on nautical chart** 50-fm contour used in absence of 10-fm contour*** 20-fm contour used in absence of 10-fm contour^ 100-fm contour not available# depth contour (~10 fm) derived from IKONOS imagery

Table 10. FY03 (October ’02–September ’03) Completed and Scheduled Pacifi c Mapping Activities
Depth Ranges Main Hawaiian
Islands
NWHI Northern Marianas
Guam American Samoa
Shallow(0-10 fm)
Multisprectralunderway
STI contract
85% IKONOS complete
3 mos. on Settefor optical datafor optical data
IKONOS Underway
3 wks.3 wks. Sette Sette
IKONOSUnderway
2 wks. 2 wks. SetteSette
IKONOSUnderway
Bank tops(10-25 fm)
Tests on AHI (2 wks)
KM test data (2 wks.)
10 days on for optical data10 days on for optical data
AHIfor optical data
AHIfor optical data
plus camera work on Sette
3 wks AHI plus camera
work on Sette
2 wks AHI plus camera
work on Sette
None
Boundaries(25, 50 100 fm) (25, 50 100 fm)
None 25-day KM cruise None None None
Bottom Fisheries (25-200 fm)
Tests on AHI (2 wks)
KoK (? days)Submersible
work
KM test data (2 wks.)
25-day KM cruise
10 days on AHIPlus camera
work on Sette
KoK (60 days)
3 wks AHI plus camera
work on Sette
23-day OE-funded cruise
on Thompson
WPRFMC 5-day cruise 5-day cruise
2 wks AHIplus camera
work on Sette
23-day OE-funded cruise
None
Deep Banks(200-500 fm)
KoK (? days)Submersible
work
KM test data (2 wks.)
25-day KM cruise
KoK (60 days)KoK (60 days)KoKSubmersible work
23-day OE-funded cruise
on Thompson
WPRFMC 5-day cruise5-day cruise
23-day OE-funded cruise
None
Oceanic Depths(500+ fm)
KM test data (2 wks.)
25-day KM cruise 23-day OE-funded cruise
on Thompson
23-day OE-funded cruise
None
National Oceanic and Atmospheric Administration. 2003. Atlas of Shallow-water Benthic Habitats of the Northwestern Hawaiian Islands (Draft). 160 pp.
Using Multibeam Sonar to Map MPAs: Tool of the Future for Planning and Management? 2002 MPA News. Vol. 4 (2)Appendix 1. Maps depicting the extent of multibeam data in the Northwestern Hawaiian Islands. Depth contours were digitized from NOAA nautical charts.
Appendix 2. NOAA and Other Mapping Mandates
NOAA has a number of long-standing or recent mandates and legal requirements that are increasing the demand for mapping to be done in the U.S.-affi liated Pacifi c Islands, including the Main Hawaiian Islands (MHI) and the Northwestern Hawaiian Islands (NMWH) in the State of Hawaii, the Territory of American Samoa (AS), the Commonwealth of the Northern Mariana Islands (CNMI), Guam, and the Pacifi c Remote Island
Areas (PRIA)—Palmyra Atoll, Kingman Reef, Howland Island, Baker Island, Jarvis Island, Johnston Atoll, and Wake Island. Each individual group has its own set of prioritized needs with an associated time frame in which information is required. NOAA must set priorities that balance the requirements of these numerous groups and meet the critical needs of the most users in a timely fashion.
NOAA̓ s Fisheries Requirements
The Pacifi c Islands Region (PIR) of NOAA Fisheries includes the Pacifi c Islands Fisheries Science Center (PIFSC) and the Pacifi c Islands Regional Offi ce (PIRO). Both of these groups work in close consultation with the Western Pacifi c Regional Fisheries Management Council (WPRFMC). Fisheries mandates stem primarily from the 1996 Sustainable Fisheries Act (SFA), which amended the Magnuson Act (renamed the Magnuson-Stevens Fisheries Conservation and Management Act). These acts require not only conservation of species and habitat, but also responsible management of
12
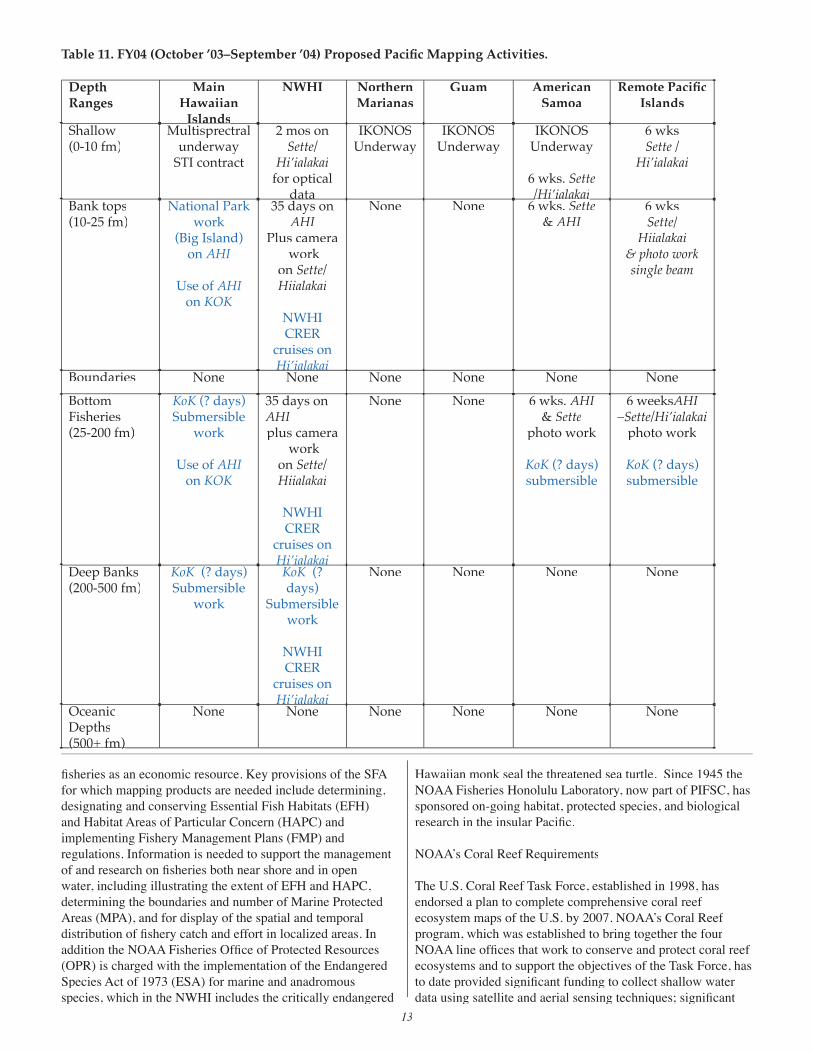
Table 11. FY04 (October ’03–September ’04) Proposed Pacifi c Mapping Activities.
Depth Ranges
Main Hawaiian
IslandsIslands
NWHI Northern Marianas
Guam American Samoa
Remote Pacifi c Islands
Shallow (0-10 fm)
Multisprectralunderway
STI contract
2 mos on Sette/
Hi’ialakaifor optical
data data
IKONOS Underway
IKONOSUnderway
IKONOSUnderway
6 wks. Sette/Hi’ialakai/Hi’ialakai
6 wks Sette /
Hi’ialakai
Bank tops(10-25 fm)
National Park work
(Big Island) on AHI
Use of AHI on KOK
35 days on AHI
Plus camera work
on Sette/ Hiialakai
NWHI CRER
cruises on Hi’ialakai
None None 6 wks. Sette & AHI
6 wks Sette/
Hiialakai& photo work single beam
Boundaries None None None None None None
Bottom Fisheries (25-200 fm)
KoK (? days)Submersible
work
Use of AHI on KOK
35 days on AHIplus camera
work on Sette/ Hiialakai
NWHI CRER
cruises on Hi’ialakai
None None 6 wks. AHI& Sette
photo work
KoK (? days)submersible
6 weeksAHI–Sette/Hi’ialakai
photo work
KoK (? days)submersible
Deep Banks (200-500 fm)
KoK (? days)Submersible
work
KoK (? days)
Submersible work
NWHI CRER
cruises on Hi’ialakai
None None None None
Oceanic Depths(500+ fm) (500+ fm)
None None None None None None
fi sheries as an economic resource. Key provisions of the SFA for which mapping products are needed include determining, designating and conserving Essential Fish Habitats (EFH) and Habitat Areas of Particular Concern (HAPC) and implementing Fishery Management Plans (FMP) and regulations. Information is needed to support the management of and research on fi sheries both near shore and in open water, including illustrating the extent of EFH and HAPC, determining the boundaries and number of Marine Protected Areas (MPA), and for display of the spatial and temporal distribution of fi shery catch and effort in localized areas. In addition the NOAA Fisheries Offi ce of Protected Resources (OPR) is charged with the implementation of the Endangered Species Act of 1973 (ESA) for marine and anadromous species, which in the NWHI includes the critically endangered
Hawaiian monk seal the threatened sea turtle. Since 1945 the NOAA Fisheries Honolulu Laboratory, now part of PIFSC, has sponsored on-going habitat, protected species, and biological research in the insular Pacifi c.
NOAA̓ s Coral Reef Requirements
The U.S. Coral Reef Task Force, established in 1998, has endorsed a plan to complete comprehensive coral reef ecosystem maps of the U.S. by 2007. NOAA̓ s Coral Reef program, which was established to bring together the four NOAA line offi ces that work to conserve and protect coral reef ecosystems and to support the objectives of the Task Force, has to date provided signifi cant funding to collect shallow water data using satellite and aerial sensing techniques; signifi cant
13

portions of that mapping are complete in the NWHI for which a draft Atlas of the Shallow Water Benthic Habitats of the Northwestern Hawaiian Islands has been produced. Similar remote sensing programs are underway in the MHI, Guam, AS and CNMI.
In 2001 in recognition of the importance of the coral reef ecosystem in the U.S.-affi liated Pacifi c Islands, NOAA Fisheries Honolulu Laboratory established the Coral Reef Ecosystem Investigation (CREI) at Honolulu Laboratory and with the Coral Reef Program provides funding and facilities as well as ship-time for yearly cruises to the NWHI and bi-yearly cruises to AS, CNMI, Guam, and PRIA. CREI performs research that encompasses biological, ecological, and oceanographic studies to provide an ecosystem-based understanding of coral reef environments. As a part of this program CREI is actively implementing a multi-faceted mapping program to provide a portion of the baseline bathymetric, imagery, and ground-truth data needed by all groups for production of benthic habitat maps. CREI is currently working with the University of Hawaiiʼs (UH) Hawaii Mapping Research Group (HMRG) to synthesize data from the NWHI and to provide base maps for future work in this area. CREI also supports a large scale, multi-agency effort to remove Marine Debris (MD) and derelict fi shing gear that severely damage coral reefs in the NWHI.
Northwestern Hawaiian Islands Coral Reef Ecosystem Reserve
President Clinton, on December 4, 2000, established the NWHI Coral Reef Ecosystem Reserve by Executive Order (EO) 13178/13196. The Reserve is adjacent to Hawaii state waters, extends approximately 1,200 nm to the northwest, and is approximately 100 nm wide. The purpose of the Reserve is to manage and facilitate coordination between state and federal agencies with management responsibilities for the submerged lands, waters, and native biota. NOAA̓ s National Marine Sanctuaries (NMS) Program has begun the process to designate the NWHI Coral Reef Ecosystem Reserve as the nationʼs 14th
and largest National Marine Sanctuary. When established, the NWHI National Marine Sanctuary will be the second largest coral reef sanctuary in the world, second only to Australiaʼs Great Barrier Reef. To help establish accurate legal boundaries required for Reserve and Fisheries management, the CRER, ONMS, the Coral Reef Program, NOAA̓ s Offi ce of Ocean Exploration (OE), NOAA̓ s Special Projects Offi ce (SPO), CREI, and WPRFMC sponsored a mapping cruise to the NWHI. The data collected on this November 2002 cruise are being used by a number of groups for boundary designations, updates to nautical charts, benthic habitat mapping, and as baseline data for planning future work.
NOAA̓ s Offi ces of the Coast Survey and Ocean Exploration
Two additional NOAA organizations with mapping needs or interests in the Pacifi c are the NOS Offi ce of Coast Survey (OCS) and OE. OCS has a few small high priority areas with mapping requirements for safety of navigation in the MHI and is in the process of updating nautical charts in the NWHI using the data collected in 2002. Ocean Exploration sponsors a wide
variety of research efforts for their exploration and outreach programs and is also providing a signifi cant amount of funding for mapping and collection of ground-truth information in the insular Pacifi c.
Non-NOAA Requirements
Other federal agencies, state and territorial governments, and researchers also are in need of the data and maps discussed here. The U.S. Fish and Wildlife Service (USFWS) manage several National Wildlife Refuges in the NWHI and the other Pacifi c Islands. The governments of AS, Guam and CNMI require these maps to better manage and conserve their local and regional fi sheries and to manage sanctuaries and Marine Protected Areas within their own jurisdiction. The State of Hawaii needs data and maps to better defi ne management boundaries and to support the establishment of Marine Management Areas. UH has an extensive research and exploration program that conducts marine geological and oceanographic research. The University of Hawaii also has signifi cant in-house mapping capability and expertise, including two research vessels that support NOAA-funded submersible work and seafl oor mapping, the Hawaii Mapping Research Group (HMRG), and a jointly sponsored NOAA/UH group, the Hawaii Undersea Research Laboratory (HURL). The capabilities of these two groups are being used extensively in support of NOAA projects.
14

15
Kilo
Moa
na m
ultib
eam
dat
a

16
Kilo
Moa
na m
ultib
eam
dat
a

17
Kilo
Moa
na m
ultib
eam
dat
a

18
Kilo
Moa
na m
ultib
eam
dat
a
19
Kilo
Moa
na m
ultib
eam
dat
a

20
Kilo
Moa
na m
ultib
eam
dat
a
21
Kilo
Moa
na m
ultib
eam
dat
a

22

23


