Mapping Flash Flood Potential in Indiana Evan Bentley 03/02/2011.
30
Mapping Flash Flood Potential in Indiana Evan Bentley 03/02/2011
-
Upload
elfreda-rosanna-cobb -
Category
Documents
-
view
217 -
download
2
Transcript of Mapping Flash Flood Potential in Indiana Evan Bentley 03/02/2011.

Mapping Flash Flood Potential in Indiana
Evan Bentley
03/02/2011

Background
Midnight shift - conversation about inadequate flash flood guidance.
Indiana has variable geography which will affect flash flooding.
Photo courtesy of Indiana Geological Survey

Background
Hydrologists and experienced forecasters are aware of areas which are most prone to flash flooding, but where precisely are these areas and which areas are the most vulnerable.
Creating a “Flash Flood Potential Index (FFPI)” will help to represent how “flashy” the land is in certain areas.
An index such as this will greatly improve National Weather Service (NWS) flash flood warning accuracy.
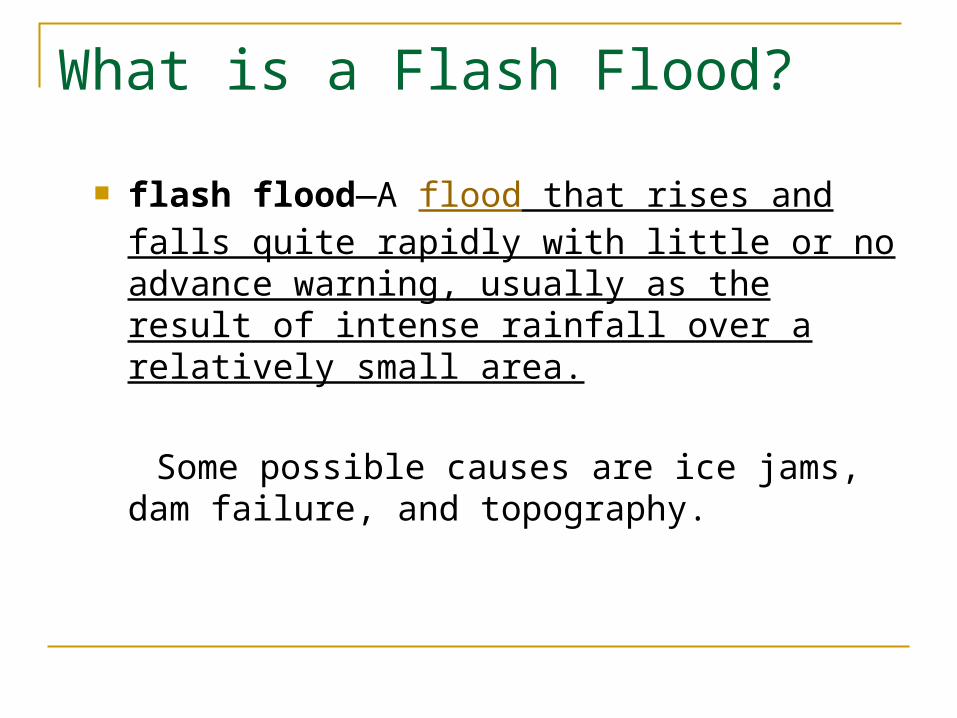
What is a Flash Flood?
flash flood—A flood that rises and falls quite rapidly with little or no advance warning, usually as the result of intense rainfall over a relatively small area.
Some possible causes are ice jams, dam failure, and topography.

Introduction
The FFPI was developed by hydrologist Greg Smith (CBRFC).
He understood that flash flood guidance did not properly represent geographical features which play a key role in flash flooding.
FFPI visualizes the role of land, urbanization, and vegetation.
“Guesswork” to flash flood prediction is reduced.

Current Flash Flood Guidancehttp://www.srh.noaa.gov/rfcshare/ffg.php?duration=3&location=OHRFC
Flash Flood Guidance for Indiana
INCHES OF RAINFALL FOR SPECIFIED DURATIONS REQUIRED TO PRODUCE FLASH FLOODING IN FORECAST ZONES. LOWER AMOUNTS MAY CAUSE FLASH FLOODING IN URBAN OR MOUNTAINOUS AREAS.
IDNAME 1-HR 3-HR 6-HR 12-HR 24-HR ADAMS CO 1.3 1.3 1.4 1.4 1.5 ALLEN CO 1.4 1.4 1.4 1.4 1.6 BARTHOLOMEW CO 1.9 2.0 2.1 2.2 2.2BENTON 3.4 3.9 4.4 BLACKFORD CO 1.8 1.9 2.0 1.9 1.9BOONE CO 1.8 1.9 2.0 2.0 2.1BROWN CO 1.9 2.0 2.1 2.1 2.2CARROLL CO 2.2 2.5 2.6 2.8 3.1

Current Flash Flood Guidance

Introduction
Flash Flood potential was mapped by resampling, reclassifying, and combining high resolution (30 m) GIS layers to create a final map output for the entire state of Indiana.
Final output was clipped to size of the Indianapolis NWS’s County Warning Area (CWA), and then to an increased resolution using the NWS’s Flash Flood Monitoring and Prediction (FFMP) sub-basins file.

Data
Rasters United States Geological Survey (USGS)
Seamless Data Warehouse (http://seamless.usgs.gov) Canopy Elevation Land Use
United States Department of Agriculture (USDA) Natural Resources Conservation Service (NCRS) Soil Data Mart (http://soildatamart.ncrs.usda.gov) Soil Type (STATSGO)
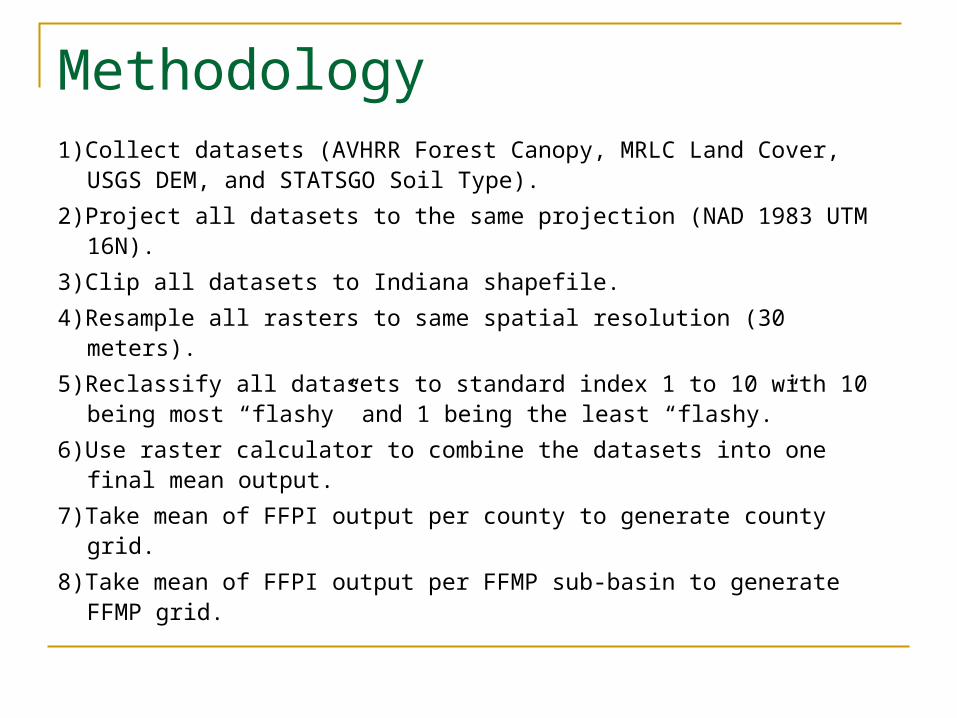
Methodology1)Collect datasets (AVHRR Forest Canopy, MRLC Land Cover,
USGS DEM, and STATSGO Soil Type).
2)Project all datasets to the same projection (NAD 1983 UTM 16N).
3)Clip all datasets to Indiana shapefile.
4)Resample all rasters to same spatial resolution (30 meters).
5)Reclassify all datasets to standard index 1 to 10 with 10 being most “flashy” and 1 being the least “flashy.”
6)Use raster calculator to combine the datasets into one final mean output.
7)Take mean of FFPI output per county to generate county grid.
8)Take mean of FFPI output per FFMP sub-basin to generate FFMP grid.

Classification and Indexing Slope
100% slope = 45o angle Percent slope greater than 30% given a 10 on the
scale. Equal division between 0% and 30% for scales 1-
9. USGS and Engineering studies have shown 30%
slope to be strong-very strong.
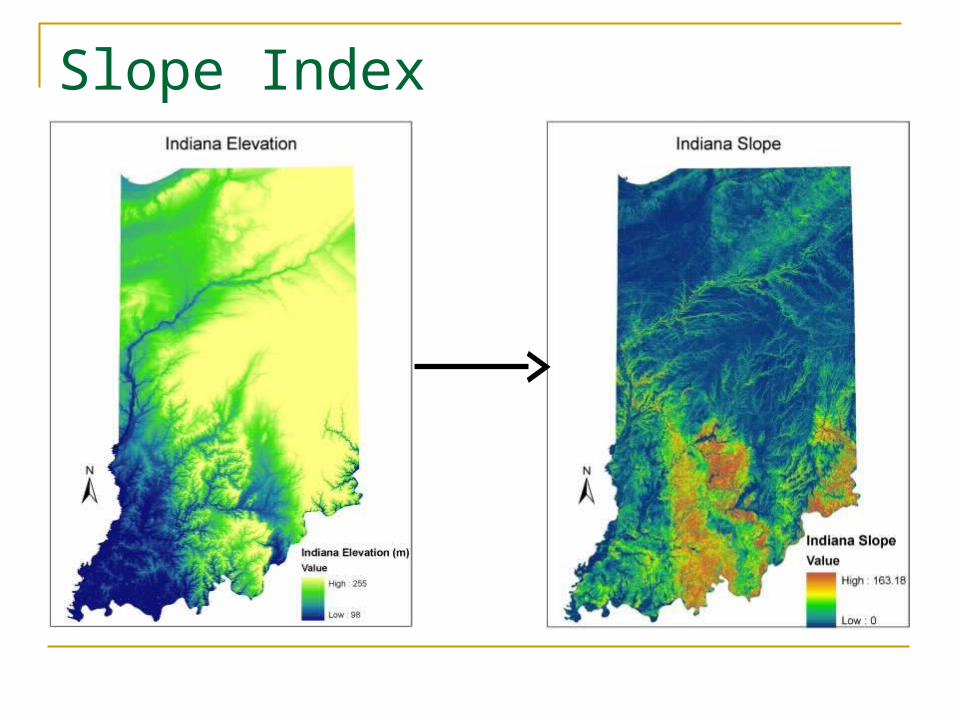
Slope Index

Slope Index
Slope is the most important geographic feature which effects flash flooding.

Classification and Indexing
Land Use Water/Wetlands given a 1 on FFPI. Urban areas range from 8-10. Greatest area is grassland, cultivated land, and
forests with values 4-6. Urbanization responsible for the majority of
significant variability in this layer.
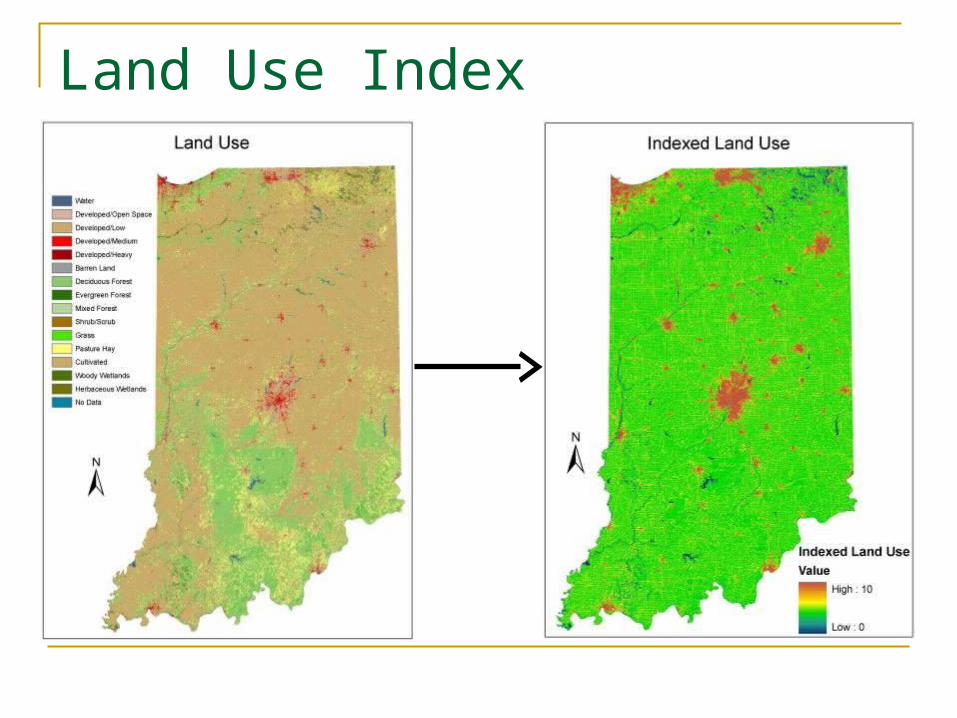
Land Use Index
Classification and Indexing
Forest Canopy Less Forest Density leads to quicker runoff and
higher values. More forest density allows for slower runoff and
less flash flood risk. 0-10% forest canopy has value of 10. 90-100% forest canopy has value of 1.

Forest Canopy Index

Classification and Indexing
Soil TypeClass FFPI
Sand 2
Loamy Sand 4
Sandy Loam 3
Silty Loam 4
Silt 5
Loam 6
Sandy Clay Loam 7
Silty Clay Loam 7
Clay Loam 8
Sandy Clay 7
Silty Clay 8
Clay 9
Organic Matter 5
Bedrock 10

Soil Type Index
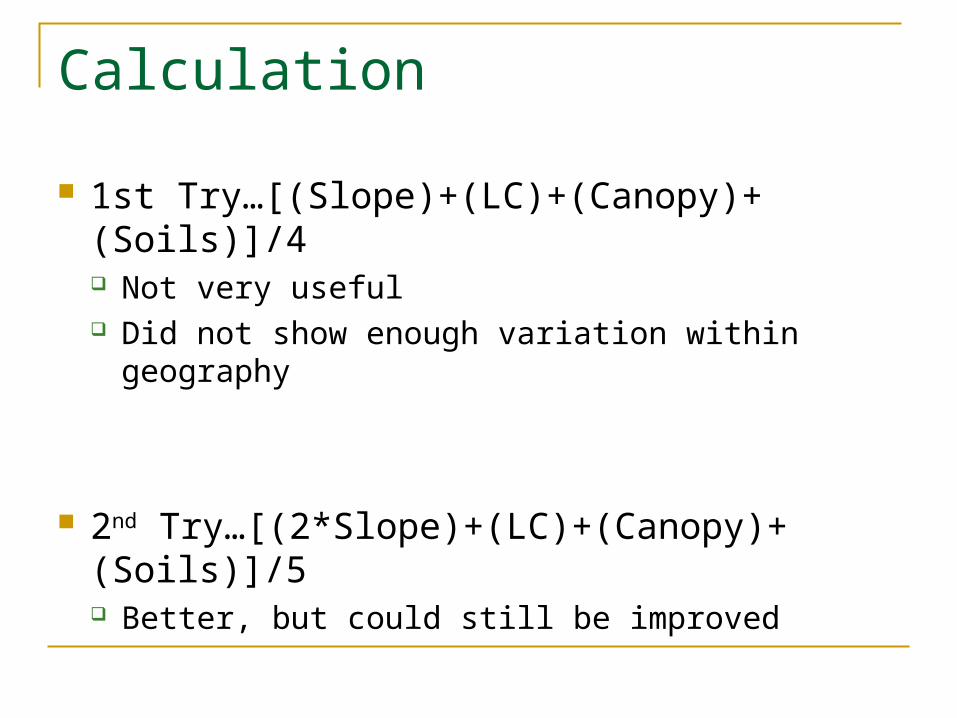
Calculation
1st Try…[(Slope)+(LC)+(Canopy)+(Soils)]/4 Not very useful Did not show enough variation within geography
2nd Try…[(2*Slope)+(LC)+(Canopy)+(Soils)]/5 Better, but could still be improved

Calculation
Final Calculation
[(2*Slope)+(LC)+(Soils)+(Canopy/2)]/4.5
More dependence on terrain, less dependence on canopy.
This fits our conceptual model.

FFPI

Urban Effects on FFPI
Cities have many impervious surfaces Parking Lots Roads Buildings
Can anyone guess why there are lower values north of Indianapolis inside 465?
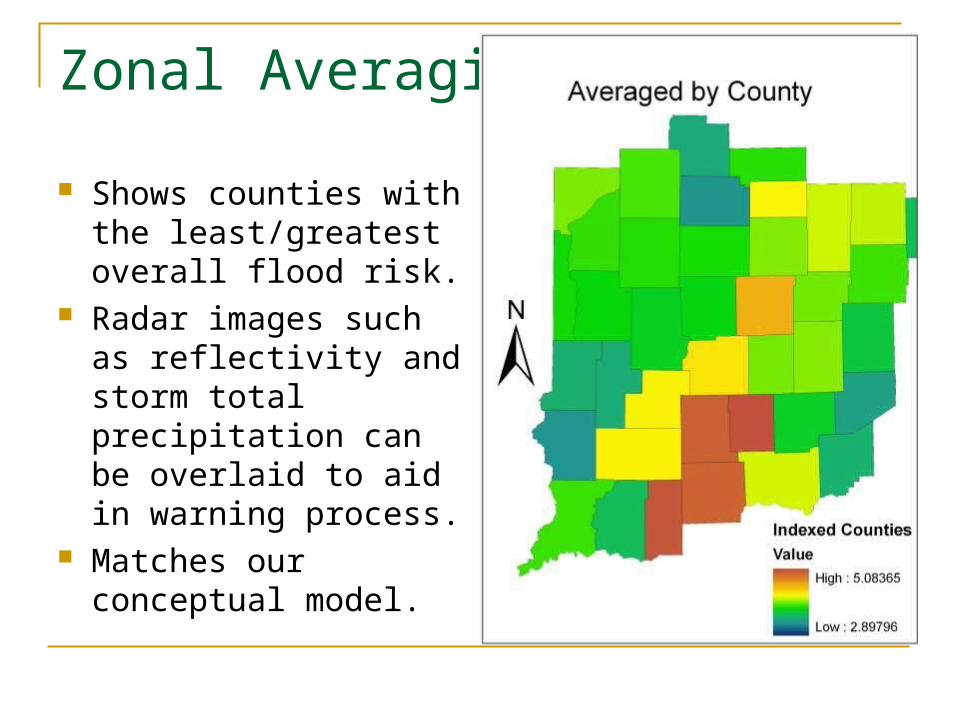
Zonal Averaging
Shows counties with the least/greatest overall flood risk.
Radar images such as reflectivity and storm total precipitation can be overlaid to aid in warning process.
Matches our conceptual model.

Zonal Averaging
FFPI per Flash Flood Monitoring and Prediction (FFMP) sub-basin.
FFMP- existing guidance used by NWS forecasters.
Shows areas within the same county with differing flash flood risk.

FFPI Versatility
Maps could be printed to place on forecasting desks.
FFPI can be output into many radar software packages such as: GRLevelX AWIPS (NWS forecasting software)

Conclusions
Hope FFPI leads to lower false alarm rate and greater lead time for flash flood warnings.
The FFPI should be used concurrently with radar overlays.
The FFPI can be created by any NWS office and classification values can be adjusted accordingly.
Does not necessarily represent flash flooding due to ice jams or dam failures well.
Recent Work
In late December 2010, the OHRFC unveiled “new and improved” flash flood prediction guidance. The new guidance includes: Slope Land Use Forest Canopy
Dynamic Layers of Soil Moisture, and Recent Rainfall were also included.

Acknowledgements
The FFPI concept was developed by Greg Smith (CBRFC)
Used classification and indexing methodologies from Jim Brewster (WFO Binghamton, NY)
Bharath Ganesh-Babu (Valparaiso University) as a GIS advisor over this project.

Questions?