Mapping a settlement - town planning
8
LAND USE PATTERN DIWALE VILLAGE, BELAPUR
-
Upload
dhanya-pravin -
Category
Design
-
view
46 -
download
2
Transcript of Mapping a settlement - town planning
LAND USE PATTERN
DIWALE VILLAGE, BELAPUR
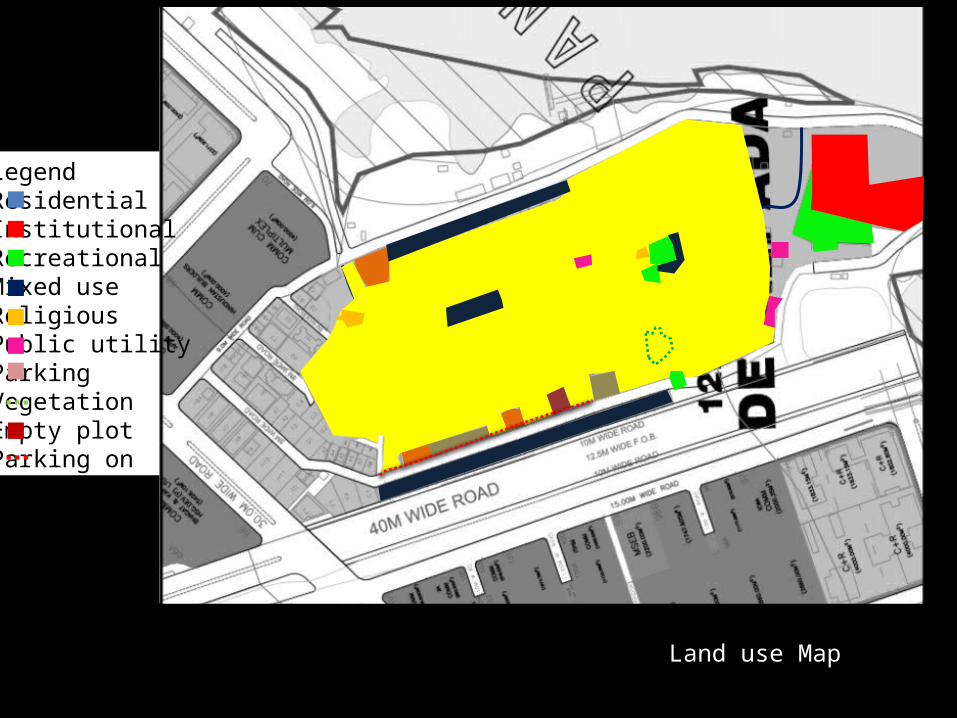
Legend Residential Institutional Recreational Mixed useReligious Public utility Parking Vegetation Empty plot Parking on street
Land use Map
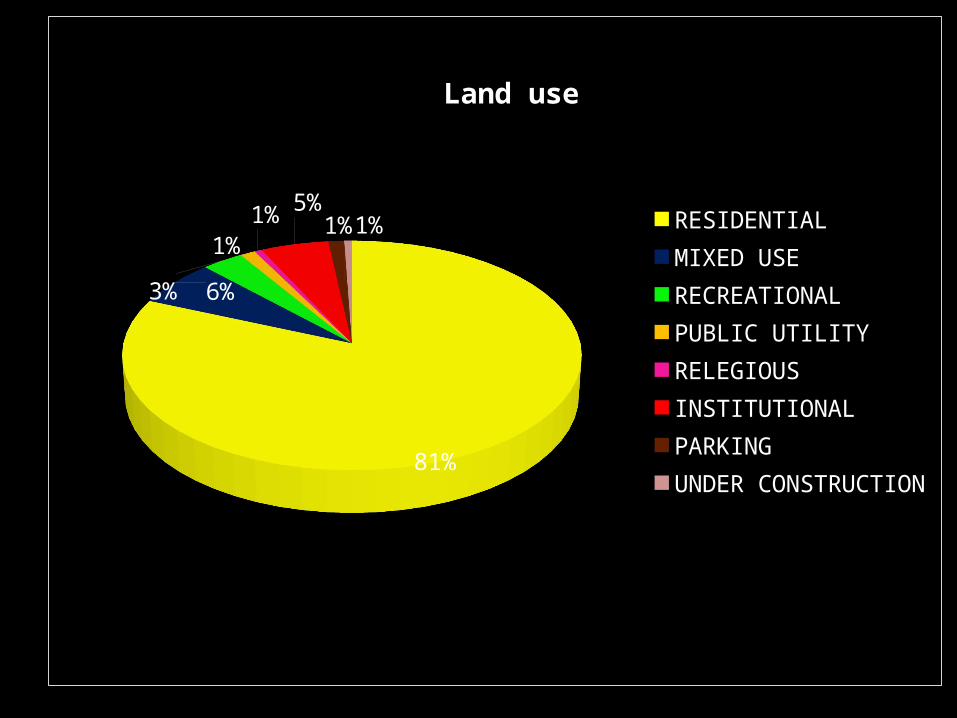
81%
6%
3%1%1% 5%
1% 1%
Land use
RESIDENTIALMIXED USERECREATIONALPUBLIC UTILITY RELEGIOUSINSTITUTIONALPARKINGUNDER CONSTRUCTION
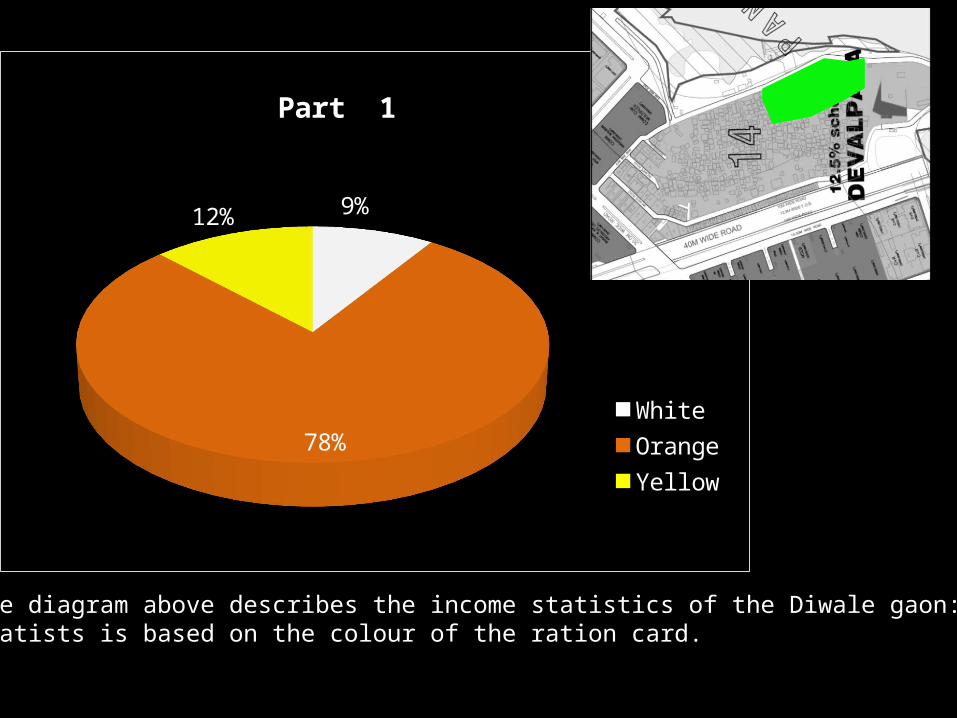
9%
78%
12%
Part 1
White OrangeYellow
The pie diagram above describes the income statistics of the Diwale gaon: part 1.The statists is based on the colour of the ration card.

67%
11%
22%
Part 2
OrangeYellow White
The pie diagram above describes the income statistics of the Diwale gaon: part 2.The statists is based on the colour of the ration card.
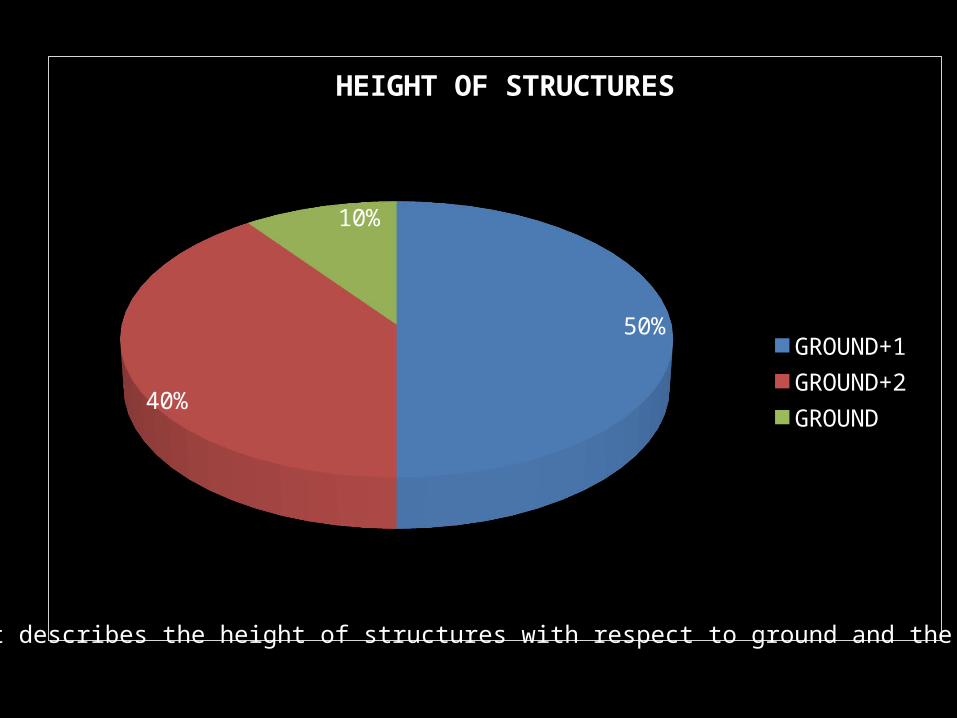
50%
40%
10%
HEIGHT OF STRUCTURES
GROUND+1GROUND+2GROUND
The pie chart describes the height of structures with respect to ground and the floors above

67%
27%
7%
HOUSING TYPOLOGY
ROW HOUSESAPARTMENTSSQUATTER
The pie chart describes the housing typologies of Diwale gaon with respect to row houses, apartments and squatter
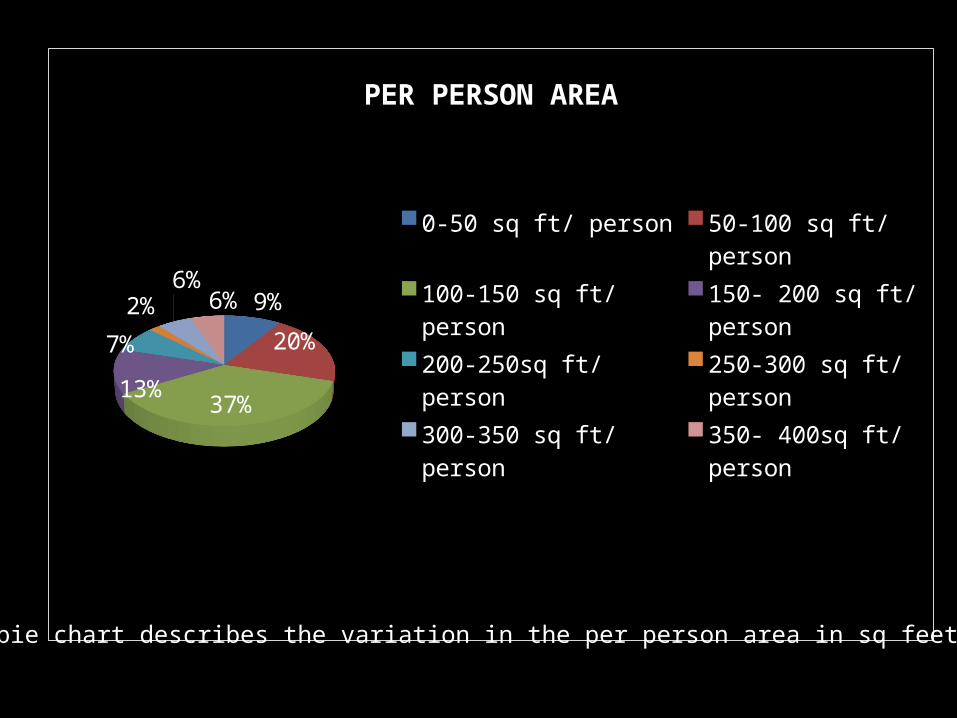
9%
20%
37%
13%
7%
2% 6%6%
PER PERSON AREA
0-50 sq ft/ person50-100 sq ft/ person100-150 sq ft/ person150- 200 sq ft/ person200-250sq ft/ person250-300 sq ft/ person300-350 sq ft/ person350- 400sq ft/ person
The pie chart describes the variation in the per person area in sq feet.