Map of Natural units of Espirito Santo State,...
34
1 Map of Natural units of Espirito Santo State, Brazil Leandro R. Feitoza, Lucio L. F. de Castro, Mauro Resende, Moema B. Zangrande, Michael Stocking, Rosana M. A. Borel, Eli A. Fullin, Aladim F. Cerqueira, Jose S. Salgado,Hideko N. Feitoza, Lorildo Aldo Stock, Milton Dessaune Filho 1 1. Abstract Espirito Santo State (ES) in SE Brazil has in its relatively small area a great diversity of landscapes, ecology and land uses. To indicate the degree of natural regional variability, a map was constructed using information from a variety of sources. Clustering of variables was a particular challenge. Both expert and personal experiences were used to develop geographical indicators of climate, soil and relation between humans & other living forms and land condition. Some of these indicators assisted the identification of different classes of each variable considered. These variables and their classes were subsequently clustered in order to set boundaries for the natural regional units. In turn, the classes were related to key biophysical aspects in order to develop some “genetic” relationship with problem issues in the natural regional units. This process led to units, which not only have direct relevance to environmental conditions in ES but also are of immediate support to regional development in terms familiar to potential users. The option of a simplified model of the environment for the identification of natural regional units was chosen. Two distinct aspects are involved in the design of the map of natural units: 1) preservation of original quality of information and 2) improvement in communication. Five situations in the preservation of quality were challenged: development and execution of a process involving 1) many key variables; 2) intelligibility for non-specialists in natural resource information; 3) flexibility of operation to re-access original information; 4) units related with easily identified field indicators. 5) technical transparency in the map about criteria and basic principles used. In order to meet the needs of communication, the following attributes were important: 1) development and execution of a process for designation of units and with immediate explanation of their content; 2) legend for immediate mental image of unit irrespective of user background, language or previous experience; 3) representation of units at both formats (a) digital and (b) hard copy format, for areal references (map) and (c) also in schematic diagram (decision tree). 2. Statement of the Problem Espirito Santo State, with an area of 45,597 km² is located in South-eastern Brazil. It has high mountainous, low mountainous and plateau areas along the Atlantic coastline and, consequently it has a great diversity of environments, ecology and land use. This diversity found over a relatively small area gives rise to a wide range of agro-ecosystems. ES State is satisfactorily served with information allowing general environmental zoning of large areas. The problem is that most of these data are available only for analysis at a general regional level by 1 Researchers supported by EMCAPA, CNPq, CST, UFV, UEA and EMBRAPA
Transcript of Map of Natural units of Espirito Santo State,...

1
Map of Natural units of Espirito Santo State,
Brazil
Leandro R. Feitoza, Lucio L. F. de Castro, Mauro Resende, Moema B. Zangrande, Michael
Stocking, Rosana M. A. Borel, Eli A. Fullin, Aladim F. Cerqueira, Jose S. Salgado,Hideko N.
Feitoza, Lorildo Aldo Stock, Milton Dessaune Filho1
1. Abstract
Espirito Santo State (ES) in SE Brazil has in its relatively small area a great diversity of landscapes,ecology and land uses. To indicate the degree of natural regional variability, a map was constructedusing information from a variety of sources. Clustering of variables was a particular challenge. Bothexpert and personal experiences were used to develop geographical indicators of climate, soil andrelation between humans & other living forms and land condition. Some of these indicators assisted theidentification of different classes of each variable considered. These variables and their classes weresubsequently clustered in order to set boundaries for the natural regional units. In turn, the classeswere related to key biophysical aspects in order to develop some “genetic” relationship with problemissues in the natural regional units. This process led to units, which not only have direct relevance toenvironmental conditions in ES but also are of immediate support to regional development in termsfamiliar to potential users. The option of a simplified model of the environment for the identification ofnatural regional units was chosen.
Two distinct aspects are involved in the design of the map of natural units: 1) preservation of originalquality of information and 2) improvement in communication. Five situations in the preservation ofquality were challenged: development and execution of a process involving 1) many key variables; 2)intelligibility for non-specialists in natural resource information; 3) flexibility of operation to re-accessoriginal information; 4) units related with easily identified field indicators. 5) technical transparency inthe map about criteria and basic principles used. In order to meet the needs of communication, thefollowing attributes were important: 1) development and execution of a process for designation of unitsand with immediate explanation of their content; 2) legend for immediate mental image of unitirrespective of user background, language or previous experience; 3) representation of units at bothformats (a) digital and (b) hard copy format, for areal references (map) and (c) also in schematicdiagram (decision tree).
2. Statement of the Problem
Espirito Santo State, with an area of 45,597 km² is located in South-eastern Brazil. It has highmountainous, low mountainous and plateau areas along the Atlantic coastline and, consequently it hasa great diversity of environments, ecology and land use. This diversity found over a relatively smallarea gives rise to a wide range of agro-ecosystems.
ES State is satisfactorily served with information allowing general environmental zoning of large areas.The problem is that most of these data are available only for analysis at a general regional level by
1Researchers supported by EMCAPA, CNPq, CST, UFV, UEA and EMBRAPA

2
trained professionals, and not in a form useful to non-specialists2. As a consequence the actual usersof this information are few at a general level and even fewer at field detailed level. Important projectsare launched without the necessary knowledge of the ecosystems. Field training in perception,interpretation and transference of knowledge related to agricultural ecosystems is arousingconsiderable interest in Espirito Santo State. The mere desire for this training points to the need for anadditional and instructive-educational approach alongside the current scientific and technical“information system”. Moving from one traditional technical communication practice to another whichaims to increase understanding is a challenge. It involves not only terminology translation but also theaddition of new information combined in a way that will be usable in the field and easily understood bynon-specialists. The new information must be user friendly and needs to be integrated with the originalformat in which the traditional source is set. This paper outlines part of a research program to providejust such a new information design.
The key problem areas identified are the need:
• to develop a method to engage a new user community of regional planners, policy makers, anda public concerned about energy and environment issues (AUSTIN, 1977; WARD, 1978; DENT& YOUNG, 1981; BELL & WOOD-HARPER, 1992; DALAL-CLAYTON & DENT, 1993;STOCKING, 1994b);
• for both specialists and non-specialists to have a common baseline of spatial reference andterminology (MITCHELL, 1991);
• for the involvement of geoscientists in the design of an improved information system (WARD,1978) based upon current developments in information science (GILCHRIST, 1986);
• to encompass a much larger range of activities in a improved information system, including (1)deciding who needs a particular information, (2) information product planning, (3) acquisition,selection and conceptual structuring of information, (4) finding appropriate ways of presenting(forms of words and non-verbal forms), (5) making decision on format, and (6) translatingdecisions (ORNA & STEVENS, 1991).
3. Research Area Demarcation
Two principal difficulties in the delivery of information need to be studied (Figure 1): (1) the provision ofusable information in the context of broad perspective for regional analysis (strand A); and (2) theprocess for display of information for specific purpose use (strand B). The map of natural regional units(strand A) contains a careful selection of physical and ecological information designed for non-specialist users. The original source of physical information, by itself, is difficult to be immediately usedby non-specialist users for practical purposes. The natural units format was designed for the user toaccess related spatial information for biophysical and socio-economic uses. The information forspecific purpose use (strand B) is a process for presentation of information. In a specific purpose use(strand B), not only the use of detailed information can be required but also data for regional analysis(e.g. small scale map – see Figure 2).
2Non-specialists are information systems users who, while having specialist knowledge in some subjects do not have theparticular skills and in-depth knowledge of the original natural resources information being brought through the informationsystem.

3
(A) MAP OF NATURAL UNITS (CONTEXT OF BROAD PERSPECTIVE OF A REGIONAL ANALYSIS)
INFORMATION
SYSTEM
-FROM MAP OF NATURAL UNITS (CONTEXT OF BROAD PERSPECTIVE OF A REGIONAL ANALYSIS)
(1) -SMALL SCALE
-OTHER NATURAL RESOURCE DATA IN THE CONTEXT OF BROAD PERSPECTIVE OF A REGIONAL ANALYSIS
-FROM MAP OF NATURAL UNITS (CONTEXT OF BROAD PERSPECTIVE OF A REGIONAL ANALYSIS)
-SMALL SCALE
(B) SPECIFIC USE (2) & OTHER NATURAL RESOURCE DATA IN THE CONTEXT OF BROAD PERSPECTIVE OF A REGIONAL ANALYSIS
(process) -DETAILED
(3) -DETAILED
FIGURE 1. The use of the map of natural units in the information system context.
In Espirito Santo, the current problems with the descriptive information provided are:
• the ambiguity in the characterization and location of areal references (Strand A),• difficulties in retrieving information from dispersed sources, and the wide range in type and level
of regional information provided (Strand A),• the lack of identifiable indicators for the considered variables (Strands A and B),• the lack of obvious relevance for local decision-making (Strand B) and• the available information systems for specific practical use are not structured for receiving new
information derived from the users’ experience (Strand B).
The strand A of the information system represented on Figure 1 is a natural unit division and needs tobe developed to solve shortcomings corresponding to points (a), (b) and (c). The strand (B) of theinformation system is a process for information design (or for data presentation) and needs to bedeveloped to solve shortcomings corresponding to (c), (d) and (e). Both strands (A) and (B) aresynergistic in the solution of current problems with descriptive information in Espirito Santo State.Improvements on the current problems with descriptive information need to be separately evaluated forstrands A and B. This paper concentrates upon the challenge of improving information design forstrand A, although there are important implications for strand B.

4
Figure 2. Information for specific purpose use relates to natural resourceinformation at two levels of detail. For specific purpose use non-natural resource information is also included.
Three principal objectives have been formulated:
• To characterize units of the environment, their qualities and problems, in an accessible way tothe non-specialist users of natural resource information.
• To improve the performance on the use of information to assist the implementation of programsof transference of technology, credit, land use, investment and research in tropical regions.
• To make spatial data intelligible for non-specialists, and to offer users better recognition ofinformation of complex environments in order to match program and planning decisions with thecharacteristics of each environmental unit.
4. Methodology
This research involves the bringing together of information from diverse sources and experiences: 1)variables considered important in existing methods; 2) analysis of existing databases; 3) demands inthe form of development plans and priorities in ES State; 3) relation with indicators; 4) characteristics ofES in terms of spatial differentiation in some important variables and 5) observation surveyedespecially for the purpose. Feasible design is important in this process.
The performance of the map of natural units in providing better perception, interpretation andtransference of knowledge was tested. This included verifying among non-specialist users theaccessibility of information. Validation of the research is accomplished through assessingimprovements to the current situation. In particular, the capability of users to handle information isanalyzed. This is an aspect often neglected, which this research attempts to redress.
The development of the map of natural units for regional analysis has three steps (Table 1): (1) design,(2) appraisal and (3) implementation.
-SPECIFIC PURPOSE USE INFORMATION
-NATURAL RESOURCE DETAILED DATA
-NATURAL RESOURCE INFORMATION AT THE LEVEL OF REGIONAL ANALYSIS

5
Table 1. Component items in the design, appraisal and implementation of thenatural units
Item Map Of Natural Units For GeneralRegional Analysis
Design
Subject Natural Units
Vehicle For Information Flow Diagram, Text And Map
Participants Specialists
Appraisal
Aspects Improvement In Perception, Interpretation AndTransference Of Knowledge
Appraisers Non-Specialists
Implementation
Characteristics Broad Natural Units Zoning And Mapping ToGuide More Detailed Analysis
4.1 Design
According to MITCHELL (1991), a parametric approach adds precision and reliability to thephysiographic approach. A model associating parametric and physiographic information obtained froma variety of sources is used in the development of natural units. If the design of ecological areas as abaseline for regional communication is not improved, users would be hampered in accessing most ofthe important regional data especially about climate and soil usually required in display of informationfor specific purpose use.
Key factors considered in natural units development can be seen in Figure 3. Clustering of variables tomake them more purposeful was a particular challenge of the development of this map. Assessmentsby knowledgeable persons and personal experiences in geographical indicators on climate, soil andrelation between humans & other living forms and land condition were considered. Based upon theseconsiderations, a comparatively small number of variables were chosen. Every variable still in theiroriginal sources was divided into classes. These classes were related to key biophysical processes inthe landscape in order to provide a “genetic” basis for understanding the derived units. Variables wereclustered to define natural units. Although specific to ES, the process of classification and clusteringassists ready communication and provides basis for field area location by users.

6
Temperature,TopographyWater,Nutrients,Oxygen (Drainage)Marine Influence.
Bennema et al, 1965;Fao, 1976;
CLUSTERINGclustering of information, but witha feasible method for an immediatere-access of original information
INDICATORSclustering of original data wasdesigned, considering itsrepresentation by indicators
USER ACCEPTABILITY MAPmap of natural units
-Synthesis without suppression of basicdata BENNEMA (1978).
-Map is a descriptive model(VALENZUELA, 1991)
-Description depends on familiarterms.and not on the best description(BONO, 1990).
-Soil and climate present high demands inmany biophysical studies involving manand other living forms; RESENDE (1982)attempts at showing some linkages ofcomponents of the real world using theserelations.
-A selection of variables brought togetherin a certain way in order to raiseecological awareness of spatialdescription needed, but this is onlya part of an information system.
Figure 3 - Key factors considered in the development of the map of natural units

7
Terrain units provide an integrated framework for a wide range of land resources, notably soils,water, and vegetation, and thus for an equally wide range of users (MITCHELL, 1991). Humanperceptions of environmental problems may include particular views about natural resourceelements of the environment such as climate, soils, human beings and other living forms(BRINK et al., 1968; MILLER, 1968; CHRISTIAN & STEWART, 1968; BECKETT & WEBSTER,1969; HOWARD, 1970; STRAHLER, 1976; BUTZAR, 1976; RESENDE at al., 1993). Thesenatural resource variables and interrelationships between them and living organisms are keyinputs to our human perception of the environment, its exploitation and associated problems.The approach here emphasizes surveying and interpretation of information on climate and soilsources, and their relation to human and other living forms that are relevant to Espirito SantoState (Table 2 and Figure 4). Clustering of climate and soil data was highlighted and displayedin a practical form even though this was at the level of general regional analysis3.
In order to retain as much information as possible and not to lose data during the process,special care was taken to extract relevant information on climate and soil from the original database of Espirito Santo State (Figure 3). From climatic data, the aspects related to temperatureand water were highlighted; from soil survey data, the availability of nutrients, oxygen(drainage) and general topography (land degradation) were considered. Instead of consideringthe standard soil characteristics such as texture, depth, slope, stoniness, for the selection ofvariables, the advice of BENNEMA et al. (1965) and BENNEMA (1978) was followed in thebroad regional context and those aspects of direct interest to plant and animal growth wereconcentrated on. A plant's basic requirements are nutrients, water, radiation energy,temperature regime and air. Because topography (relief) is related to surface water availability(streams and rivers), trafficability by machinery and soil erodibility, these aspects were alsoincorporated in this natural resource assessment. Data on radiation energy was not directlyused for the division of natural regional units. This is because (1) original regional data andregional indicators are not readily and clearly available and (2) absorbed radiation is partlyconverted into thermal energy which is already incorporated in temperature. However, radiationenergy can be included in presentation of information for specific use in, for example,landscape exposure. Other attributes, such as soils under marine influence, tidal flooding andsandy coastal areas, were also highlighted in the map of natural units since they are alreadyfamiliar as important development constraints and have been used as a basis for makingnatural divisions of the State.
3
General regional level refers to the natural resource level where general attributes may be recognised; it can be
classified as an exploratory level.

8
Table 2. Key variables for natural regional units: primary human andbiological influences in their clustering in the original sourcesand their spatial organization
Primary Influence for ClusteringOriginal Sub-Divisions
Effect On Spatial Organization
TemperatureCultivation or non-cultivation of coffee and the varietiesgrown were taken into account in boundary settlementbetween different thermal regions. Coffee growing is (1) avery important activity for the sustainability of a significantlabour force constituted by small farmers and sharecroppers(GOVERNO DO ESTADO DO ESPIRITO SANTO, 1992;LOSS, 1994), (2) largely cultivated State-wide and (3)related the thermal regions (FEITOZA & RESENDE, 1993).
Sub-divisions of the temperature original data wereclustered to represent (1) cold mountainous high,(2) mild mountainous medium and (3) hot low areasboth crystalline and flat sedimentary zones whichcorrespond to these clustering of temperature andcan be expressed roughly through their altitudesand other biophysical indicators. Identification oftransition areas causes no confusion to user.
ReliefDistribution and activities of man over the sloping and flatareas of the State and spatial aspects of human settlementand use of these areas can vary. Sloping relief containsmore rivers, streams, water sources and small farmers thanflat areas (RESENDE et al. 1994) and this difference maycause marked differentiation in land-use systems (FAO,1993).
Soil units from the level lands of the sedimentaryzone (plain) and the soil units which amalgamatethe crystalline areas (sloping) were clusteredseparately and highlighted which can be seenthrough direct landscape observation.
WaterThe number of dry months annually was adopted as easilyunderstood by users.STOCKING & ABEL (1981) emphasize that by its verycomplexity and sensitivity, the use of plant indicators isreplete with difficulties and, a local knowledge is invaluablein deciphering the causes of vegetation changes. Fieldobservations were undertaken to find one plant indicator forhydrological zones, which could be easily observed at anyseason of the year. A specific survey was undertaken State-wide for the registration of Calotropis procera occurrence,checking if its incidence in different geographic positionsshows a regularity of natural distribution demarcated by thedry region (more than 6 dry months) boundaries.
In some transitional parts from mild mountainous tohot and low zones, the length of the dry seasonshows a steep gradient in increase in number of drymonths. Consequently, a parameter based onnumber of dry months was determined, with 4 to 6dry months characterizing the rainy/dry transitionzone. Indicators which can be observed in field tripshelp to locate only some dry zones (>6 months dry).Identification of rainy/dry transition areas withoutmap indication may cause confusion to the user.
NutrientSince eutrophic soils are 1) not abundant, 2) react differentlyto the degradation process and 3) are of special importanceto the small farmers’ maintenance, general regional analysisshould highlight the soil units with one or more eutrophiccomponents. Indicator as soil colour (STOCKING, 1980) canalso be applied to this purpose in Espirito Santo (RESENDEet al, 1994).
The decision in considering soils of intermediatefertility (moderate) was much more in function of theinvaluable need to find location of better quality inland nutrients. Spatial organization related to soilnutrients presents, in field conditions, a satisfactorypattern for practical regional location in terms ofidentification of rich and poor lands. To locate areasof intermediate fertility (moderate) without mapsupport may cause confusion to the user.
Flooding and Marine Influence (Tidal Flooding and Soil Texture)Liability to flooding was used in determining soil oxygen atregional level in a simple manner. Liability to tidal floodingwas a refinement for more subdivision of an already familiarnatural area, which is fast developing in tourism (HOLANDAet al., 1993).
After a preliminary trial embracing classification andspatial analysis of all soil units, it was realized thatcriteria applied to these parameters were confinedto flat lands along the coast. Those soil units withmarked oxygen deficiencies in the low crystallineand level lands of the sedimentary zone wereclustered and highlighted. The Tidal Flooding andSandy Coastline familiar to the user, were alsoseparated and highlighted.

9
Example:-Small farmers with annual "per capita" income of about 500U$ make up about 60% of Espirito Santo rural population.(GOVERNO DO ESTADO DO ESPIRITO SANTO, 1992;LOSS, 1994). Development projects for these demographicconditions should give priority towards maintenance of landcapability. Risk must be minimized for small farmers (seefertility) and they must be aided to develop their own locally-tested solutions in order to achieve sustainability (STOCKING,1993).
HUMAN
Examples:
TEMPERATUREvaries greatly
WATER variesgreatly
CLIMATE
TETRAHEDRONCoffee variety variesin differenttemperatures. Coffeerepresents 93% of thepermanent cultivatedarea.
Calotropis proceraoccurrence in dryareas (water).
SOIL
-sloping lands contrast strongly with flat lands inES (TOPOGRAPHY). This may cause marked differentiation inland-use systems (FAO, 1993).
-flooded areas with OXYGEN deficiencies present a greatcontrast with areas not subject to flooding.
-rich soils are important for small farmers who need lessdependence on external inputs. Lack of FERTILITY causesproblems in land use systems (FAO, 1993).
-ES has a long coastline - MARINE INFLUENCE.
Figure 4. Ecological tetrahedron adapted for explanation of theinterrelationships of variables used in the development of themap of natural units of this research (after RESENDE, 1982)
ORGANISMS

10
For general regional analysis, the State is divided into natural units presented in a map. Thedegree of homogeneity within each mapping unit across a broad array of factors was theoverriding criterion for aggregation. Homogeneity was determined (1) by the variation of thefactors (a) temperature, (b) water (climate source), (c) relief, (d) nutrient, (e) oxygen/root zoneand (f) marine influence/soil texture & tidal flooding (soil source) and the criteria for determiningcategories in the process of clustering of each variable in their origin (Table 3) and (2) by theresults in terms of possible display of the subsequent integration of all those previous individualclusters {(a), (b), (c), (d), (e) and (f)}. The result within regional units is the synthesis ofproperties of temperature, relief, water, nutrient, oxygen (in the root zone) and marine influence(soil texture and tidal flooding) also related human and biological issues relevant to ES State.
Every unit specifies natural resource qualities and problems as identified by traditionalinformation sources, integrating variables that are identified as relevant to Espirito Santo Stateconditions (Table 4 and Figure 4). Indicators are useful in order to enhance practicalinterpretation and to provide a rapid field reconnaissance of a particular natural unit. Whenpossible, units are differentiated by specific indicators that are common in Espirito Santo State.Categories of (a) temperature and (b) water (1) clustered in the climate map (FEITOZA, 1986)and categories of (c) relief, (d) nutrient, (e) oxygen (in the root zone) and (f) marine influence(soil texture and tidal flooding) (2) clustered in the soil map & its manual (OLIVEIRA et al.,1983; SANTOS et al., 1987; IBGE,1994) and their corresponding denomination are shown inTables 3 and 4. Non-specialist information highlighted from the climate (FEITOZA, 1986) andsoil (OLIVEIRA et al., 1983 and SANTOS et al., 1987) map at the level of regional analysis areshown in the first column of Table 3.
The criteria were evaluated for the choice and clustering of original variables from soil andclimate data sources. Twelve information providers, most of them specialist users of naturalresource data, participated in the discussions. Designing regional units required experience incontacts, knowing the providers of information, interacting and consulting with key users,planners and decision makers. Common qualities of immediate relevance and applicability tousers, and the correction of acknowledged deficiencies in existing systems, were identified inorder to design the method.

13
Table 3. Applied criteria used in soil1 and climate1 database to classifynatural regional units
(1) Temperature
Denomination
Criterion:Altitude�(metres)
Frostperiod�(months)
Degree-daysabove 10°C �(degree-days/year)
Meanmaximumtemperaturefor the hottestmonth (°C)
“Coldperiod”�(months)
Number of hourswith temperaturebelow 7°C�(hours)
Mean minimumtemperature forthe coldesmonth (°C)
Cold > 1.200 > 3 < 2.440 < 25,3 5,5 > 150 <7,3850-1200 0 - 3 2.440 - 3.190 27,8 - 25,3 4,5 - 5,5 50 - 150 9,4 - 7,3
Mild 450 - 850 0 4.040 - 3.190 30,7 - 27,8 0,0 - 4,5 0 - 50 11,8 -9,4Hot 0 – 450 0 5.080 - 4.040 34,0 - 30,7 0 0 18,0-11, 8� Lands above 1,200 metres are inhabited by farmers and above 1,800 metres they are decreed for permanent protection.� Month with a minimum of one frost in each four years (25% probability). Frost only occurs in specific places of the farmlandscape.� Temperature of 10° C was used as reference because it is base temperature for most of the traditional crops of Espirito SantoState - this information is useful for the inference about thermal availability.� Number of months too cold for cultivating Phaseolus vulgaris which is a traditional crop of Espirito Santo. The behavior of thiscrop is known by all farmers. This parameter aims to express the “cold state “ of regions through the prognostic behavior of a plantavoiding the expression of degree centigrade of meteorological data.� Useful parameter in the study about regional potentiality for growing varieties of many fruit trees from temperate climate origin.
(2) Relief
Denomination Criterion Relief Slope (%)
Sloping Clustering of soil mapping units ofcomponents with slope above 8 %.
Rollinghillymountainousescarpment
8 - 20 %20 - 45 %45 - 75 % > 75 %
Plain Clustering of soil mapping units with at leastone component with slope below 8 %.
flatgently undulating
0 - 3 %3 - 8 %
(3) Water�� Denomination
Criterion Wet period (U)� (months) Annualprecipitation excess�
SummerwetnessindexPP/ETP�
Dry period (S)� (months) Annualprecipitationdeficit �
WinterwetnessindexPP/ETP�
Mapindication�
J F M A M J J A S O N D (mm) (dec.jan.fev.)
J F M A M J J A S O N D (mm) (jun.jul.ago.)
Rainy < 4 drymonths
U U U U U U U U U U U U 1016 1.90 U U U U U U U U U U U U 0 1.811
U U U U U U U P P U U U 430 - 676 1.39 - 1.74 U U U U U U U P P U U U 23 -140 0.44 - 1.07 2U P U U U P P P P U U U 236 - 366 1.00 - 1.46 U P U U U P P P P U U U 56 - 174 0.67 - 0.86 3U U U U P P P S P U U U 267 - 623 1.44 - 1.83 U U U U P P P S P U U U 89 - 339 0.41 - 0.78 4U P U U P P P S P U U U 178 - 393 1.08 - 1.29 U P U U P P P S P U U U 126 - 191 0.46 - 0.67 5P P P P P P U P P U U U 95 - 157 0.82 - 1.04 P P P P P P U P P U U U 147 - 274 0.69 - 0.96 6
Rainy/dry
4 to 6 dry U P P P P P P S P U U U 87 - 378 0.96 - 1.31 U P P P P P P S P U U U 157 - 284 0.47 - 0.697a
transition months U U U U P S S S S U U U 222 - 494 1.31 - 1.83 U U U U P S S S S U U U 170 - 237 0.30 - 0.39 7bP P P P P P P S P U U U 21 - 145 0.81 - 1.00 P P P P P P P S P U U U 139 - 372 0.65 - 0.79 8
Dry > 6 dry P S P P P P P S P P U U 28 - 58 0.68 - 0.85 P S P P P P P S P P U U 251 - 388 0.56 - 0.749a
months P P P P P P P S S P U U 11 - 91 0.91 - 1.02 P P P P P P P S S P U U 255 - 426 0.48 - 0.64 9bU P P P P P S S S P U U 36 - 185 0.85 - 1.21 U P P P P P S S S P U U 223 - 448 0.39 - 0.44 9cP S P P P P S S P P U U 28 - 31 0.68 - 0.74 P S P P P P S S P P U U 388 - 496 0.38 - 0.59 10aU P P P S S P S S P U U 28 - 268 0.85 - 1.40 U P P P S S P S S P U U 210 - 360 0.38 - 0.61 10bU P P P S S S S S P U U 92 - 123 1.07 - 1.30 U P P P S S S S S P U U 325 - 407 0.22 - 0.33 11P P P S S S S S S P U U 29 - 62 0.86 - 0.94 P P P S S S S S S P U U 429 - 606 0.17 - 0.37 12S S S S P P P S S S S S 0 0.27 S S S S P P P S S S S S 977 0.46 13
� The hydrological number of map indication is displayed according to its regional number of dry months. Every month partially dry(P) is considered a half dry month.

14
� Number of months with precipitation equal to or greater than the potential evapotranspiration. The wet period allows inferenceabout the rainy season location throughout the year. The P character means month partially dry (potential evapotranspiration >precipitation> ½ potential evapotranspiration ).� Sum of the monthly precipitation excess in relation to the potential evapotranspiration.� Ratio precipitation / evapotranspiration in the summer.� Number of months with precipitation smaller than half the demand of water by evapotranspiration.Dry period allows inferenceabout the dry season throughout the year.� Sum of the monthly precipitation deficit in relation to the potential evapotranspiration.� Ratio precipitation / potential evapotranspiration in the winter.� Numbers indicated in the original climate map (FEITOZA, 1986). They are in order from the wettest to the dryest region. Everyregion is represented by a number and remains within discreet boundary.
(4) Nutrients
Denominaton CriterionPoor Clustering of soil mapping units without eutrofic components.Moderate Clustering of soil mapping units (1) with three component soils, where only the second
in aerial extent is eutrofic; (2) with three components, where only the third is eutrofic .Rich Clustering of soil mapping units (1) where the first component is eutrofic; (2) with two
components where the second is eutrofic; (3) with three components, where the secondand third are eutrofics.
(5) Flooding, Soil Texture And Tidal Influence
Denomination CriterionNot subject to flooding Clustering of mapping units with flat or gently undulating relief without a gley horizon.Fine Fine textured Clustering of mapping units, not sandy and with flat or gently undulating relief.San Sandy Clustering of mapping units of flat relief with Hidromorfic Podzol and marine Arenosols.Subject to flooding Clustering of mapping units with flat relief and gley horizon.Not t Not tidal Clustering of mapping units of flat Gleysoils not tidal , with no salts or sulphur
accumulation.Tida Tidal flooding Clustering of mapping units of Mangrove Undifferentiated soils, Salty Soils or
Solonchacks and Thiomorphic Gleys.
1All original data (soil mapping units) remained discreetly shown in the map of natural units, but only the clustered data washighlighted. A table synthesis of the most important observation of every soil mapping unit component is shown in the map fortechnical purposes)2Temperature data was clustered and highlighted but the original data did not appear in the map of natural units. The original dataabout water availability remained in the map of a natural unit but only the clustered data was highlighted
The variables, which constitute the inputs for the general regional units, are handled in adefined order. The final assembly, adopted after a trial procedure to set sequence, is as follows:(1) temperature, (2) relief, (3) water, (4) nutrients and (5) flooding & marine influence (soiltexture and tidal influence). This sequence helps for: 1) explanation, 2) designation of units, 3)design of the legend and 4) arrangement of flow diagrams (e.g. decision tree).
The key objective of the map design was to clarify and to set a layout that would encourageunderstanding of its content. The legend was designed to provide the users with an easy-to-learn model thereby dispensing with the need for constant referral. The mapping symbols’ usecolour and signs is intended to convey directly a meaning without use of text and without needto learn a particular language.
The number of variables selected is limited only by the complexity of the mosaic of natural unitsthat must be generated. Clustering the data is a process which involves: 1) identifying a reliableindicator, preferably for at least one major unit (range) per variable; 2) having an indicator whichmay be recognized in the field and in all seasons; 3) presenting the criteria used in atransparent way.

15
For quicker recall, memorization and easier recognition of the location of natural units on themap and field, the original data were divided into two sets of factors (Table 4): (1) temperature(cold, mild and hot), relief (sloping and flat), sufficiency of water (rainy, rainy/dry transition anddry); These determine Zones and (2) availability of nutrients (poor, moderate and rich), flooding(not subject to flooding and subject to flooding), soil texture (fine textured and sandy) and tidalinfluence (tidal and not tidal) to determine Sub-zones. Sub-zones are also sub-divided intoProvinces exclusively for technical communication.
Table 4. Original data and its role in the designation of natural units1
Factor Parameter Land designation
ZoneTemperature ALTITUDE COLD
MILDHOT
Relief NUMBER OF COMPONENTS OF SOIL UNITCLASSIFIED ASLEVEL LAND
SLOPINGPLAIN
Water NUMBER OF DRY MONTHS RAINYRAINY/DRY TRANSITIONDRY
Sub-Zone
Nutrient TOTAL NUMBER OF SOIL UNIT COMPONENTSAND NUMBER AND POSITION OF SOIL UNITCOMPONENTS CLASSIFIED AS EUTROPHIC
POORINTERMEDIATERICH
Flooding PRESENCE OF GLEY HORIZON NOT SUBJECT TO FLOODINGSUBJECT TO FLOODING
Soil Texture PRESENCE OF SANDY COASTAL AREA FINE TEXTUREDSANDY
TidalInfluence
OCCURRENCE OF TIDAL FLOODINGOCCURRENCE OF SALTS OR SULPHURACCUMULATION
NOT TIDALTIDAL FLOODING
1Province is the lowest level after sub-zone but its denomination is exclusive for technical communication
Except for temperature, all original information taken from climate and soil maps have theiroriginal sub-division of information preserved and transferred to the map of natural units (Table5). The original and detailed sub-divisions of temperature were the only ones not completelytransferred because (1) they could not feasible to be represented and (2) the result of thesimplification with the new clusters was considered detailed enough.

16
Table 5. Procedures for integration of information and overallappearance of the climate and soil sources and the newoutcome
Procedures
First Step Second Step
WATER and TEMPERATURE: original parameters wereseparately clustered from the climate map source (FEITOZA,1986) and transformed into individual temporary plains ofinformation. Original parameters of water were clustered but alloriginal intermediate detailed values were preserved in a non-highlighted format.
TOPOGRAPHY (RELIEF), NUTRIENTS, SOIL/OXYGEN andMARINE INFLUENCE: original parameters were separatelyclustered from the soil map sources (OLIVEIRA et al., 1983;FAUSTINO NETO et al.; 1987 and IBGE, 1994) andtransformed into temporary plains of information. All variableshad their original parameters clustered but all originalintermediate detailed values were preserved in a non-highlighted format.
BIOPHYSICAL RELATIONS: each clustering has parametricvalues and recurrent physiographic expression which may berepresented by a relevant biophysical relation for ES State.
Integration of the clusters of (1) temperature, (2)relief, (3) nutrient, (4) soil/oxygen (in the root zone)and (5)marine influence (soil texture and tidalflooding) ending in physiographic units withparametric correspondence.
Overall Appearance
Source OutcomeCLIMATE: coloured map at 1:400,000 (FEITOZA, 1986) withthirteen climatic variables.
SOIL: uncoloured map at 1:250,000 (IBGE, 1994) and usermanual with coloured map at 1:1,000,000 (OLIVEIRA et al.,1983; FAUSTINO NETO et al., 1987). Soil maps embracesmany variables.
Soil coloured map at 1:400,000 with user manual from ACHAPANOSO et al.,1978 was specifically used to study the originalvegetation phase.
Coloured map, scale 1:400,000 with zones andsub-zones levels with parametric andphysiographic expressions, showing criteria usedand with the unusual and additional characteristicof also providing details of the origin. The naturalunits synthesise parameters of (1) temperature, (2)relief, (3) nutrient, (4) soil/oxygen (in the root zone)and (5)marine influence (soil texture and tidalflooding). Hard copies available through electroniccomputer printout or normal print run processes.An extensive cartographic data-base as referenceto orientation in subjects other than thematic issuesis also provided.
Only one plane of information for regional analysis (map of regional units) was used because:
1) The reasoning for one plane of information includes the needs for: a) a common source ofinformation for multiple users which can also be a common basis for areal references; b)one accessible information source so that non specialist users can regionally perform onregional perceptions, interpretations or even simple decisions not having to revert tosubject-matter specialists.
2) The merits found on the development of one plane of information include: a) the
accomplishment of a complex design with the attendant risk of occurrence of unintelligiblemosaics; b) the educational, instructive and user-friendliness of information; c) thesimultaneous accessibility of original information sources; d) the accomplishment of adesign with suitability for further connections with models for more detailed analysis.

17
3) The assumptions are: a) for the presentation of synthesis of key multi-factor for specificpurpose, the specialist and non-specialist must participate jointly; b) for the presentation ofsynthesis of key multi-factor for specific purpose other sources or planes of natural resourceinformation are constantly considered; c) for the presentation of synthesis of key multi-factorfor specific purpose the map of natural regional units is merely considered a source thatruns alongside other regional sources providing information for multiple users also acting asa common basis for areal references.
4.2 Appraisal
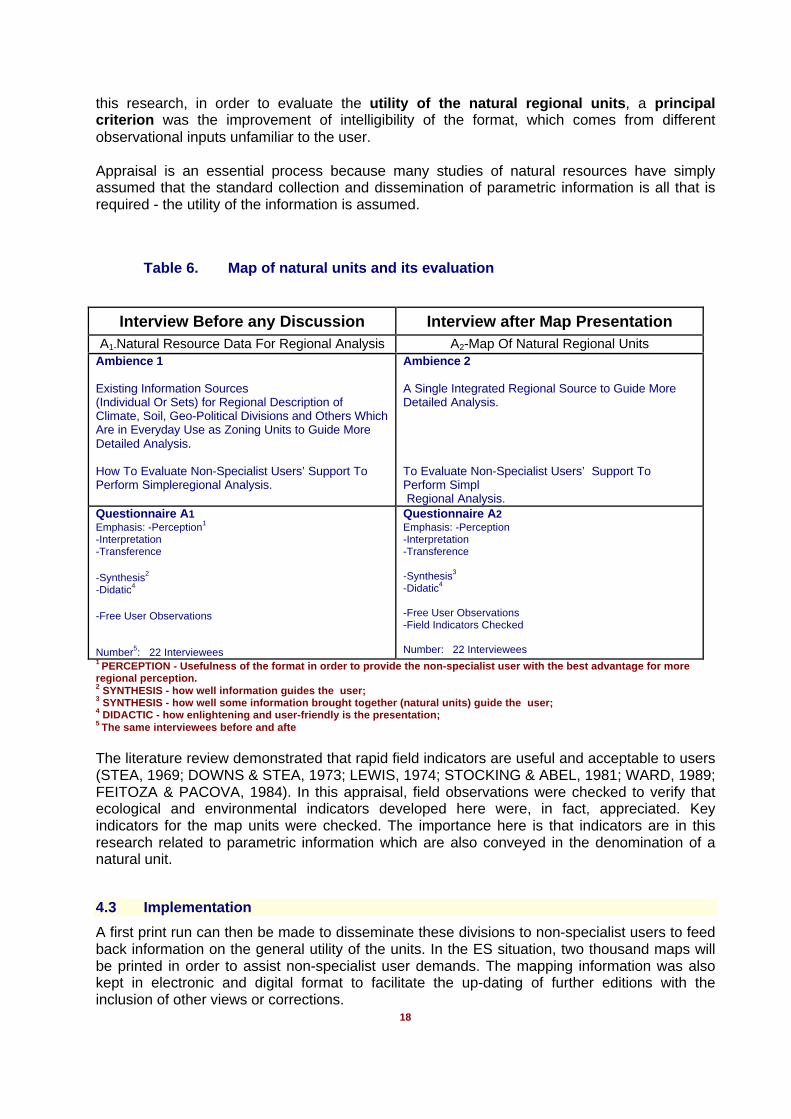
The design and application of the map of natural units was evaluated for its ability to provideuseful information and with an emphasis on the improvement of the degree of perception,interpretation and transference of knowledge for practical application of the information fordevelopmental purposes (Table 6). These evaluations were undertaken through a speciallyconstructed set of questions designed to elicit the views of relevant people at two key timeperiods: 1) before discussion of this research - i.e. with no knowledge of the reasons for orobjective of this study; and 2) after the display of information.
For the map of natural units, the appraisal emphasized the interviewees’ perception of thestrengths and weaknesses of the division of ES into natural units as an information source. Thiswas done by drawing comparisons between (1) the derived map of natural units and (2) existinginformation sources for regional description, such as climate, soil, regional geo-political division.Appraisal was then based on interviewee’s reactions to the two sets of information sources. Insupport of the quantitative assessment of responses to individuals’ questions, anecdotalevidence was compiled for specific questions that attracted additional comment byinterviewees.
Face-to-face interviews were undertaken to assess the performance of the new system for avariety of user perspectives. Three factors were observed in the selection of interviewees: (1)potential as a user of natural resource information, (2) availability for lengthy interviews inEspirito Santo State at two different times and (3) variability of experience. Twenty-twodecision-makers and planners, non-specialist users of natural resource data from differentbackgrounds, involving a wide variety of clients (agronomists, biologists, economists, medicaldoctors, civil engineers, veterinarians, economists, teachers, businessmen and ruralextensionists) were interviewed.
Interviews were carried out using the following procedures: 1) appointment at the user’s placeof work or other convenient locality; 2) the initial interview was conducted in the ambience ofthe traditional methods and sources without mention of the methods or procedures of thisresearch; 3) the topic was treated as an open-ended discussion; 4) interviewee reactionsrecorded through a) answers to multiple choice questions related to the degree of certainty andb) observation of user expression from free answers to questions and free observations withoutquestions.
Descriptive statistical analysis of frequency distribution was the method adopted in thequestionnaire analysis (SAS, 1982; GOMES, 1977). Specifically for the observations related toperception, interpretation and transference of knowledge a non parametric statistical test wasused (CAMPOS, 1979; CONNIVER, 1971). Free observations were classified, clustered andregistered by frequency of distribution per group. For the development of diagrams HarvardGraphics software was used (LARSEN, 1990).
In particular the appraisal process takes in consideration the use of the current methods fordisplaying natural resource and correlated information as its baseline condition, and comparethe change in perception, interpretation and transference of knowledge by the new system. In
18
this research, in order to evaluate the utility of the natural regional units, a principalcriterion was the improvement of intelligibility of the format, which comes from differentobservational inputs unfamiliar to the user.
Appraisal is an essential process because many studies of natural resources have simplyassumed that the standard collection and dissemination of parametric information is all that isrequired - the utility of the information is assumed.
Table 6. Map of natural units and its evaluation
Interview Before any Discussion Interview after Map PresentationA1-Natural Resource Data For Regional Analysis A2-Map Of Natural Regional Units
Ambience 1
Existing Information Sources(Individual Or Sets) for Regional Description ofClimate, Soil, Geo-Political Divisions and Others WhichAre in Everyday Use as Zoning Units to Guide MoreDetailed Analysis.
How To Evaluate Non-Specialist Users’ Support ToPerform Simpleregional Analysis.
Ambience 2
A Single Integrated Regional Source to Guide MoreDetailed Analysis.
To Evaluate Non-Specialist Users’ Support ToPerform Simpl Regional Analysis.
Questionnaire A1Emphasis: -Perception1
-Interpretation-Transference
-Synthesis2
-Didatic4
-Free User Observations
Number5: 22 Interviewees
Questionnaire A2Emphasis: -Perception-Interpretation-Transference
-Synthesis3
-Didatic4
-Free User Observations-Field Indicators Checked
Number: 22 Interviewees1 PERCEPTION - Usefulness of the format in order to provide the non-specialist user with the best advantage for moreregional perception.2 SYNTHESIS - how well information guides the user;3 SYNTHESIS - how well some information brought together (natural units) guide the user;4 DIDACTIC - how enlightening and user-friendly is the presentation;5 The same interviewees before and afte
The literature review demonstrated that rapid field indicators are useful and acceptable to users(STEA, 1969; DOWNS & STEA, 1973; LEWIS, 1974; STOCKING & ABEL, 1981; WARD, 1989;FEITOZA & PACOVA, 1984). In this appraisal, field observations were checked to verify thatecological and environmental indicators developed here were, in fact, appreciated. Keyindicators for the map units were checked. The importance here is that indicators are in thisresearch related to parametric information which are also conveyed in the denomination of anatural unit.
4.3 Implementation
A first print run can then be made to disseminate these divisions to non-specialist users to feedback information on the general utility of the units. In the ES situation, two thousand maps willbe printed in order to assist non-specialist user demands. The mapping information was alsokept in electronic and digital format to facilitate the up-dating of further editions with theinclusion of other views or corrections.

19
Table 7 summarizes the main methodological steps and procedures for implementation ofnatural units developed and validated under actual real-life use.
Table 7. Methodological stages in implementing the map of naturalregional units to assist non-specialist users
1. Planning Stage• Identify natural regional causal factors and constraints related to important biophysical, economic and social
aspects• Take users’ views about shortcomings in natural regional divisions• Conduct information survey to support the study• Identify the main feasible information to be displayed
2. Display Design Stage• Synthesize all information into an integrated design for a map of the natural units in such way that the user will
be able to access it all immediately; all information must also be shown on one map• Design of clustering of original natural resource information based upon important biophysical, economic and
social relations• Provide separate maps for every variable• Information altogether can be managed using digital or conventional hard copy process• Settlement of legend layout that encourages prompt reading and understanding of all content immediately
3. Pre-Implementation Stage• Make sure that non-specialist users’ views, taken in the initial interview (see stage 1) about shortcomings in
natural regional resource data presentation are considered
4. Implementation Stage
• Make sure availability of enough copies of map in order to meet demand of every potential non-specialist user inES State
• Dissemination of information and meetings to provide instructions about its use• Keep information in a digital format (optional) for eventual further improvements• The Nuclei of Studies about Land Use Planning – NEPUT at Espirito Santo Agricultural and Animal Husbandry
Research Public Enterprise – EMCAPA is the place for occasional meetings to assess modifications to the map
5. Results
5.1 Natural Units
A colour map, scale 1:400.000, divides Espirito Santo State into 9 zones or major units andeach zone is composed of a number of sub-zones varying from 3 to 6 synthesizing informationfor a large complex region within 34 natural units. The audience of non-specialists users canuse zone and sub-zone levels as baseline communication. An example of a natural unit is thereference for the Zone 7 - Hot lands (temperature), plain (relief), rainy (water sufficiency), andSub-zone 7.3 which refines the natural unit with the terminology: poor (nutrients), subject toflooding but not tidal (marine influence). Province is the lowest level of a mapping naturalregional unit and there are 204 in total. The added information for the province level (databaseand terminology) assists specialist users on technical matters.
The natural unit can also be depicted as a decision tree, showing the typical arrangement of thenatural units. Besides the map legend, the body of the map contains further information to allowthe user to verify the evidence upon which a criterion for highlighted information was based.Each natural unit can be accompanied by a technical synthesis of the relevant and specificinformation concerning: (a) temperature, (b) water (climate source), (c) relief, (d) nutrient, (e)oxygen/root zone and (f) marine influence/soil texture & tidal flooding (soil source) of each landunit and other original data from climate and soil which is presented in a non-highlighted way.That is to say, the original technical information used in the process can be reassessed

20
simultaneously. Also featured is a table giving a resume of the principal attributes for each soil(Synthesis model developed by RESENDE, 1993c) unit and indicating the natural units intowhich they are allocated. The map of Natural Units has either a part of soil unit or an entire soilunit as the lowest level within a sub-zone - for this level the terminology is “province”. The visualcommunication was essential for speedy recognition of map units by interviewees Immediatetextual description or a mental image of the map unit can be retained.
A feature, such as a plant species or a surface soil colour, is in this research considered anindicator if (1) it is related reliably and consistently to a specific amplitude or range of a variableof key interest and (2) there is a rational association between the feature and the variable.Indicators are a way of engaging our mental perceptions of the environment and ourconstructions of reality. In practice, we have to compartmentalize the real world in order to storeinformation, access it for analysis, make decisions and plan action. This compartmentalizationis a type of construction readily perceived at the field level when associated with field indicators.Associations of indicators to components of natural units, which have been consistentlychecked, are shown in the Table 8 and Table 9. These indicators represent a selection ofcurrent knowledge of field association with mapped natural regional units. These associationscome from a process of field perception which is ongoing and kept under a continuum revisiontoward stable conclusions.
It is expected that, because of the increasing familiarity of the natural regional unit division,there is a temptation for the user to regard this division as more valid than others with obscurityin relationships with field indicators. The natural unit is strengthened each time it is successfullyused as a natural unit description. The more useful it appears, the more it comes to be used;the more it is used, the more useful it seems. For this type of division which aims to conveyregional differences feasible for immediate perception and location having potential forstrengthening its recognition for a wide use is valuable.

21
TABLE 8 Indicators related to natural resource factors that delimit thenatural regional units
TEMPERATURESome human activities and biotic and abiotic relations with temperature at zone level.
MeanTemperature2-Coldest - Hottestmonth month
oC
Numberof drymonth2
Indicators3 Some peculiarities
Hot and Sloping4; Hot and Plain (red)5
12 – 18 31 - 34 2 - 8 0 to 450 metres of altitude1
Robusta coffee and other tropicalcrops
The Hot Lands contain most of the(1) richsoils,(2) extensive flat land soils, (3) drylands, and (4) great rivers of ES State.6They also contain most of the fragileNatural Units, affected both by long dryseasons and low soil fertility
Mild and Sloping4 (green)5
9.5 – 12 28 - 31 0 – 4.5 450 to 850 metres of altitude1
Arabica coffee
Notable presence of deep soils andextensive rainy zone.7 High density ofdrainage network with permanent watersources
Cold and Sloping4 (blue) 5
7 – 9.5 25 - 28 1 - 3 850 to 1.200 metres of altitude1
Little coffee arabica(just ascribed tothe boundaries of mild zones) withsimultaneous increase of farmswhich depend upon vegetablegrowth. More well drained darksoils, typical of high lands
Notable presence of deep soils and entireregion into a rainy zone. High density ofdrainage network with permanent watersources. Absence(or nearly absence) ofmoderate or rich soils.
1 Clustering information from climate map which was highlighted in the map of natural regional units; 2 Information foundin climate map; 3 Biophysical field relations with temperature (altitude) were initially made looking at the original sub-divisions at the map of climate. 4 The first word refers to thermal condition and the second to the general relief landscape.5 Colour in the map of natural regional units (See APPENDIX 9) 6 It also has great surface of poor plain and sloping soilsand rainy lands. 7 It also has lands with the winter markedly dry in some points of the mountainous massif.
RELIEFFlat and sloping areas are easily identified at field level
NUTRIENTRed soils are an important indicator for a wide range of rich soils in Espirito Santo State (RESENDE et al, 1994).
FLOODING AND MARINE INFLUENCE (SOIL TEXTURE AND TIDAL FLOODING)Subject to Flooding, not Subject to Flooding, Tidal and Sandy Coastal areas are familiar at field level

22
WATERSome relations with water availability at zone level
HydrologicalClusters1
Hot and Sloping,Hot and Plain(0 - 450 m)
Mild and Sloping
(450 - 850 m)
Cold and Sloping
(> 850 m)
Indicators SomePeculiarities
Legend2No Drymonth3
Legend2No Drymonth3
Legend2No Drymonth3
Rainy
--3--6
--2,5--4
12345-
012,533,5-
-2-4--
-1-3--
------
------
Rainy/dryTransition
7a7b8
4,54,55
-7b-
-4,5-
---
---
---
---
Dry
9a9b9c10a10b1112-
6666,56,578-
--------
--------
--------
--------
PresenceofCalotropisprocera4
Containmost of therich soils ofthe State
1Clustering information from climate map which was highlighted in the map of regional units. the original subdivisionswere discretely kept in the map of natural units. 2 Hydrological regional numbers found in the climate map which follow anorder according to their amount of dry months. 3Every month partially dry (P) is considered half a dry month.4Field observation about the plant incidence and its relation with the hydrological original climate map number were takenthrough many trips in different places and in different year season.
Table 9. Factors and parameters for denominating natural regionalunits and examples of their relationships with field indicators
Factor Parameter Denomination Examples Of Indicators1
ZoneTemperature Altitude Cold - Altitude > 850 metres
- Decreased occurrence of arabica coffee,and more vegetables.
Mild - Altitude between 450 and 850 metres- Arabica coffee
Hot - Altitude < 450 metres- Robusta coffee and intensification of
other tropical cropsRelief Quantity Of
ComponentsClassified As Level InThe Soil Unit
Sloping
Plain
- Easily identified in the regionallandscape
- Easily identified in the regionallandscape
Water Quantity Of DryMonths
Rainy - Descriptive and narrative examples(vigour of vegetation , for example)
Rainy/Dry - Only descriptive and narrative examplesDRY - Presence of Calotropis procera

23
Sub-Zone
Nutrient Total Quantity ofComponents,Quantity ofComponent Classifiedas Eutrophic and ItsRank Within A SoilUnitRemark: if acomponent isdystrophic or allic it isclassified as poor.
PoorIntermediateRich
- Absence (or near absence) of red soils- Presence of some red soils- Marked presence of red soils
Flooding PRESENCE OFGLEY HORIZON
Not Subject ToFlooding
- Easily identified in the regional landscape
Subject To Flooding - Easily identified in the regional landscapeMarineInfluence
SOIL TEXTURE Fine Textured - Absence of sandy coastal lands
Sandy Coastal Lands - Sandy coastal landsTIDAL FLOODING Not Tidal - Easily identified in the regional landscape
Tidal Flooding - Easily identified in the regional landscape1These indicators are to complement information for the user who needs to locate a natural regional unit in the field whichis represented in the map. Therefore, abstraction by the users is required for a field location of a regional mapped area.
DOWNS & STEA (1973) explain that an attribute originates from a peculiar pattern ofstimulation consistently associated with a particular phenomenon which, in combination withother attributes, signals the presence of the phenomenon.
The use of altimeters or visual indicators such as (1) arabica coffee grown in the Mild Lands, (2)robusta coffee grown in the Hot Lands (temperature) and (3) absence of arabica coffeegrowing with the concomitant increase of vegetable growing for the Cold Lands are examples ofindicators for natural units at zone level (Tables 8 and 9).
Some natural restriction can control the opportunities for the development of some individualsof a species inside some boundaries. The "algodao da praia" or "algodao de seda" plant(Calotropis procera) originated in Africa, found favourable environments to propagate in Braziland today is common all over its Northeast region(LIMA, 1975). As an indicator it has theadvantages of being (1) easily spread, (2) easily identified and (3) it is sui generis in terms ofcapability to identify at zone level complicated phenomena (water).
Because most eutrophic soils are red in Espirito Santo State (RESENDE et al, 1994), colourcan be useful to identify sub-zones of rich lands (fertility). STOCKING & ABEL (1981) alsosuggest the use of soil colour as an indicator
Relief, flooding and marine influence (texture and tidal flooding) indicate themselves directlyfor regional zones and sub-zones.
Other information making linkages between natural regional units and visual indicators, couldbe added. Attributes such as surface water availability (streams and rivers) and, soil erodibilityare of considerable interest to natural resource assessment (FAO, 1993). For the Flat Landsnot Subject to Flooding there are less streams and rivers than the Sloping Lands where thesmall farm population is greater. Within the Zone of Hot Lands, Dry and Poor can be foundmore problems of soil erodibility than inside Hot Lands Rainy and Poor because the action oftwo stresses simultaneously (poor and dry) is more severe (RESENDE et al.,1995).
The 9 zones and 34 sub-zones were also classified on the current degree of certainty in theiridentification with indicators. They can be broadly classified as: 1) unambiguous, 2) ambiguous

24
but promising and 3) ambiguous. The terminology unambiguous signifies an indicator readilyrecognizable and always present. Ambiguous but promising means (a) indicator readilyrecognizable but not always present or (b) expressed with reduced degree of ambiguity due to anotable presence of a causative factor but still depending upon descriptive or narrativeexplanation. Ambiguous means an indicator expressed with ambiguity due to a gentlepresence of a causative factor but possible in being well expressed when supported bydescriptive or narrative explanation.
The nested areas which form spatial patterns that come from the adopted ranges fortemperature, relief, flooding and marine influence (soil texture and tidal flooding) belong to thecategory of indicators unambiguous which means prompt, logically and clearly identified.Because altitude is an easy parameter to be assessed, even the transition zones fortemperature (mild zones) do not provide problem, being promptly and clearly identified.
For both water and nutrient criteria for transition zones, the identified indicators are somewhatinexact. For example, in the rainy/dry transition zone or moderate fertility transition sub-zoneonly descriptive narrative is currently available to identify the mapping unit. Where Calotropisprocera comes in for dry lands, greater certainty is possible. Moving into either rich or poorfertility areas, the presence or absence of red soils reduces the degree of ambiguity.
For the extreme zones in the aspect of parameter ‘Water’ (dry and rainy) the presence ofCalotropis procera is enough to indicate dry land in the surrounding area. Aspects of vegetationforms in rocky surfaces, in sandy coastal areas or vigour of vegetation during the year arepotential examples just to name a few of many other probable observations that can bedeveloped. For the extreme zones in the parameter ‘Nutrient’ there are indicators such asintensity of red or “white” (pale) soil in the landscape, presence of cocoa farms along the riveron a non red coloured soils and many other situations which are able to lead the user to matchthe mapped natural unit with the characteristic of the landscape. That is why for both theseconditions of extreme (1-dry and rainy; 2-rich and poor) the possibilities of indicators isclassified as “ambiguous but promising”.
Within each unit, combinations of indicators for different specific ranges of variables help toidentify the natural unit at Zone and Sub-zone levels. Although the development of thisapproach using indicators was somewhat subjective, they facilitate the field identification of theunit. The identification of indicators shows a satisfactory coverage for the different range ofvariables and the progress achieved suggests that the current degree of ambiguity can bereduced with the development of more studies involving field observations are done.
5.2 Suitability to ES’ s needs
Due to the multiplicity of aspects involved it is impossible for any one natural regional unitdescription to accommodate all complexities. However the interviewees strongly agree that theEspirito Santo State needs a simple procedure to express its natural divisions. The map ofnatural units tends to encompass regional topical questions relevant to the development ofneeds in Espirito Santo rural areas. From the functional perspective there is also a need to looknot only at the advantage in having indicators but also to see how demands for thedevelopment plans and priorities in ES can be met by adjusting the process of natural unitsdesign (Table 10).

25
Table 10. Demands in form of development plans and priorities in ESState and its translation into design information priorities forrepresentation of natural regional units
Es Demands Priorities In The Design Of Nat. Reg. Units
Map Scale- map which covers a large area (45.000 Km2) on one
map sheet, e.g. a scale of 1:400.000.- small number of key variables selected only from
original basic data source. Possibilities to re-accessthe original data source.
Interpretation And Transference Of Knowledge- Practical and simple to be interpreted and
transferred.- values of physical information which provide
fundamental “genetic linkages” with the potentialbiological or social performance.
- field-based systems (indicators) for natural regionalresource data interpretation.
- involvement of geoscientists in the necessarychanges in the scientific and technicalcommunication.
- evaluation in the light of the user views- providing workability with data which were usually
restricted to the use by trained professionals.Decision-Makers, Planners And Planning Team
- natural regional resource information capable ofintegration into decision-making processes ofdifferent professions.
- terminology and display in a format which is familiarto non-specialist users.
Information Management- selection of fundamental physical information which
underlies causative regional qualities and constraintsin biophysical, economic and social aspects.
- ability to extrapolate for a wide range of differentdemands.
- to speed data access.- new variables and new rearrangements of feasible
variables must be related to the pattern of old originalsource.
- clear meaning and location of the selected physicalattributes.
- selection of clustering of some original values oftemperature, relief, water, nutrients, oxygen (in theroot zone) and marine influence (soil texture andtidal flooding) according to specific design for ES.
Regional Zoning/Rapid Regional Appraisal- diversification of activities taking advantage of the
diversity of environments, ecology and potential ofland use.
- information workable for policies of projectprioritisation, and spatial investment distribution.
- information that makes clear remarkableenvironmental differences as a preliminary source ofdata for different specific practical use.
- expressing fundamental regional diversity ofenvironments and ecology.
- natural regional units description avoidingshortcomings of descriptive ambiguous terms
- natural resource data providing linkage with the mainbiophysical qualities and problems.
- divisions displayed through an intelligible naturalregional unit.
Support To Sustainable Development- land tenure and settlement of peasants.- suitable activities which demand low input
technologies for those who have limited land, labourcapacity, capital and inadequate access to credit,infrastructure, technology and social assistance.
- activities that provide more income and control overtheir own resources for those neglected socially,economically and physically (environmentallimitations).
- activities that help stem the massive rural-urbanmigration.
- maintenance of land capability and intrinsicproductivity.
- emphasise the regional natural resource points thatshould clarify and encourage a quick understandingof the natural units content emphasising those mainlimitations which the development of activities or anyother biological phenomena should cope with.

26
6. Evaluation
This research addresses the difficulty that non-specialists face in accessing and usinginformation on natural resources (See confirmation by users on Table 11). The map of naturalunits (1) considers only the use of original source of natural resource data and (2) aims toprovide information for non-specialist users. It asks: can the power of perception, interpretation,and transference of knowledge be improved?
Dividing the real world into ‘natural units’ is somewhat arbitrary and subjective but for thecurrent problem area on descriptive information in Espirito Santo, a design is needed whereecological information of the spatial patterns of the State can be used as a common baselinefor communication. A general aspect evaluated after the map presentation was how well someinformation brought together (natural units) guide the user. Different angles for analysis ofimprovements on this general question were explored by a questionnaire. Paired histogramscorresponding to all these questions were analyzed and improvement on user’ guidance can beconsistently seen cross-checking trends of many related questions.
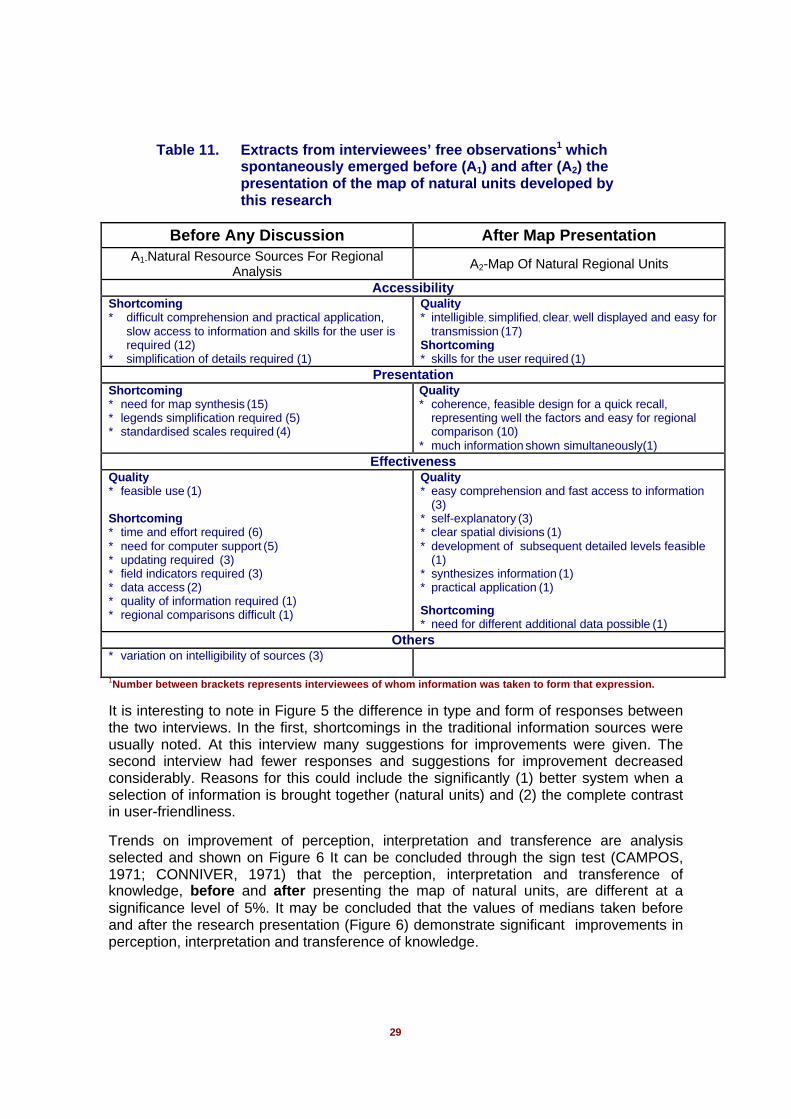
Table 11 summarizes the spontaneous user views (e.g. interviewees’ free opinions) about theuse of the available source of natural resource information for general regional analysis (1)before the presentation of the map of natural units and (2) after the map of natural regionalunits was presented by this research. It is interesting to consider how individual spontaneousexpressions are touching different relevant angles of the problem area in study. Because theresponse reported in Table 11 was spontaneously given, and because it is grouped undersingle expressions, some detail is lost. Nevertheless, the frequency of response gives a goodmeasure of the strength of feeling in the interviewee group as a whole. However, individualresponses are valued for their perspective insights of the success of the map of natural units.
29
Table 11. Extracts from interviewees’ free observations1 whichspontaneously emerged before (A1) and after (A2) thepresentation of the map of natural units developed bythis research
Before Any Discussion After Map PresentationA1-Natural Resource Sources For Regional
Analysis A2-Map Of Natural Regional Units
AccessibilityShortcoming* difficult comprehension and practical application,
slow access to information and skills for the user isrequired (12)
* simplification of details required (1)
Quality* intelligible, simplified, clear, well displayed and easy for
transmission (17)Shortcoming* skills for the user required (1)
PresentationShortcoming* need for map synthesis (15)* legends simplification required (5)* standardised scales required (4)
Quality* coherence, feasible design for a quick recall,
representing well the factors and easy for regionalcomparison (10)
* much information shown simultaneously(1)Effectiveness
Quality* feasible use (1)
Shortcoming* time and effort required (6)* need for computer support (5)* updating required (3)* field indicators required (3)* data access (2)* quality of information required (1)* regional comparisons difficult (1)
Quality* easy comprehension and fast access to information
(3)* self-explanatory (3)* clear spatial divisions (1)* development of subsequent detailed levels feasible
(1)* synthesizes information (1)* practical application (1)
Shortcoming* need for different additional data possible (1)
Others* variation on intelligibility of sources (3)
1Number between brackets represents interviewees of whom information was taken to form that expression.
It is interesting to note in Figure 5 the difference in type and form of responses betweenthe two interviews. In the first, shortcomings in the traditional information sources wereusually noted. At this interview many suggestions for improvements were given. Thesecond interview had fewer responses and suggestions for improvement decreasedconsiderably. Reasons for this could include the significantly (1) better system when aselection of information is brought together (natural units) and (2) the complete contrastin user-friendliness.
Trends on improvement of perception, interpretation and transference are analysisselected and shown on Figure 6 It can be concluded through the sign test (CAMPOS,1971; CONNIVER, 1971) that the perception, interpretation and transference ofknowledge, before and after presenting the map of natural units, are different at asignificance level of 5%. It may be concluded that the values of medians taken beforeand after the research presentation (Figure 6) demonstrate significant improvements inperception, interpretation and transference of knowledge.

30
Before Any Discussion After Method Presentation
A1- Natural Resource Sources For Regional Analysis A2- Map Of Natural Regional Units
Percentage Of Respondents Who Displayed Ideas For Improvements
86
410
0
20
40
60
80
100
Y N NO
Y - yes(presented); N - no(not presented); NO - no opinion
14
82
4
0
20
40
60
80
100
Y N NO
Y - yes(presented); N - no(not presented); NO - no opinion
% Respondents consulting sources when information isrequired2, divide into categories of consistency of use
% Respondents that would consult the map wheninformation is required2, divide into categories ofconsistency of use
14 14 1827 27
0 00
20
40
60
80
100
A U O S R NE
NO
A - always; U - usually; O - often; S - sometime; R - rarely; N -never;
NO - no opinion
64
2313
0 0 0 00
20
40
60
80
100
A U O S R NE
NO
A - always; U - usually; O - often; S - sometime; R - rarely; N -never;NO - no opinion
1Questions and response categories were fixed and determined in advance; respondent chooses from amongthese fixed responses.2It should be pointed out that even in situations, which require such consultations, some users avoid doing so.
Figure 5. Interviewees’ observations 1 taken before (A1) and after(A2) the map presentation about (1) suggestions forimprovement (percentage of interviewees) and (2)frequency of access to sources when required 2
(percentage of interviewees)
% %
% %

31
Figure 6 Gain perception, interpretation and transference ofinformation on the views of the non-specialistsinterviewees1
Before Any Discussion After Method PresentationA1- Natural Resource Sources For Regional Analysis A2- Map Of Natural Regional Units
Perception
09
4150
00
20
40
60
80
100
E ME MD D NO
E - easy; ME - moderately easy; MD - moderately difficult;D - difficult; NO - no opinion
68
32
0 0 00
20
40
60
80
100
E ME MD D NO
E - easy; ME - moderately easy; MD - moderately difficult;D - difficult; NO - no opinion
Interpretation
0
1827
55
00
20
40
60
80
100
E ME MD D NO
E - easy; ME - moderately easy; MD - moderately difficult; D - difficult; NO - no opinion
50 50
0 0 00
20
40
60
80
100
E ME MD D NO
E - easy; ME - moderately easy; MD - moderately difficult;D - difficult; NO - no opinion
Transference
189 14
59
00
20
40
60
80
100
E ME MD D NO
E - easy; ME - moderately easy; MD - moderately difficult;D - difficult; NO - no opinion
73
27
0 0 00
20
40
60
80
100
E ME MD D NO
E - easy; ME - moderately easy; MD - moderately difficult;D - difficult; NO - no opinion
1The same 22 interviewees were the respondents before and after.
%
%
%
%
%
%

32
In some way to talk about the influence of the use of synthesis in terms of providingmore perception is misleading; it may suggest or even promote an unconscious beliefthat the synthesis is an obvious agent that acts upon human perception. This, of course,is not strictly true, except in a very limited sense, as for example, in the context of ESState where in the absence of an alternative, the non-specialist user is forced to consulta large number of large extended individual original regional sources of information (SeeTable 11, about interviewee’s spontaneous observations). The difference is that in orderto do synthesis through a design of natural regional units, the physical andenvironmental data used were selected as a conventional representation of a naturalcondition but are now designed and tested within a format which was not accessiblebefore. Although synthesis may be adjusted to relevant data, its effects do not have thesame strengths in both users’ contexts, being much less among specialists than amongnon-specialist users.
Even if the best possible description to display information is not achieved, the familiarterms in which the natural unit is based can be reflected in a relative gain in transferenceof information to the non-specialist users. One indicator of this is that interviewees wouldconsult regional information from the map of natural units with higher frequency than thetraditional sources (Figure 5). The map also retains immediate capability to re-accessthe original information. Thus the approach of the map of natural units makesinformation immediately available and this effect of giving accessibility for a set ofrelevant selected information provides a means for a gain in perception to non-specialists users.
In this research, the parametric approach was used as a complementary method of thephysiographic approach or vice-versa. The natural unit denomination is a direct referralto their parametric approach. Because the natural units are retaining the benefits ofdouble approaches, some advantages in relation to the “Microrregioes Geograficas”system (FUNDACAO IBGE, 1990), Itapemirim basin divisions (LANI, 1987) and riverbasin units can be observed. They are: (1) the immediate translation of their divisions toother idioms is feasible; (2) there is immediate linkage for re-accessing the parametricrelated information; (3) indicators can be immediately linked with main specific variablesof the division.
For regional analysis, the basic problem is the determination of what gives any region itsessential distinctive quality, and it is only on that basis that satisfactory regional lines canbe drawn. Here we must be concerned with the physical framework, its functions, andalso with the regional images which can be taken by the non-specialist users. Thedesign of natural units is dealing in many ways with a pattern of factors that tend tooperate as a unit, which is more than the simple sum of its parts. For example, thenatural units Cold, Rainy and Poor Land are more meaningful than the separate totals ofits temperature, “water” and nutrient components; that same original data soil unitconveyed as poor (nutrient component) in other context (e.g. Hot, Dry and Poor) doesnot have the same interpretation as in this one context of Cold, Rainy and Poor. Eachaspect of an natural unit exists in context, is interrelated with other aspects, and cannotbe understood completely unless it is seen in its total context, nor can the area as awhole be understood unless all of its interrelated aspects are seen. Users identifythemselves with their own area and with its characteristics, including landscapes,seasons, and a host of other attributes which differ from region to region and this justifiesthe attention given to a design where the clustering process derives strength from the

33
consideration of biophysical relations. This information is not only described in anintelligible and tested format but also transparency is immediately shown in the way datafrom original sources come together to form the natural units division of the State.
It would be strange if such an obviously limiting or conditioning factor as climate andsoils, one that varies so greatly from place to place in ES, did not have a discernible partin influencing the pattern of human society. But this does not mean that people who liveunder certain climatic and soil conditions are bound to think or live in a certain fixed way,or that climate and soil of some part of the State gives to its inhabitants a distinctlyprogressive or backward character. The environment usually operates as a whole. Toisolate one of its factors and ignore the others is to misrepresent the actual situation,where there are a host of non-environmental factors operating as well, and wheretechnological change is also taking place. The physical environment considered in thenatural regional units is important as one of many influences on man acting in concert,not as a determinant. It is both difficult and misleading to examine the environmentalinfluence without continual attention to other influences.
MURPHY (1972) claims that to make regional divisions intelligently, it is firstly necessaryto understand as well as possible what gives the region its coherence and distinction,what its essential unifying or common qualities are, and secondly to determine thetransition where these qualities significantly diminish and are replaced by another set ofqualities belonging presumably to another region. He points out that usually there is awide zone of transition and the line is difficult to draw. Both these characteristics ofcoherence and distinction were in the natural units successfully developed and usersreacted optimistically to this quality presented (See Table 11 – presentation).
User response shows a positive reaction to the general application for fieldreconnaissance about what is shown on map. The design of the natural unit gave priorityfor the use of “all” that might be friendly, instructive-educational and accessible toimmediate attention. The information science was re-arranged in a user-friendlycommunication and specific indicators for classes of each variable were studied. Theseindicators will work as a “track” or “finger print” of the natural units for a better fieldperception and as a consequence better dissemination and acceptance by the user. It isinteresting to observe how at any moment attention may be directed to just one part of asituation and the result of such attention can be a regional perception. The perceptionconsists of information obtained by any number of different senses from that part of theregional environment, which is being attended to. For example, for confirmation of a Dryregion the mere observation of Calotropis procera presence, even though during therainy season, would confirm or assure that zone designation. This indicator synthesizesin this way the expression of all complicated technical regional information for dry zones.All the senses may contribute to the perception, but for this example one of them aloneis sufficient. The purpose of this study of natural units is to understand and explain, or atleast to make available an important part of regional accumulated data which set manwithin the frame of the lands which he inhabits; this necessarily involves criticalexamination of man’s interrelations with his physical base, as well as the variety of otherfactors which influence him and which contribute to regional differences. In this way aset of indicators for the regional differences are discussed but development of studies formore indicators are still in need.
Self-critical judgements of this research and as a consequence characteristics of thenatural regional units, its strengths and weaknesses were shown on Table 12.

34
Table 12. Strengths and weakness of the natural regional units ofES State, Brazil
Characteristics Strengths Weaknesses- Intelligible format for natural unit
divisions using unfamiliarobservations from original datasources.
- Immediate user comprehensionand fluency on its use feasible
- All information at one map
- The map makes clear the wayinformation from original sourcescame together to form the naturalunits.
- Immediate fluency on unitsdenomination by users ofdifferent languages is feasible
- Units can be read without legendreferral
- Two integrated legends areprovided: (1) user-friendly and (2)technical
- Many aspects of biophysical,economic and social importanceand specific to ES can be related(meta-data)
- The process for unitsdenomination is logically linked toprominent factors andreproducible
- It immediately shows how unitsdiffer from each other
- It is designed to be used by non-specialist
- It is physiographic and parametric
- Retains capability to re-accessspecialised or original informationsources
- Available in both (1) digital and(2) hard copy format, providingareal references and location andalso in (3) schematic format(decision tree).
- It does not show which is the onedominant factor and the othersubsidiary ones
- It’s a man-perceived classificationof a welter of areal differenceswhich actually is a continuum ofnatural regions.
- It can not assist demands otherthan those related to the variablesconsidered
- For some shortcomings detectedin the original sources a newsurvey, reclassification ormodification of original data werenot carried out
- Its methodological concept isimposed.
- More indicators still need to bedeveloped
In this research a balance between simplicity in the expression of natural units andsimplicity of its relationships with some indicators seems to have been achieved. Thenatural unit expression itself can be easily mastered by non-specialist users. The studyof technical organization of natural units and the use of re-accessibility of originalinformation are greatly facilitated when both specialists and non-specialists are workingtogether. The importance of this creation of assemblies of basic natural units in ES State

35
should eliminate the dilemma of ambiguous communication for expressing situationswhen some more ecological instructive-educational and enlightening location anddescription of regions.
6.1 Conclusion
The major findings for this investigation are:
• The natural units offered to users a sound basis for field reconnaissance ofcomplicated environments in order to match regional program and planningdecisions with the characteristics of each environmental regional unit.
• The spatial data and its system design was evaluated successfully for non-specialist users.
• The methodological stages in implementing the map of natural units havepotential for application in other regions.
For the map of natural regional units the results are qualitatively useful for arealreference and indicative of apparent magnitude of regional quality and problems. Twodistinct aspects are involved in the design of the map of natural units: 1) preservation oforiginal quality of information and 2) improvement in communication.
Whether the information is presented as individual variables or as one integral map, theoriginal quality of information must be preserved. Five situations in the preservation ofquality were challenged:
1. The assembling of different key variables within one plane of information: this difficultprocess was feasible and in practice demonstrated.
2. The intelligibility for non-specialists requiring natural resource information: thisaccessing of needed information is enhanced, as evidenced through the userevaluation.
3. The flexibility to re-access original information sources: because the original dataquality is preserved, this process is made possible for particular users who need togo back to original sources.
4. The employment of field indicators: many of the mapping units have easily-identifiedindicators, thus assisting the process of mental recognition and observation.
5. The clarity of the criteria in the construction of mapping units providing an immediateidea of the basic principles used (specialist information).
Data transference is at the heart of the process of information retrieval andcommunication. The objective is to enhance the presentation of the information in orderto make it accessible to all users. In order to meet the needs of communication, thefollowing attributes were important:
1. a logical and reproducible process for designation of natural units;

36
2. a legend and designation that provides an immediate understanding of the nature ofthe unit;
3. flexible output for units as area reference and schematic diagrams.
7. Further Developments
This research leads naturally to further developments in the use of information systemsin ES State. Some of these developments help to fill gaps in the current research: othersare a natural progression and further refinement of techniques and methodologies.Clearly indicated are needs to:
• disseminate the use of natural regional units,• manage attribute data of natural regional units with GIS tools,• increase the level of detail and develop further criteria for subsequent natural
units.
8. References
ACHA PANOSO, L. A. ; GOMES, I.A.; PIRES FILHO, A. M.; BONELLI, S. (1978). Levantamento dereconhecimento de solos do Estado do Espirito Santo. Boletim Tecnico No 45, EMBRAPA -SNLCS, Rio de Janeiro. 461pp.
AUSTIN, T. B. (1977). Challenges in meeting public needs for science information. EDS (EnvironmentalData Service Newsletter). November:2-6.
BECKETT, P. H. T. & WEBSTER, R. (1969). A review of studies of terrain evaluation by the Oxford-MEXE-Cambridge Group, 1960-1969. Christchurch, MEXE, Report 1123.
BELL, S. & WOOD-HARPER, T.(1992). Rapid Information Systems Development: a non-specialist's guide toanalysis and design in an imperfect world. Mc Graw-Hill Book Company, London . 222pp.
BENNEMA, J. (1978). Land evaluation for agricultural land use planning. In: SWINDALE, L. D.(ed.). HawaiiAgricultural Experimental Station, College of Tropical Agriculture, Hawaii. pp. 130-140.
BENNEMA, J. ; BEEK, K. J. & CAMARGO, M. N.(1965). Interpretacao de levantamento de solos no Brasil.Primeiro esboco de aptidao de uso da terra para levantamentos de reconhecimento de solos.Divisao de Pedologia e Fertilidade do Solo/FAO, Rio de Janeiro. 51pp.
BONO, E. de (1990). The use of lateral thinking. Penguin Books, London. 144pp.
BRINK, A. B. A.; PARTRIDGE, T. C.; WEBSTER, R. and WILLIAMS, A. A. B.(1968). Land classification anddata storage for the engineering usage of natural materials. In: Proceedings of the Symposium onthe Terrain Evaluation for Engineering. Australian Road Research Broad Fourth Conference, vol. 4.pp.1624-1647
BUTZAR, K. W. (1976). Geomorphology from the Earth. Harper & Row, New York.
CAMPOS, H. de (1979). Estatistica experimental nao parametrica. ESALQ, Sao Paulo.
CHRISTIAN, C. S.(1958). The concept of land units and land systems. In: 9th Pacific Science Congress,Bangkok. Vol. 20. pp 74-81.
CHRISTIAN, C. S. and STEWART, G. A. (1968) Methodology of integrated surveys. In: Unesco Conferenceon Principles and Methods of Integrating Aerial Survey Studies of Natural Resources for PotentialDevelopment. Unesco, Paris, Toulouse. pp.233-280
CONOVER, W. J, (1971). Practical non Parametric Statistics. John Wiley Sons, New York. 462pp.
DALAL-CLAYTON, B. & DENT,D.(1993). Surveys, plans and people. A review of land resource informationand its use in developing countries. Environmental Planning Issues No 2, The EnvironmentalPlanning Group/ The International Institute for Environment and Development, London. 148pp.

37
DENT, D & YOUNG, A. (1981). Soil survey and land evaluation. George Allen & Unwin, London. 278pp.
DOWNS,R.M. & STEA, D. (1973). Cognitive maps and spatial behaviour: process and products. In: Downs,R. M. & Stea, D.(eds.). Image and environment - cognitive mapping and spatial behaviour. AldinePublishing Company, Chicago. pp. 8-27.
FAO (1976). A framework for land evaluation. Soils Bulletin No 32, Food and Agriculture Organization of theUnited Nations, Rome. 72pp.
FAO. (1993). Guidelines for land use planning. FAO Development Series No 1. FAO Inter-DepartamentalWorking Group, Rome. 96pp.
FAUSTINO NETO, M.; MARINHO, M. de A.; TOMASI, J.M.G.; RIBEIRO, A. G.; MACHADO, M. B.; FROES,M. C. F. C.; RIBEIRO, A.G. (1987). Uso potencial da terra. Capacidade de uso dos recursosnaturais renovaveis. In: PROJETO RADAMBRASIL. Folhas SF. 23/24 Rio de Janeiro/Vitoria.Levantamento de Recursos Naturais No 32. Rio de Janeiro. pp.625-775
FEITOZA, L. R. (1986). Carta agroclimática do Estado do Espírito Santo. EMCAPA. Mapa na escala1:400.000. Color.
FEITOZA, L. R. & PACOVA, B. E. V. (1984). Caracterizaçao de períodos frios críticos para a agriculturatradicional Capixaba. Série documentos No. 07. EMCAPA, Vitória-ES. 12pp.
FEITOZA, L. R. & RESENDE, M. (1993). Adequacao de ambientes quanto ao uso de terras no EspiritoSanto - priorizacao de projetos e programas de desenvolvimento. Vicosa, Minas Gerais. 59pp.(Estudo preliminar referente ao pre-projeto de Tese de Doutorado).
FUNDACAO IBGE (1990). Divisao Regional do Brasil em mesorregioes e microrregioes geograficas. IBGE,Rio de Janeiro, vol 1. 19pp.
GILCHRIST, A. (1986). What the information scientist has to offer. Journal of Information Science. 12(6):273-280.
GOMES, F. P.(1977). Curso de estatistica experimental. USP/ESALQ, Piracicaba, SP. 430pp.
GOVERNO DO ESTADO DO ESPIRITO SANTO (1992). Programa de desenvolvimento da agriculturacapixaba, subprograma de recuperacao e conservacao de recursos naturais. SEAG/ES, Vitoria.121pp. (Documento 2 - caracterizacao do setor agropecuario)
HOLANDA, E. L.; VALENTE, A. C. R.; MORAES, A. M.; RIBEIRO J. M. G.; BORGES, J. L. (1993). Perfil daeconomia do Espirito Santo. SEDES, Vitoria. 104pp.
HOWARD, J. A. (1970). Multiband concepts of forested land units. In: International Symposium of Photo-Interpretation. International Archives of Photogrammetry, Dresden, vol. 1. pp. 281-316
IBGE (1994). Mapa Exploratorio de Solos do Projeto RADAMBRASIL. IBGE, Rio de Janeiro. Escala1:250.000, folhas: Governador Valadares SE 24-Y-A, Sao Mateus SE 24-Y-B, Colatina SE 24-Y-C,Cachoeiro SF 24-V-A, Linhares SE 24-Y-D, Vitoria SF 24-V-B e Campos SF 24-V-C
LANI, J. L. (1987). Estratificacao de ambientes na Bacia do rio Itapemirim no Sul do Estado do EspiritoSanto. Universidade Federal de Vicosa, Vicosa, 114pp. (Tese de Mestrado)
LARSEN, G. H.(1990). Harvard Graphics: guia do usuario. Makron Books do Brasil/Mc Graw Hill, SaoPaulo. 362pp.
LEWIS, D. (1974). Wind, wave, star, and bird. National Geographic Magazine, 146(6):747-55
LOSS, W. R. (1994). Observacoes gerais sobre o setor agropecuario em termos de renda, mao-de-obraocupada e estrutura fundiaria. Vitoria-ES. 17pp. (Carta de 04 de outubro de 1994)
MITCHELL, C. (1991). Terrain evaluation. Longman Scientific & Technical, New York. 441pp.
MURPHY, R. (1972). The scope of geography. Rand Mac Nally&Company, Chicago. 173pp.
OLIVEIRA, V.; COSTA, A. M. R. da; AZEVEDO, W. P. de; CAMARGO, M. N.; OLMOS, J. (1983.).Pedologia. Levantamento exploratorio de solos. In: PROJETO RADAMBRASIL. Folhas SF-23/24Rio de Janeiro/Vitoria. Levantamento de Recursos Naturais No 32, Rio de Janeiro. pp.385-552
ORNA, E. & STEVENS, G. (1991) Information design and information science: a new alliance?. Journal ofInformation Science, 17: 197-208
RESENDE, M. (1982). Pedologia. Universidade Federal de Vicosa, Vicosa. 100pp.

38
RESENDE, M; LANI, J. L. & FEITOZA, L. R. (1993b). Assentamento de pequenos agricultores no Estado doEspírito Santo: Ambiente, homem e instituiçoes. SAE/EMBRAPA/UFV, Brasília-DF. 152pp.
RESENDE, M.; REZENDE, S. B. de; LANI, J. L. (1993c). Ambientes do Estado Espirito: uma abordagemecologica. Universidade Federal de Viçosa, Viçosa. (prelo)
REZENDE, S. B.; RESENDE, M.; LANI, J. L. ; CERQUEIRA, A. F.; FEITOZA, L. R.; CASTRO, L. L. F. de;STOCK, L. A.; BOREL, R. M. A.; ALVES, S. P.; BINOTTI JUNIOR, E. C.; SCHETTINO, L. F.;GALVEAS, P. A. O.; SILVA, J. N. da; ARAGAO, L.A. P. (1994). Perspectivas para odesenvolvimento florestal nas Bacias dos Rios Santa Maria da Vitoria e Jucu. SAE, Brasilia. 48pp.
SANTOS, J. H. G.; VIEIRA,E.I. & SILVA,G. B. (1987). Pedologia. Levantamento exploratorio de solos. In:PROJETO RADAMBRASIL. Folha SE.24 Rio Doce. Levantamento de Recursos Naturais No 34,Rio de Janeiro. pp. 229-352
SAS INSTITUTE INCORPORATION. (1982). SAS user’s guide statistics. Cary, North Caroline. 345pp.
STRAHLER, A. N. (1976) Principles of Earth Science. New Your, Harper & Row. 454pp.
STEA, D. (1969). The measurement of mental maps: an experimental model for studying conceptualspaces. In: Cox, K. R. & Golledge, R. G.(eds.) , Behavional Problems in Geography: A SymposiumEvanston, III: Nortwestern University Press. pp228-229.
STOCKING, M. (1993). Soil and water conservation for resource-poor farmers: designing acceptabletecnologies for rainfed conditions in Eastern India. In: Baum, E., P & Zobisch, M. (eds.) Topics inapplied resource management in the tropics. German Institute for Tropical and SubtropicalAgriculture. Witzenhauzen. Vol. 3: 291-305.
STOCKING, M. (1994b). Soil erosion and conservation: A place for soil science.In: Syers, J. K. & Rimmer(eds.), Soil science and sustainable land management in the tropics”. CAB International,Wallingford.
STOCKING, M. & ABEL, N. (1981). Ecological and Environmental Indicators for the Rapid Appraisal ofNatural Resources. Agricultural Administration, 8:.473-474.
VALENZUELA, C. R. (1991). Data analysing and modelling. In: Belward, A. S. & Valenzuela, C. V.(eds.)Remote sensing and geographical information systems for resource management in developing countries.Dorbrecht, Kluver Academic Publishers. pp. 335-355.
WARD, D. C. (1978). State-of-art in geocience information - USA. In: Harvey,A. P. & Diment, J. A.Geoscience information - a state-of-the art review. The Broad Oak Press Ltd, Hearthfield,Proceedings of the International Conference on Geological Information, pp.1-8
WARD, R. G. (1989). Earth’s empty quarter: pacific islands in a pacific century, Geographical Journal,155(20):235-246.