Manuscript version: Author’s Accepted Manuscript in WRAP is the...
33
warwick.ac.uk/lib-publications Manuscript version: Author’s Accepted Manuscript The version presented in WRAP is the author’s accepted manuscript and may differ from the published version or Version of Record. Persistent WRAP URL: http://wrap.warwick.ac.uk/119977 How to cite: Please refer to published version for the most recent bibliographic citation information. If a published version is known of, the repository item page linked to above, will contain details on accessing it. Copyright and reuse: The Warwick Research Archive Portal (WRAP) makes this work by researchers of the University of Warwick available open access under the following conditions. Copyright © and all moral rights to the version of the paper presented here belong to the individual author(s) and/or other copyright owners. To the extent reasonable and practicable the material made available in WRAP has been checked for eligibility before being made available. Copies of full items can be used for personal research or study, educational, or not-for-profit purposes without prior permission or charge. Provided that the authors, title and full bibliographic details are credited, a hyperlink and/or URL is given for the original metadata page and the content is not changed in any way. Publisher’s statement: Please refer to the repository item page, publisher’s statement section, for further information. For more information, please contact the WRAP Team at: [email protected].
Transcript of Manuscript version: Author’s Accepted Manuscript in WRAP is the...

warwick.ac.uk/lib-publications
Manuscript version: Author’s Accepted Manuscript The version presented in WRAP is the author’s accepted manuscript and may differ from the published version or Version of Record. Persistent WRAP URL: http://wrap.warwick.ac.uk/119977 How to cite: Please refer to published version for the most recent bibliographic citation information. If a published version is known of, the repository item page linked to above, will contain details on accessing it. Copyright and reuse: The Warwick Research Archive Portal (WRAP) makes this work by researchers of the University of Warwick available open access under the following conditions. Copyright © and all moral rights to the version of the paper presented here belong to the individual author(s) and/or other copyright owners. To the extent reasonable and practicable the material made available in WRAP has been checked for eligibility before being made available. Copies of full items can be used for personal research or study, educational, or not-for-profit purposes without prior permission or charge. Provided that the authors, title and full bibliographic details are credited, a hyperlink and/or URL is given for the original metadata page and the content is not changed in any way. Publisher’s statement: Please refer to the repository item page, publisher’s statement section, for further information. For more information, please contact the WRAP Team at: [email protected].

1
BEHAVIOR IN BEHAVIORAL STRATEGY:
CAPTURING, MEASURING, ANALYZING
Charlotte Reypens
University of Warwick & University of Texas at Dallas
800 West Campbell Road, Richardson, Texas 75080, USA
Sheen S. Levine1
University of Texas at Dallas & Columbia University
800 West Campbell Road, Richardson, Texas 75080, USA
[email protected], +1 972 883 5897
Measuring behavior requires techniques that can capture observed outcomes and expose
underlying processes and mechanisms. In this chapter, we present a toolbox of methods: We
designed experimental tasks to simulate decision environments and capture behavior. We
deployed protocol analysis and text analysis to examine the underlying cognitive processes.
In combination, these tools can simultaneously grasp antecedents, outcomes, processes, and
mechanisms. We apply these methods to collect rich behavioral data on two key topics in
strategic management: the exploration–exploitation trade-off and strategic risk-taking. This
mix of methods is particularly useful to in describing actual behavior as it is, not as it should
be, replacing assumptions with data and offering a finer-grained perspective of strategic
decision-making.
Keywords: Experiments; Protocol Analysis; Text Analysis; Exploration-exploitation; Risk-
taking
1 Corresponding author

2
In behavioral strategy, what constitutes “behavior” and how do we measure it? Scientists
agree that actual behavior, an outcome, stems from a blend of forces: biological and
neurological, psychological, economic, demographical, cultural, political and institutional, to
name a few. In behavioral strategy, scholars are often interested in understanding a
narrower blend, one that may include accounting for rational contemplation but also biases
and heuristics, intuition, and chance (Denrell, Fang, & Liu, 2014; Hodgkinson & Healey,
2008; Tversky & Kahneman, 1975). In any field, a foremost scientific challenge is that of
causality: Understanding an outcome while accounting for the forces driving it. This
challenge necessitates a toolbox of methods, so that researchers can document actual
behavior while peeking into the unobservable mechanisms. For instance, a choice between
two options has an observable outcome, but the underlying mechanisms cannot be observed.
They must be inferred.
Inferring and measuring such mechanisms is an important research challenge
(Hodgkinson & Healey, 2008). It requires techniques that help the researcher collect and
analyze data on decision-makers’ behavior and cognition. These can be hard to identify and
interpret, so here we propose two experimental instruments, which simulate decision
environments. These help us achieve both: Capturing decisional outcomes — choices in
ecologically valid settings — while accounting for their predictors through qualitative and
quantitative analyses.
Our instruments behaviorally capture two important topics in the field of strategic
management: the tension between exploration–exploitation (March, 1991) and strategic risk-
taking (Baird & Thomas, 1985). One instrument examines behavior in a canonical setting:
search on a rugged landscape, consisting of peaks and valleys (Billinger, Stieglitz, &
Schumacher, 2014; Kauffman & Levin, 1987; Levinthal, 1997). We created a realistic
landscape that contains resources that are clustered, and asked a decision-maker to
repeatedly choose along an exploitation–exploration continuum, as they do in many
strategic situations (for a review, see Lavie, Stettner, & Tushman, 2010). A decision-maker
may choose the familiar for a predictable gain, may attempt something completely novel

3
with unknown prospects — or anything in between. Whatever the choice is, the monetary
consequences are real. The second instrument elicits a person’s behavior when making
repeated risky and, separately, ambiguous (or uncertain) decisions, both prevalent in
organizational environments (DiMaggio & Powell, 1983; Zucker, 1977) and strategic
decisions (Eisenhardt & Zbaracki, 1992; Kaplan, 2008; Levinthal & March, 1993; Zajac &
Bazerman, 1991). The instrument presents decision-makers with choices that have real
monetary consequences: A participant repeatedly chooses whether to accept a low but
certain gain or a higher but less certain gain. Depending on the condition, that higher gain
can be risky (probabilistic) or ambiguous (probability unknown).
In this chapter, we first give a brief review of the literature on exploration–exploitation
and strategic risk-taking. We illustrate how these activities are typically measured in
strategic management research, and show how our experimental instruments complement
these measures. Next, we report the behaviors we observed using our instruments and
elaborate on methods for grasping the underlying cognitive mechanisms. To examine these
mechanisms, we used protocol analysis, a method developed by Ericsson and Simon (1984),
and particularly suited for understanding cognition in strategy decisions (e.g., Laureiro-
Martínez & Brusoni, 2018; Reypens & Levine, 2017). With this technique, we capture and
analyze people’s thought processes alongside their behavior. These processes can be
expressed as text, so we employ qualitative coding but also a software-based tool to measure
validated psychological, emotional, and cognitive constructs. Finally, we discuss how this
unique combination of behavioral tasks, protocol analysis, and text analysis helped us
uncover how decision-makers behave — and how they think they behave — supporting novel
insights into taken-for-granted assumptions in strategic management.
THE TENSION BETWEEN EXPLORATION AND EXPLOITATION
The theory
In many managerial situations — R&D investments, market entry, advertising campaigns —
a decision-maker chooses an action, receives feedback, and then chooses again. The choice
ranges from repeating a past action in expectation of a familiar outcome (strong

4
exploitation) to a novel action whose outcome is largely uncertain (strong exploration). Such
choices may cause a tension, for example when strategists must choose between consistency
or flexibility in times of organizational change (Turner & Rindova, 2012) or when product
managers decide on altering features to improve customer satisfaction (Rindova & Petkova,
2007). An optimal action is unattainable. Because probabilities are unknown and feedback is
ambiguous, the situation does not lend itself to optimization, even if a decision-maker is fully
rational. March (1991) referred to this challenge as the “exploration–exploitation” trade-off,
where exploration is associated with “search, risk taking, play, discovery”, and exploitation
with “refinement, choice, efficiency, implementation”.
An extensive stream of literature addressed how firms can cope with simultaneous
pressures for exploration and exploitation (for a review, see O'Reilly & Tushman, 2013).
Potential knowledge gains motivate search for new opportunities and methods, whereas
inertia and the need for efficiency drive local search for existing routines and skills (Lavie &
Rosenkopf, 2006). Researchers suggested that ambidexterity, the ability to balance the
tension between exploration and exploitation, can result in improved outcomes such as sales
growth (He & Wong, 2004) and innovation (Tushman, Smith, Wood, Westerman, & O’Reilly,
2010). Yet, this may be contingent on organizational and environmental factors such as firm
size (Lavie, Kang, & Rosenkopf, 2011), top management team characteristics (W. K. Smith &
Tushman, 2005), and the degree of competition (Jansen, Van Den Bosch, & Volberda,
2006).
Researchers proposed several ways in which firms can achieve such ambidexterity
(O'Reilly & Tushman, 2004, 2011; Tushman & O'Reilly, 1996). Organizations can separate
both activities over time and sequentially engage in exploration or exploitation (Benner &
Tushman, 2003). Alternatively, exploration and exploitation activities can be structured in
different organizational units (Christensen & Bower, 1996; Fang, Lee, & Schilling, 2010;
O’Reilly & Tushman, 2008) or balanced between internal and external activities such as
alliances and acquisitions (Lin, Yang, & Demirkan, 2007). Researchers suggest that
balancing exploration and exploitation across organizational modes is more effective than
5
balancing these activities within a single mode (Lavie et al., 2011; Stettner & Lavie, 2014),
because both activities require fundamentally different structures, strategies, and logics
(Uotila, Maula, Keil, & Zahra, 2009).
However, firms’ exploration–exploitation activities are not a simple sum game of
decision-makers’ actions (Knudsen & Srikanth, 2014). For this reason, a growing body of
research calls for understanding the micro-foundations of exploration–exploitation to
complement insights into its macro-foundations (Gavetti, 2012; Gavetti, Greve, Levinthal, &
Ocasio, 2012; Gavetti, Levinthal, & Ocasio, 2007; Laureiro‐Martínez, Brusoni, Canessa, &
Zollo, 2015; Marino, Aversa, Mesquita, & Anand, 2015). Just like firms, decision-makers
must balance exploration with exploitation. Most researchers warned about “exploitation
traps”: Decision-makers persist with actions that have immediately certain returns but may
be suboptimal and become obsolete (Groysberg & Lee, 2009; March, 1991). Others pointed
to the danger of over-exploration, when decision-makers pay to experiment, but mistakenly
continue to search even after finding a peak of high performance (Billinger et al., 2014;
Levinthal & March, 1993). The question of how to maintain a balance of exploration and
exploitation — behaving not too cautiously without venturing too far — is fundamental.
Thus, scholars have devoted much attention to ambidextrous decision-makers, those
who can reconcile the tension between exploration and exploitation (Gibson & Birkinshaw,
2004; Jasmand, Blazevic, & de Ruyter, 2012; O'Reilly & Tushman, 2004). Ambidexterity
studies have identified several personality traits and organizational factors that may affect
decision-makers’ ability to act in an ambidextrous way (Raisch, Birkinshaw, Probst, &
Tushman, 2009). Personality traits linked to ambidexterity are a person’s self-efficacy
(Kauppila & Tempelaar, 2016), discipline, and passion (Andriopoulos & Lewis, 2009).
Organizational factors include the role of knowledge flows (Mom, Van Den Bosch, &
Volberda, 2007), networks (Lazer & Friedman, 2007; Rogan & Mors, 2014), and decision-
making authority (Mom, Van Den Bosch, & Volberda, 2009).

6
Over the years, researchers have developed useful measures to capture various
exploration–exploitation activities on the firm, team, or individual level of analysis. Table 1
samples how studies operationalized exploration–exploitation, grouped by method.
One group of studies used secondary data of firms to measure exploration–
exploitation. These studies relied on patent data (e.g., Katila & Ahuja, 2002) or created
indices that reflect the number of new alliance partners, the novelty of a firm’s products, or
changes that are introduced (e.g., Stettner & Lavie, 2014). They often used a distinction
between expenses on marketing versus R&D to denote exploration and exploitation (e.g.,
Lavie & Rosenkopf, 2006).
Another group of studies relied on survey methods to study exploration–exploitation at
the firm- or individual-level. In these surveys, employees report perceptions of self or
organizational explorative or exploitative focus. To develop scale items that reflect
exploration and exploitation, researchers have drawn on March’s (1991)utilized the work
of Based on interviews with managers, the authors listed 14 activities that constitute either
exploration (e.g., activities requiring you to learn new knowledge or skills) or exploitation
(e.g., activities of which it is clear to you how to conduct them). Survey participants were
asked to self-evaluate, using a five-point scale, the extent they engage in these activities.
More generally, studies referred to exploitation as opting for certainty, for example by
serving existing customers, whereas exploration involves a clear departure from the existing
way of doing things, for example by serving new markets. Researchers then developed scale
items that reflect this distinction in their respective research setting .
Researchers also applied qualitative methods to study exploration–exploitation (e.g.,
Andriopoulos & Lewis, 2009; Holmqvist, 2004; Marino et al., 2015). Based on interviews or
content analysis of archival documents, these researchers code behaviors or actions that
involve experimentation, novelty, or risk as exploration. Behaviors or activities that involve
refinement, routinization, or reproduction are coded as exploitation.
March’s (1991, pp. 74-81) seminal work on exploration–exploitation was an agent-
based simulation examining learning. It began with individual decision-makers, and

7
exploration–exploitation was modelled as slow versus fast learning from an organizational
code. Researchers have built on his work and developed simulation models to understand
how individuals and organizations can balance exploration and exploitation (e.g., Fang et al.,
2010). Some simulation studies model how decision-makers search on a rugged landscape,
consisting of peaks and valleys (e.g., Fang & Levinthal, 2009; Knudsen & Srikanth, 2014;
Lazer & Friedman, 2007). In these models, search in the local neighborhood indicates
exploitation and distant search indicates exploration.
These approaches helped us understand exploration–exploitation. However, when
researchers rely on secondary data, interviews, survey methods, or simulation models, they
inevitably make assumptions about behavior. Thus, despite extensive research on the topic,
we know little about how people actually behave in exploration–exploitation settings: How
do they choose between the two? Do decision-makers pursue different exploration–
exploitation paths? Is search for novel solutions influenced by individual characteristics,
such as risk or ambiguity preferences?
Experimental methods offer unique advantages to address such questions. The
experiments we utilize here simulate a decision environment. Rather than relying on
assumed inputs and mechanisms, or asking people for their perceptions, we can observe
actual behavior that has real consequence, a cornerstone of economic experiments.2  
The controlled environment of a laboratory reduces the risk of confounding factors and
endogeneity, a perennial challenge with secondary data. Data collected in a controlled
environment are more clean, precise, and objective compared to noisy real-life data or
proxies that are often used in strategic management. Experiments are easier and cheaper to
replicate, a crucial feature Because of these advantages, experimental studies on
exploration–exploitation have been multiplying. Here we build on these studies and present
an experimental (simulational) instrument that captures how people behave in exploration–
2 We use “simulational” to denote experiments in the economic tradition, which simulate a decision environment, an environment where choices have real consequences. This differs from asking participants for introspection, perceptions or intentions. Ariely and Norton (2007) eloquently summarize the differences between psychological and economic experiments.

8
exploitation situations. Most experimental studies operationalized exploration and
exploitation as binary activities where participants repeatedly choose between two
options: either adopt a new routine (explore) or persist with an option that is currently
superior (exploitation). In our instrument, participants faced a range of options along a
continuum of exploration–exploitation. We examined how decision-makers behave, but also
how they consider and reason, when they face exploration–exploitation continuously, with
feedback, using a combination of behavioral and self-reported measures. To simultaneously
capture behavioral patterns, cognitive mechanisms, and individual characteristics, we
deployed a rigorous combination of quantitative and qualitative methods .

9
Method Example measures Example references
Secondary data
Patents
Proportion of citations to patents that were not previously cited by the firm
(exploration) or that were already cited (exploitation).
(Dothan & Lavie, 2016, pp.
337-338; Katila & Ahuja,
2002; Rosenkopf & Nerkar,
2001)
New partners
The proportion of new partners in a firms’ alliances in each year (exploration)
Prior alliance experience with a certain partner (exploitation)
(Lavie et al., 2011; Lavie &
Rosenkopf, 2006; Lin et al.,
2007)
New introductions
An indicator of new products, technologies, or changes introduced by firms in a certain
time period. Novel introductions indicate the use of new knowledge, or exploration.
(Greve, 2007; Stettner &
Lavie, 2014)
Marketing versus R&D
Alliance agreements were coded depending on whether it involved an R&D agreement;
an agreement about joint marketing and service, OEM/VAR, licensing, production, or
supply; or a combination of R&D and other agreements.
(Lavie et al., 2011; Lavie &
Rosenkopf, 2006)
Survey Three exploration items that reflect an organization’s emphasis on innovation,
variation, risk taking, experimentation, and discovery
Three exploitation items that reflect an organization’s emphasis on refinement,
production, selection, and implementation
(Voss et al., 2008)
Exploration scale with seven items, that include activities such as searching for new
possibilities with respect to products/services and activities that are not (yet) clearly
existing company policy.
Exploitation scale with seven items that include activities such as activities primarily
focused on achieving short-term goals and activities which clearly fit into existing
company policy.
(Kauppila & Tempelaar,
2016; Mom et al., 2009)
Exploration items that capture departure of existing knowledge and pursuit of new
possibilities, products, customers, or markets.
Exploitation items that captures serving existing customers or markets and building on
existing knowledge or products.
(He & Wong, 2004; Jansen
et al., 2006; Rogan & Mors,
2014)
Qualitative A metric that captures to what extent solutions depart from the industry standard. (Marino et al., 2015)

10
Case study or
content analysis
Exploration includes actions such as experimentation, novelty, risk taking, trialing, and
innovation.
Exploitation includes actions such as refinement, routinization, reproduction, and fine
tuning.
(Andriopoulos & Lewis,
2009; Holmqvist, 2004;
Uotila et al., 2009)
Simulation
Slow versus fast learning from codified organizational norm
(Fang et al., 2010; March,
1991; Miller, Zhao, &
Calantone, 2006)
Search on rugged landscapes, typified by peaks and valleys (Billinger et al., 2014; Fang
& Levinthal, 2009; Knudsen
& Srikanth, 2014; Lazer &
Friedman, 2007)
Experiment
In each period, participants choose between a familiar option (exploitation) or a new
one that may have a higher or lower pay-off (exploration).
(Billinger et al., 2014; Ederer
& Manso, 2013; Håkonsson
et al., 2016; Laureiro‐
Martínez et al., 2015; Van
Rijnsoever, Meeus, &
Donders, 2012)
Table 1. Overview of exploration–exploitation measures by method.
11
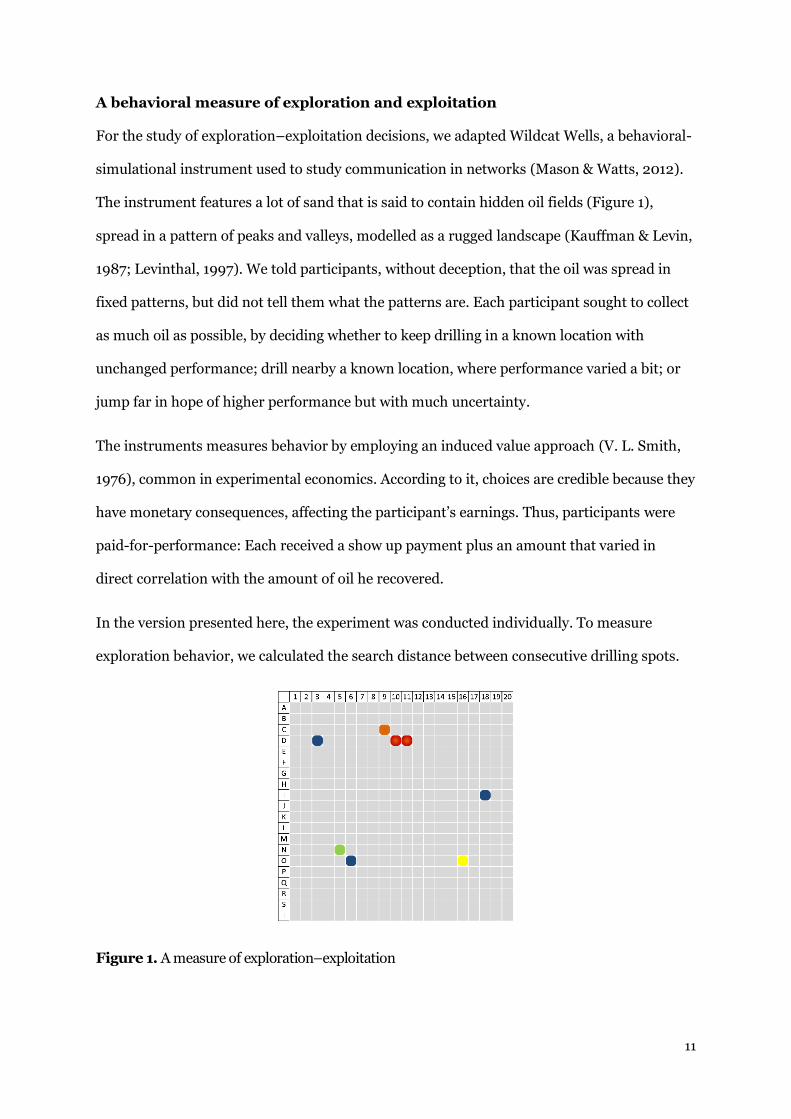
A behavioral measure of exploration and exploitation
For the study of exploration–exploitation decisions, we adapted Wildcat Wells, a behavioral-
simulational instrument used to study communication in networks (Mason & Watts, 2012).
The instrument features a lot of sand that is said to contain hidden oil fields (Figure 1),
spread in a pattern of peaks and valleys, modelled as a rugged landscape (Kauffman & Levin,
1987; Levinthal, 1997). We told participants, without deception, that the oil was spread in
fixed patterns, but did not tell them what the patterns are. Each participant sought to collect
as much oil as possible, by deciding whether to keep drilling in a known location with
unchanged performance; drill nearby a known location, where performance varied a bit; or
jump far in hope of higher performance but with much uncertainty.
The instruments measures behavior by employing an induced value approach (V. L. Smith,
1976), common in experimental economics. According to it, choices are credible because they
have monetary consequences, affecting the participant’s earnings. Thus, participants were
paid-for-performance: Each received a show up payment plus an amount that varied in
direct correlation with the amount of oil he recovered.
In the version presented here, the experiment was conducted individually. To measure
exploration behavior, we calculated the search distance between consecutive drilling spots.
Figure 1. A measure of exploration–exploitation

12
The task faithfully represents the important features of an exploration–exploitation
situation, as described in previous literature:
Limited resources. Participants had only limited time, so they could sample only a
fraction of the entire landscape. The landscape consisted of 400 drilling spots, but
participants only had 20 rounds to drill, so they could explore at most five percent of the
landscape. Due to resource constraints, a trade-off naturally arose, because any resources
spent on exploitation could not be spend on exploration, and vice versa. As a result, most
potential spots remained untapped. This design feature is informed by situations where
managers are constraint in the number of strategies they can pursue, because of constraints
such as budget, time, and attention (Cyert & March, 1963; Gavetti et al., 2007; March, 1991;
Turner & Rindova, 2012).
Minimal information. We only provided minimal information, so there was no map that
described the terrain — a decision-maker discovered it by experiencing it. In the task,
participants did not know how the oil was distributed or what the availabilities of oil were.
They only knew that some of the oil reservoirs may lay closer to the surface, easier to reach,
and therefore may be more profitable. Other reservoirs, we explained in the instructions,
may lay deep underground, requiring more effort, and therefore may be less profitable. Some
areas were completely dry. With this limited information, optimization was impossible,
because the probabilities of outcomes were unknown (Alchian, 1950; Gittins, 1979). As in
managerial settings, decision-makers did not have ex ante knowledge of what may be the
best strategy, they could only learn through experience. In each round, each participant
chose a spot to drill, received feedback, and could then choose again. Thus, participants, like
managers, went through an iterative process of actions, evaluations, and reactions (Cohen,
March, & Olsen, 1972; Cyert, Feigenbaum, & March, 1959; Cyert & March, 1963; March &
Simon, 1958).
Valid feedback. Participants knew that the locations and sizes of oil
reservoirs were set before the study began and that these were not affected by anyone's
actions and did not change. Thus, the landscape offered valid feedback (March, 1991) and

13
served as an objective reality against which decision-makers’ actions were tested (Ramoglou
& Tsang, 2016).
Rugged landscape. The landscape was rugged, so outcomes were correlated in space
(Kauffman & Levin, 1987; Levinthal & March, 1993). We instructed participants that the oil
reservoirs stretched over an area in a pattern, so that the amount of oil in one spot may be
related to the amount of oil in its neighboring spots. We also showed an example of how a
natural resource, such as those “lakes of oil”, can be distributed in a pattern. The pattern was
shown by colors: An identical color meant that the same amount is available; different colors
meant different levels of availability (Figure 1). So, participants knew that they could expect
similar outcomes if they stayed in nearby regions. But, if they wanted to discover novel
outcomes, they had to experiment and search across the landscape. As in managerial
situations, breakthrough discoveries required a more extensive search than incremental
improvements (Katila & Ahuja, 2002; Rosenkopf & Nerkar, 2001).
Exploration and exploitation as two ends of continuum. As proposed by Lavie et al.
(2010), we represented exploration—exploitation as two ends of a continuum rather than
binary choices or separate activities. Some studies considered exploration or exploitation as
a binary choice (e.g., Håkonsson et al., 2016; Laureiro‐Martínez et al., 2015; Van Rijnsoever
et al., 2012), but this design choice may not fully reflect the range of choices in-between pure
exploitation and exploration. Some studies also measured exploration and exploitation as
orthogonal activities on separate scales (e.g., Jasmand et al., 2012; Kauppila & Tempelaar,
2016; Mom et al., 2009), potentially underestimating the inherent trade-off between both
activities. While the tension between exploration and exploitation may be reconciled, for
example by separating both activities over time, it does not take away the inherent trade-off
that arises when decision-makers need to allocate limited resources to either exploration or
exploitation. We therefore consider exploration and exploitation as two ends of a single
continuum, since it closely reflects the tension individuals face when making exploration–
exploitation decisions.

14
Managerial serendipity. Participants were not bound to begin exploration at a specific
point. Instead, they could choose to begin wherever desired. This feature reflects some of the
serendipity of managerial decision-making (Denrell et al., 2014; Sidney G. Winter, 2012).
Information accumulated only with experience, so initial steps were necessarily random.
Because of this design feature, individuals necessarily went through a process of blind
variation, where actions were initially guided by trial and error (Campbell, 1974). Most likely,
we would observe different responses had we required participants to start at the point of
lowest performance, in which any move would necessarily result in improved performance.
STRATEGIC RISK-TAKING
The theory
Risk plays a central role in strategic decision-making. Imagine a situation where a manager
must choose between spending on advertising for a staple product, expecting a certain
return, or investing in additional features. Market studies project that advertising will
increase consumers’ willingness to pay by five percent; additional features will increase it by
ten percent, but with a 50 percent probability. What would the manager choose? Even if it
involves known probabilities and no major exploratory option, such a decision requires a
choice on the exploration–exploitation continuum. The outcome will affect performance, so
strategy researchers have long aimed to understand the antecedents of strategic risk-taking.
Scholarly interest in decisions under risk decisions dates at least back to Frank Knight
(1921), who distinguishes between risky situations, in which the probability distribution is
known, and ambiguous and uncertain ones, in which it is absent, as in our setting (also see,
Ellsberg, 1961). Management scholars first developed conceptual models of strategic risk-
taking. In 1985,-taking, including industrial, organizational and decision-maker variables. In
1998, Wiseman and Gomez-Meija  March and Shapira (1987) found that managers do not
interpret risk by assessing probabilities of possible outcomes. Rather, the authors suggest
that performance targets guide managers’ decisions. found that managers do not interpret
risk by assessing probabilities of possible outcomes. Rather, the authors suggest that
performance targets guide managers’ decisions.

15
Since then, much research on risk examined how different types of incentives affect
risk-taking behavior of managers or executives, such as equity-based compensation or stock
options (e.g., Wright, Kroll, Krug, & Pettus, 2007). Another stream of literature considers the
effects of CEO characteristics, such as social class background (e.g., Kish-Gephart &
Campbell, 2015), hubris (e.g., Li & Tang, 2010), and celebrity status (e.g., Cho, Arthurs,
Townsend, Miller, & Barden, 2016). In absence of direct data on CEO behaviors, these
studies naturally rely on archival data and use various proxies for risk-taking such as a firm’s
research and development expenditures, capital expenditures, the value of the firm’s long-
term debt, size of acquisition premiums, or a combination thereof. While these measures
may capture aggregate firm-level actions, they fall short of identifying the actual risk choices
of individuals.
To this end, studies have used experimental methods to capture strategic risk-taking
and its antecedents. For example, Chng and Wang (2015) used a decision-making task,
where managers are presented with hypothetical scenarios and are asked to make several
business decisions. In such experiments, participants are asked to allocate a budget to
different projects that vary in terms of risk and rewards. Risk-taking is then measured as the
amount of money spent on a risky investment. In these scenarios, probabilities of success or
failure of choosing the risky strategies are presented to participants.
As scholar have recognized early, some life decisions are risky, such as whether to buy
a lottery ticket, but many are ambiguous or uncertain. This is true in most organizational and
strategic settings: A probability distribution of outcomes is unavailable. For this reason, our
instrument separately measures preferences for risk and ambiguity (better known as
uncertainty).
A behavioral measure of risk and ambiguity
Decision-making research, in psychology and economics, shows that individuals have
different preferences for risk. These affect a range of behaviors, such as saving money,
buying insurance, choosing to smoke, or changing jobs.

16
Building on a measure from an impactful study in neuroeconomics (Hsu, Bhatt,
Adolphs, Tranel, & Camerer, 2005), we developed a web-based instrument, which measures
risk and ambiguity preferences separately and behaviorally, again — by simulating a decision
environment where choices have real consequences. The instrument reflects the distinction
between risk and uncertainty (Knight, 1921) by asking participants to choose between
combinations of certain payments, payments with some known probability (i.e., risky
payments), and payments with unknown probability (i.e., ambiguous or uncertain
payments).
We presented a deck of cards composed of red and blue cards. Each participant then
chose between accepting a certain but low reward — or betting on the color of a card in hope
of receiving an uncertain but higher reward. If participants chose to bet, they only received a
reward if the color they chose matched the color of a randomly drawn card. In the risk
treatment, the proportion of blue and red cards in the card deck was known, so participants
could calculate the probability of receiving a higher reward. In the ambiguity treatment, the
proportions were unknown, so probabilities were incalculable and so was expected value.
Participants made 24 risky and 24 ambiguous choices, in a random order.
Based on the proportion of risky and uncertain bets, we developed a risk and ambiguity
profile for each participant. Participants’ earnings in this experiment were determined by
their choice in one randomly drawn round.
Figure 2. A measure of risk (left) and ambiguity (right).

17
EXPERIMENTAL PROCEDURE
We recruited 57 participants, almost all graduate students. At first blush, the use of student
participants appears to hinder generalizability. But studies that compared student versus
managerial behavior found few differences between how the two populations, even in
complicated decision-making tasks such as forecasting (Bolton, Ockenfels, & Thonemann,
2012). Two large reviews have recently concluded that there are no systematic differences
between the behavior of students and managers in many cognitive functions (Fréchette,
2015, 2016). This is not entirely surprising: Today’s students are tomorrow’s managers.
We conducted the experiment one-on-one with individual participants. When a
participant entered the room, she was randomly assigned to begin either with the
risk/ambiguity or the exploration task. Participants completed the risk/ambiguity task using
a laptop. To complete the exploration task, participants were asked to stand in front of a
board depicting the landscape and read the instructions. When finished, each participant
answered comprehension questions. If at least one question was wrong, we referred the
participant back to the instructions and allowed her to change her answers. If a participant
failed the comprehension questions twice, she was dismissed.
During the exploration task, we requested participants to verbalize their thought
processes as they emerged during the experiment, as per protocol analysis guidelines
(Ericsson & Simon, 1984). With their consent, we audio recorded these verbal reports.
Before participants started, we gave them a short exercise and asked them to think out loud
as they were looking around the room. We then gave participants a marker that they could
place on any location in the landscape. After they decided where to drill and placed the
marker there, the experimenter revealed the outcome.
As participants made their drilling decisions, we probed them to think out loud.
Following Ericsson and Simon’s (1984) guidelines, we regularly asked them to share their
thoughts or say whatever was going through their mind. After the exploration task,
participants answered a short questionnaire to measure their confidence and action bias as
they were conducting the experiment (see Appendix for measures). We controlled for these

18
measures, since participants that are more confident and inclined to take action during the
experiment, are likely to be biased towards exploration.
All participants were paid for their performance. The experiments were reviewed and
approved by the Institutional Review Board.
ANALYZING BEHAVIORAL AND SELF-REPORTED DATA
Behavioral data
We quantitatively analyzed 1140 exploration–exploitation decisions and 2736 choices
between certain and risky or ambiguous outcomes. Our dataset also included measures of
participants’ action bias, confidence, and general demographics.
We first created a measure for each participant’s exploration–exploitation behavior.
We calculated the search distance between two consecutive drilling spots a participant chose.
Large search distances indicate long jumps on the landscape or exploration, small search
distances indicate search in the local neighborhood or exploitation. We then mapped
participants’ search distances over time (Figure 3). By large, five different patterns emerge.
Some patterns reveal high peaks (e.g., participants no. 16, 21, 46), indicating frequent jumps
across the landscape. Other patterns also show peaks, but lower and less frequent ones (e.g.,
10, 28, 95). Some patterns show only a strong peak in the early rounds (e.g., 12, 27, 73).
Others show the opposite: only in the end there is a peak (e.g., 15, 32, 63). Some patterns are
completely flat (e.g., 11, 57, 75), indicating that these participants only searched around the
local neighborhood of previous drilling spots. These different search patterns reveal that
participants not only differ in how much they explore, but also in when they choose to
explore.

19
Figure 3. Individual participants’ search patterns over time.
Based on participants’ repeated choices between certain and risky or ambiguous pay-
offs in the card task, we created a score for each participant. The score reflects the percentage
of times a participant preferred the certain outcome over the risky or ambiguous one.
Choices for certainty in the risk and ambiguity treatment were somewhat correlated
(correlation of 0.5091). Figure 4 shows this correlation. The figure also shows that more
people opted for certainty in risky situations than in ambiguous situations (right lower
quadrant versus left upper quadrant). Those that preferred certainty under ambiguity almost
all also preferred certainty under risk (right upper quadrant). Some preferred certainty
under risk, but were comfortable with ambiguity (right lower quadrant). Most people that
were comfortable under ambiguity were also comfortable under risk (left lower quadrant).

20
Figure 4. The percentage of certain choices participants made in the risk treatment (x axis) and
ambiguity treatment (y axis).
Self-reported data
Next to the quantitative behavioral data, we collected qualitative data on participants’
thought processes during the exploration task. We first transcribed the 57 audio recordings
and then manually coded each verbal report with the qualitative analysis software NVivo
(QSR International, 2012). Our coding followed the process of open, axial, and selective
coding as recommended by qualitative researchers (Miles & Huberman, 1984; Strauss &
Corbin, 1990). We first openly coded the transcripts. During this phase, we labelled words
and passages as close to the data as possible. Then, we used axial coding. In this step, we
grouped codes into higher-level constructs. For example, the open codes “stay in the same
cluster”, “change directions”, “stay around profitable area” were grouped into the higher-
order category “stay close”. Finally, we applied selective coding and grouped axial codes into
core behaviors. These were “exploit”, “explore”, “exploit and explore”.
Figure 5 represents our inductively created coding map, where the box sizes represent
the relative frequency of each of the axial and selective codes. The figure shows that about
910
1112
13
15
16
17
18
20
21
22
23 24
25 27
28
29
30
31
32
37
3839
40
41
42
43
46
47
48
49
50
53
54 56
57
58
59 60
61
62
63
65
66
67
69
73
75
76
78
81
82
92
95 98
103
02
04
06
08
01
00
% o
f cert
ain
cho
ices in
am
big
uity tre
atm
en
t
0 20 40 60 80 100% of certain choices in risk treatment

21
half of the codes were linked to exploitation. From the other half of the codes, the majority
referred to strictly exploration. The remaining codes indicated the tension between
exploitation and exploration.
Figure 5. A visual coding map of selective codes (e.g., exploit) and axial codes (e.g., known
patterns).
Based on the manual coding of participants’ verbal reports, we distilled several
processes and drivers of exploration and exploitation emerged. Table 2 reports illustrative
quotes related to exploration and exploitation. For example, the verbal reports revealed that
when people exploited, they followed existing patterns and stayed close to previously
discovered spots. When people explored, they were often guided by random choices. Some
chose arbitrary drilling locations, for example based on their lucky numbers. Whereas some
were strictly focused on finding the maximum outcome and viewed unsuccessful exploration
as wasted chances, others were exploring for the fun of experimenting.
Exploitation
I am just going around the same lines, considering there were a lot of barrels
there (participant 15)
I think I am going to use the option of re-drilling in the same area, so that is [in
coordinates] O-15. I’m going to re-drill in the same area one more time O-14.
Yea one more time, O-14. (participant 49)
The safest bet right now I think would be K-13. Alright, so I am just going to
exploit the potential of this place over here (participant 66)
We can keep drilling in the same spot which means that I can earn the same
amount of oil, I would like to go with H-11. So that my points increase, I would
again go with I-11 (participant 16)
Exploration

22
I’m going to try a random pattern and understand first how large I can go, so
something completely random (participant 43)
Now let me try to find a different pattern to see if I can get something better or
something equal in a different area (participant 81)
Now I just want to give it a try, I just need to know whether 1000 is the
maximum availability or if there is anything more, so I’m just giving it a random
try (participant 10)
Now let me try going south and see what we got, just for an experiment and let
me pick J-10 (participant 23)
Table 2. Example quotes related to exploitation and exploration.
To complement manual coding, we used a text analysis software, Linguistic Word
Inquiry Count (LIWC, Pennebaker, Booth, Boyd, & Francis, 2015). The software analyzes
each document on pre-defined categories such as emotions or cognitive processes and
indicates how this document scores on each of these categories (Pennebaker, Boyd, Jordan,
& Blackburn, 2015). To calculate such a score, the developers created a dictionary of words
that reflect a certain category. For example, the category “achievement” contains 213 words
such as “win, success, better”. Along with other categories such as “power” and “reward” it is
grouped in a higher order category “drives”. The category “cognitive processes” includes 797
words and contains sub-categories such as “causation”, “discrepancy”, “differentiation”,
“insight” and “tentative”. Since the software’s development in 2001, the categories have been
extensively validated in different populations of writers and speakers such as CEOs and
students (e.g., Nadkarni & Chen, 2014; Pennebaker, Chung, Frazee, Lavergne, & Beaver,
2014). To analyze text documents, the software compares the words and stems in the
documents with the words in the software’s dictionary of words and categories. The software
then calculates a score that represents the percentage of words in a document that belongs to
a specific category, controlling for text length.
Figure 6 shows the mean LIWC scores per category. As can be expected given the
experimental setting, participants’ verbal reports score high on words that reflect a present
focus (e.g., now, is) or relativity words that reflect space (e.g., down, next), motion (e.g., go),
or time (e.g. until). On average, around 15 percent of the words participants used reflect
cognitive processes (e.g., think, wonder, because, know). Of the cognitive processes, those
that reflect tentative words were most common (e.g., maybe, perhaps), followed by insight

23
(e.g., think, know), differentiation (e.g., but, else), discrepancy (e.g., should, would), and
causation (e.g., because, effect). Words that express certainty represent a small minority
(0.61 percent).
Participants’ verbal reports also reveal a reliance on affective processes. Participants’
mostly used words that revealed positive emotions (e.g., love, nice, sweet). To a lesser extent
their verbal reports contained negative emotions such as risk and sadness. The LIWC scores
also show that some participants’ choices were driven by finding the maximum amount of
oil. This is illustrated by drives such as rewards (e.g., take, price, benefit), achievement (e.g.,
win, success, better), and power (e.g., superior).
Figure 6. Mean scores of LIWC categories. From top to bottom: Drives (power, achievement, reward); Cognitive processes (causation, discrepancy, differentiation, insight, tentative); Perceptual processes (see, hear, feel); Time orientation (past, present, future focus); Affective processes (positive emotions, negative emotions); Relativity (motion, time, space).
DISCUSSION
In this chapter, we described instruments to examine the exploration–exploitation tension
and risk-taking. Both topics have been studied extensively, but mostly using methods that
rely on assumptions about behavior. The instruments we presented can help narrow the gap,

24
by supplementing assumptions with evidence. We used a combination of methods:
experimental tasks, protocol analysis, and text analysis. By triangulating qualitative and
quantitative data of actual behavior and thought processes, several insights emerge.
With our mix of methods, we can uncover how intuitive and emotional drivers underlie
behavior. March (1991) acknowledged this intuitive component, when he associated
exploration with play in his seminal work. Yet, empirical work that followed this seminal
piece mostly considers exploration as a directed, strategic choice, often measured using
archival data on patents, R&D investments, or the choice of alliance partners. While such
measures may capture the search, risk taking, and discovery aspects of exploration as
defined by March (1991), they do not fully capture the playful, intuitive mechanisms that also
drive exploration. Next to these intuitive mechanisms, our proposed methods can also grasp
emotions. Drawing on substantial research in psychology, management researchers call for
studying emotions in organizational settings (Huy, 2012) and consider it an important, still
unfolding field of discovery (Ashkanasy, Humphrey, & Huy, 2017). We used the text analysis
software LIWC to identify the emotions that may play a role, based on decision-makers’
verbal reports of their thought processes.
By studying people’s decision-making processes and uncovering underlying
mechanisms, we can discover subtleties in taken-for-granted assumptions. As Raisch et al.
(2009) note, a common assumption in firm-level or team-level studies on exploration–
exploitation is that decision-makers simply switch between the two, for example when such
activities are split over organizational units. Studies on the individual level do acknowledge
there are differences in how decision-makers choose between exploration and exploitation
(e.g., Jasmand et al., 2012; Kauppila & Tempelaar, 2016; Mom et al., 2007, 2009). These
researchers, among others, suggest that not everyone is equally able to balance the two,
which is why they seek to identify the context factors or personality traits shared by decision-
makers who do balance exploration with exploitation. Yet, these studies seem to assume that
there is a homogenous group of ambidextrous decision-makers who mentally process the
tension between exploration and exploitation in the same way. Our instruments and
25
methods can directly test these assumptions, by enabling a closer look into people’s behavior
and thought processes as they face the tension between exploration and exploitation over
time.
Through the rigorous design of experimental instruments, we can capture related, but
distinct concepts, offering a finer-grained perspective of strategic decision-making.
Following Knight (1921), we created an instrument that distinguishes between risk and
uncertainty. Given the prevalence of ambiguous situations in management, experimental
studies on the antecedents of strategic risk-taking may also include decision-making under
uncertainty, without presenting the probabilities of success or failure of certain strategies.
Since not all decision-makers may respond equally to risky or ambiguous situations,
antecedents of strategic risk-taking may have different effects when decision-makers decide
under ambiguity.
The micro-level insights that emerge using our toolbox of methods can advance our
understanding of macro-level phenomena. When solely focusing on macro outcomes,
important micro-level differences may dilute. Such a focus on outcomes, without considering
underlying decision-making processes, may be shortsighted. For example, several features of
the organizational context that have been suggested to support exploration at the team or
firm level, may have different effects on individual organizational members depending on
their decision-making processes. These individual-level differences in turn can influence the
balance between exploration and exploitation at the team and organizational level.
Here we focused on individual-level processes, but there is value in looking beyond
them: organizational search often involves interaction and collaboration (Levine & Prietula,
2012, 2014). And interacting with others raises questions of emotions and team processes
(e.g., Håkonsson et al., 2016), interpersonal power and trust (e.g., Schilke & Huang,
Forthcoming; Schilke, Reimann, & Cook, 2015). The plot is further twisted by a variety of
situational conditions that can affect search, such as the diversity of counterparts involved.
Research has shown that even seemingly unrelated features, such as the ethnicity of others,

26
can affect how an individual processes information and this the search outcome (Levine et
al., 2014; Levine & Stark, 2015).
To understand exploration–exploitation, at any level of analysis, it is important to
consider underlying decision-making mechanism (Baer, Dirks, & Nickerson, 2013; Teece,
2007; Sidney G Winter, 2013). By shedding light on these mechanisms, our understanding of
the microfoundations of strategy can be advanced.
ACKNOWLEDGEMENTS SSL and CR acknowledge a grant from the European Research Council (695256). SSL also
received a grant from the Hong Kong Research Council General Research Fund (14655416).
REFERENCES Alchian, A. A. (1950). Uncertainty, Evolution, and Economic Theory. The Journal of Political
Economy, 58(3), 211-221. Andriopoulos, C., & Lewis, M. W. (2009). Exploitation-exploration tensions and
organizational ambidexterity: Managing paradoxes of innovation. Organization Science, 20(4), 696-717.
Ariely, D., & Norton, M. I. (2007). Psychology and Experimental Economics - A Gap in Abstraction. Current Directions in Psychological Science, 16(6), 336-339.
Ariely, D., & Norton, M. I. (2007). Psychology and experimental economics: A gap in abstraction. Current Directions in Psychological Science, 16(6), 336-339.
Ashkanasy, N., Humphrey, R., & Huy, Q. (2017). Integrating emotions and affect in theories of management. Academy of Management Review, 42(2), 175-189.
Baer, M., Dirks, K. T., & Nickerson, J. A. (2013). Microfoundations of strategic problem formulation. Strategic Management Journal, 34(2), 197-214.
Baird, I. S., & Thomas, H. (1985). Toward a contingency model of strategic risk taking. Academy of Management Review, 10(2), 230-243.
Benner, M. J., & Tushman, M. L. (2003). Exploitation, exploration, and process management: The productivity dilemma revisited. Academy of Management Review, 28(2), 238-256.
Billinger, S., Stieglitz, N., & Schumacher, T. R. (2014). Search on Rugged Landscapes: An Experimental Study. Organization Science, 25(1), 93-108. doi:10.1287/orsc.2013.0829
Bolton, G. E., Ockenfels, A., & Thonemann, U. W. (2012). Managers and students as newsvendors. Management Science, 58(12), 2225-2233.
Campbell, D. T. (1974). Unjustified variation and selective retention in scientific discovery. Studies in the philosophy of biology, 139-161.
Chng, D. H. M., & Wang, J. C. Y. (2015). An experimental study of the interaction effects of incentive compensation, career ambition, and task attention on Chinese managers' strategic risk behaviors. Journal of Organizational Behavior, 37, 719-737.
Cho, S. Y., Arthurs, J. D., Townsend, D. M., Miller, D. R., & Barden, J. Q. (2016). Performance deviations and acquisition premiums: The impact of CEO celebrity on managerial risk‐taking. Strategic Management Journal.
Christensen, C. M., & Bower, J. L. (1996). Customer Power, Strategic Investment, and the Failure of Leading Firms. Strategic Management Journal, 17(3), 197-218.
Cohen, M. D., March, J. G., & Olsen, J. P. (1972). A garbage can model of organizational choice. Administrative Science Quarterly, 1-25.

27
Cyert, R. M., Feigenbaum, E. A., & March, J. G. (1959). Models in a behavioral theory of the firm. Behavioral Science, 4(2), 81-95.
Cyert, R. M., & March, J. G. (1963). A Behavioral Theory of the Firm. Englewood Cliffs, NJ: Prentice Hall.
Denrell, J., Fang, C., & Liu, C. (2014). Perspective—Chance explanations in the management sciences. Organization Science, 26(3), 923-940.
DiMaggio, P. J., & Powell, W. W. (1983). The Iron Cage Revisited: Institutional Isomorphism and Collective Rationality in Organizational Fields. American Sociological Review, 48, 147-160.
Dothan, A., & Lavie, D. (2016). Resource reconfiguration: learning from performance feedback. In Advances in Strategic Management (Vol. 35, pp. 323-373).
Ederer, F., & Manso, G. (2013). Is Pay for Performance Detrimental to Innovation? Management Science, 59(7), 1496-1513.
Eisenhardt, K. M., & Zbaracki, M. J. (1992). Strategic Decision Making. Strategic Management Journal, 13, 17-37.
Ellsberg, D. (1961). Risk, ambiguity, and the Savage axioms. The quarterly journal of economics, 643-669.
Ericsson, K., & Simon, H. (1984). Protocol Analysis: Verbal Reports as Data. Cambridge, MA: The MIT Press.
Ethiraj, S. K., Gambardella, A., & Helfat, C. E. (2016). Replication in strategic management. Strategic Management Journal, 37(11), 2191-2192. doi:10.1002/smj.2581
Fang, C., Lee, J., & Schilling, M. A. (2010). Balancing Exploration and Exploitation Through Structural Design: The Isolation of Subgroups and Organizational Learning. Organization Science, 21(3), 625-642. doi:10.1287/orsc.1090.0468
Fang, C., & Levinthal, D. A. (2009). Near-term liability of exploitation: Exploration and exploitation in multistage problems. Organization Science, 20(3), 538-551.
Fréchette, G. R. (2015). Laboratory experiments: Professionals versus students. In G. R. Fréchette & A. Schotter (Eds.), Handbook of experimental economic methodology. Oxford, UK: Oxford University Press.
Fréchette, G. R. (2016). Experimental economics across subject populations. In J. H. Kagel & A. E. Roth (Eds.), The handbook of experimental economics (Vol. 2, pp. 435-480): Princeton University Press.
Gavetti, G. (2012). PERSPECTIVE—Toward a Behavioral Theory of Strategy. Organization Science, 23(1), 267-285. doi:10.1287/orsc.1110.0644
Gavetti, G., Greve, H. R., Levinthal, D. A., & Ocasio, W. (2012). The behavioral theory of the firm: Assessment and prospects. The Academy of Management Annals, 6(1), 1-40.
Gavetti, G., Levinthal, D. A., & Ocasio, W. (2007). Perspective—Neo-Carnegie: The Carnegie school’s past, present, and reconstructing for the future. Organization Science, 18(3), 523-536.
Gibson, C. B., & Birkinshaw, J. (2004). The antecedents, consequences, and mediating role of organizational ambidexterity. Academy of Management Journal, 47(2), 209-226.
Gittins, J. C. (1979). Bandit processes and dynamic allocation indices. Journal of the Royal Statistical Society, 41(2), 148-177.
Greve, H. R. (2007). Exploration and exploitation in product innovation. Industrial and Corporate Change, 16(5), 945-975. doi:10.1093/icc/dtm013
Groysberg, B., & Lee, L.-E. (2009). Hiring stars and their colleagues: Exploration and exploitation in professional service firms. Organization Science, 20(4), 740-758.
Håkonsson, D. D., Eskildsen, J. K., Argote, L., Mønster, D., Burton, R. M., & Obel, B. (2016). Exploration versus exploitation: Emotions and performance as antecedents and consequences of team decisions. Strategic Management Journal, 37, 985-1001.
He, Z.-L., & Wong, P.-K. (2004). Exploration vs. exploitation: An empirical test of the ambidexterity hypothesis. Organization Science, 15(4), 481-494.
Hodgkinson, G. P., & Healey, M. P. (2008). Cognition in organizations. Annual Review of Pyschology, 59, 387-417.
28
Holmqvist, M. (2004). Experiential learning processes of exploitation and exploration within and between organizations: An empirical study of product development. Organization Science, 15(1), 70-81.
Hsu, M., Bhatt, M., Adolphs, R., Tranel, D., & Camerer, C. F. (2005). Neural Systems Responding to Degrees of Uncertainty in Human Decision-Making. Science, 310(5754), 1680-1683.
Huy, Q. N. (2012). Emotions in strategic organization: Opportunities for impactful research. Strategic Organization, Forthcoming.
Jansen, J. J., Van Den Bosch, F. A., & Volberda, H. W. (2006). Exploratory innovation, exploitative innovation, and performance: Effects of organizational antecedents and environmental moderators. Management Science, 52(11), 1661-1674.
Jasmand, C., Blazevic, V., & de Ruyter, K. (2012). Generating sales while providing service: A study of customer service representatives' ambidextrous behavior. Journal of Marketing, 76(1), 20-37.
Kaplan, S. (2008). Framing Contests: Strategy Making Under Uncertainty. Organization Science, 19(5), 729-752.
Katila, R., & Ahuja, G. (2002). Something old, something new: A longitudinal study of search behavior and new product introduction. Academy of Management Journal, 45(6), 1183-1194.
Kauffman, S., & Levin, S. (1987). Towards a general theory of adaptive walks on rugged landscapes. Journal of Theoretical Biology, 128(1), 11-45.
Kauppila, O. P., & Tempelaar, M. P. (2016). The Social‐Cognitive Underpinnings of Employees’ Ambidextrous Behaviour and the Supportive Role of Group Managers’ Leadership. Journal of Management Studies, Advance Online Publication.
Kish-Gephart, J. J., & Campbell, J. T. (2015). You don’t forget your roots: The influence of CEO social class background on strategic risk taking. Academy of Management Journal, 58(6), 1614-1636.
Knight, F. H. (1921). Risk, uncertainty and profit. New York: Hart, Schaffner and Marx. Knudsen, T., & Srikanth, K. (2014). Coordinated exploration organizing joint search by
multiple specialists to overcome mutual confusion and joint myopia. Administrative Science Quarterly.
Laureiro-Martínez, D., & Brusoni, S. (2018). Cognitive flexibility and adaptive decision-making: Evidence from a laboratory study of expert decision makers. Strategic Management Journal, 39(4), 1031-1058. doi:10.1002/smj.2774
Laureiro‐Martínez, D., Brusoni, S., Canessa, N., & Zollo, M. (2015). Understanding the exploration–exploitation dilemma: An fMRI study of attention control and decision‐making performance. Strategic Management Journal, 36(3), 319-338.
Lavie, D., Kang, J., & Rosenkopf, L. (2011). Balance within and across domains: The performance implications of exploration and exploitation in alliances. Organization Science, 22(6), 1517-1538.
Lavie, D., & Rosenkopf, L. (2006). Balancing exploration and exploitation in alliance formation. Academy of Management Journal, 49(4), 797-818.
Lavie, D., Stettner, U., & Tushman, M. L. (2010). Exploration and exploitation within and across organizations. The Academy of Management Annals, 4(1), 109-155.
Lazer, D., & Friedman, A. (2007). The network structure of exploration and exploitation. Administrative Science Quarterly, 52(4), 667-694.
Levine, S. S., Apfelbaum, E. P., Bernard, M., Bartelt, V. L., Zajac, E. J., & Stark, D. (2014). Ethnic diversity deflates price bubbles. Proceedings of the National Academy of Sciences, 111(52), 18524–18529. doi:10.1073/pnas.1407301111
Levine, S. S., Bernard, M., & Nagel, R. (2017). Strategic Intelligence: The Cognitive Capability to Anticipate Competitor Behavior. Strategic Management Journal, 38(12), 2390-2423. doi:10.1002/smj.2660
Levinthal, D. A. (1997). Adaptation on Rugged Landscapes. Management Science, 43(7), 934-950.

29
Levinthal, D. A., & March, J. G. (1993). The myopia of learning. Strategic Management Journal, 14(S2), 95-112.
Lewin, A. Y., Chiu, C.-Y., Fey, C. F., Levine, S. S., McDermott, G., Murmann, J. P., & Tsang, E. (2016). The Critique of Empirical Social Science: New Policies at Management and Organization Review Management and Organization Review, 12(4), 649-658.
Li, J., & Tang, Y. (2010). CEO hubris and firm risk taking in China: The moderating role of managerial discretion. Academy of Management Journal, 53(1), 45-68.
Lin, Z., Yang, H., & Demirkan, I. (2007). The performance consequences of ambidexterity in strategic alliance formations: Empirical investigation and computational theorizing. Management Science, 53(10), 1645-1658.
March, J. G. (1991). Exploration and exploitation in organizational learning. Organization Science, 2(1), 71-87.
March, J. G., & Shapira, Z. (1987). Managerial perspectives on risk and risk taking. Management Science, 33(11), 1404-1418.
March, J. G., & Simon, H. (1958). Organizations. New York: Wiley. Marino, A., Aversa, P., Mesquita, L., & Anand, J. (2015). Driving Performance via
Exploration in Changing Environments: Evidence from Formula One Racing. Organization Science, 26(4), 1079-1100.
Mason, W., & Watts, D. J. (2012). Collaborative learning in networks. Proceedings of the National Academy of Sciences, 109(3), 764-769.
Miles, M., & Huberman, A. (1984). Qualitative data analysis: A sourcebook of new methods. Beverly Hills, CA: Sage Publications.
Miller, K. D., Zhao, M., & Calantone, R. J. (2006). Adding interpersonal learning and tacit knowledge to March's exploration-exploitation model. Academy of Management Journal, 49(4), 709-722.
Mom, T. J., Van Den Bosch, F. A., & Volberda, H. W. (2007). Investigating Managers' Exploration and Exploitation Activities: The Influence of Top‐Down, Bottom‐Up, and Horizontal Knowledge Inflows*. Journal of Management Studies, 44(6), 910-931.
Mom, T. J., Van Den Bosch, F. A., & Volberda, H. W. (2009). Understanding variation in managers' ambidexterity: Investigating direct and interaction effects of formal structural and personal coordination mechanisms. Organization Science, 20(4), 812-828.
Nadkarni, S., & Chen, J. (2014). Bridging yesterday, today, and tomorrow: CEO temporal focus, environmental dynamism, and rate of new product introduction. Academy of Management Journal, 57(6), 1810-1833.
O'Reilly, C. A., & Tushman, M. L. (2004). The ambidextrous organization. Harvard Business Review, 82(4), 74-83.
O'Reilly, C. A., & Tushman, M. L. (2011). Organizational ambidexterity in action: How managers explore and exploit. California Management Review, 53(4), 5-22.
O'Reilly, C. A., & Tushman, M. L. (2013). Organizational ambidexterity: Past, present, and future. The Academy of Management Perspectives, 27(4), 324-338.
O’Reilly, C. A., & Tushman, M. L. (2008). Ambidexterity as a dynamic capability: Resolving the innovator's dilemma. Research in organizational behavior, 28, 185-206.
Pennebaker, J. W., Booth, R. J., Boyd, R. L., & Francis, M. E. (2015). Linguistic Inquiry and Word Count: LIWC2015. In. Austin, TX: Pennebaker Conglomerates.
Pennebaker, J. W., Boyd, R. L., Jordan, K., & Blackburn, K. (2015). The development and pyschometric properties of LIWC2015. Austin, Texas.
Pennebaker, J. W., Chung, C. K., Frazee, J., Lavergne, G. M., & Beaver, D. I. (2014). When small words foretell academic success: The case of college admissions essays. PloS one, 9(12), e115844.
QSR International. (2012). NVivo qualitative data analysis software 10. Raisch, S., Birkinshaw, J., Probst, G., & Tushman, M. L. (2009). Organizational
Ambidexterity: Balancing Exploitation and Exploration for Sustained Performance. Organization Science, 20(4), 685-695. doi:10.1287/orsc.1090.0428

30
Ramoglou, S., & Tsang, E. W. K. (2016). A Realist Perspective of Entrepreneurship: Opportunities As Propensities. Academy of Management Review, 41(3), 410-434. doi:10.5465/amr.2014.0281
Reypens, C., & Levine, S. S. (2017). To Grasp Cognition in Action, Combine Behavioral Experiments with Protocol Analysis. In K. J. Sund, G. P. Hodgkinson, & R. J. Galavan (Eds.), Methodological Challenges and Advances in Managerial and Organizational Cognition (pp. 123-146): Emerald.
Rindova, V. P., & Petkova, A. P. (2007). When is a new thing a good thing? Technological change, product form design, and perceptions of value for product innovations. Organization Science, 18(2), 217-232.
Rogan, M., & Mors, M. L. (2014). A network perspective on individual-level ambidexterity in organizations. Organization Science, 25(6), 1860-1877.
Rosenkopf, L., & Nerkar, A. (2001). Beyond local search: boundary‐spanning, exploration, and impact in the optical disk industry. Strategic Management Journal, 22(4), 287-306.
Schilke, O., & Huang, L. (Forthcoming). Worthy of Swift Trust? How Brief Interpersonal Contact Affects Trust Accuracy. Journal of Applied Psychology.
Schilke, O., Reimann, M., & Cook, K. S. (2015). Power decreases trust in social exchange. Proceedings of the National Academy of Sciences, 112(42), 12950-12955.
Smith, V. L. (1976). Experimental Economics: Induced Value Theory. American Economic Review, 66(2), 274-279.
Smith, W. K., & Tushman, M. L. (2005). Managing strategic contradictions: A top management model for managing innovation streams. Organization Science, 16(5), 522-536.
Stettner, U., & Lavie, D. (2014). Ambidexterity under scrutiny: Exploration and exploitation via internal organization, alliances, and acquisitions. Strategic Management Journal, 35(13), 1903-1929. doi:10.1002/smj.2195
Strauss, A., & Corbin, J. M. (1990). Basics of qualitative research: Grounded theory procedures and techniques. London: Sage Publications.
Teece, D. J. (2007). Explicating Dynamic Capabilities: The Nature and Microfoundations of (Sustainable) Enterprise Performance. Strategic Management Journal, 28(13), 1319-1350. doi:10.2307/20141992
Turner, S. F., & Rindova, V. (2012). A balancing act: How organizations pursue consistency in routine functioning in the face of ongoing change. Organization Science, 23(1), 24-46.
Tushman, M. L., & O'Reilly, C. A. (1996). The ambidextrous organizations: Managing evolutionary and revolutionary change. California Management Review, 38(4), 8-30.
Tushman, M. L., Smith, W. K., Wood, R. C., Westerman, G., & O’Reilly, C. (2010). Organizational designs and innovation streams. Industrial and corporate change, 19(5), 1331-1366.
Tversky, A., & Kahneman, D. (1975). Judgment under uncertainty: Heuristics and biases. In Utility, probability, and human decision making (pp. 141-162): Springer.
Uotila, J., Maula, M., Keil, T., & Zahra, S. A. (2009). Exploration, exploitation, and financial performance: analysis of S&P 500 corporations. Strategic Management Journal, 30(2), 221-231.
Van Rijnsoever, F. J., Meeus, M. T., & Donders, A. R. T. (2012). The effects of economic status and recent experience on innovative behavior under environmental variability: An experimental approach. Research Policy, 41(5), 833-847.
Voss, G. B., Sirdeshmukh, D., & Voss, Z. G. (2008). The effects of slack resources and environmentalthreat on product exploration and exploitation. Academy of Management Journal, 51(1), 147-164.
Winter, S. G. (2012). Purpose and Progress in the Theory of Strategy: Comments on Gavetti. Organization Science, 23(1), 288-297. doi:10.1287/orsc.1110.0696

31
Winter, S. G. (2013). Habit, deliberation, and action: Strengthening the microfoundations of routines and capabilities. The Academy of Management Perspectives, 27(2), 120-137.
Wiseman, R. M., & Gomez-Mejia, L. R. (1998). A behavioral agency model of managerial risk taking. Academy of Management Review, 23(1), 133-153.
Wright, P., Kroll, M., Krug, J. A., & Pettus, M. (2007). Influences of top management team incentives on firm risk taking. Strategic Management Journal, 28(1), 81-89.
Zajac, E. J., & Bazerman, M. H. (1991). Blind Spots in Industry and Competitor Analysis: Implications of Interfirm (Mis)Perceptions for Strategic Decisions. Academy of Management Review, 16(1), 37-56.
Zucker, L. G. (1977). The Role of Institutionalization in Cultural Persistence. American Sociological Review, 42(5), 726-743.

32
APPENDIX
Confidence
Five-point Likert scale: 1 = not at all, 5 = to a very great extent.
1. When making drilling decisions, I was confident
2. I knew from the start which areas contain the most oil
3. It was easy to figure out where the oil was
4. I did not know how the oil reservoirs were distributed (Reverse)
5. It was easy to know when I found the most profitable drilling spot
Action Bias
1. Five-point Likert scale: 1 = not at all, 5 = to a very great extent.
2. It was hard to decide between drilling in the same spot or choosing a new one
(Reverse)
3. I felt conflict when thinking about drilling in the same spot
4. It was very easy for me to choose moving to a different drilling spot
5. I felt compelled to drill in a different spot each round