Manufacturing and Quality
44
© Copyright 2019. UpGrad Education Pvt. Ltd. All rights reserved Material requirement planning or MRP is a system that deals with the management of inventory, production process and scheduling the same. On one side and also going into the purchase requirements on the other to ensure that the production schedule is apply met. This system helps the organization by converting the master production schedule into the respective requirements of raw materials and components, as I told you, before we went into the sourcing session. Now actually MRP follows a push system type of the control of inventory. It forecasts the quantity of various products that customers will ask for and prepares the customer requirements accordingly. Furthermore, the customer schedule is broken down into the requirement of parts that are needed to make the product. Transcription Manufacturing and Quality
Transcript of Manufacturing and Quality

© Copyright 2019. UpGrad Education Pvt. Ltd. All rights reserved
Material requirement planning or MRP is a system that deals with the management of inventory, production process
and scheduling the same. On one side and also going into the purchase requirements on the other to ensure that the
production schedule is apply met.
This system helps the organization by converting the master production schedule into the respective requirements of
raw materials and components, as I told you, before we went into the sourcing session.
Now actually MRP follows a push system type of the control of inventory. It forecasts the quantity of various products
that customers will ask for and prepares the customer requirements accordingly. Furthermore, the customer schedule
is broken down into the requirement of parts that are needed to make the product.
Transcription
Manufacturing and Quality

© Copyright 2019. UpGrad Education Pvt. Ltd. All rights reserved
So, on one side there will be a production plan that will be based on it, which will be the daily or weekly production
plan, and similarly on the other side, the requirement will be of the raw materials or the components which form the
basis of item that needs to be ordered.
MRP actually serves two objectives, determining requirements and keeping priorities current. These are essential to
have the right products available at the right time to meet the demands of the firm’s production plan.
The MRP provides answers to these questions, subject to that the plan is already placed into the system. The questions
could be -> What to order? How much to order? Where to plan the delivery? Now MRP basically helps companies to
expand, add, delay, withdraw and change orders to keep up with the actual demand. And this is different from forecast.
So, let me explain you with an example. Let's take this as an example. Say you are a manufacturer of potato chips in
various flavors. You have plain salted, you have some Chinese flavor, you have some American cheese flavor, etc. Now
just imagine that for the month of April, you have got a plan to actually manufacture at the aggregate level, potato
chips, for approximately 5,000 tons of potato chips to be supplied in the month of April. Now this is your original
aggregate plan.

© Copyright 2019. UpGrad Education Pvt. Ltd. All rights reserved
This particular thing, 5,000 tons is actually broken down into variants, which could be for example, that you wanted a
plain salted category, 2000 tons. You want, say Chinese flavor 500 tons, you want the American cheese, the balance,
2,500 tons. Now in such a situation, it can happen that you will go to the first level of checking whether you have
sufficient raw materials available for the same or not and if not, then they need to be ordered.
Now just for an example, you have approximately 2,000 tons of potatoes already available in your stock. Now to meet
the requirement of the month of April, you actually now need only Delta, which is 5,000 minus 2,000 that is 3,000 tons
of potato required for actually making the production which has to be delivered in the month of April. However, there
will also be production losses, so maybe that you actually looking into the losses, you require actually 3,200 or 3,500
depending on your scrap factor, that is applicable.

© Copyright 2019. UpGrad Education Pvt. Ltd. All rights reserved
Now you will actually get into the production of making the base chip. Now base chip is a common chip that may be
actually being used in a normal classic salted product or a Chinese flavor or an American cheese flavor. Now this base
chip is one common product. So, this is the first level of bill of material, which is being used.
Now further to that, once this chip is made, the bill of material is further exploding that out of this 5,000 tons of base
chips, I need to produce 2,000 tons off plain salted. So, out of the 5,000 tons of potato from which you already had
2,000 tons of potato available, you are procuring 3,000 tons of potato. Your plans are now further divided. Then what
will happen is it will look into the availability of flavors.
Now for plain salted, you're basically needing only salt and oil and the respective packaging in different pack size. So,
each of these stocks, of each of the pack size, here 20-rupee pack, a 5-rupee pack, a 15-rupee pack, modern trade pack
of 35-rupees all will be checked, versus the individual production plans that have been put across.

© Copyright 2019. UpGrad Education Pvt. Ltd. All rights reserved
After checking this, it will then compare to the actual dependent requirements that had adjusted for each and every
SKU that was required for making this particular production plan. Now it may happen that you may plan to produce
for the classic salted variant, which was 2,000 tons for the month. You may decide that you may actually not produce
anything during week 1. You may then have that you will produce 1,500 tons in week 2 and then you may have that
you will produce 500 tons in week 3.
Now just imagine how is the product supposed to arrive? So, the MRP is actually going to schedule the actual arrival
of the products in such a manner that your individual plans are met, and at the same time there is no over inventory
or under inventory.
So, how does MRP work? The MRP is basically working on certain variables. What are these variables? The key variables
are what is the safety stock that has to be kept for this particular product or in general, we also have another term for
it, which is called as the coverage profile. The coverage profile is how many days of inventory are you planning to keep
in general.

© Copyright 2019. UpGrad Education Pvt. Ltd. All rights reserved
Now just imagine to have a control on inventories, if you have decided that you want to keep a seven days of inventory.
Okay, now for a plan of 2,000 tons for the month, the seven days of inventory will actually mean what, it will mean
500 tons of equivalent material.
Now there is a planning calendar that is defined in the system which is in the MRP system, that defines how much time
or how much period it has to consider to understand in one planning cycle. So, when we were talking about a 7 days
of coverage profile, we also have told them that the planning cycle has to be of 1 month or 1 week or a fortnight or
whatever.

© Copyright 2019. UpGrad Education Pvt. Ltd. All rights reserved
Now just imagine in your planning calendar, you put actually as 30 days. Now what will happen is if it is 30 days, the
MRP system with the 7 days of coverage profile will say that every week, it has to deliver you 500 tons of material only,
equivalent material only.
In such a case, what will happen is that your actual arrival in week one will be 500 ton, in week two starting, it'll be
again 500 ton. But your plan was what, your plan was 1500 tons. So, on the planning calendar base, they're actually
summing up the requirement for that particular planning calendar.
These individual parameters of MRP, which are called as MRP masters, which are actually the decision-making tools of
MRP have to be very, very carefully thought off. It is like running an engine, sitting centrally. These are the
decisionmaking tools. So, whether it is a coverage profile, whether it is static stock that you need, that the minimum
inventory that you want to keep, you're defining the lead time.
Now just imagine that the lead time of the product is 15 days. Okay, now we have by mistake done a planning calendar
of 30 days. We actually required 1500 tons of material in week 2 itself. However, based on the planning calendar, we
are actually getting 500 tons plus 500 tons, 500 tons of week 1 are lying unutilized. 500 tons of week 2 are there to
consume, so 500 plus 500 we have 1000.

© Copyright 2019. UpGrad Education Pvt. Ltd. All rights reserved
Now suppose we want to actually ask the vendor to actually supply us more 500 tons so that we are able to take the
production run off 1500, will that happen? That will not happen because the delivery lead time is 15 days.
So, what MRP does? MRP actually does, if you have done your right planning calendars, then at that particular stage
MRP is going to pre-schedule the requirements, subject to you placing the plan in right time.
So, when you are having a longer lead time, materials, raw materials, in that case, that particular material real plan will
be impacted on that particular lead time, plus the safety stock time. So, 15 days plus 7 days, the coverage profile that
we talked about, the total 21 days is the bare minimum time before which the real plan has to be given into the system.
Now say for example, suddenly the marketing teams or the sales team change the plans. Accordingly, the MRP will
reschedule that requirement and it will tell you that how much of this 1500 tons should have been ordered when.
So, this 1500 tons will, it will tell you 21 days in advance that this needs to be ordered so that 15 days time is taken to
reach the material, 7 days of safety stock, I want to keep. Hence, if the requirement is falling on the 15th of March, it'll
actually tell you on the 21st of February, what to order? This is the beauty of MRP, of how it schedules, when to place
order, how much to place order and directly connects with what the vendors are going to supply, based on MRP
masters. This is a beautiful planning system that takes control of complete procurement part on one side.

© Copyright 2019. UpGrad Education Pvt. Ltd. All rights reserved
Now let's look at the production side. The MRP is also telling you how much production to take. Say, for example, it
has told you 1500 tons to be taken in week 2. Now within week 2, say on Monday you have actually produced 300
tons. So, now you're left with 1,200 tons. Now for 300 tons, it already had the raw material of 500 tons in week 1,
hence, it will be able to take that production. And the system then shows that now I have pending 1200 tons to produce
and so on.
So, it will give a scheduling for production, it'll give a scheduling for procurement. This is the beauty of MRP and
honestly speaking, the SAP-MRP is one of the most common systems that is currently being used.
Now what is important is how MRP interfaces with other systems? Currently the problems that majority of the
organizations have been facing are the disjointed planning mechanism. So, what was happening is that the demand
planning was happening in the Excel files at one stage, the production schedule and the production planning, which is
the supply planning or the aggregate planning happening on the other side, and the material requirement planning
happening on the third side.
Now all of this was leading to a demand planner giving a lot of buffers for ordering, so that his all requirements are
bare minimum met. If there's an excess, just let it be. That was the thought process. To actually reduce the waste of
the full system, now the organizations have got into the concept of integrated planning. What is integrated planning?
Integrated planning is starting from the demand side. Now it is creating a whole system.

© Copyright 2019. UpGrad Education Pvt. Ltd. All rights reserved
Okay, so from the demand, if I have a demand of say 7,000 tons of potato chips in the month of April, this demand
plan is going to give 7,000 tons. Now we will get into the next stage before entering into the supply plan, the system
will start looking at what are the stocks that are available with the warehouses.
Now, if the warehouses are having approximately a stock of 2000 tons, then it would ideally need additional 5,000
tons to make it for the system, but then it also wants to have an opening inventory for the next month. Say, the next
month is a lean season.
Hence, it does not need an opening inventory of 2000 tons. It actually needs an inventory of only 1000 tons. So, what
the system will do? 7,000 tons minus 2000 tons, plus 1000 tons that is required for the next month planning. It'll give
a new requirement of a production for 6,000 tons.
Now the supply planning is going to look at the 6,000 tons and then look into different factories, how the allocation is
to be done? Do we have already this type of stock available in X factory, Y factory, Z factory?
It may happen that this 7,000 tons of requirement converted to 6,000 tons of production plan for, is coming for plant
in Kolkata, which is linked to the plant in Calcutta. But maybe that a plant based in Trichy already has that stock of
5,000 tons, which has not been moving into the system. This is the lying inventory.
The organization may take a call whether to produce in Kolkata or whether to pull the inventory from Trichy, which is
not being used for the last 60 days and having an inventory costs, maybe to utilize that. So, the organization, again in
terms of which place the production to take, again there are masters, likely had an MRP masters based out here also.
The whole system today is working on various ERP modules. For example, the demand plan generally, there are various
companies including the JDS of the world who are doing their own demand forecasting model followed by the supply
planning models, followed by the MRP model. So, this 6,000 tons of production, will then net of the inventories for
production.
Now once that is done and suppose you arrive at a 2000 ton of production only required, then the system will start
looking into the raw material packaging materials of those materials in that particular plant that it is talking about.

© Copyright 2019. UpGrad Education Pvt. Ltd. All rights reserved
This is a complete flow of planning that happens across. Linking finally now, how does this last planning bit of raw
material link with this sourcing? So, what happens is in a matured organization, the sourcing department actually
creates their own contracts within the system.
These contracts are actually defined in terms of the quantities and various other points which are the guardrails of the
contract, and the person who is the purchase order maker is actually guarded by these contracts, he picks up the
purchase requisitions from the MRP system and links it to the contract and the system so that he has no say in terms
of pricing because all this is getting centrally managed through strategic sourcing and just releases that order.
Further, matured organizations have also gone into the auto PR to PO conversion scenarios. And what does the auto
PR to PO mean? A purchase requisition getting converted into a purchase order on an automatic mode, subject to that
they are pretty sure of the demand stability throughout the system or the variations which are often acceptable level
are already taken into account.
© Copyright 2019. UpGrad Education Pvt. Ltd. All rights reserved
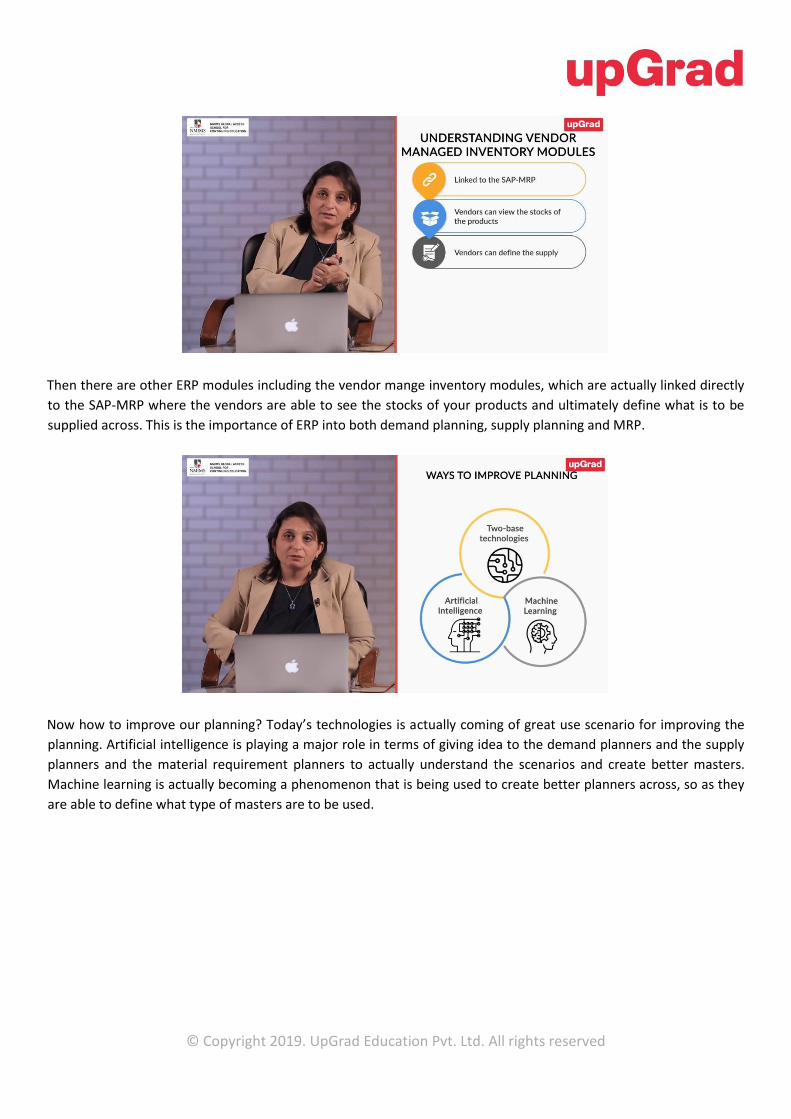
Then there are other ERP modules including the vendor mange inventory modules, which are actually linked directly
to the SAP-MRP where the vendors are able to see the stocks of your products and ultimately define what is to be
supplied across. This is the importance of ERP into both demand planning, supply planning and MRP.
Now how to improve our planning? Today’s technologies is actually coming of great use scenario for improving the
planning. Artificial intelligence is playing a major role in terms of giving idea to the demand planners and the supply
planners and the material requirement planners to actually understand the scenarios and create better masters.
Machine learning is actually becoming a phenomenon that is being used to create better planners across, so as they
are able to define what type of masters are to be used.
© Copyright 2019. UpGrad Education Pvt. Ltd. All rights reserved
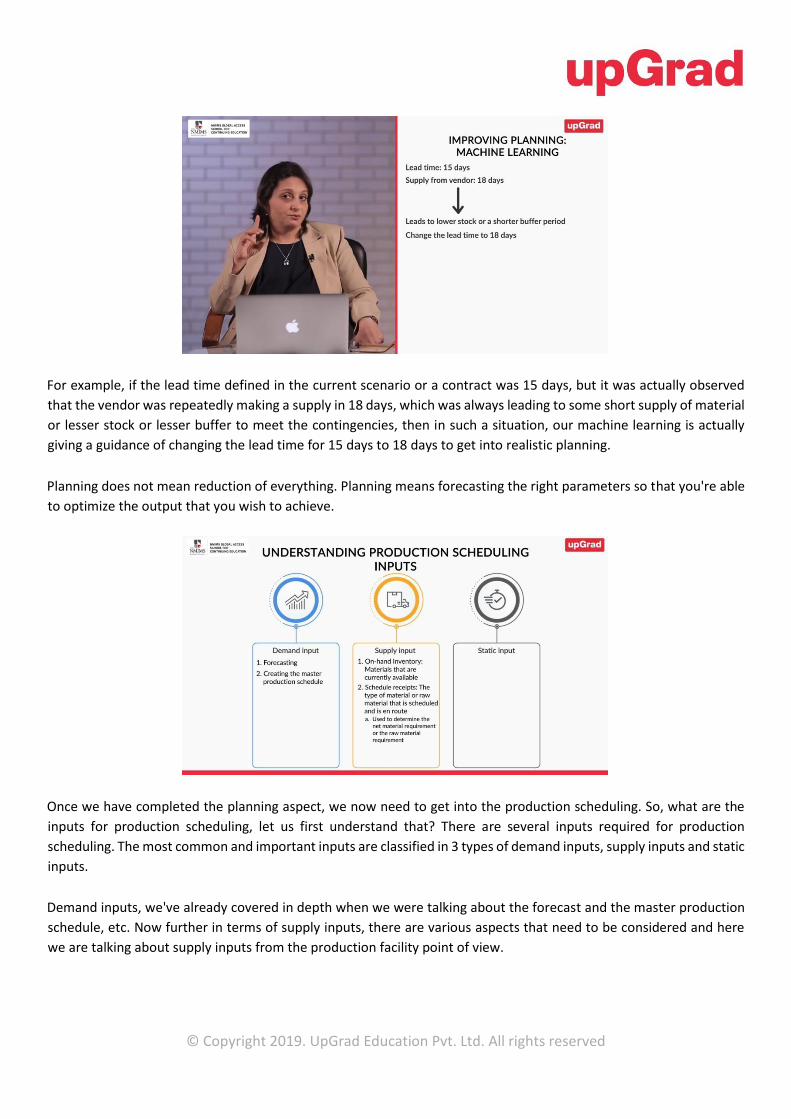
For example, if the lead time defined in the current scenario or a contract was 15 days, but it was actually observed
that the vendor was repeatedly making a supply in 18 days, which was always leading to some short supply of material
or lesser stock or lesser buffer to meet the contingencies, then in such a situation, our machine learning is actually
giving a guidance of changing the lead time for 15 days to 18 days to get into realistic planning.
Planning does not mean reduction of everything. Planning means forecasting the right parameters so that you're able
to optimize the output that you wish to achieve.
Once we have completed the planning aspect, we now need to get into the production scheduling. So, what are the
inputs for production scheduling, let us first understand that? There are several inputs required for production
scheduling. The most common and important inputs are classified in 3 types of demand inputs, supply inputs and static
inputs.
Demand inputs, we've already covered in depth when we were talking about the forecast and the master production
schedule, etc. Now further in terms of supply inputs, there are various aspects that need to be considered and here
we are talking about supply inputs from the production facility point of view.

© Copyright 2019. UpGrad Education Pvt. Ltd. All rights reserved
So, first of all, what is the on-hand inventory? Inventory of materials which are currently available. This information is
used to determine the net material requirement planning. As an example, which I gave you, when we were talking
about the potato chips part.
The second aspect is schedule receipts. That means what is the type of materials or raw materials that are scheduled
to be coming and is on route to the appropriate location. This information is used to determine the net material
requirements or the raw material requirements.
Then work in-progress. That means what is the work that is already started and is partially completed. Hence, it is not
part of the finished goods inventory counting and it is also not part of the raw material. It is intermediate in between.
The WIP may be used during the calculation of net material requirements.
The third category is the static inputs. What do static inputs include? One, run rates? What is a run rates? The rate at
which resources manufacture goods.

© Copyright 2019. UpGrad Education Pvt. Ltd. All rights reserved
For example, a machine may be capable of manufacturing 30 units of product A per hour or 20 units of product B per
hour. Now the difference between the two is that one product is being capable of being manufactured only 30 units
while the other unit is only 20 units. So, its run rate would then be 30 units per hour for product A and 20 units per
hour for product B.
The next is cycle times. This is the time it takes to manufacture an item. Then set up time. Now some resources may
actually require an initial setup time before they can become operational for production. Then the transfer time, the
amount of time that is required to move product from one factory source to another.
Now as product is moved from one resource to another, that happens often and there may be a time lag between the
time the product is being finished and being processed by one resource and started on the next resource. Then we
need a input of capacities, the manufacturing capacity of a single resource. Then batches. What is a batch? The number
of items that can be simultaneously processed on a resource. There are numerous resources that can produce many
units of a product at the same time.

© Copyright 2019. UpGrad Education Pvt. Ltd. All rights reserved
For example, a conventional oven that can bake several cookies simultaneously is a batch. Similarly, on a production
run, for example, if you are having a run size, which is ensuring that we have a batch of producing 5,000 cases of
beverage at one point of time, that means this is the minimum batch that will be produced at that point of time.
Now what are the consideration that one needs to have for developing production schedule? In developing production
schedule, companies may account for additional considerations such as business objectives, in addition to maximizing
product throughput and resource utilization, a company may consider additional business objectives at this time such
as minimizing the cost of the production or minimizing the cost of goods and services sold or customer prioritization.
Now, for example, some customers are more important than others and companies go to great length to satisfy thi
customer base. Companies develop production schedule that accomplish this even if it means slippage and delivery
dates to some other customers.

© Copyright 2019. UpGrad Education Pvt. Ltd. All rights reserved
It could also have a consideration of supply prioritization. A company may have multiple sources of supply for certain
raw materials or a sub-assemblies and components, and they will typically specify the primary source and a secondary
source of supply for each of these items. They will use secondary sources only if the primary source is unable to meet
your requirements.
Now the third aspect could be alternate production routes. In many instances, a product can follow more than one
manufacturing route through a factory. In such cases, the company may be able to specify a primary route and one of
the alternate routes. The alternate route may be used in case of insufficient capacity of materials.
For example, the company may have two lines of production of potato chips. Now the base potato chips may be
manufactured at a bigger line while some part of it may be manufactured for a flavor on the same line, and some part
of it may be given to another line which may be a smaller line.

© Copyright 2019. UpGrad Education Pvt. Ltd. All rights reserved
Now how do you determine the production schedule? So, one possibility is that there is a trial and error method. Now
for example a cookie manufacturer specializes in two types of cookies. Let’s say a chocolate chip and a peanut butter.
Now suppose the chocolate chip cookies are baked at 275F for approximately 1 hour and the peanut butter cookies
are baked at 350F for approximately 1 hour.
Now the bakery has only one oven for baking the cookies. Now if the oven is already stetted for 275F it requires another
15 minutes which is the setup time to heat up to 355F. Where as if it is at 350F it takes 45 minutes for it to cool down
and come to 275F. So, the Company can bake a maximum of 15 chocolate chip cookies or 10 peanut butter cookies at
1 time.
Now one approach for determining a feasible production schedule is trial and error. Try a sequence of activities
comprising baking cookies and heating oven and then determine if the resulting sequence satisfies all the constrains.
Once we have understood that there are trial and error situations and which we will be doing in our production
scheduling, let us work out the possibilities or finding out methods for solving scheduling problems. So, generating a
production schedule is extremely difficult, especially in cases where the good must be processed on multiple machines
and can have multiple routs through the manufacturing facility.

© Copyright 2019. UpGrad Education Pvt. Ltd. All rights reserved
Commonly used methods for solving such scheduling problems include the shortest process time. One of the options
is use the shortest process time. On a given machine complete the job that has the shortest process time first and the
job with the longest process time last. This ensures that the short process time jobs move through the manufacturing
facility more quickly than the longer jobs. This tends to reduce congestion.
Now earliest due date, we order jobs according to their due dates with the earliest due date first. That is the second
method. This minimizes the maximum delay of any one job. Minimum total manufacturing time, that’s another route.
Minimize the time to complete jobs through machines in a manufacturing facility. One approach is to schedule job
using their latest possible start time which is called as LPST, for each machine which allows manufacturers to take into
consideration their due dates for the jobs. So, you’re keeping that date under your consideration and the
manufacturing late times.
To accomplish this, planners use a job and its due date then subtract the manufacturing late time for the last operation
to determine its LPST for the last operation. They combine this process backward until they determine the start time
for the first operation.

© Copyright 2019. UpGrad Education Pvt. Ltd. All rights reserved
So, what do these 3 incidents have in common. One, the challenger space shuttle explosion in 1986,
Second, when anti-nausea and sedative drug Thalidomide was withdrawn for causing birth effects in 1962.
Third, the British petroleum deep-water horizon explosion and oil spill in 2010. Well, this all relates to quality, these
were some of the quality failures that shook the world.

© Copyright 2019. UpGrad Education Pvt. Ltd. All rights reserved
These examples tell you that the quality assurance, quality control and quality management are the key pillars of the
business stability and success and tragic consequences await, if we fail to adhere these principles. Moreover, in a highly
competitive business environment a strong and constant focus on quality will enable the organization to become
successful in the respective fields.
So, what is quality? It’s what the customer defines. It is the ability to delight the voice of customer. Achieving and
excelling the world’s benchmark levels to manufacture and deliver the best quality products to all the customers. The
condition necessary to deliver the best quality products to all the customers is building quality throughout the
manufacturing process as inspection alone cannot ensure the product quality.

© Copyright 2019. UpGrad Education Pvt. Ltd. All rights reserved
This gave rise to the birth of BIQ. What is BIQ? Build in quality. The birth of build in quality into the process originated
in the United States of America in a company called General Motors. General Motors’s Fremont Plant in California
started in 1963 and shutdown in 1982. At the time GM was facing the following challenges at this particular plant.
First, the Plant had the lowest productivity among other General Motor Plants. The Quality of the product was
appalling. Drug and Alcohol abuse among the employs was prevalent. Rampant absenteeism caused the requirement
of workers to increase by 20% just to keep the plant running. With Toyota’s involvement in improving the company
concepts and troubling conditions of the plant, GM and Toyota formed a 50-50 joined venture which came to be known
as NUMMI – New United Motor Manufacturing, Inc.
Why did they do this? For an objective together they focused on the 3 points. Consensus, consistency and
communication. They are also the 3 reasons behind the NUMMI’s success, the Toyota production system TPS
standardized work process and the relationship between management and labor.

© Copyright 2019. UpGrad Education Pvt. Ltd. All rights reserved
The TPS was based on two concepts, JIDOKA and JIT, both designed to eliminate production line based. Fundamentally
JIDOKA means that quality is built-in, not as it too often the case inspected in, after the fact. Which means it’s not a
post factor scenario. In other words, as much as possible the production system is designed to prevent a defective part
or product from continuing along the production line.
Also, the Toyota team observed that there were more inspectors approximately 70% than operators 30%, who were
running the daily production. This prompted them to push more for the JIDOKA or built-in a quality system.

© Copyright 2019. UpGrad Education Pvt. Ltd. All rights reserved
Now how to implement the built-in quality systems? They contained 4 major elements. These 4 major elements could
be compared to an example of a problem of a toilet not cleaned. We will apply BIQ to solve the problem.
1. The first element is containment, take steps to clean it with proper detergents
2. The second element is compliance, strictly follow the standards specified for its daily cleaning.
3. The third element is countermeasures. Find a route cause through proper analysis to know why the toilet was
not clean. Define the countermeasures to prevent a reoccurrence.
4. And the fourth element is continuous improvement. So, after the countermeasures always seek an
improvement in the existing process.
The organization deploys these principles at the work place to initiate and sustain changes in such a way that everybody
stands to benefit from them.
Now, is quality management responsibility of only the manufacturing function or unit? No, that’s not the case. It’s the
responsibility that quality is engrained in every element of the product life cycle at every function.
Now lets move on to improving quality and enhancing productivity through concepts like ‘Lean Six Sigma’ and ‘Kaizen’.
Now, first of all when we come to lean six sigma, I would really like you to understand what six sigma is? Understand

© Copyright 2019. UpGrad Education Pvt. Ltd. All rights reserved
how it emerged, a little bit about the history and we want you to understand the essential elements of six sigma, what
we call as DMAIC which stands for an Acronym called
• Define that’s for D
• Measure
• Analyze
• Improve
• Control
And then we also wanted to introduce you to lean and how lean really complements and integrates well with six sigma.
Let’s go ahead and define what six sigma is as a starting point. So, first of all six sigma is a statistical measure for
determining process capability. As we said it’s actually a measure that equates to 3.4 defects per million opportunities
and now you will be able to relate it to quality. And this is a statistical calculation that basically looks at the distribution
of opportunities for defects and based on six times the variation or the standard deviation, it defines the number of
opportunities for defects.
More than that, it’s also a proven set of tools and tactics for reducing variation. It’s an approach, it’s a set of
methodology, it’s a set of project improvement approach to reduce that variation. As we will see, it’s also based on a
philosophy around continuous improvement and the pursuit of excellence that organizations adapt, and it also is a
complimentary discipline. So, it complements other tools like lean thinking, that we learn about also later in this lesson.

© Copyright 2019. UpGrad Education Pvt. Ltd. All rights reserved
To summarize six sigma is an approach for improving customer satisfaction, improving process capability and more
importantly involving everybody in the organization. So, it not just something manufacturing does or operations does.
In these organizations, we see that six sigma is used in sales and marketing, it’s used in procurement, it’s used in
finance, it’s used in HR, it’s used in operations, it’s used in every functional area as a continuous improvement
methodology to reduce variation. And for that reason, it’s very powerful approach that as we will see is very beneficial.
So, six sigma is a measure of process capability as we talk. Customers have very high expectations and they don’t
tolerate things that are going wrong. And you can see on the chart what happens as six sigma or your standard
deviation of the process gets higher and higher. It goes from 1 to 6, you can see that defects per million opportunity
decreases.
The fact is that 1 sigma isn’t very good at all. 1 sigma means you have only 30% quality over close to 70% of your
products are defective. At 2 or 3 sigma, we still have 93% quality at best and you can say hey, 93% is pretty good and
you get to 4% and it’s 99.37%. You might ask yourself what’s the difference, why should I bother? If I am at 4 sigma,
isn’t that good enough? Why do I have to get to 6 sigma? Why is it so important to get to that?

© Copyright 2019. UpGrad Education Pvt. Ltd. All rights reserved
We’ll explain why. But the basic thinking is that this is really were Motorola which developed this six sigma
methodology in the 1980s really started thinking about what this meant and they realize it was more than about
statistical process control. It was really about managing a business end to end, and it really was about focusing on what
the customer wanted and they reduced the process variation to get to that point where we met the customer
requirement every single time.
Why 99% is not good enough. So, if we think about 99% what does 99% defect free, equal to? Well, you would say that
it’s pretty good but then when you apply it to different processes, different things that we do every day, see every day
you realize that it’s still unacceptable.
For Example, throughout the US postal system 99% would mean that they would be losing 20 thousand pieces of mail
every hour. It means you would have 2 or 3 short or long landings at major Airports every day. It means you would
have 2 lakh wrong drug prescriptions every year and it means you would have no electricity for almost 7 hours per
month. Now I ask you, is that considered good enough and I think the short answer is No. Not at all!
You know we really can’t tolerate anything less than perfection. Specially in a lot of these critical areas where we really
expect perfection. And so, from my point of view, six sigma really is the benchmark that we all have to shoot for.

© Copyright 2019. UpGrad Education Pvt. Ltd. All rights reserved
We can think about DMAIC as a process. It really is one that’s very similar to the scientific process, and the scientific
method is a body of techniques for investigating phenomena and acquiring new knowledge as well as for correcting
and integrating previous knowledge. So, if you think of a scientific method it’s used by scientist in laboratories it’s also
used by academic researchers. I used the scientific method in some of the empirical research tools that we used.
And it’s also used by businesses to try and get to the analyzing route cause of problems that are occurring in the supply
chain or in the business or in their operation. So, it’s a way of investigating phenomena and acquiring new knowledge
and it’s based on observable empirical measurable evidence which is also subject to laws of reasoning.
So, by empirical what we mean is, it’s a field-based scenario. You have to collect the data and study the data and you
have to measure the data and then you have to analyze it and that reasoning and its really is a process and a suite of
tools that allow us to apply the scientific methods. It’s requires us first understand the problem or condition that we
want to achieve.
Then, we start by identifying out of all the things that are out there, which one do we want to look at. It requires us to
gather dependable and verifiable data about the project. So, then that’s really the measurement piece where we start
measuring.

© Copyright 2019. UpGrad Education Pvt. Ltd. All rights reserved
We then apply the laws of reasoning and form a hypothesis about what’s happening. The hypothesis is just an educated
guess. So, what do we think is the issue and then we go about testing the hypothesis to make sure that the process
improvement are real and occurred because of the changes we implemented to the process and then we used data
measurement processes again to make sure that we continue to sustain those improvements that they are not a
onetime hit.
So, a good way of thinking about DMAIC is the way our medical doctors use a variation of DMAIC. The Doctor and the
patient will define the problem. What’s hurting you? You got a headache or your leg, what is it? The Doctor will
measure the approximate data point, they will take your temperature, they will take your pulse, they will take your
heartbeat, they may take your blood pressure.
They will analyze the potential causes based on his or her training on route causes and they’ll do this based on their
medical school learning. So, they’ll say you are overweight, you have got a high blood pressure. What are the things
that potentially could be causing this?

© Copyright 2019. UpGrad Education Pvt. Ltd. All rights reserved
And they will then prescribe a treatment to improve a condition. You need to change your diet; you need to be on a
maybe stannous for your heart or cholesterol and then they may schedule a series of checkups to make sure that the
improvement stay in control and that you stay healthy. Come back and visit me in six weeks, we’ll check and make
sure if we are seeing any improvement.
So, think of that medical procedure and that visit to that doctor and they are actually using a version of DMAIC to get
to the root cause of the problem. So, DMAIC has those 5 phases again to reiterate. Define, measure, analyze, improve
and control. And this is the one that is the basis of any type of quality for future.

© Copyright 2019. UpGrad Education Pvt. Ltd. All rights reserved
So, you would have understood some concept of lean and six sigma. Let's try and understand practical application of
lean six sigma. So, I'm sure a lot of you would be followers of F1 Race, right, and would be following the race and you
know, the pace at which it goes. Now a car which is there in F1 race, you know, how many parts are there in that car?
There are almost 5,000 parts in a car that goes onto the race track. Now let us see what happens if the car does not
operate at the quality level that we want. Six sigma talks about 99.99966% quality level. Now, if this car was not
working at six sigma level, and let's say it was working at 99% quality and 99% quality is generally acceptable to us.
So, in this case, there is likely that 50 parts out of 5,000 because you are working at 99% quality, 50 parts are likely to
fail. And in a fast pace race like this, let's say if a brake fails or tires go off, what can happen, it can create a massive
accident, right? But at a six sigma level, which is 99.99966% quality, you are not likely to have any failures. So, for
processes like this, it is very, very much essential to have a quality standard which will give you high reliability. And six
Sigma does that.
Lean talks about reducing waste and doing the process fast. So, in racetracks, you would have seen that whenever
there is a pit stop, you know, the tires are changed and within a matter of seconds, actually the fastest time achieved
is around 2 seconds, the tires are change.
So here, a concept of lean known as SMED or single minute exchange of dice is used, wherein lot of processes are done
even before the process starts. So, for example, if a tire needs to be replaced, you'd have seen that people will stand
with the tires at the pitstop and as soon as the car comes, they will quickly change it and the car moves on. So, this is
a concept of lean, which is used in real life example. And lean six sigma becomes a very, very critical component of a
supply chain.

© Copyright 2019. UpGrad Education Pvt. Ltd. All rights reserved
I want to talk a little bit first about also now lean and the origins of lean, and link lean to six sigma. I want to introduce
you do something called value stream mapping which is called as VSM which is a big part of what lean is all about.
Then we will talk about how lean and six sigma fit together and as we get into the next class after this one, we will get
more and more into lean and six sigma because there is a lot to learn in both of these areas and we still haven't covered
and may be a part of it can be used in Data Analytics too.
So, the origins of JIT and lean production, how did it happen? Let's now talk about the integration of lean and six sigma
and the origins of Just in time.
As I mentioned, JIT was pioneered by the Toyota and a number of Toyota executives who came to the United States
initially after the second World War to learn from the US manufacturers and what they found was that these factory
in United States were large. There was a lot of inventory they were using and a lot of space and they though to
themselves, well this isn't going to really work in Japan and so at first, they were disappointed.
They thought the trip was a bit of waste because there wasn't anything in that time that US manufacturers were doing
that could apply in Japan. So, the fact was that Japan doesn't have a lot of space. It was very resource poor. They didn't
have a lot of places for warehouses and inventory and so they were really restricted.

© Copyright 2019. UpGrad Education Pvt. Ltd. All rights reserved
But what they did learn on this visit was when they visited some of the grocery store and they were fascinated to see,
how replenishment was used in grocery stores to replenish goods. Stocks, canned goods, fresh goods, every day. They
thought this is really interesting. How suppliers and retailers can continuously replenish their stocks to make sure that
they are never stock out. That they always do it just before they are about to run out, never leading to excess inventory.
So, hence the term Just in time.
They started adopting these techniques in their own factories which then quickly became adapted by other Japanese
manufacturers too like Samsung and Honda and Nissan and others as well.

© Copyright 2019. UpGrad Education Pvt. Ltd. All rights reserved
Over time these techniques were so effective that other western manufacturers also began applying them. They could
see the benefits because these Japanese companies had less working capital. They were more efficient. They had
higher productivity rates. They had fewer defects and they had lower cycle times. They had less cash tied up, they had
lower overheads.
Just in time again which came from the idea of replenishment in the grocery stores and also once commonly known
today as the flow. And as we will see flow has to do with the continuous flow of goods and elimination of waste in the
process.
And most importantly it requires that we think of all the operations as a system. In that they are all dependent on
one another and they have to work together and that's their pull through the system causing this flow to occur. And
it also focuses on waste reduction.
As you can see it really doesn't eliminate waste in the process and the inventory, as we can see as the form of waste.
Origins of lean thinking, the thinking behind lean again is a way of understanding value. And when we think about
value, value is really the viewpoint of the customer. So, anything that isn't viewed as valuable by the customer
potentially then can be thought as a waste.

© Copyright 2019. UpGrad Education Pvt. Ltd. All rights reserved
And what we mean by that, that it includes number of broad categories. You can include equipment, materials, parts,
workers, moments anything that's not absolutely necessary for the production of goods or service. So, for example
inventory is a form of waste. The customer doesn't care about your inventory. They don't care about how much
inventory is present in your system and therefore it is a waste, a form of waste that should be eliminated.
By things like value stream mapping, that we talk about more, so what we want to understand out here is that in value
stream mapping, you create a complete flow chart. In this flow the ideas is to improve the element and reducing waste.
Basically, in a value stream mapping, there are multiple blocks, a flow chart created of the complete cycle of activities
that is happening. And from that, any activity that is actually not resulting into a real requirement or is not adding to
the finished goods of the product and can be avoidable is avoided. Be it processes, be it autocracy or be it anything
else.
So, value stream mapping is basically to identify what are the components of that values steam which are leading to a
value addition. To think about how do we improve the flow? What is the achievement of the paths along the value
stream to reduce queues, to reduce stoppages, to reduce scrap, to reduce back flows? Pull then which is really about
making sure that no upstream should produce a product or service until a downstream customer ask for it.
So, you are pulling material, you are not pushing it into your next individual in the process and then finally it's about
perfection. It's about striving for perfection not just to get ahead of your current competition.

© Copyright 2019. UpGrad Education Pvt. Ltd. All rights reserved
1. One, specify value as we said earlier. Value addition is really judged by the customer and this is really about
trying to identify specific products. What are the capabilities of those products? What is the customer willing
to pay for that product? And what are the other things they expect about that product?
Ultimately and again, Japanese companies are very good at this. You really have to define the customer and understand
what the customer wants. And once you understand what the customer wants, you take those definitions of value and
you translate them into specific targets.
2. Second, identify the value stream. The value stream again is of all those activities that is necessary to bring a
product or service through critical business task, through problem solving, through information management
and through physical transformation. It's basically all of the activities that occurred throughout the system and
the process. It's map essentially shows how the customer value moves through the enterprise so the product
service information or whatever it is you do for the customers flow through that stream.
Within the stream however there are ingredients to flow, Impediments to flow. These are the waste components that
makes it visual. So, you are going to define what that value stream is and then you are going to describe something
called the future state. Which is what we hope to able to achieve so that the customer can pull their value through the
stream.

© Copyright 2019. UpGrad Education Pvt. Ltd. All rights reserved
3. Third, flow. This is an example of what a value stream looks like. And you can see a value stream is mapped
into a different chunk. The chunks are boxes to represent the activities and the arrows basically that get into
it show the flow of the material.
If we draw out a complete flow chart, we will find that we can create various activities into form of chunks. These
chunks are boxes to represent the activities and then the arrows which are directing the flow are basically to show the
flow of the material and there may also be information that's flowing along with that.
Thus, value stream mapping now helps us identify out of these activities which is a value-added activity and which is
non-value added.
Combining this information and coming to a would-be process, we arrive at a lean system. Now once you are able to
see these lean systems, you can really arrive at better scenarios.

© Copyright 2019. UpGrad Education Pvt. Ltd. All rights reserved
Now why do companies make both lean and six sigma. These are all different elements of lean and six sigma and the
reason why we need both of them is that in fact they complement one another. So, lean and six sigma, they are two
things.
Companies that adopt both lean and six sigma, first of all they are able to consistently improve product delivery and
as they do that, they are starting to address some of the issues that could be impacting their loss sales.
So, you talk to a salesperson and very often they will say, our customers aren't happy because we have to wait too
long for a product. Or they are not happy because the quality level of the existing products they bought from us in the
past is not good enough.
As you reduce the non-value-added time in the value stream, you are able to actually reduce the delivery time and
that means your customer will get their products more quickly. As you start to improve quality, quality can impact
manufacturing lead time. For instance, 10% scrap rate can increase your lead time by 40%. Why? Because you have to
do re-work. Because you have to measure quality. Because you have to inspect it. That actually consume capacity as
well. Slowly times can also reduce the rate of quality improvements. So, it goes both ways.
So, for instance, if you look at some of the work by the department of energy, they are doing fewer trials per month
because they are able to reduce their lead time. We also see capacity problems are masked by slow cycle times.
There may be quality capacity issues in terms of bottlenecks in the process and then the other big pieces that the Six
Sigma brings the process under control. While lean approaches to reduce lead time And as you combine both of these
approaches you are optimizing capacity. You are reducing your cycle time and you are also eliminating variability in all
the processes. So, these are two very complementary capabilities that both reduce lead time and reduce variability.

© Copyright 2019. UpGrad Education Pvt. Ltd. All rights reserved
4. Well, the fourth element is around pull. Let's talk for a moment about what we mean by pull? What we see is
that customer demand, the real customer demand which is the end customer should pull the products through
the system. So, as a customer buys the product or takes it off the shelf, that signal rise a pull signal that echoes
through the system and people throughout the system.
Through every process that feeds into the end customer requirement. This should respond to that pull signal by
producing another signal unit to feed that customer. You can see with that concept of pull, that inventory is waste.
Inventory by that system is a waste. You shouldn't produce anything unless it's needed by the end customer. You
shouldn't produce anything until the last possible minute, when it's actually required.
And now we get into a very, very interesting concept, which is extremely popular and which is called as introduction
to the theory of constraints and synchronous manufacturing. The applicability of TOC spans across various business
areas since every organization has constraints which prevented from achieving the goals or higher performance. So,
the need of the organization is to identify the constraint and whatever is necessary to manage them.

© Copyright 2019. UpGrad Education Pvt. Ltd. All rights reserved
The operational philosophy behind theory of constraints is that the capacity of a shop does not reflect the cumulative
capacity of the different workstations. TOC does this by devising a scheduling system where in the bottleneck pulls its
requirement from other stations.
Let's understand various terminologies related to the theory of constraints. Constraints, what is constraints? It's
anything that can limit the performance of an organization, that can be called as a constraint. Constraints are classified
as internal constraint which could be a capacity or external constraint which could be like example market demand.
Second capacity, this is defined as the total time available for production. Then there's a term called bottleneck. What
is a bottleneck? It's defined as any resource whose capacity is less than the demand based on it.
The capacity constraint resource is one whose utilization is close to 100%. Whenever the capacity of a resource is
greater than the demand placed upon it, it is called non-bottleneck resource.

© Copyright 2019. UpGrad Education Pvt. Ltd. All rights reserved
Time components of a production cycle. Now these could be different types. Set up time is the amount of time that a
part spends waiting for a resource to be set up to work on the same part. And process time, process time is the time
taken for processing the part. Then there is curing time. Curing time is a time that a part waits for a resource while the
resource is busy with some other tasks.
Now how to save time in a production cycle? So, the bottlenecks govern both the throughput and the inventory in the
system and an hour lost at the bottleneck, is an hour loss for the entire system. You must understand that an hour
saved at a non-bottleneck is a Mirage, since it will have no impact on the entire system.
So, the Goldratt theory of constraints, it talks about dividing the entire process into five steps.
1. First, identify the system constraints.
2. Step number two, exploitation of constraints.
3. Third, subordination of every other decision to that of the constraint.
4. Step four, elevation of the system constraint.
5. Step five, in case the constraint is broken, go back to step one and don't let inertia become a constraint.

© Copyright 2019. UpGrad Education Pvt. Ltd. All rights reserved
So, theory of constraint is a systematic body of knowledge which recognizes that resources and manufacturing
organizations differ from one another in their ability to process components, and then there are statistical fluctuations
and dependent events are characteristic of resources in a manufacturing organization.
So, the TOC uses specific methods to improve the performance of the system under these conditions. At the same
time, now introduction to the theory of constraint concept of drum buffer will be quite important out here, we call it
DBR.
In this, it says every production system needs some control, so if there is a bottleneck resource, when the bottom neck
is the best place for control, this control point is called the drum. Once the bottleneck is identified, you need to do the
following things. First, keep a buffer inventory in front of it, communicate back stream to the first operation to inform
about the production activity of the bottling. This communication is called rope. The buffer inventory in front of a
bottleneck is called a time buffer. Now, as the market demand may change, the additional buffer helps to fulfill the
additional demand.

© Copyright 2019. UpGrad Education Pvt. Ltd. All rights reserved
So, now you would be aware about theory of constraints and the theoretical concept around theory of constraints.
Now let's try and understand this with an example of an FMCG company. So, the traditional supply chain of an FMCG
company is that the company or the manufacturer, it procures the raw material from a supplier. It converts that raw
material into finished good, which is then transported to a distributor who sends it to a retailer and the retailer then
sends it to a customer.
Now how does the entire forecasting and the inventory planning happens? It happens in a method which is more of a
push-based method. So, what happens is that if a customer is buying 5 products on an average, which means on one
particular day, he might have bought 3, on the next day he buys 7, the average is 5, right?
So, the retailer sees there is a variation in customer demand and what he does is that to meet that demand, he keeps
some safety stock and instead of procuring and keeping 5, he will keep 10 pieces for the customer. Now the retailer
gets his product from distributor and let's say the lead time from distributor to retailer is 2 weeks. It means that a
retailer on a daily basis needs, let's say 20 products. But what the distributor will do is that he will also try and keep
some safety, and instead of forecasting 20, he is going to forecast for 30.
Similarly, manufacturer, if his lead time is also 2 weeks for the distributor, instead of keeping 30, he's going to keep
70. All right. So, in this way, across the supply chain, there are variations which keep on adding up from customer right
up to manufacturer. And what happens is that this leads to lot of inventory in the system, which was not actually
required.

© Copyright 2019. UpGrad Education Pvt. Ltd. All rights reserved
So, this concept is known as bullwhip effect wherein the variations keep on adding from the first point to the last point.
And these variations are usually coming in to have a safety against lead time, order batching, and price fluctuations.
Now how this can be managed. So, this is managed through a concept known as theory of constraints. So, theory of
constraints, what it says is that instead of having a push-based system wherein a manufacturer is forecasting and
pushing product to distributor, distributor is pushing the product to retailer, it moves to a pull-based system. So, here,
what happens is that at each leg, there are some buffers build in. So, retailer will have some buffer inventory,
distributor will also have some buffer inventory. And then, each and every leg in the supply chain will keep on
replenishing the buffer inventory.
So, for example, the distributor will see what is the inventory, which is there with the retailer and whenever the
inventory drops below a certain level, he replenish the inventory to the retailer. Similarly, manufacturer will replenish
the inventory to a distributor. So, there is a buffer inventory level, which is always maintained at each leg. And instead
of pushing the inventory, there is a pull which is created whenever the inventory drops below a safety stock. So, this
takes care of the bullwhip effect wherein, there is a mechanism which is put in to address the variation in the system
without building the additional inventory in the entire supply chain.
No part of this publication may be reproduced, transmitted, or stored in a retrieval system, in any form
or by any means, electronic, mechanical, photocopying, recording or otherwise, without the prior
permission of the publisher.