Manual on Participatory 3-D Modeling for Natural Resource ...
53
Transcript of Manual on Participatory 3-D Modeling for Natural Resource ...

Essentials of Protected Area Managementin the Philippines
Volume 7
Manual on
Participatory 3-DimensionalModeling
for Natural Resource Management
Department of Environment and Natural Resources
Supported by the
European Commission
October 2000

Essentials of Protected Area Management in the Philippinesii
Manual on Participatory 3-Dimensional Modelingfor Natural Resource Management
By Giacomo Rambaldiand Jasmin Callosa-Tarr
Published by: National Integrated Protected Areas Programme
PROTECTED AREAS AND WILDLIFE BUREAU
Department of Environment and Natural Resources
Reproduction of this publication for educational or othernon-commercial purposes is authorized without any priorwritten permission from the Publisher provided the source andthe authors are fully acknowledged.
Reproduction of this publication for sale or other commercialpurposes is prohibited without prior permission from the Publisher.
Citation: RAMBALDI G., CALLOSA J. 2000. Manual on Participatory3-Dimensional Modeling for Natural Resource Management.Essentials of Protected Area Management in the Philippines, Vol. 7NIPAP, PAWB-DENR, Philippines.
ISBN: 971-8986-21-9
Editor: Struan Simpson
Editorial Adviser: Bridget Botengan
Design: Benjo Laygo
Pictures: Royce Eustaquio, Giacomo Rambaldi, Fernando Ramirez
Printed by: Creative Organizational Resources-Asia, Inc., Philippines
Disclaimer: The views expressed are those of the Consultant and ProjectStaff and do not necessarily represent any official view of theEuropean Commission.
The designation employed and the presentation of materialin this publication does not imply the expression of anyopinion whatsoever on the part of the Publisher and Authorsconcerning the legal status of any territory, city or area orof its authorities, or concerning the delimitation of its frontiersor bounderies.
Funding partners: European CommissionDepartment of Environment and Natural Resources
Technical AssistanceService Contract: Agriconsulting S.p.A., Rome, Italy
Available from: PROTECTED AREAS AND WILDLIFE BUREAUDENR CompoundVisayas Avenue, Diliman1101 Quezon CityPhilippines
Manual on Participatory 3-Dimensional Modeling iii
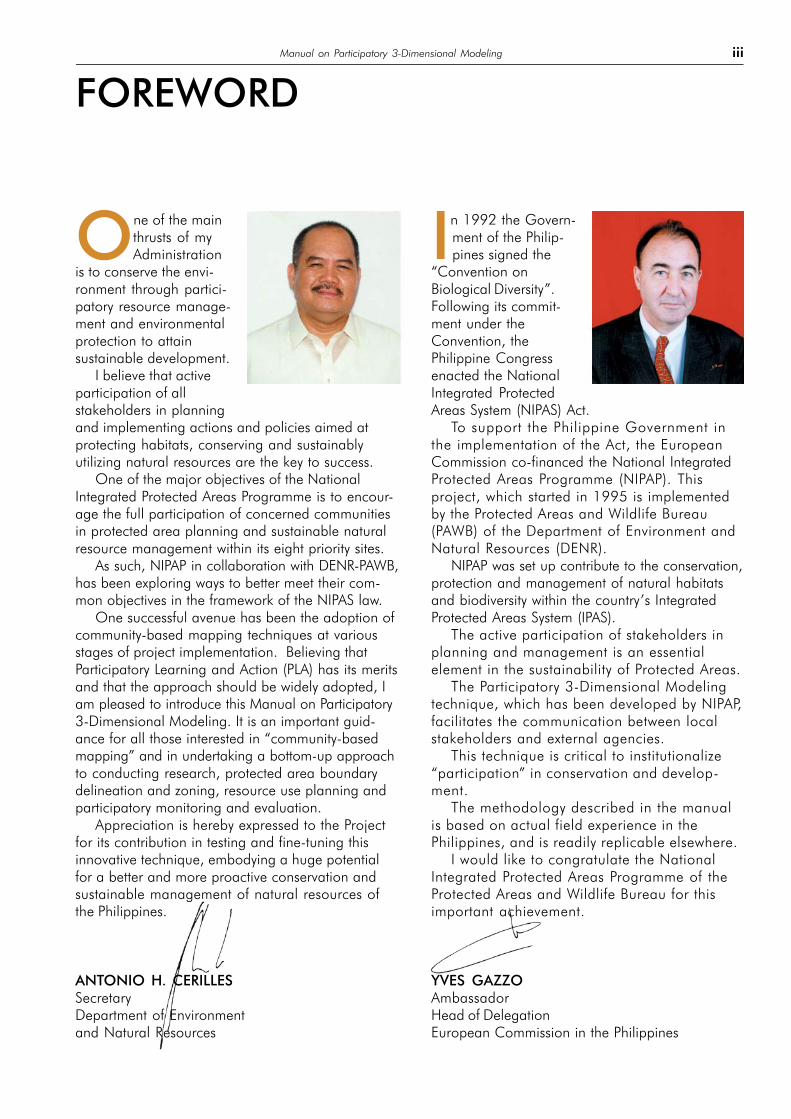
One of the mainthrusts of myAdministration
is to conserve the envi-ronment through partici-patory resource manage-ment and environmentalprotection to attainsustainable development.
I believe that activeparticipation of allstakeholders in planningand implementing actions and policies aimed atprotecting habitats, conserving and sustainablyutilizing natural resources are the key to success.
One of the major objectives of the NationalIntegrated Protected Areas Programme is to encour-age the full participation of concerned communitiesin protected area planning and sustainable naturalresource management within its eight priority sites.
As such, NIPAP in collaboration with DENR-PAWB,has been exploring ways to better meet their com-mon objectives in the framework of the NIPAS law.
One successful avenue has been the adoption ofcommunity-based mapping techniques at variousstages of project implementation. Believing thatParticipatory Learning and Action (PLA) has its meritsand that the approach should be widely adopted, Iam pleased to introduce this Manual on Participatory3-Dimensional Modeling. It is an important guid-ance for all those interested in “community-basedmapping” and in undertaking a bottom-up approachto conducting research, protected area boundarydelineation and zoning, resource use planning andparticipatory monitoring and evaluation.
Appreciation is hereby expressed to the Projectfor its contribution in testing and fine-tuning thisinnovative technique, embodying a huge potentialfor a better and more proactive conservation andsustainable management of natural resources ofthe Philippines.
ANTONIO H. CERILLESSecretaryDepartment of Environmentand Natural Resources
In 1992 the Govern-ment of the Philip-pines signed the
“Convention onBiological Diversity”.Following its commit-ment under theConvention, thePhilippine Congressenacted the NationalIntegrated ProtectedAreas System (NIPAS) Act.
To support the Philippine Government inthe implementation of the Act, the EuropeanCommission co-financed the National IntegratedProtected Areas Programme (NIPAP). Thisproject, which started in 1995 is implementedby the Protected Areas and Wildlife Bureau(PAWB) of the Department of Environment andNatural Resources (DENR).
NIPAP was set up contribute to the conservation,protection and management of natural habitatsand biodiversity within the country’s IntegratedProtected Areas System (IPAS).
The active participation of stakeholders inplanning and management is an essentialelement in the sustainability of Protected Areas.
The Participatory 3-Dimensional Modelingtechnique, which has been developed by NIPAP,facilitates the communication between localstakeholders and external agencies.
This technique is critical to institutionalize“participation” in conservation and develop-ment.
The methodology described in the manualis based on actual field experience in thePhilippines, and is readily replicable elsewhere.
I would like to congratulate the NationalIntegrated Protected Areas Programme of theProtected Areas and Wildlife Bureau for thisimportant achievement.
YVES GAZZOAmbassadorHead of DelegationEuropean Commission in the Philippines
FOREWORD
Essentials of Protected Area Management in the Philippinesiv
PREFACE
The National Integrated Protected Area Programme (NIPAP) is a special project of the Philippines Department of Environment and National Resources (DENR), Protected Areas and Wildlife Bureau (PAWB),
supported by financial and technical assistance from the European Commission.
A major portion of PAWB’s responsibility is to disseminate information about the management andoperations of protected areas in the Philippines, at policy, technical and field levels.
Therefore, in collaboration with the Bureau, NIPAP has produced a series of case studies, field andtraining manuals, other educational material and legal reference documents under the title of “Essentials ofProtected Area Management in the Philippines”.
The series builds not only on NIPAP’s and PAWB’s field experience, but reflects the work and knowledge ofsister institutions in the Philippines, including the ASEAN Regional Center for Biodiversity Conservation(ARCBC), the Conservation of Priority Protected Areas Project (CPPAP), and the Technical Assistance forImproving Biodiversity Conservation in Protected Areas of the Philippines Project (TABC).
BackgroundWithin the terms of the Biodiversity Convention, the European Union and the Government of the Philip-
pines, co-financed the National Integrated Protected Areas Programme (NIPAP), set up for a five-year period(1995-2000) to be an operating model for the Philippine protected area system, as legislated for in the1992 National Integrated Protected Area System (NIPAS) Act,
NIPAP’s aims were to demonstrate within eight protected areas the operation of a system strongly advo-cating the participation of communities in local policy making and implementing plans to conservebiodiversity.
The challenge faced by NIPAP and its successors is how to give due weight to the interests of local com-munities in deciding the critical issues of protected area boundary delineation, resource-use zoning andformulating policies on sustainable use of natural resources.
While the NIPAS Act provides for the establishment of Protected Area Management Boards (PAMBs),getting to the grassroots presents numerous practical difficulties. These range from logistical constraints tocultural, political and educational differences, language barriers and differing perspectives, all of whichhinder a genuine sharing of information.
In 1996, NIPAP started on-field research among protected area dependent communities introducingthem to participatory approaches in data collection, collation, analysis and interpretation.
Methods such as transect diagramming and participatory resource mapping were readily adopted eventhough there were reservations about “translating” sketch map data into more precise, “negotiable” information.
More importantly, experience has shown that while informal maps meet local needs, technical maps tendto be more fruitful in dealing with bureaucracies.
Another challenge to NIPAP, lay in providing different stakeholders, with the means of portraying theextent of their interest or domain in the area, thus availing themselves of an accessible, commonly under-stood medium that could convey authority and impart a sense of empowerment.
The MethodOne approach that satisfies these desiderata is Participatory 3-Dimensional Modeling (P3-DM), a carto-
graphic method of merging Geographic Information System (GIS) generated data with people’s knowledge.
P3-DM produces a stand-alone, user-friendly and usefully accurate spatial research, planning andmanagement tool in the form of a scaled relief model containing information which can be extracted andfurther elaborated by the GIS.
Manual on Participatory 3-Dimensional Modeling v
Regular updating allows stakeholders to monitor change and thus apply (Participatory) Monitoring andEvaluation activities over large areas.
The method has large potential for collaborative research, planning and management in the fields ofenvironmental protection, community-based natural resource management, tenure, customary rights, socialanalysis, agricultural production, fisheries, rural development, transport and water supply.
The Manual
The manual is intended to assist Participatory Learning and Action (PLA) practitioners, non-governmentaland other civil organizations, society or scientific institutions and others who would find community-basedmapping a powerful tool for increasing the capacity of local stakeholders to interact with national andinternational, and to express their views and assert their rights.

Essentials of Protected Area Management in the Philippinesvi
ACKNOWLEDGEMENTS
Publications like this are based on knowledge acquired from direct field experience. They are thefinal product of collations of annotated drafts, observations, comments and chance remarks.
This manual is a synthesis of the inputs from local mapmakers and program facilitators during the variousphases of the construction process. It reflects whatever mistakes happened to be noted but also the suc-cesses achieved in shaping a tool matched to the interests and skills of people with something to communi-cate in areas where the logistics of communication pose serious obstacles.
We have to say that everyone involved in this innovative map making process, from national and localgovernment agencies, community elders, students, indigenous people, non-governmental organizations, andthe private sector, all have shown immense enthusiasm and dedication to a process that they could see,touch, understand and shape.
We wish we could list all 650 individuals, whose knowledge, dedication and skills carried the processforward from concept to final “commissioning”.
There are however, certain individuals who deserve mention for the special effort they provided. First, wewould like to thank our colleagues from PAWB Protected Area Community Management Division, particularlyCarlo C. Custodio, Marlynn M. Mendoza, Teodora B. Sandoval, Rosita P. Pariña, Cristeta A. Castro, MaritesViste Agayatin, Leland Taoingan and Gerardo Lita for their constant support both in the field and at head-quarters. Second, we would like to thank Fernando Ramirez, senior agriculturist, who acted as lead facilitatorduring all exercises; Royce Eustaquio and Bunny Soriano, GIS operators, who prepared base maps, assistedin the construction of models and led the process of data extraction and digitization; the Protected AreaSuperintendents (PASus) of Mt. Malindang and Malampaya Sound, PASus Rolando Dingal and Pete Velasco,for their superb logistic arrangements and back-up during the exercises and for having promoted adoption ofthe method to local government administrators. Special mention goes to all the Mayors who supported theseinitiatives and to the indigenous peoples of Mt. Pulag, Mt. Guiting-guiting, Mt. Isarog and Mt. Malindangwho shared their valuable knowledge of remote and still pristine areas; to the fishers of El Nido, MalampayaSound and Sibuyan Island, who revealed the hidden features of the seabed; to the farmers who shaped andclassified the details of agricultural lands; to the rural health workers, women in particular, who best unveileddetails on health, education and demography.
We further acknowledge the support of Struan Simpson, patient editor.
We must make special mention of PAWB Director Reynaldo C. Bayabos and Assistant Director MunditaLim, who successfully brought about the institutionalization of 3-D modeling into the DENR system.
Last but not least we would thank the Program Co-Directors, Dr. Antonio C. Manila and Nick AshtonJones, for providing us with the means and moral support to direct this challenging and innovative task.

Manual on Participatory 3-Dimensional Modeling vii
TABLE OFCONTENTS
FOREWORD iii
PREFACE iv
ACKNOWLEDGEMENTS vi
WHY 3-D? 1
MAKING INFORMATION TANGIBLE 2
THE PROCESS 4
PHASE ONE: PREPARATORY WORK 5Selecting the Area 5Defining the Constituency 5Groundwork at Community Level 5Organizing the Logistics 5Drawing up the Participant List 5Gathering Secondary Information 5The Base Map 6
A Matter of Scale 6The Vertical Scale 7Preparing the Base Map 8
Materials Procurement 9
PHASE TWO: ASSEMBLING THE MODEL 10The Base Table 10Orienting Participants 10Organizing Work 10Tracing, Cutting and Pasting 11The “Blank” Relief Model 12
PHASE THREE: TRANSPOSING INFORMATION 13People’s Knowledge 13
Orienting Key Informants 13Transferring Mental Maps 13
Secondary Information 15Placing the Grid 15Finishing Touches 17
PHASE FOUR: HANDING OVER OF THE MODEL 18
PHASE FIVE: EXTRACTING INFORMATION 18Pre-extraction Stage 18Extraction Stage 18
PHASE SIX: DIGITIZING AND MANIPULATION 19
PHASE SEVEN: FIELD VERIFICATION 19
RELIEF MODELS IN PRACTICE 20
EXAMPLES FROM THE FIELD 20
A MULTIPURPOSE TOOL 23For Awareness Raising and Education 23For Community Cohesion and Self-actualization 23For Collaborative Planning 23For Collaborative Research 24For Increasing Local Communications Capacity 24For Protected Area Management 25For Self-determination 25For Participatory Monitoring and Evaluation 25For Conflict Resolution 25
FREQUENTLY ASKED QUESTIONS 26
GLOSSARY 27
REFERENCES 27

Essentials of Protected Area Management in the Philippinesviii
Figure 1 Fisherman presenting the results of two-stageresource mapping 1
Figure 2 Information is transferred from the sketch
to the topo map 2
Figure 3 The model: a focus for discussion 2
Figure 4 Information is made tangible 3
Figure 5 There we are! 3
Figure 6 The 3-D Modeling process and its GIS generatedoutputs 4
Figure 7 1:10,000 scale (reference) 6
Figure 8 Example of contours drawn in different colors 8
Figure 9 P3-DM coding items 9
Figure 10 Details of the base table 10
Figure 11 Prepare visual aids to support your presentation 10
Figure 12 The carbon paper is assembled 11
Figure 13 Each contour line is traced on a separatecarton board 11
Figure 14 Contour layers are cut 11
Figure 15 Geo-referenced nails are used to properlylocate the layers 12
Figure 16 The single layer is pasted 12
Figure 17 Layers are consolidated 12
Figure 18 The “blank” 12
Figure 19 The legend is updated 13
Figure 20 Coding means are displayed 13
Figure 21 Landmarks are identified 13
Figure 22 Land uses and land cover are identified 14
Figure 23 Acrylic colors are applied after validation 14
Figure 24 Point form data are located by the use ofcolor-coded pins 14
Figure 25 Group dynamics are enhanced 15
Figure 26 The grid is placed by the use of A/1 coordinates 15
Figure 27 Model with 10-cm grid 16
Figure 28 Coordinates are identified on the base map 16
Figure 29 Coordinates are reflected on the relief model 16
Figure 30 The boundary is outlined 17
Figure 31 Legend, plate and directional arrow are placed 17
Figure 32 Matching grids 18
Figure 33 Tracing the coastline 18
Figure 34 Looking straight 19
Figure 35 Information is digitized 19
Figure 36 Mt. Pulag National Park 20
Figure 37 Mt. Malindang Natural Park 20
Figure 38 Malampaya Sound Protected Landscape and Seascape 20
Figure 39 El Nido-Taytay Managed Resource Protected Area 21
Figure 40 Mt. Isarog Natural Park 21
Figure 41 Mt. Guiting-guiting Natural Park 21
Figure 42 Pamitinan Protected Landscape 22
Figure 43 Ayta Ancestral Domain, Cabangan, Zambales 22
Figure 44 Kankanaey Ancestral Domain, Kibungan, Benguet 22
Figure 45 The function of P3-DM in a participatory M&E context 25
LIST OFFIGURES

Manual on Participatory 3-Dimensional Modeling ix
LIST OFAPPENDICES
LIST OF TABLESTable 1 Choice of scale: some examples 6
Table 2 The choice of the contour interval determinesthe workload 8
Table 3 “Features” and the means to code and display them 9
Table 4 Workgroups & facilitators 10
Appendix 1 Reading maps 28
Appendix 2 Supply list for the manufacture of the 1:10,000scale model of Sibuyan Island, Romblon, Philippines.Area coverage (land: 453 km2, water: 443 km2) 29
Appendix 3 Supply list for the extraction phase - 1:10,000scale model of Sibuyan Island, Romblon, Philippines.Area coverage (land: 453 km2, water: 443 km2) 30
Appendix 4 Legend and directional arrowMt. Guiting-guiting Natural Park.Romblon, Philippines, 1999 30
Appendix 5 Land Use and Cover.Mt. Pulag National Park.Benguet, Nueva Vizcaya and Ifugao, Philippines.Source: 1999 Participatory 3-D Model 32
Appendix 6 Land Use and Cover.Mt. Pulag National Park.Benguet, Nueva Vizcaya and Ifugao, Philippines.Source: JAFTA-NAMRIA, LandSat TM 1992 33
Appendix 7 Land Use and Cover.Mt. Malindang Natural Park.Misamis Occidental, Philippines.Source: 1999 Participatory 3-D Model 34
Appendix 8 Land Use and Cover.Mt. Malindang National Park.Misamis Occidental, Philippines.Source: DENR 35
Appendix 9 Population Distribution Map.Mt. Pulag National Park.Benguet, Nueva Vizcaya and Ifugao, Philippines.Source: 1999 Participatory 3-D Model 36
Appendix 10 Social Map.Mt. Malindang National Park.Misamis Occidental, Philippines.Source: 1999 Participatory 3-D Model 37
Appendix 11 Social Infrastructure Distribution Map.Mt. Pulag National Park.Benguet, Nueva Vizcaya and Ifugao, Philippines.Source: 1999 Participatory 3-D Model 38
Appendix 12 Social Infrastructure Distribution Map.Mt. Malindang Natural Park.Misamis Occidental, Zamboanga del Norteand Zamboanga del Sur, Philippines.Source: 1999 Participatory 3-D Model 39
Essentials of Protected Area Management in the Philippinesx
ABBREVIATIONS 3-D Three-dimensionalCADC Certificate of Ancestral Domain ClaimDENR Department of Environment and Natural ResourcesENTMRPA El Nido-Taytay Managed Resource Protected AreaGIS Geographic Information SystemJAFTA Japan Forest Technical AssociationLGU Local Government UnitMGGNP Mount Guiting-Guiting Natural ParkMIBNP Mounts Iglit and Baco National ParkMINP Mount Isarog Natural ParkMMNP Mount Malindang Natural ParkMPNP Mount Pulag National ParkMSPLS Malampaya Sound Protected Landscape and SeascapeNAMRIA National Mapping and Resource Information AuthorityNGO Non-governmental OrganizationNIPAP National Integrated Protected Areas ProgrammeNIPAS National Integrated Protected Areas SystemP3-DM Participatory 3-Dimensional ModelingPA Protected AreaPAMB Protected Area Management BoardPAWB Protected Areas and Wildlife BureauPASu Protected Area SuperintendentPLA Participatory Learning and Action
Manual on Participatory 3-Dimensional Modeling 1
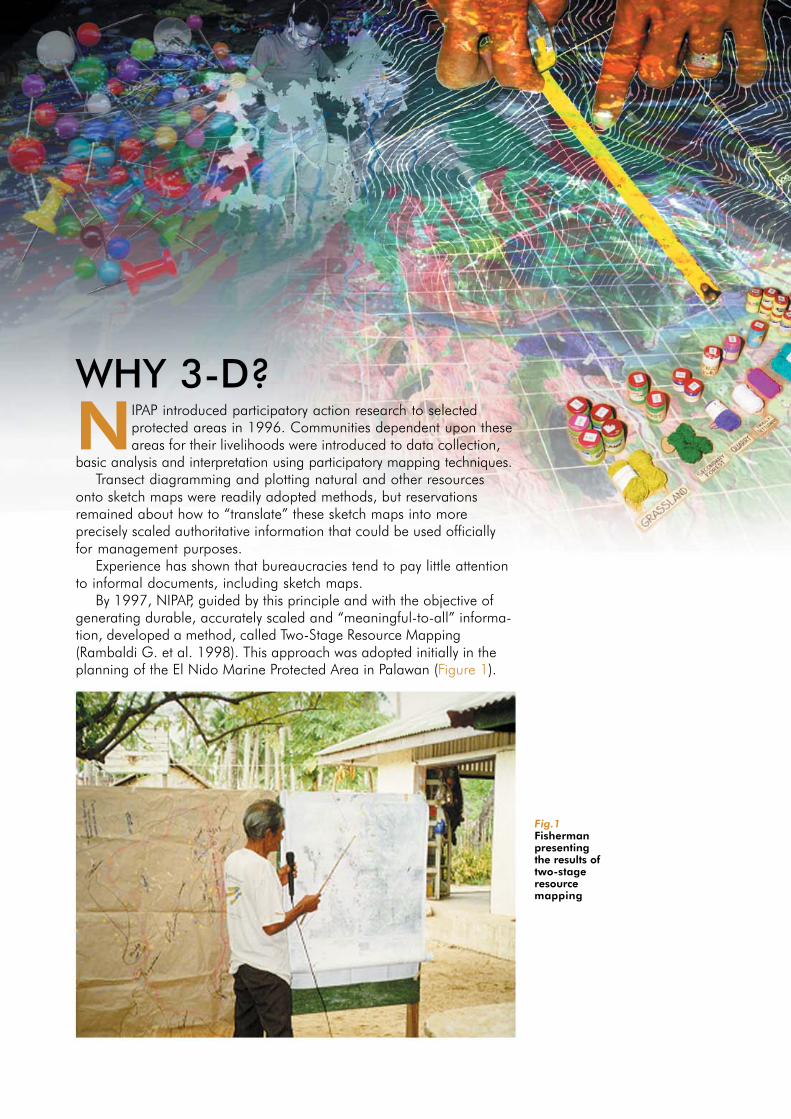
Fig.1Fishermanpresentingthe results oftwo-stageresourcemapping
WHY 3-D?
NIPAP introduced participatory action research to selectedprotected areas in 1996. Communities dependent upon theseareas for their livelihoods were introduced to data collection,
basic analysis and interpretation using participatory mapping techniques.Transect diagramming and plotting natural and other resources
onto sketch maps were readily adopted methods, but reservationsremained about how to “translate” these sketch maps into moreprecisely scaled authoritative information that could be used officiallyfor management purposes.
Experience has shown that bureaucracies tend to pay little attentionto informal documents, including sketch maps.
By 1997, NIPAP, guided by this principle and with the objective ofgenerating durable, accurately scaled and “meaningful-to-all” informa-tion, developed a method, called Two-Stage Resource Mapping(Rambaldi G. et al. 1998). This approach was adopted initially in theplanning of the El Nido Marine Protected Area in Palawan (Figure 1).

Basically, the system worked as follows:● Local communities together with representatives
from the local barangays (local administrative units),produced sketch maps portraying their economicdomains and transferred the information to blown-up topographical maps as shown in Figure 2.
● Following validation by all parties involved,information from the topographical map was trans-posed with minimal distortion to a GIS-generated mapand returned to the communities for re-validation.
● Once a consensus had been reached, commu-nity-specific resource maps were collated and used insubsequent consultations on zoning.
In a general assessment of this approach, it wasobserved that the basic input - the participatory resource maps - werespatially confined to the social, cultural and economic domains of thosewho had produced them.
Thus, in the case of protected areas and their buffer zones, coveringhundreds of square kilometers and a number of different administra-tions (65 in Mt. Malindang Natural Park), the production of a sufficientnumber of community-specific sketch maps became unrealistic fromboth practical and financial points of view.
Furthermore, the Program had to acknowledge that a consistentpart of the comprehensive analysis was carried out away from the field.Communities had to wait several months to “comment” upon the GISoutputs, rather than being provided from the onset with a tool enablingthem to do a comprehensive analysis of the protected area and itsenvirons as a whole, locally.
These were the limitations we experienced in integrating people’sknowledge and GIS capabilities, through conventional participatoryresource mapping, in a collaborative planning process.
However, a solution to these difficulties suggested itself in extendingthe Two-Stage Resource Mapping process by using scaled relief models,as outlined in Figure 6 on page 4.
PPPPParticipatoryarticipatoryarticipatoryarticipatoryarticipatory 3-Dimensional Modeling (P3-DM) integrates participatoryresource mapping, and spatial information (contour lines) to produce astand-alone scaled relief model (Figure 3), which has proved to be auser-friendly and relatively accurate research, planning and manage-ment tool.
MAKINGINFORMATION
TANGIBLE
Fig. 2 Information is transferredfrom the sketch to the topo map
Fig. 3 Themodel: a focusfor discussion
Essentials of Protected Area Management in the Philippines2

Relief models are excellent visual aids capturing the ruggedness anddetails of the territory. Users can see and feel the contours of everymountain range and river valley (Figure 4). Two-dimensional mapscannot match their impact and appeal.
A relief model enormously facilitates the interpretation, assimilationand understanding of cartographic information. Pressure points and“hot-spots” are highlighted (forest cover, household concentrations,industry, access ways, etc.) making them visible and tangible to every-one (Figure 5).
Here are some noted advantages of P3-DM:
● Both process and output fuel self-esteem, raise local awarenessof interlocked ecosystems and delineate intellectual ownershipof the territory.
● Relief models provide stakeholders and local authorities with apowerful medium for easing communication and languagebarriers and create common grounds for discussion.
● The method is especially effective in portraying relatively extensive andremote areas, overcoming logistical and practical constraints topublic participation in land/resource use planning and management.
● 3-D modeling is an efficient community-organizing tool becauseit gathers people to share information and concerns. Old peopleshare history with young people, passing on legends and religiousbeliefs, sacred rites and places so essential to conserving tradition.
● In Participatory Monitoring and Evaluation (PM&E) sketch maps,transect diagrams or other conventional spatial tools, produced atdifferent times are compared. There is an inherent weakness inthe fact that the outputs are not properly geo-referenced andconsistently coded. P3-DM overcomes this weakness, becausethe relief model is a constant with its legend and coding embedded.
● Most protected areas in the Philippines do not have demarcatedboundaries. Relief modeling can give communities and localauthorities a clear first time factual understanding of their perimeter.This facilitates a bottom-up approach to boundary delineationand zoning, both of which activities tend to otherwise be charac-terized by bureaucratic logistics and lengthy negotiations.
● Thanks to the use of differentiated coding systems and materials, 3-Dmodels, similarly GIS, accommodate overlapping information layers,thus facilitating community-based analysis and decision-making.
Fig. 5 There we are!Fig. 4 Information is made tangible
P3-DM is designed to be part of a
broader intervention, aimed at full
Participation of people who are in
the process of Learning about their
needs and opportunities, and ready
to take Action to address them.
Thus, in order for outsiders to apply
this process in a similar context,
they must fulfill two preconditions:
The first is to have a thorough
understanding of the cultural and
socio-economic setting of the area.
The second is to have the ability to
support communities in implementing
strategies and actions to followup
the P3-DM process.
Manual on Participatory 3-Dimensional Modeling 3

Essentials of Protected Area Management in the Philippines4
THE PROCESS
Participatory 3-Dimensional Modeling is a process which can beused to generate a series of outputs, the information from whichmay be stored in a database for use in a Geographic Information
system (GIS).
There are seven basic phases in producing a 3-D model, as follows:1. Preparatory work2. Assembling the blank model3. Transposing information4. Model handing over5. Extracting information6. Digitizing and manipulating data7. Field verification
Each Phase is described in the following sections.
P3-DM’s main function is to generate spatially defined, geo-refer-enced and scaled information which is not the case in other informalmapping techniques. Its adoption needs thorough preparation in theprocurement of supplies, discipline in adhering to color-coding andprecision in the construction, transposition, extraction and digitizationphases.
Fig. 6 The 3-D Modeling process and its GIS generated outputs

Manual on Participatory 3-Dimensional Modeling 5
Selecting the AreaThe area to be reproduced has to be precisely defined from existing
topographic or administrative maps. This allows for the preliminaryidentification of the constituency to be made.
Defining the ConstituencyAs previously stated, the facilitator has to have a thorough under-
standing of the social dynamics of the area. A stakeholders’ analysisor even better, a stakeholders’ map would be of great advantage inidentifying those having vested interests in the area.
In Philippine protected areas these interests would already berepresented on the Protected Area Management Board (PAMB).
Groundwork at Community LevelThe next step in the Preparatory Phase is to introduce the concept
of participatory modeling to community representatives, indigenouspeoples’ groups, local government and non-governmental organiza-tions, reaching agreement and consensus on the use to which theprocess is to be put.
Organizing the LogisticsLogistical organization includes finding a spacious venue where the
community will be able to manufacture the model. It may be necessaryalso to organize transport, accommodation and catering.
Drawing up the Participant ListEssentially there are two types of participants, who can best
contribute to the construction of the model.The first group is made up of students, possibly from locally based
institutions dealing with arts and crafts or sciences. They will be instru-mental in assembling the “blank” model.
The second group1 is made up of “custodians of localknowledge”, comprising indigenous groups, various economic sectors(farmers, fishers, etc.), governmental and non-governmental organiza-tions, and the private sector. They will create the landscape of themodel by merging their mental maps into collective knowledge.
Cluster the informants into focus groups on the basis of residence,economic endeavor, cultural affinity, advocacy and other criteria.Always ensure that women2 and elders3 are adequately represented.
In order to maximize objectivity of the sessions and validity of theoutput, schedule overlapping sessions and focus groups.
Gathering Secondary InformationCheap and easy access to digital contour lines is a prerequisite for
cost-effective Participatory 3-D Modeling.In the absence of data in this format, contour lines can be digitized
from existing maps, but the costs are relatively high.Without topographic maps or digital contour intervals it is impossible
to produce scaled relief models, without substantial financial investments.Additional information needing to be gathered includes demographic,
land use, vegetation cover, resource tenure, ancestral domains, andwhatever else might be of relevance to the facilitators for understand-ing the physical, social and economic characteristics of the area.
PHASE ONE:PREPARATORYWORK
1 Advocacy groups may wish to limit local participation tominorities asserting rights to resources, or struggling for thepreservation of cultural identity, all of which can be linked on themodel to territory and domain.
2 Women’s participation may vary, depending on the culturalbackground of the participating communities. In our experiencewe considered as satisfactory 30% participation.
3 Old people share history with young people, passing onlegends and religious beliefs, sacred rites and places so essentialto conserving tradition. (Alcorn J.B., 2000)
It is the process by which traditional
knowledge is gathered and applied
that determines the success, not the
degree of sophistication of the
mapping technology (Poole P. 1995)

Essentials of Protected Area Management in the Philippines6
The Base Map4
A Matter of ScaleA map or relief model, to be most useful, must accurately show
locations, distances and elevations on a given base of convenient size.This means that everything featured on the map4 or model (land area,distances, rivers, lakes, roads, and so on) must be shown proportion-ately to its actual size. The proportion chosen for a particular mapis its scale (Figure 7).
The scale of a map can be defined simply as the relationshipbetween distance on the map and the distance on the ground,expressed as a proportion, or representative ratio.
This “representative ratio” means that 1 cm on a map is equivalent to
● 1,000 m on the ground at a 1:100,000-scale● 500 m on the ground at a 1:50,000-scale● 200 m on the ground at a 1:20,000-scale● 100 m on the ground at a 1:10,000-scale● 50 m on the ground at a 1:5,000-scale
Why do we need to adjust the planimetric scale?
The smaller the scale of a map is, the fewer the features that canbe accommodated. Obviously, therefore, the larger the scale themore comprehensive the map and of more use to the planning process.
Considering that participatory 3-D models aim at providing a visualaid capturing the details of the territory, the larger5 the scale the better.
Conversions0.001 km = 1 m = 100 cm
0.1 km = 100 m = 10,000 cm
1 km = 1,000 m = 100,000 cm
1 km2 = 100 ha = 1,000,000 m2
1 ha = 10,000 m2
The choice of the scale and hence the size of the model shouldtake account of the need for accuracy as well as the need forenough space in which physically to construct and store the model.
The ideal scale for 3-D modeling is 1:10,000 or larger5. Ifyour reference map is at 1:50,000-scale, it needs to be re-scaled to1:10,000 to make it suitable for 3-D modeling. At 1:10,000, onecentimeter on the model corresponds to 100 meters on the ground- a pretty comfortable scale for people to pin-point salient features.
Fig. 7 1:10,000 scale reference
100 0 100 200 300 400
MetersMetersMetersMetersMeters
Scale 1:10,000Scale 1:10,000Scale 1:10,000Scale 1:10,000Scale 1:10,000
Table 1 Choice of scale: some examples
Scale Size (cm) of the selected area Selected scale Size of Total areaof the on the reference map to be for the P 3-D Model represented
reference map reproduced as a P3-D Model P 3-D Model (Centimeters) by the model
1:50,000 24 x 48 1:10,000 120 x 240 288 km2
1:50,000 48 x 96 1:10,000 240 x 480 576 km2
1:50,000 40 x 50 1:20,000 100 x 125 450 km2
1:50,000 40 x 50 1:10,000 200 x 250 450 km2
1:50,000 40 x 50 1:5,000 400 x 500 450 km2
1:75,000 40 x 50 1:10,000 300 x 375 1,125 km2
1:100,000 40 x 50 1:10,000 400 x 500 2,000 km2
4References on “map reading” are provided in Appendix 1.
5Note that 1:10,000 is a larger scale than 1:50,000.
Manual on Participatory 3-Dimensional Modeling 7
Table 1 demonstrates the simple arithmetic of re-scaling smallerscale maps (1:50,000, for example), to more detailed larger scalemaps (1:10,000), and the relationships between the physical dimen-sions of the model to the geographical area represented by the same.
A number of factors influence the options for re-scaling.First you have to identify and measure the area you want to
reproduce. For your ease, you will select a rectangular shapeincluding the core area (e.g. protected area, watershed, ancestraldomain, or other) and its environs of ecological, cultural and economicsignificance.
If the core of a protected area is a mountain, the rectangle willinclude the downhill catchments and possibly the settlement areaswhere most dependent communities reside.
If the core is a lake or coastal area, all catchments draining intothe main water body should be represented.
This is important for the analytical process, which usually followsthe construction of the model and whence all those referring to themodel do assess causes and effects.
Having defined the area of interest, the next step is to decide onthe scale in which it is to be reproduced. The scale should permit thedesired level of detail on a model that is manageably sized.
At a 1:10,000 scale, households and other point-form featurescan be individually located. A 1:20,000-scale model accommodatesless information, but settlement details can still be represented.
The physical size of the model needs to be seriously considered inview of the space needed both for display, and for storage.
Generally, models are constructed and stored at the same location.The question of dimension therefore, should be defined beforehandwith the prospective caretaker, which could be the local government,a school, a people’s organization or other.
Last but by no means least, the larger the model, the more time isneeded for its manufacture and the more resources (human andfinancial) needed to be mobilized.
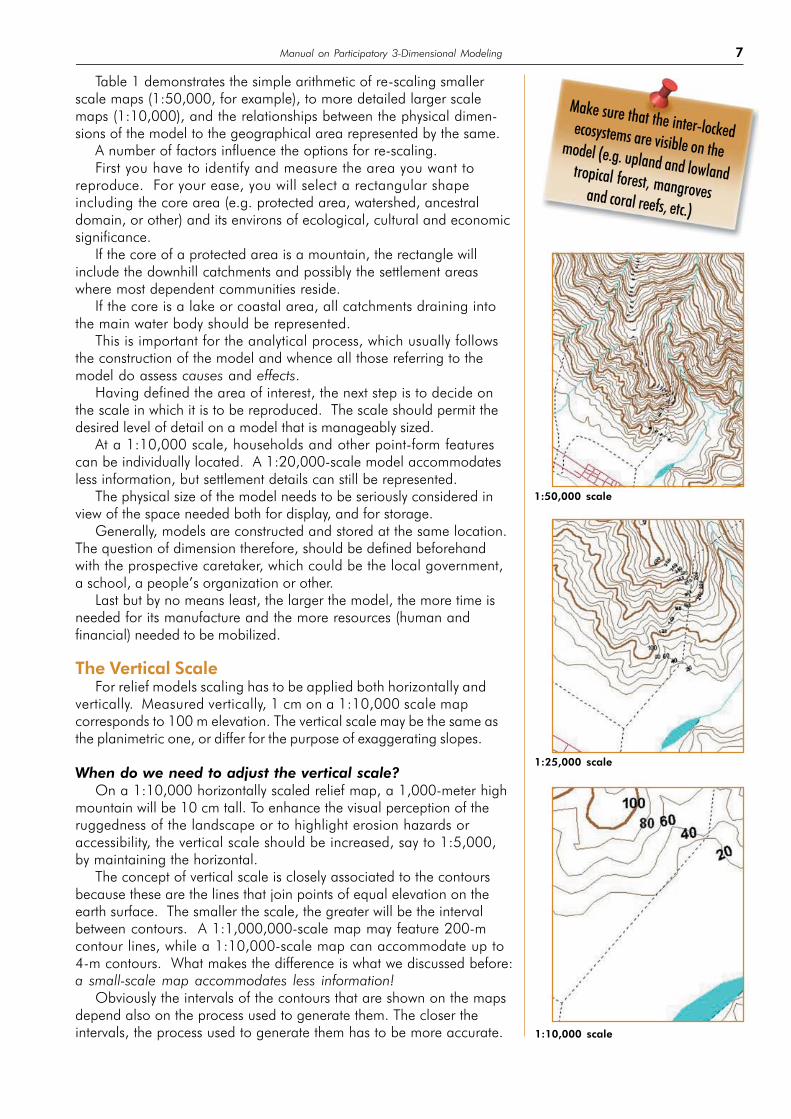
The Vertical ScaleFor relief models scaling has to be applied both horizontally and
vertically. Measured vertically, 1 cm on a 1:10,000 scale mapcorresponds to 100 m elevation. The vertical scale may be the same asthe planimetric one, or differ for the purpose of exaggerating slopes.
When do we need to adjust the vertical scale?On a 1:10,000 horizontally scaled relief map, a 1,000-meter high
mountain will be 10 cm tall. To enhance the visual perception of theruggedness of the landscape or to highlight erosion hazards oraccessibility, the vertical scale should be increased, say to 1:5,000,by maintaining the horizontal.
The concept of vertical scale is closely associated to the contoursbecause these are the lines that join points of equal elevation on theearth surface. The smaller the scale, the greater will be the intervalbetween contours. A 1:1,000,000-scale map may feature 200-mcontour lines, while a 1:10,000-scale map can accommodate up to4-m contours. What makes the difference is what we discussed before:a small-scale map accommodates less information!
Obviously the intervals of the contours that are shown on the mapsdepend also on the process used to generate them. The closer theintervals, the process used to generate them has to be more accurate.
1:50,000 scale
1:25,000 scale
1:10,000 scale
Make sure that the inter-lockedecosystems are visible on themodel (e.g. upland and lowlandtropical forest, mangrovesand coral reefs, etc.)

Essentials of Protected Area Management in the Philippines8
Considering the scope of this manual, the discussion willbe limited to how to define the interval of the contours for thepurpose of manufacturing a scaled relief model.
What contour intervals should we use?Assuming a 1:10,000 scale (horizontal and vertical), it
needs to be decided what contour interval to use.Generally, 1:50,000-scale reference maps feature 20m
contours, which conveniently may be applied to a 1:10,000model.
We will assume that the target is the production of therelief of an island, the lowest elevation of which is the seabed,
at -40 m, the highest the mountain peak at 2,400 m above sea-level.Reproducing a gradient of 2,440 meters by the use of 20-m
contours implies the preparation of 122 layers. [(2,440/20)=122].This would be a demanding task. A workgroup of 12 people can trace,cut and paste approximately 15 layers per day. It would therefore take7-8 days to complete.
Using 40-meter contour lines, 61 layers [(2,440/40)=61] can beprepared and assembled in 3-4 days.
Table 2 illustrates the relationship between scale and contour interval.
Often, the choice of vertical scale to apply is dictated by theavailability of the materials employed in the construction of the model.In the Philippines for instance, corrugated carton rolls are availableonly in 3 mm and 4 mm thicknesses.
Preparing the Base MapGIS technology is becoming more and more widespread for
storing and manipulating georeferenced information. It is anessential tool in both the construction of P3-DM and in optimizingdata interpretation.
Once scale, size and contour intervals have been defined, a basemap has to be generated.
Basic data needed by the GIS office includes:
● Desired scale.● Contour interval.● Desired grid.● Features (e.g. protected area boundary).
Elevation labels should be placed close to the contour lines. Thelatter should be drawn in a sequence of at least four different colors(Figure 8) to facilitate the work of the tracers as discussed on page 11.
Fig. 8 Example of contours drawn indifferent colors
A Geographic Information System
(GIS) in an organized collection of
computer hardware, software, data
and personnel designed to capture,
store and update, manipulate,
analyze and display geographically
referenced information.
Table 2 The choice of the contour interval determines the workload
Gradient between Contour Scale of the Thickness of Numberthe lowest and intervals P 3-D Model each layer of contour
highest elevation (meters) representing the intervals(meters) contour interval (layers)
2,440 40 1:10,000 4 mm 60
800 20 1:20,000 2 mm 40
2,000 40 1:5,000 4 mm 25
360 8 1:2,000 4 mm 45

Manual on Participatory 3-Dimensional Modeling 9
Materials’ ProcurementThe procurement of inputs in 3-D modeling is one
of the most critical tasks you will face during thepreparatory phase.
A supply inventory of materials needed in theconstruction of the model is presented in Appendix 2.
Various items should be available in sufficientquantity and able to accommodate as many variablesas people may want to impose onto the model.
Different colored map pins of various shapes, a richchoice of acrylic colors and matching yarns are vital tothe exercise (Figure 9 and Figure 20).
In procuring the inputs relate the number andshape of pins and other items to the number offeatures that need to be plotted. For example, youshould be aware of the approximate number ofhouseholds found in the area. This will guide you indetermining the number of e.g. white bullet-headedpins. In the same area you may expect to find acertain number of schools and day care centers.Make sure that you have enough color-coded pins to identify thesetwo items independently.
It follows that procurement is done after making a first assessmentof the features you may encounter in the area.
Draft a preliminary legend which can be expanded during theconduct of the exercise. This will guide the compilation of the procure-ment inventory.
Fig. 9 P3-DM coding items
Water bodies (springs and waterfalls); mountain peaks; social infrastructures
(municipal halls, barangay centers, day-care centers, schools, rural health
centers, hospitals, bus stops); cultural places (churches, burial caves,
cemeteries, sacred areas, etc); tourist establishments; human settlements
(households l); scenic spots, turtle nesting sites; diving spots; docking sites,
and other.
Water bodies (rivers, lakes); communication ways (roads, bridges, trails);
social infrastructures (rural water supplies), boundaries (administrative units,
protected area, Ancestral Domains, land status, etc); coordinates (grid)
Water bodies (rivers, creeks, lakes, springs and waterfalls); cultural places
(cemeteries, sacred areas, etc); tourist establishments; land use (rice fields,
swidden, vegetable gardens, sugarcane and coconut plantations, orchards,
reforestation sites, residential areas, etc.); land covers (mossy, dipterocarp
and pine forest, grassland, brushland, mangrove, etc.); land slides and
bare land; fish breeding and spawning areas; feeding grounds of endan-
gered species; fishing grounds (differentiated as squid and pelagic fisheries);
areas where destructive methods are employed, coral reefs (differentiated
into “intact” and “damaged”);
Names, annotations
Points
Lines
Polygons
Attributes
Map and push pins
of diverse color,
shape and size.
Yarns of different colors.
Acrylic paint -
different colors.
Text on labels.
Features Displayed by means of
Table 3 “Features” and the means to code and display them

Essentials of Protected Area Management in the Philippines10
PHASE TWO:ASSEMBLINGTHE MODEL
Fig. 11Prepare visual
aids tosupport yourpresentation
The Base TableA purposely-constructed wooden base should be made available
(Figure 10). The table(s), 60-70 cm high, has to match exactly thebase map, be strong to support the weight of the model and rein-
forced to avoid bending while the wet carton and papier-mâché’ dry up.
One side of the base tableshould measure less than1.8 m, to permit easy accessto otherwise hard-to-reachsections. It may sometimes beeasier to work on two or moretables rather than one, joiningthem on completion of theexercise.
Orienting ParticipantsParticipant orientation to the mechanics of construction (Figure 11)
should be accompanied by some rudiments on map reading (Appendix 1)related to the materials being used: “We are going to use a four millimeterthick carton for each layer, because - at a 1:10,000 scale - 4 mmrepresent a 40 meter contour interval, or 40 meters difference in altitude”.
Organizing WorkOrganize four distinct workgroups, as disclosed in Table 4, each of
which is allocated and coached on a specific task by one facilitator.
For example, a team of fifteen students guided by three facilitators,constructing a 1:10,000-scale model measuring five square meters(500 km2 on the ground) can complete the “blank” model in three tofour days.
Table 4 Workgroups & facilitators
Working Assemblers Tracers Cutters Gluersgroup
No. of 3 4 4 4participants
Facilitators 1 1 1
Fig. 10Details of thebase table

Manual on Participatory 3-Dimensional Modeling 11
Tracing, Cuttingand Pasting
The first group, “the Assem-blers”, prepares carton sheets,exactly corresponding to the sizeof the wooden table and to thebase map.
A second group, “the Tracers”,makes a sheet of carbon paperof exactly the same dimensions(Figure 12).
Using the source map andthe carbon paper, “the Tracers”outline each contour (Figure 13)onto a separate corrugatedcarton sheet, selecting onecorner of the map as a reference6.To clearly identify each layer, a directional arrow indicating North isdrawn on each carton layer together with an annotation on theelevation.
“The Carvers”cut out eachsingle contour(Figure 14),passing it on tothe fourth group.
“The Gluers”paste each layeron the top of theprevious onemaintainingappropriategeo-references.
From theoutset, each andevery layer isgeo-referenced.Prominentlandmarks(mountainpeaks) or othertopographicalfeatures areidentified on thebase map andmarked on thebase table.Nails arehammered intothe plywood tocorrespond totheir location.
Once the contour lines have been traced onto the appropriatecarton layer, all reference marks are transposed from the basemap. In essence the carton layer is perforated to correspond to thelandmarks.
Fig.13 Each contour line is traced on a separate carton board
Fig.12 The carbon paper is assembled
Fig. 14 Contour layers are cut
6 You have to refer to the reference corner wheneveryou overlap or relate layers of information.

Essentials of Protected Area Management in the Philippines12
Thereafter, each perforation becomes matched to the correspondingnail (Figure 15 and Figure 16), thus making sure that each layer iscorrectly placed on the top of its predecessor.
The various layers are then consolidated by the use of crêpe paperand water-based glue (Figure 17). Crêpe paper cut into small squaresmeasuring 5 cm x 5 cm works best, resulting in a strong and resistantpapier-mâché.
The “Blank” Relief ModelThe outcome of the first phase is a scale relief model following the
bare contours of the landscape (Figure 18).
In the process of assembling the model, the team learns aboutscaling, contour intervals, slopes, gradients and other cartographicconcepts. Already, the blank model provides a bird’s eye view of the area.
The subsequent Phases progressively enrich the model withgeo-referenced information, most of which is a reflection of the“mental maps” of the community informants.
Fig. 18The “blank”
Fig. 17 Layers are consolidated
Fig. 16The single layer
is pasted
Fig. 15 Geo-referenced nails areused to properly locate the layers

Manual on Participatory 3-Dimensional Modeling 13
People’s KnowledgeNow that the basic relief model is completed, key informants step
in for a period depending on the size and complexity of the modeland the number of participants you invited. Make sure that yourvenue is not overcrowded.
A model measuring 2.4 m x 1.6 m can accommodate approximately20-25 participants at a time. If 100 key informants have been invited,they should be convened into groups as discussed on page 5. Theexercise should last for 5-6 days. Informants’ sessions should overlapto encourage “cross fertilization” in order to maximize the veracity ofplotted data.
Orienting Key InformantsIn front of the blank model,
refresh informants on the objec-tives of the exercise, explain theprocess of plotting “mental maps”and remind them of the impor-tance of making reference to thelegend in choosing colors andsymbols.
Use this re-briefing opportu-nity to refine the legend(Figure 19) to include additionalfeatures relevant to the partici-pants and also to ensure that allunderstands the legend and definitions.
It is imperative that the informants and all other participantsclearly understand the legend.
“Primary forest” is a precise ecological term that may have adifferent meaning for a scientist, a farmer, or mean nothing at all.Common ground and common understanding need to be established.Use of vernacular definitely helps.
Informants and others can now finalize the legend, matching therange of features to be plotted with the array of different colors andmedia (pushpins, yarn and acrylic paint).
Transferring Mental MapsUsing a compass, orient the relief model North-South.
Display the coding tools (Figure 20).
Invite informants to locate and name in sequential order: watercourses, mountain peaks, islets, roads, trails, social infrastructures andother landmarks they use to orient themselves when moving aroundwithin their domains (Figure 21).
PHASE THREE:TRANSPOSINGINFORMATION
Fig. 20Codingmeans aredisplayed
Fig.21 Landmarks are identified
Fig. 19 The legend is updated
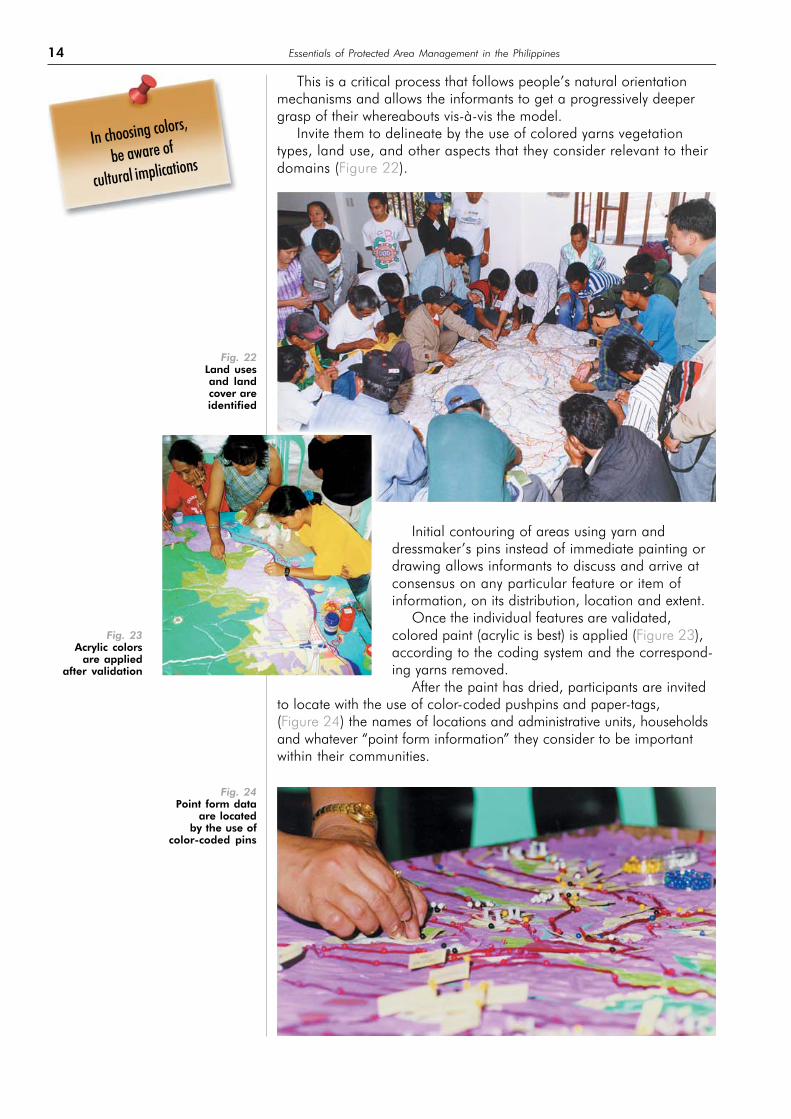
Essentials of Protected Area Management in the Philippines14
This is a critical process that follows people’s natural orientationmechanisms and allows the informants to get a progressively deepergrasp of their whereabouts vis-à-vis the model.
Invite them to delineate by the use of colored yarns vegetationtypes, land use, and other aspects that they consider relevant to theirdomains (Figure 22).
Fig. 24Point form data
are locatedby the use of
color-coded pins
Fig. 23Acrylic colors
are appliedafter validation
Fig. 22Land usesand landcover areidentified
Initial contouring of areas using yarn anddressmaker’s pins instead of immediate painting ordrawing allows informants to discuss and arrive atconsensus on any particular feature or item ofinformation, on its distribution, location and extent.
Once the individual features are validated,colored paint (acrylic is best) is applied (Figure 23),according to the coding system and the correspond-ing yarns removed.
After the paint has dried, participants are invitedto locate with the use of color-coded pushpins and paper-tags,(Figure 24) the names of locations and administrative units, householdsand whatever “point form information” they consider to be importantwithin their communities.
In choosing colors,
be aware of
cultural implications

Manual on Participatory 3-Dimensional Modeling 15
The nature of the process, which assures the concurrent participation(Figure 25) of groups of people from neighboring locations and havingdifferent social, educational, cultural and economic backgrounds,allows for on-the-job data validation. Thus, compared to otherparticipatory community mapping tools, there is lesser need for afinal validation of the output.
In the course of transposing mental maps you should call theattention on the scale of the model. This is best done by displaying areference showing scaled lengths and areas.
During the process, participants may want to add features not includedin the legend. Select the appropriate medium (pin, yarn or paint) and color-code, add the description and the corresponding symbol on the legend.
The use of differentiated coding systems and materials (coloredpaints, pins and yarns) allows 3-D models - like in a GIS - to accom-modate overlapping layers of information. Over a given territory,painted areas describe different land cover and use. Color-codedyarns identify land status, zoning, tenure and administration.
Secondary InformationAfter the informants have completed transposing their mental maps
and cross-checking the information, other features can be added tothe model (administrative boundaries, protected area boundaries, etc.),obtained from official and other sources in order to broaden the basisfor participatory analysis and planning.
To do this, you have to establish a spatial relation between thebase map and relief model.This is done by super-imposing ageo-referenced grid on the topof the model.
Placing the GridA 1:10,000-scale has 10-cm
grid intervals. Each grid squarecorresponds to 100 hectares(one square kilometer). Gridplacement on the model shouldmatch the grid on the basemap. To place the grid you haveto start measuring startingfrom the reference cornershown in Figure 26.
Fig. 26The grid is placedby the use ofletter/figurescoordinates
Fig 25 Groupdynamics areenhanced

Essentials of Protected Area Management in the Philippines16
Once the grid has been placed (Figure 27), you can start transpos-ing information from the base map, making use of its correspondinggrid.
Latitude and longitude co-ordinates of the boundary corners areidentified on the source map (Figure 28) and transposed on the reliefmodel (Figure 29).
Each corner is then connected to the next using a colored yarn(Figure 29).
Fig. 29Coordinatesare reflectedon the relief
model
Fig. 28Coordinates
are identified onthe base map
Fig. 27Model with10-cm grid
Manual on Participatory 3-Dimensional Modeling 17
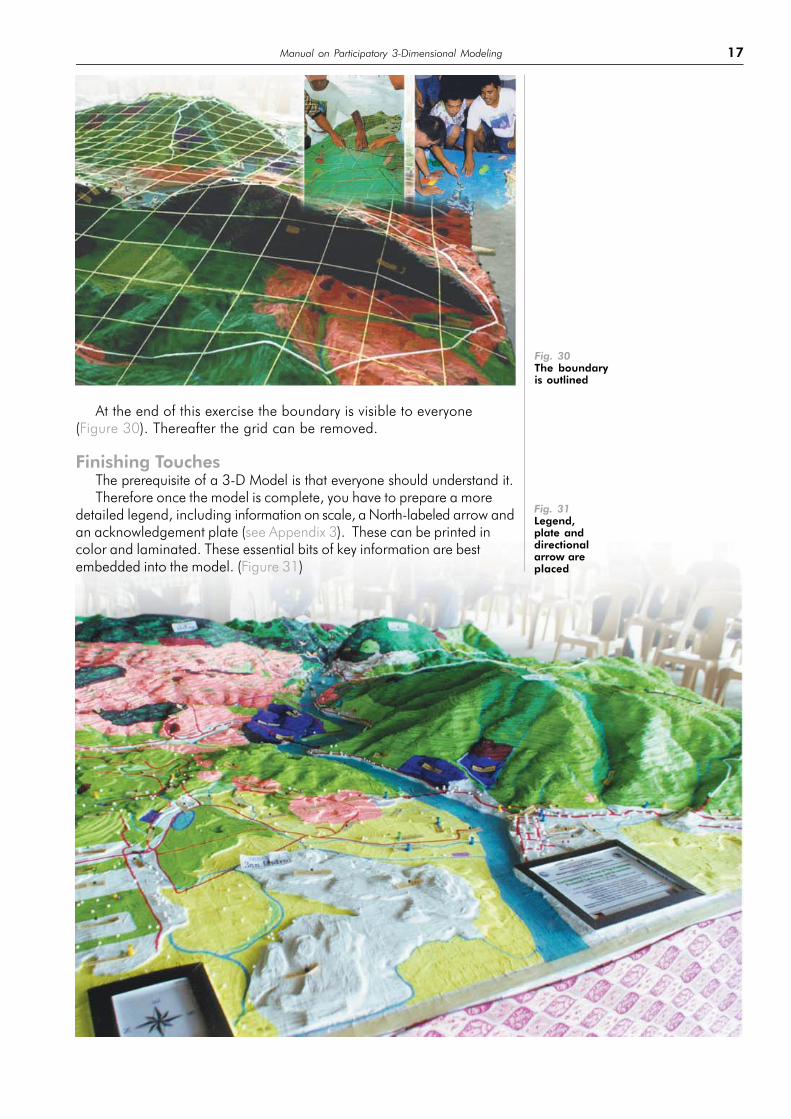
Fig. 30The boundaryis outlined
Fig. 31Legend,plate anddirectionalarrow areplaced
At the end of this exercise the boundary is visible to everyone(Figure 30). Thereafter the grid can be removed.
Finishing TouchesThe prerequisite of a 3-D Model is that everyone should understand it.Therefore once the model is complete, you have to prepare a more
detailed legend, including information on scale, a North-labeled arrow andan acknowledgement plate (see Appendix 3). These can be printed incolor and laminated. These essential bits of key information are bestembedded into the model. (Figure 31)

Essentials of Protected Area Management in the Philippines18
Ahanding over ceremony follows which formally transfers ownershipof this asset to the community.
Unlike other spatial tools, a P3-D model never gets completed.Like a living organism it needs to be nurtured by regularly updatingand enriching its information.
The model has to be entrusted to an entity having the means andthe commitment to safeguard and maintain it, and to make it acces-sible to those who would like to use, update, integrate or correctpreviously input information. P3-D Models assure that accurate, to-all-meaningful information is kept among the people who generated it.
Representatives of all stakeholders should be present at the hand-ing-over ceremony.
In NIPAP’s case, models have been entrusted to Protected AreaManagement Boards and to People’s Organizations. In other cases inthe Philippines, custodians are organized groups of Indigenous Peoples.
For the purpose of monitoring visitors, the custodians of the modelshould keep a visitors’ book, where people would be asked to recordtheir personal particulars, purpose of visit and comments.
Information can now be extracted and transferred to a GeographicInformation System.
Pre-extraction StageSupplies listed in Appendix 3 include transparent plastic sheets which
are generally bought in rolls. These need to be cut at manageable size (say1-m x 0.8-m). Ahead of actual fieldwork, a matching grid to the one onthe base map needs to be drawn on each sheet using a permanent marker.
GIS technicians or cartographers who will be extracting the informa-tion should familiarize themselves with the background to the model asannotated in the process documentation. They should be fully familiarwith the model’s legend, its symbols and the definitions used.
Stakeholder representatives should participate in the extraction process.
Extraction StageExtraction can now start, provided the
reference grid has been placed on the model.Location of the grid has to be accurate to limitany errors that may be made in transferringinformation from one medium to another. Inthis process the regular referral to the basemap is helpful.
The plastic sheets are placed on top of themodel as shown in Figure 32.
Where islands are concerned, the coastlinecan be traced on the plastic sheets directly from the base map (Figure 33).This eases geo-referencing.
Three people at least are neededfor a period of 2-3 days to extractinformation from a 6-7 m2 model.
Extraction should be donesystematically.
Point, line and polygon are thethree features representing thedata. These should be separatelytransferred to the plastic sheets.
PHASE FOUR:HANDING OVEROF THE MODEL
PHASE FIVE:EXTRACTING
INFORMATION
Fig. 33 Tracing the coastline
Fig. 32 Matching grids

19Manual on Participatory 3-Dimensional Modeling
Accurate documentation is essential. Attributes (non-graphicinformation like names, descriptions of land use and cover, demo-graphic characteristics, etc.) are associated with the single feature.An ad-hoc legend is prepared for this.
Those involved in extraction should bear in mind thatthe data transferred to the plastic sheets have to bedigitized elsewhere. Therefore, information containedin the plastic sheets, accompanying annotationsand legend must be understandable to otherpeople as well.
Despite the simplicity of the technology involvedin transferring information from a 3-dimensional toa 2-dimensional medium, errors and distortions areinevitable. A major source of error originates from theperspective of the extractor when tracing information ontothe plastic sheets. In order to limit distortions, the extractorshould observe perpendicularly as shown in Figure 34.
The transparent plastic sheets and the accom-panying legend are then handed over to the
GIS for editing, digitization (Figure 35) and datastorage.
Information from official and other sources canbe integrated (administrative boundaries, etc.).
Attributes are ascribed to points, lines andpolygons. The entire output is subjected tocartographic processing wherein colors, symbolsand lines are chosen to represent the differentattributes of the model.
Customized thematic maps are produced at pre-determined scales(Appendices 5, 7, 9, 10, 11 and 12).
A legend is prepared and joined to other cartographic informationlike scale, title, source of information (including date), co-ordinates,directional arrow, and others (Appendix 4).
In the absence of a sufficiently diversified standardized codingsystem7 in the Philippines, the program developed its own.
The use of standardized coding in producing thematic maps isimportant for sharing information, comparing data sets from differentsources or data collected from the same source but at different dates,especially when 3-D models are used as a means for conductingParticipatory Monitoring and Evaluation (PM&E)
GIS translation of the Model data can be compared with otherexisting spatial information, like maps produced from satellite-
interpreted imagery.Inconsistencies between data sets need to be verified. This should be
done by reconvening around the P3-D Models with a sufficient numberof informants and through community-based on-field investigation.
Philippine experience has shown that peoples’ “pooled knowledge”,supplemented by conventional spatial information (contours) is notonly accurate but more detailed and more current than informationmaintained in official circles as discussed in Appendix 13.
Fig. 34 Looking straight
PHASE SIX:DIGITIZING ANDMANIPULATION
PHASE SEVEN:FIELDVERIFICATION
7 A few color codes on land use zoning have been put forwardby the Housing and Land Use Regulatory Board (HLURB, 1997).Additional symbols are in use at NAMRIA.
Fig. 35 Information is digitized
Essentials of Protected Area Management in the Philippines20
EXAMPLESFROM
THE FIELD
RELIEF MODELSIN PRACTICE
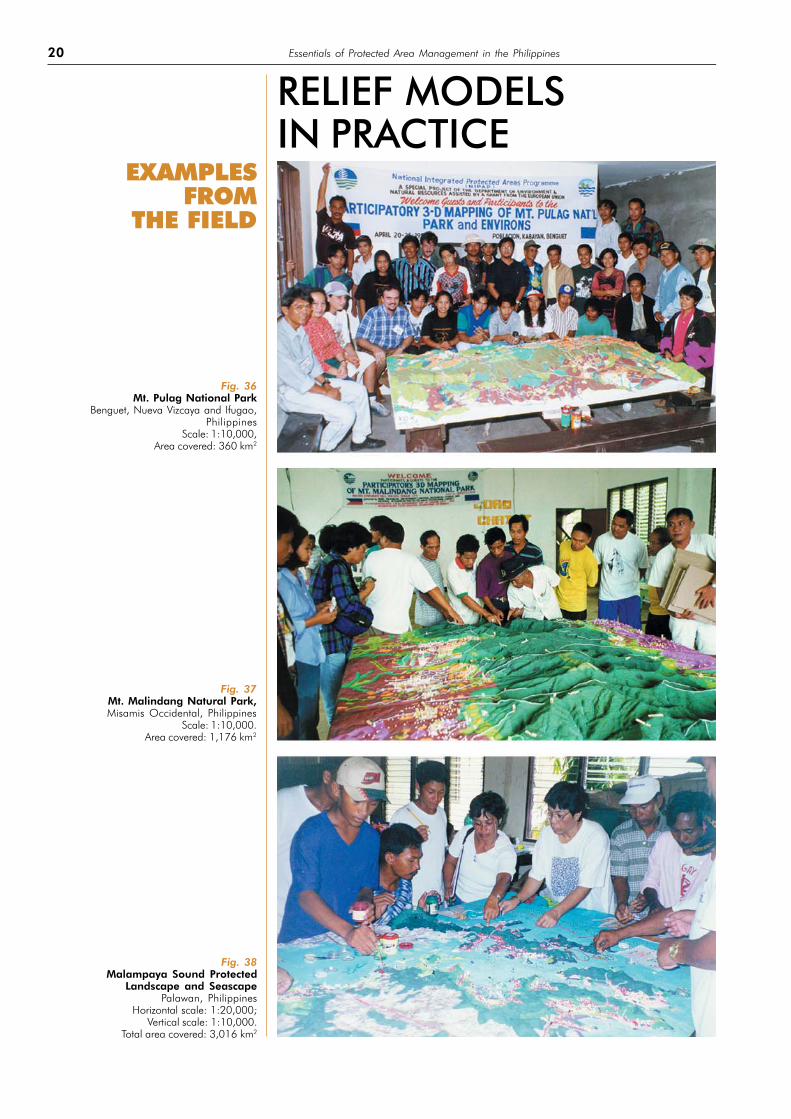
Fig. 36Mt. Pulag National Park
Benguet, Nueva Vizcaya and Ifugao,Philippines
Scale: 1:10,000,Area covered: 360 km2
Fig. 38Malampaya Sound Protected
Landscape and SeascapePalawan, Philippines
Horizontal scale: 1:20,000;Vertical scale: 1:10,000.
Total area covered: 3,016 km2
Fig. 37Mt. Malindang Natural Park,Misamis Occidental, Philippines
Scale: 1:10,000.Area covered: 1,176 km2

21Manual on Participatory 3-Dimensional Modeling
Fig. 39El Nido-Taytay Managed ResourceProtected AreaPalawan, PhilippinesScale: 1:20,000Area covered: 1,968 km2
Fig. 41Mt. Guiting-guiting Natural ParkRomblon, PhilippinesScale: 1:10,000.Area covered: 896 km2
Fig. 40Mt. Isarog Natural ParkCamarines Sur, PhilippinesScale: 1: 10,000Area covered: 480 km2
Essentials of Protected Area Management in the Philippines22
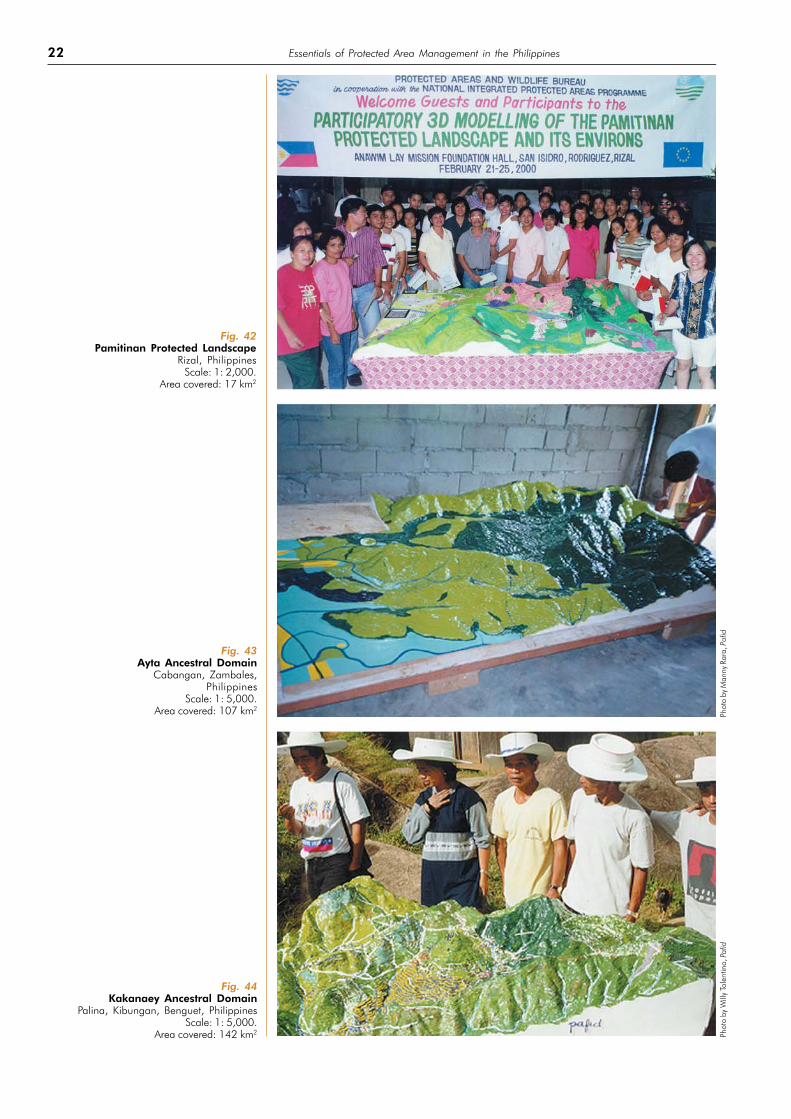
Fig. 42Pamitinan Protected Landscape
Rizal, PhilippinesScale: 1: 2,000.
Area covered: 17 km2
Fig. 43Ayta Ancestral Domain
Cabangan, Zambales,Philippines
Scale: 1: 5,000.Area covered: 107 km2
Fig. 44Kakanaey Ancestral Domain
Palina, Kibungan, Benguet, PhilippinesScale: 1: 5,000.
Area covered: 142 km2 Photo
by
Will
y To
lentin
o, Pafid
Photo
by
Manny
Rara
, Pafid

23Manual on Participatory 3-Dimensional Modeling
For Awareness Raising and EducationNIPAP experience has proved that collaboratively produced 3-D
models generate a tremendous, long-lasting enthusiasm not onlyamong participants in the process but generally among a largeproportion of local residents.
An enormous amount of information is collated, gets on permanentdisplay and is readily accessible to all stakeholders, local residents andoutsiders.
Relief models are useful for teaching local geography and to en-hance people’s interest in conserving and restoring natural resources.
For Community Cohesion and Self-actualizationMuch more so than sketch maps or GIS outputs, a well displayed 3-D
model is appealing, fuels community esteem and sense of intellectualownership, becoming part of the local cultural landscape.
For Collaborative PlanningRelief models are excellent visual aids capturing the ruggedness
and details of a territory. Users can see and feel the contours of everymountain range and river valley. Two-dimensional maps cannot matchtheir impact and appeal.
Compared to data appearing on a planimetric map, a relief modelfacilitates assimilation, interpretation and understanding. People get a“bird’s eye view” of their environment. This enhances analytical skills,broadens perspectives, especially on interlocked ecosystems, and helpsto deal with issues and conflicts associated with the territory andresource use.
A relief model highlights pressure points (household concentrations,converted forest, access ways, etc.) making them visible and tangibleto everyone.
When dealing with more remote and extensive areas, P3-D modelsremove logistical constraints to public participation in land and re-source use planning and management.
In the Philippines few protected area boundaries have yet beendemarcated. Relief models allow stakeholders to get a first time factualperception of their location. This facilitates a bottom-up approach toboundary delineation and zoning, activities otherwise characterized bya top-down process, heavy logistics and lengthy negotiations.
AMULTIPURPOSETOOL
“I was born here seventyyears ago, and this is thefirst time in my life thatI can see and understandMount Malindang”.
– Words from an elder attendingthe handing-over ceremony

As discussed on page 14, the use of a coding system based on a richassortment of different materials and colors allows a 3-D model tofunction like a rudimentary community-based GIS accommodatingoverlapping layers of information. This is extremely useful to establishingvisual relations between resources, tenure, their use and jurisdiction.
For Collaborative ResearchP3-D models facilitate selective pinpointing of resources, households
and other features.Because of their accuracy, P3-D Models can have positive and
negative effects.Alone or combined with GIS, they turn local knowledge into public
knowledge and conceivably out of local control. This can be used byoutsiders to locate resources and meet development needs, or merely,to extract more resources, or to increase control [from the outside].(J. Abbot et al. 1999).
Some groups have expressed concern that the mapping processenables outsiders to control information previously controlled bycommunities (Pole P. 1995),
Planners should be aware of these possible drawbacks and becareful in the application of the process. Plotting the habitats of endan-gered species, or the location of hardwoods, or other resources indemand on the black market, should be done with caution and behindclosed doors in the course of focus groups discussions. Sensitiveinformation should be removed thereafter.
For Increasing Local Communications CapacityBecause all stakeholders have played an active role in the realization of
a 3-D Model, communities and administrators both understand it easily.A relief model makes information tangible, eases communication,
helps bridge language barriers and increases the potential of all stake-holders to deal within their constituencies as well as with central govern-ment and outsider institutions. Models and maps can be used as part ofa larger communication strategy to foster legal and policy reform at thenational level. Consensus surrounding a map gives legitimacy in politicaldebates, in an open society. In the Philippines, maps and models producedfor establishing Ancestral Domain Claims built public support for thepassage of the Indigenous People’s Rights Act in 1997. (Alcorn J.B., 2000)
Essentials of Protected Area Management in the Philippines24

For Protected Area ManagementP3-D models serve the following purposes in protected area
management:● Involving communities in developing management, zoning and
resource use plans, geo-referencing their priorities, aspirations,concerns and needs.
● Monitoring the dynamics of settlements, infrastructures and accesspoints vis-à-vis a protected area.
● Substantiating public hearings and planning workshops.● Introducing visitors to the area.
For Self-determinationIn the Philippines, NGOs like PAFID (Philippine Association for
Inter-Cultural Development) led the way towards national recognitionof ancestral rights by combining the use of P3-D models, GlobalPositioning Systems (GPS) and GIS to provide the evidence requiredby law substantiating applications filed by Indigenous Peoples.(Figures 43 and 44)
For Participatory Monitoring and EvaluationA working P3-D model is never completed. Like in any dynamic
system, change is a constant.Although a relief model,
like GIS, can accommodateregular updating, it cannotmemorize past scenarios.This is where GIS “adds value”and becomes a vital ingredientfor monitoring change.
A P3-D model can be instru-mental to conducting Participa-tory Monitoring and Evaluation(PM&E) (Figure 45), providedthe data are updated at givenintervals, periodically extracted,digitized, plotted in GIS thematicmaps and finally returned to thecommunity for assessingchange, and identifying itscauses and effects.
For Conflict ResolutionConflict resolution involves area-based mechanisms to prevent,
mediate and resolve local conflicts and to strengthen communities indealing with their management. Disputes over boundary issues, re-source use and tenure are often contributory causes for century-longinter-tribal conflicts.
The strategies and processes leading to conflict resolution arecomplex and articulated and need the backing of appropriate institu-tional and legal mechanisms.
At grassroots level, participatory approaches and particularly3-D modeling can help in settling boundary disputes through thevisualization of the landscape associated land uses and settlementpattern. Initiatives making use of 3-D modeling for conflict resolutionare currently on-going in the Philippines under the auspices of theOffice of the Presidential Adviser on the Peace Process (OPAPP).
25Manual on Participatory 3-Dimensional Modeling
Fig. 45 The function of P3-DM in a participatory M&E context

Essentials of Protected Area Management in the Philippines26
Can P3DM be used for reproducing large areas(e.g. >100,000 km2)?
Key-informants’ knowledge can be successfully collated on reliefmodels made at 1:20,000 or better at larger scales. It follows that thegeographical coverage of a model is influenced by its final size. Reduc-ing the scale, to, say 1:50,000, in order to cover larger areas limitsaccuracy and the ability of informants to internalize the model and totranspose their knowledge. A solution is to produce a series of models -to be made and displayed at different locations - each one covering aportion of the desired area. Obviously this process would require moretime and added financial and human resources.
Do participants get paid?The essence of participatory approaches is the full participation of
people in the processes of learning about their needs and opportunities,and in the action required to address them. Informants and representa-tives from all stakeholder groups generally work in a voluntary capacity.Facilitators should support the costs of transport, lodging and catering.
How many participants (informants) are required for a 3-D model?The number of participants working at one time should allow everyone
to physically access the model. An overcrowded venue is cause ofdistraction and demotivation of participants. Splitting participants ingroups of 20-25 and making provisions for brief overlapping of groupsto allow cross-fertilization and crosschecking is the best way to go.
Who does the community mobilization?Community mobilizing is one of the most important components
of the process which leads to the construction of a 3-D model. Locallybased organizations (NGOs, LGUs, protected area offices, etc.) bestdo the job.
In the Philippines P3DM has been used in the contexts ofprotected area management and self-determination. Are thereany other situations where relief modeling has been adopted?
Community-based relief models have been used for watershedmanagement in Thailand and for negotiating access to resources inIndonesia. The technique is fast spreading. Updates are available onthe internet at http://www.iapad.org
To what extent is P3DM feasible in densely populated areas?Densely populated areas can be reproduced in 3-dimensional
format at a scale, which meets the purpose of the exercise. 1:10,000-scale or larger would suffice for generating household level information.Densely populated areas are generally located in alluvial planes.Small-interval contour lines should be used to depict as many landmarksas possible. Horizontal and vertical scales should differ to enhancethe perception of slope and evidence landmarks.
How long does it take to complete the process from commu-nity mobilization to the production of the model and deriveddigital information?
Depending on available information (including digital contours,socio-economic, land use, etc.) and community preparedness: threeto four months.
What skills are needed?Depending on the number of models concurrently constructed.
For one model there is the need of one coordinator/head facilitator,two facilitators and a GIS operator.
FREQUENTLYASKED
QUESTIONS(FAQ)

GLOSSARYAttribute A characteristic of a geographic feature described in numbers or text. (e.g. attributes
of a household, represented by a point might include number of household members,age groups and main source of livelihood).
Base map A map containing geographic features, used for locational reference. Also, the sourcemap of a P3-DM process.
Digitize To encode map features as x, y coordinates in digital form.
Feature classes When referring to map data, feature classes include areas and surfaces (polygons),lines and points. For example, polygons feature land use and vegetation types; linesroads and rivers; points households and social infrastructures.
Geo-reference The relationship between page coordinates on a planar map and known real-worldco-ordinates.
Grid A raster-based data structure composed of cells of equal size arranged in columns and rows.
Layer A logical set of thematic data described and stored in a map library. Layers organize amap library by subject matters (e.g. soils, roads, households, land use).
Modeling The act or art of making a model of something; rendering into solid form.
PLA Participatory Learning and Action (PLA) is an umbrella term for a wide range of similarapproaches and methodologies to involve communities in self-help and developmentprojects. The common theme to all these approaches is the full participation of peoplein the processes of learning about their needs and opportunities, and in the actionrequired to address them.
Topographic map A map containing contours indicating lines of equal surface elevation (relief) oftenreferred to as topo maps.
Zoning Dividing an area into zones having different objectives and uses.
REFERENCES_____ 1999. National Mapping Division, U.S. Geological Survey.
_____ 1995. Understanding GIS, the ARC/INFO Method. Self Study Workbook, Version 7 for Unix andOpen VMS, Environmental System Research Institute, Inc. NY.
Alcorn J.B., 2000. Borders, Rules and Governance: Mapping to Catalyze Changes in Policy andManagement. Gatekeeper series No. 91. IIED.
Abbot J., et al. 1999. Participatory GIS: opportunity or oxymoron? PLA Notes 33: 27-33, IIED, London, UK.
JAFTA/NAMRIA. 1994. Land Use and Forest Type Map and Forest Register, Philippines. Japan ForestTechnical Association (JAFTA), National Mapping and Resource Information Authority (NAMRIA),Remote Sensing and Resource Data Analysis Department (RSRDAD).
NIPAS Act, (Republic Act No. 7586) and Implementing Rules and Regulations, (DAO 25, S 1992).
Poiker T. and Sheppard E. 1995. GIS and Society. Cartography and Geographic Information Systems,special issue 22 (1).
Poole P.1995. Indigenous Peoples, Mapping and Biodiversity Conservation: An Analysis of CurrentActivities and Opportunities for Applying Geomatics Technologies. Biodiversity Support Program(BSP). Reference No.: 15. Corporate Press.
Rambaldi G., Fernan M.L. and Siar S. 1998. Resource Mapping in Participatory Methods in Community-based Coastal Resource Management, Vol. 2: 222-235. International Institute of RuralReconstruction, Silang, Cavite, Philippines.
Rambaldi G., Mendoza M. and Ramirez R. 2000. Adding the Fourth Dimension to Participatory 3-DModelling, PLA Note, 39: 19-24, IIED, London, UK.
27Manual on Participatory 3-Dimensional Modeling

Essentials of Protected Area Management in the Philippines28
APPENDICES
Appendix 1 Reading maps
A map is a representation of the Earth, or part of it. Traditionally, maps have been printed on paper.When a printed map is scanned, the computer file that is created may be called a digital raster graphic.
The distinctive characteristic of a topographic map is that the shape of the Earth’s surface is shown bycontour lines. Contours are lines drawn on a map to represent points of equal elevation on the surface ofthe land above or below a reference surface such as mean sea level. On conventional maps, they are usuallyprinted in brown, in two thicknesses. The thicker lines are called index contours, and they are usuallymarked with numbers, giving height in meters. The contour interval, a set difference in elevation betweenthe brown lines, varies from map to map; its value is given in the margin of each map. The closer the contourlines, the steeper the slope. Contours make it possible to measure the height of mountains, depths of theocean and steepness of slopes.
A topographic map shows not only contours, but other natural and man-made features, each repre-sented by colors and symbols.
Colors are applied according to standards, which differs from country to country. Some coding iscommon worldwide: forestlands, for instance, are shown in a green tint, waterways, in blue. A roadmay be printed in red or black solid or dashed lines, depending on its size and surface.
Symbols, include variously weighted line styles, fonts and icons to improve the appearance andreadability of a map.

29Manual on Participatory 3-Dimensional Modeling
Appendix 2 Supply list for the manufacture of the 1:10,000 scale model of Sibuyan Island,Romblon, Philippines. Area coverage 896 km2 (terrestial: 453 km2, marine: 443 km2)
QTY Unit of Article Specification Unit Cost Cost Unit Cost Costmeasure estimate estimate estimate estimate
(PHP) (PHP) (USD) (USD)
3 Roll Carton, corrugated (48"x300ftx4mm) STRONG 1,000.00 3,000.00 25.00 75.005 Bottles Office glue (white) 2 kg 249.50 1,247.50 6.24 31.198 Pc Scissors 195.50 1,564.00 4.89 39.102 Box Carbon paper (handwriting) blue diamond legal size 233.75 467.50 5.84 11.6940 Pc Crepe paper (white) 12.00 480.00 0.30 12.0010 Pc Cutter (small size) 16.50 165.00 0.41 4.1360 Pc Blades for above cutters 10.00 600.00 0.25 15.003 Unit Reinforced Plywood (1/4") 450.00 1,350.00 11.25 33.758 Pc Brush # 1 50.00 400.00 1.25 10.004 Pc Brush # 2 44.75 179.00 1.12 4.486 Pc Brush # 9 24.25 145.50 0.61 3.646 Pc Brush # 12 30.25 181.50 0.76 4.548 pc Bucket (1 litter) 65.00 520.00 1.63 13.002 1/2 kg jar Acrylic color White 88.00 176.00 2.20 4.403 1/2 kg jar Acrylic color Yellow 88.00 264.00 2.20 6.602 1/2 kg jar Acrylic color Blue 88.00 176.00 2.20 4.401 1/2 kg jar Acrylic color Black 88.00 88.00 2.20 2.201 1/2 kg jar Acrylic color Red 88.00 88.00 2.20 2.204 1/2 kg jar Acrylic color Apple green 88.00 352.00 2.20 8.804 1/2 kg jar Acrylic color Emerald green 88.00 352.00 2.20 8.804 1/2 kg jar Acrylic color Green 88.00 352.00 2.20 8.802 1/2 kg jar Acrylic color Brown 88.00 176.00 2.20 4.401 1/2 kg jar Acrylic color Violet 120.00 120.00 3.00 3.001 1/2 kg jar Acrylic color Orange 120.00 120.00 3.00 3.0030 Boxes Map pins (100 pc/ box) White 45.00 1,350.00 1.13 33.7510 Boxes Map pins (100 pc/ box) Yellow 45.00 450.00 1.13 11.2510 Boxes Map pins (100 pc/ box) Blue 45.00 450.00 1.13 11.2510 Boxes Map pins (100 pc/ box) Black 45.00 450.00 1.13 11.2510 Boxes Map pins (100 pc/ box) Red 45.00 450.00 1.13 11.2510 Boxes Map pins (100 pc/ box) Green 45.00 450.00 1.13 11.2510 Boxes Map pins (100 pc/ box) Violet 45.00 450.00 1.13 11.2510 Boxes Map pins (100 pc/ box) Orange 45.00 450.00 1.13 11.2510 Boxes Pushpin flat heads White 45.00 450.00 1.13 11.2510 Boxes Pushpin flat heads Yellow 45.00 450.00 1.13 11.2510 Boxes Pushpin flat heads Blue 45.00 450.00 1.13 11.2510 Boxes Pushpin flat heads Black 45.00 450.00 1.13 11.2510 Boxes Pushpin flat heads Red 45.00 450.00 1.13 11.2510 Boxes Pushpin flat heads Green 45.00 450.00 1.13 11.252 Pc Hand-knitting yarn no. 8 White 12.50 25.00 0.31 0.632 Pc Hand-knitting yarn no. 8 Yellow 12.50 25.00 0.31 0.632 Pc Hand-knitting yarn no. 8 Blue 12.50 25.00 0.31 0.632 Pc Hand-knitting yarn no. 8 Black 12.50 25.00 0.31 0.632 Pc Hand-knitting yarn no. 8 Red 12.50 25.00 0.31 0.632 Pc Hand-knitting yarn no. 8 A green 12.50 25.00 0.31 0.632 Pc Hand-knitting yarn no. 8 B green 12.50 25.00 0.31 0.632 Pc Hand-knitting yarn no. 8 C green 12.50 25.00 0.31 0.632 Pc Hand-knitting yarn no. 8 Brown 12.50 25.00 0.31 0.632 Pc Hand-knitting yarn no. 8 Violet 12.50 25.00 0.31 0.632 Pc Hand-knitting yarn no. 8 Orange 12.50 25.00 0.31 0.634 Rolls Film Kodak ASA 200 (362) 135.00 540.00 3.38 13.501 Pc Stapler 150.00 150.00 3.75 3.751 Box Staple wire #35 25.00 25.00 0.63 0.631 Pc Clipboard 29.00 29.00 0.73 0.738 Pc Masking tape (2") 30.00 120.00 0.75 3.002 Roll Cotton thread Yellow 20.00 40.00 0.50 1.001 Pc Color marker Black 27.00 27.00 0.68 0.6820 Pc Pencil Mongol # 2 3.50 70.00 0.09 1.751 Pc Pencil sharpener 20.00 20.00 0.50 0.5050 Mats Dressmaker pins 10.00 500.00 0.25 12.5080 Pc Name tag/plastic I.D. card 5.50 440.00 0.14 11.00100 Pc Attendance certificates 5.00 500.00 0.13 12.501 Pc Banner 800.00 800.00 20.00 20.002 No. Laminated plate 100.00 200.00 2.50 5.0050 Pc Nails (3") 1.00 50.00 0.03 1.25
TOTAL 23,670.00 591.75

Essentials of Protected Area Management in the Philippines30
Appendix 4 Legend and directional arrow (3-D model)
Appendix 3 Supply list for the extraction phase - 1:10,000 scale model of Sibuyan Island,Romblon, Philippines. Area coverage 896 km2 (terrestial 453 km2, marine: 443 km2)
QTY Unit of Article Specification Unit Cost Cost Unit Cost Costmeasure estimate estimate estimate estimate
(PHP) (PHP) (USD) (USD)Transparent plastic sheet
3 Pc Overhead projection markers Yellow 23.00 69.00 US$ 0.52 US$ 1.563 Pc Blue 23.00 69.00 US$ 0.52 US$ 1.563 Pc Black 23.00 69.00 US$ 0.52 US$ 1.563 Pc Red 23.00 69.00 US$ 0.52 US$ 1.563 Pc Green 23.00 69.00 US$ 0.52 US$ 1.563 Pc Orange 23.00 69.00 US$ 0.52 US$ 1.562 Pc Scaled ruler 380.00 760.00 US$ 8.50 US$ 17.002 Pc Measuring tape 20.00 40.00 US$ 0.48 US$ 0.962 Roll Cotton string Yellow 27.00 54.00 US$ 0.55 US$ 1.101 Pc Base map 265.00 265.00 US$ 5.96 US$ 5.963 Box Push pins (100 pcs. Box) any 35.00 105.00 US$ 0.84 US$ 2.523 Roll Masking tape (1.5") 18.00 54.00 US$ 0.45 US$ 1.351 Pack Cotton thread 32.00 32.00 US$ 0.82 US$ 0.821 Flask Alcohol 45.00 45.00 US$ 1.00 US$ 1.00
Essentials of Protected Area Management in the Philippines30
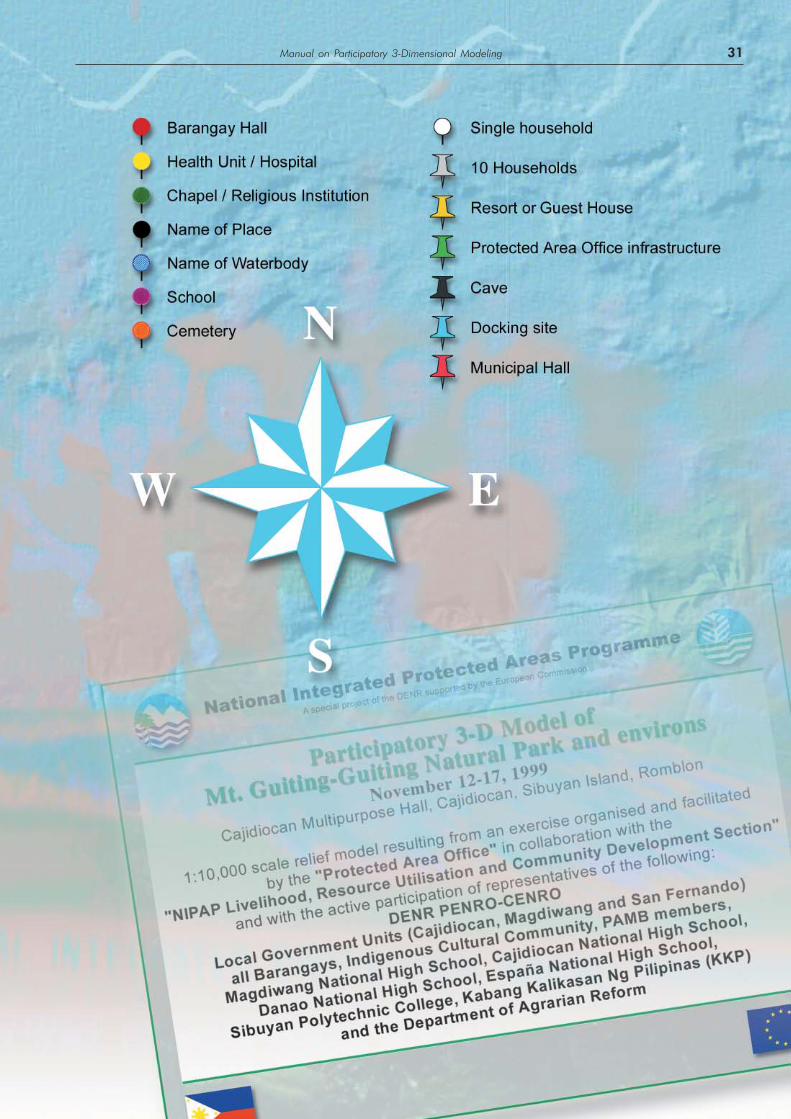
31Manual on Participatory 3-Dimensional Modeling 31Manual on Participatory 3-Dimensional Modeling

Essentials of Protected Area Management in the Philippines32
Appendix 5 Land Use and Cover. Mt. Pulag National Park and Environs.Provinces of Benguet, Ifugao and Nueva Vizcaya, Philippines.

33Manual on Participatory 3-Dimensional Modeling
Appendix 6 Land Use and Cover. Mt. Pulag National Park and Environs.Provinces of Benguet, Ifugao and Nueva Vizcaya, Philippines.

Essentials of Protected Area Management in the Philippines34
Appendix 7 Land Use and Cover. Mt. Malindang Natural Park and Environs. Provincesof Misamis Occidental, Zamboanga del Norte and Zamboanga del Sur, Philippines.
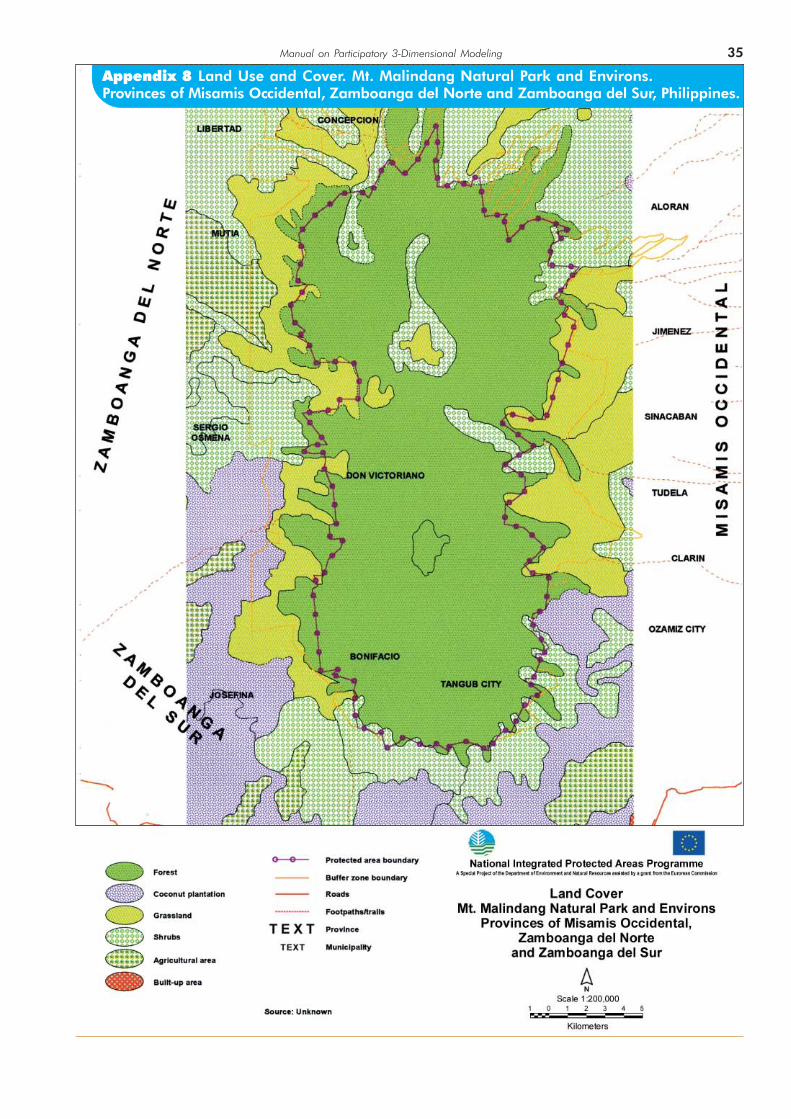
35Manual on Participatory 3-Dimensional Modeling
Appendix 8 Land Use and Cover. Mt. Malindang Natural Park and Environs.Provinces of Misamis Occidental, Zamboanga del Norte and Zamboanga del Sur, Philippines.

Essentials of Protected Area Management in the Philippines36
Appendix 9 Population Distribution Map. Mt. Pulag National Park andEnvirons. Provinces of Benguet, Ifugao and Nueva Vizcaya, Philippines.
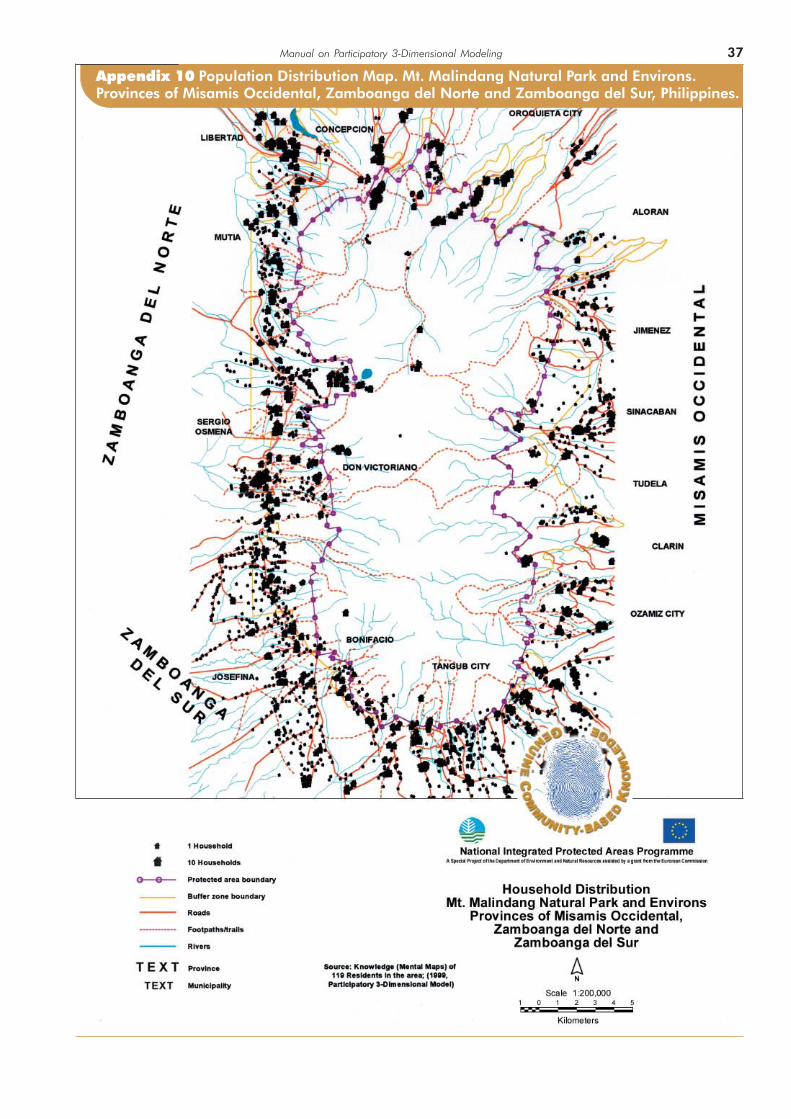
37Manual on Participatory 3-Dimensional Modeling
Appendix 10 Population Distribution Map. Mt. Malindang Natural Park and Environs.Provinces of Misamis Occidental, Zamboanga del Norte and Zamboanga del Sur, Philippines.
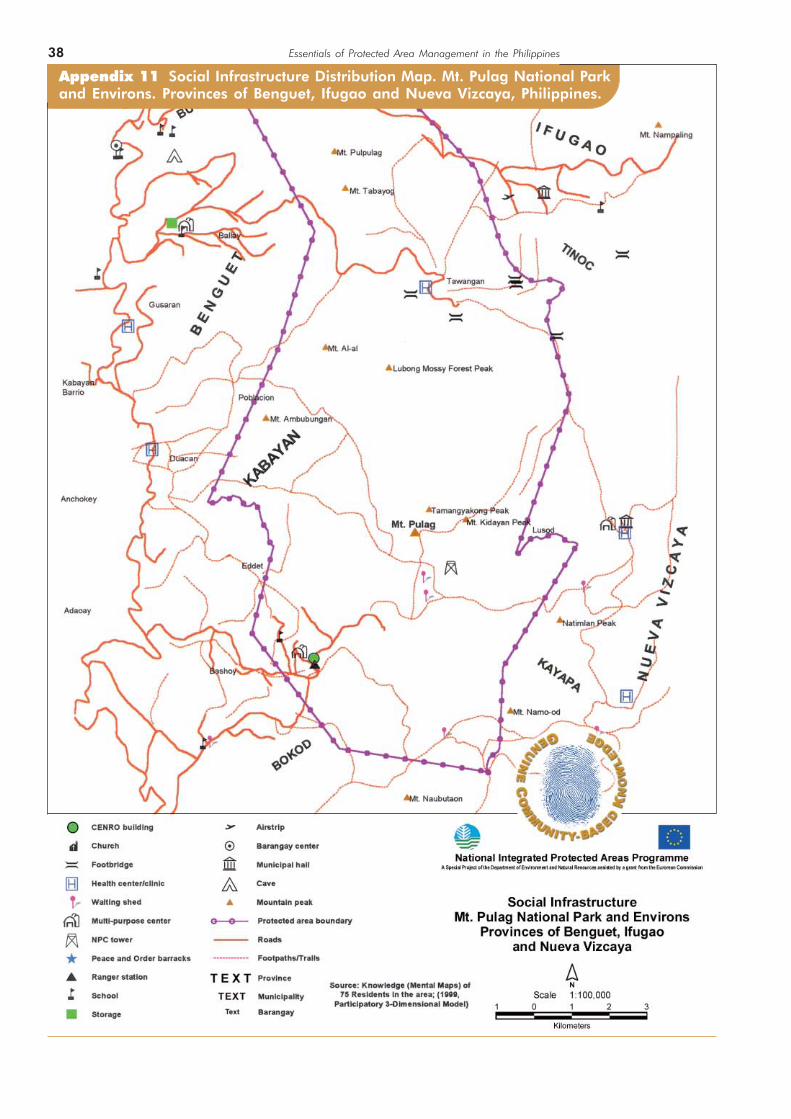
Essentials of Protected Area Management in the Philippines38
Appendix 11 Social Infrastructure Distribution Map. Mt. Pulag National Parkand Environs. Provinces of Benguet, Ifugao and Nueva Vizcaya, Philippines.

39Manual on Participatory 3-Dimensional Modeling
Appendix 12 Social Infrastructure Distribution Map. Mt. Malindang Natural Park and Environs.Provinces of Misamis Occidental, Zamboanga del Norte and Zamboanga del Sur, Philippines.

Essentials of Protected Area Management in the Philippines40
Appendix 13 Discussion of discrepancies encountered in comparing collective people’sknowledge with interpreted satellite imagery and other secondary information
Appendixes 5-12 show a series of maps of different origin. As part of the validation mechanism wecompared them using simple means accessible to field staff. The outcome is summarized in two case studies.
Case 1: Appendix 5, 9 and 11 reflect information extracted from the 1:10,000-scale 3-D model(Yr 1999) of Mt. Pulag National Park. The model (i.e. the map) covers a total area of 360 km2 or 36,000hectares. Appendix 6 is a land cover map of the same area based on 1992 interpreted satellite imagery.
Case 2: Appendix 7, 10 and 12 represent thematic maps produced on the basis of data containedin a 1:10,000-scale model (Yr 1999) covering an area of 1,176 km2 or 117,600 hectares, includingMt. Malindang Natural Park. Appendix 8 shows a corresponding map, which has been regularly used bythe Department of Environment and Natural Resources. The source of these data is unknown.
Case 1: Mt. Pulag National Park and EnvironsThe 3-D model contains 10 different categories of land cover compared to 9 of the satellite-interpreted
information set.Comparing these categories as a percentage of the total area (360 km2), yields a remarkable number
of differences. In terms of land use for agricultural purposes, the discrepancy is striking: The JAFTA/NAMRIA map portrays only 0.4% of the total area as farmland against the 27% provided by peoples’knowledge. This 27% is composed mainly of vegetable farms (67.4%) and rice paddies (32.4%). People’sknowledge is definitely closer to reality according to ground verification. The inconsistency cannot beexplained by changes in land use that occurred over a period of seven years (1992-1999), because theareas classified as “grassland” by JAFTA/NAMRIA on the western portion of the map are mainly terraceswhere rice and vegetables have been grown since time immemorial. The incorrect classification isprobably due to lack of ground truthing.
Where forest cover is concerned, JAFTA/NAMRIA (Appendix 6) shows a total forest cover (mossy, pine,old growth, residual forests) of 56%, compared to a lower percentage (40% including mossy and pineforests) portrayed by key informants (Appendix 5). Interestingly - in an area known for its pine forests - JAFTANAMRIA identifies only 3.1% of the area as covered with Benguet Pine, compared to 19.2% resulting fromthe 3-D model.
The people’s perspective has also been extremely useful in providing insights on economic trends. In factthe description of land use (Appendix 5) instead of land cover (Appendix 6) provides a scenario of increasingpressure put on the western side of the protected area, due to capital intensive irrigated farming (rice paddiesand vegetable gardens). On the eastern side, slash-and-burn subsistence farming (kaingin) appears to beprevailing, representing 11.7% of the whole area (see chart no. 2 “other”). According to people’s knowledgeaside from kaingin, “other” land uses (17.2%) include landslides (1.1%), orchards (0.3%) and reforestationareas (4.3%)
JAFTA/NAMRIA attributes 17.6% of the total area to “reproduction brush”, a land cover classificationcomparable to kaingin in terms of land use.

41Manual on Participatory 3-Dimensional Modeling
Comments to Case 1: People’s knowledge appears to be more accurate and useful for planning pur-poses, because it portrays land use rather than land cover. JAFTA/NAMRIA interpretation of satellite imagerydefinitely lacked ground truthing. Therefore large areas of farmland have been classified as grassland andexisting pine forest more generally as “old growth forest”.
Information extracted from the 3-D model includes household distribution, trails, social infrastructure(Appendices 5, 7 and 11) and names of landmarks (rivers and mountain peaks), either absent or inaccu-rately defined on the JAFTA/NAMRIA or on other “official maps”.
Pressure points (hot spots) are easily detected on Appendix 5, simply taking into account the protectedarea boundary, communication ways, land use and household distribution. The first hot spot is located in thesouthwestern and the second in the northeastern corners of the park.
Experience acquired in Mt. Pulag has shown that “pooled people’s knowledge” supplemented by conven-tional “spatial information” is more accurate and “useful for community-based analysis” than informationmaintained in official circles.
Case 2: Mt. Malindang Natural Park and EnvironsThe DENR map (Appendix 8) contains six categories of land cover, half of those (12) contained in the map
produced on the basis of the 3-D model (Appendix 7). Both maps reproduce a total area of 117,600 hect-ares. In terms of percentage distribution, there is little difference between “forest” cover: 32.5% on the DENRmap and 34.8% on the P3DM map. The latter is more specific in differentiating among Dipterocarp (25.7%),mossy (0.4%) and secondary forests (8.7%).
However, there are remarkable differences in the quantification of other land uses/cover: agriculturalareas cover 4.1% and 16.1% on the DENR and P3DM maps respectively. Areas described as coconutplantations amount to 14.5% (DENR map) and 39.8% (P3DM map).
According to the DENR map, shrubs cover 33.4% and grassland 15.5% of the area. These are the areasof dubious interpretation. Key informants described these as coconut plantations (shrubs on the DENR map)and rainfed crops (grassland and shrubs on the DENR map).
Again, the 3-D model has been useful in identifying possible hotspots.Appendices 10 and 7 describe the distribution of households. Appendix 7 combines different layers of informa-
tion and shows an on-going settlement trend (i.e. trail and households) in the northwestern portion of the protectedarea. This could lead, in the short term, to the “ecological” separation of approximately 20% of the territory fromthe main body of the protected area. This hot spot is by no means detectable from the map shown in Appendix 8.
The map shown in Appendix 12 shows the distribution of social infrastructures - differentiated by type -within the protected area and its buffer zones. This precious information - existing only on the P3DM map- is extremely important when analyzing socio-economic aspects of rural development and inherentlymanagement of the environment.
Comments to Case 2: As in the first case, “pooled people’s knowledge” provides a comprehensive pictureof both the land cover and use. The combination of these features with distribution of settlements, communi-cation ways and social infrastructure provides excellent insights useful for grassroots planning, awarenessraising and participatory monitoring purposes. Also in this case people’s knowledge appears to be moreuseful than what has been used as a reference within Government circles for a long period of time.