
MANUAL ON INVESTMENT FUND STATISTICS · PDF fileMANUAL ON INVESTMENT FUND STATISTICS may 2009...
37
MANUAL ON INVESTMENT FUND STATISTICS MAY 2009 BASED ON REGULATION ECB/2007/8 AND GUIDELINE ECB/2007/9
Transcript of MANUAL ON INVESTMENT FUND STATISTICS · PDF fileMANUAL ON INVESTMENT FUND STATISTICS may 2009...

MANUAL ON INVESTMENT FUND STAT I ST I C Smay 2009
BASED ON REGULATION
ECB/2007/8 AND
GUIDELINE ECB/2007/9

MANUAL ON INVESTMENT FUND STATISTICS BASED ON
REGULATION ECB/2007/8 AND GUIDELINE ECB/2007/9
MAY 2009In 2009 all ECB
publications feature a motif taken from the
€200 banknote.

© European Central Bank, 2009
Address Kaiserstrasse 29 60311 Frankfurt am Main Germany
Postal address Postfach 16 03 19 60066 Frankfurt am Main Germany
Telephone +49 69 1344 0
Website http://www.ecb.europa.eu
Fax +49 69 1344 6000
All rights reserved. Reproduction for educational and non-commercial purposes is permitted provided that the source is acknowledged.
ISBN 978-92-899-0449-0 (online)

3ECB
Manual on investment fund statistics
May 2009
1 AIM OF THIS MANUAL 4
2 DEFINITION OF INVESTMENT FUNDS 5
2.1 Collective investment
undertaking 5
3 CLASSIFICATION OF INVESTMENT
FUNDS BY THE NATURE OF THE
INVESTMENT 6
3.1 Investment funds, other than
hedge funds 6
3.2 Defi nition of hedge funds 8
3.2.1 Further clarifi cation of concepts 8
3.2.2 Other criteria not included
in the defi nition 10
3.2.3 Summary of hedge fund
characteristics 11
3.3 Funds of funds 11
3.4 Money market funds and
borderline cases 12
3.5 Changes in investment policy 12
4 CLASSIFICATION OF INVESTMENT
FUNDS BY TYPE OF FUND (OPEN-END
VERSUS CLOSED-END INVESTMENT FUNDS) 13
5 TREATMENT OF MASTER AND FEEDER
FUNDS 14
6 TREATMENT OF SHORT SELLING 16
6.1 Securities repurchase agreements
(repos) 16
6.2 Lending of securities 16
7 COMPILATION OF STATISTICS BASED
ON SECURITY-BY-SECURITY REPORTING 17
7.1 Compilation of stocks 17
7.2 Derivation of transactions/
revaluation adjustments 20
7.2.1 Securities other than shares 20
7.2.2 Shares and other equity 21
7.2.3 Investment Funds shares/
units issued 23
7.2.4 Estimations when there is
no price information in
the Centralised Securities
Database 23
8 CALCULATION OF ACCRUED INTEREST
ON DEBT SECURITIES 25
8.1 Derivation of accrued interest for
stocks 25
8.1.1 Theoretical background 25
8.1.2 Use of the Centralised
Securities Database 27
8.2 Derivation of accrued interest for
transactions 28
9 DERIVATION OF TRANSACTIONS FOR
ITEMS REPORTED ON AN AGGREGATED
BASIS 30
9.1 Overview 30
9.2 Deposits and loans 30
9.3 Financial derivatives 31
9.4 Non-fi nancial assets 31
9.5 Remaining assets/liabilities 31
10 DERIVATION OF MONTHLY DATA
(METHODS FOR ESTIMATION TECHNIQUES) 32
10.1 Temporal disaggregation
methods 32
10.2 Use of the Centralised
Securities Database or a local
securities database 33
11 DEROGATIONS REGARDING REPORTING
FREQUENCY 34
12 ANNUAL QUALITY REPORT REFERRED
TO IN ANNEX I OF THE REGULATION 35
CONTENTS

4ECB
Manual on investment fund statistics
May 200944
1 AIM OF THIS MANUAL
On 27 July 2007, the Governing Council of the
European Central Bank (ECB) adopted
Regulation ECB/2007/8 concerning statistics on
the assets and liabilities of investment funds
(hereinafter referred to as the “Regulation”).
The Regulation was published in the Offi cial
Journal of the European Union (OJ) on
11 August 2007 1 and entered into force on
31 August 2007. It defi nes the statistical
standards for collecting and compiling
investment fund (IF) statistics in the euro area.
The Regulation is binding on the euro area
Member States.
On 1 August 2007, the Governing Council of
the ECB adopted Guideline ECB/2007/9 on
monetary, fi nancial institutions and markets
statistics (hereinafter referred to as the
“Guideline”). The Guideline entered into force
on 3 September 2007. It was published in the
Offi cial Journal of the European Union on
27 December 2007.2 In Article 18, the Guideline
includes provisions regarding the reporting by
the national central banks (NCBs) of statistics
on the assets and liabilities of IFs.
This manual contains no additional requirements
and has no legally binding status. It aims to
further clarify and illustrate the requirements
laid down in the Regulation and in the
Guideline. A clear and consistent understanding
of the statistical requirements contained in the
Regulation and Guideline by the statisticians in
the NCBs of the European System of Central
Banks (ESCB) is essential for the production
of harmonised IF statistics. The information in
the manual may also be of interest for reporting
agents and users of these statistics.
This manual is composed of 12 chapters.
Chapter 2 provides further clarifi cations
regarding the defi nition of IFs. Chapters 3 and 4
provide guidance on how to classify IFs by the
nature of their investment and by type of fund.
Chapter 5 describes the treatment of master-
feeder fund structures. Chapter 6 describes the
treatment of short positions. Chapter 7 gives
guidance regarding the compilation of statistics
based on security-by-security reporting by IFs.
Chapter 8 describes the calculation of accrued
interest on debt securities. Chapter 9 includes
further guidance regarding the derivation of
transactions for assets and liabilities reported
by IFs on an aggregated basis. Chapter 10
describes possible methods to be used by NCBs
for the purpose of estimating monthly data.
Chapter 11 provides guidance regarding the
derivation of data in the case of IFs which have
been granted derogations. Chapter 12 provides
details regarding the annual quality report to
be provided by NCBs who choose to collect
only the number of units or aggregated nominal
amount in the security-by-security reporting.
OJ L 211, 11.8.2007, pp. 8 ff.1
OJ L 341, 27.12.2007, pp.1 ff..2

5ECB
Manual on investment fund statistics
May 2009 5
2 DEF IN IT ION OF INVESTMENT
FUNDS
5
2 DEFINITION OF INVESTMENT FUNDS
2.1 COLLECTIVE INVESTMENT UNDERTAKING
The Regulation defi nes an IF as “a collective
investment undertaking that invests in fi nancial
and non-fi nancial assets, within the meaning of
Annex II, to the extent that its objective is
investing capital raised from the public”. Money
market funds within the meaning of Annex I to
Regulation (EC) No 2423/2001 of the European
Central Bank of 22 November 2001 concerning
the consolidated balance sheet of the monetary
fi nancial institutions sector (ECB/2001/13) 3 are
not included in the defi nition of an IF.
In order to comply with the defi nition of an IF,
an investment undertaking must be “collective”.
An investment undertaking is considered
a collective investment undertaking if the
document which establishes the undertaking
allows for investments from more than one
investor. Therefore, even if an undertaking
de facto only has one investor, but legally
(ex ante) more than one investor is allowed, the
undertaking is to be considered collective.
The following examples are therefore considered
collective undertakings:
Funds in which there is a majority •
shareholder (for example, an insurance
company), as long as other investors are also
allowed in the fund (sometimes referred to
as insurance subsidiaries).
Subsidiaries of a parent IF whose only •
business is to act as “investment vehicles”
for their parent fund, i.e. to undertake
investments based on the investment
decisions of the parent fund, as long as the
document which establishes the subsidiary
does not impose any restrictions on the
number of the subsidiary’s shareholders/
investors.
The following example is therefore not
considered a collective undertaking:
Undertakings which are linked to insurance •
products whereby the insurance company
invests in the undertaking by buying shares/
units issued by this undertaking, but where
the insurance company is the only holder
of the shares/units of the undertaking and
the undertaking is not accessible to other
participants.
OJ L 333, 17.12.2001, pp.1 ff. The Regulation has meanwhile 3
been updated (see Regulation (EC) 25/2009; OJ L 15, 20.1.2009)
without changing the defi nition of money market funds.

66ECB
Manual on investment fund statistics
May 20096
3 CLASSIFICATION OF INVESTMENT FUNDS
BY THE NATURE OF THE INVESTMENT
In accordance with the Guideline, NCBs shall
report statistical information on IF assets and
liabilities broken down into the following six
sub-sectors: equity funds, bond funds, mixed
funds, real estate funds, hedge funds and
other funds. The Guideline further specifi es
that funds of funds shall be classifi ed under
the category of funds in which they primarily
invest. This chapter provides guidance on how
to classify IFs broken down by the nature of
their investment.
3.1 INVESTMENT FUNDS, OTHER THAN HEDGE
FUNDS
Given the diffi culties in adopting harmonised
defi nitions of IFs broken down by the nature of
their investment, the glossary of the Guideline
simply defi nes “bond funds” as IFs investing
primarily in securities other than shares, “equity
funds” as IFs investing primarily in shares and
other equity, “mixed funds” as IFs investing in
both equity and bonds with no prevalent policy
in favour of one or the other instrument, “real
estate funds” as IFs investing primarily in real
estate, and “other funds” as the residual category
(i.e. IFs other than bond funds, equity funds,
mixed funds, real estate funds or hedge funds).
The glossary further specifi es that the criteria for
classifying IFs by sub-sector are derived from
the public prospectus, fund rules, instruments of
incorporation, established statutes or by-laws,
subscription documents or investment contracts,
marketing documents, or any other statement
with similar effect.
The identifi cation of IFs by the nature of the
investment may differ across countries. In
certain countries, the investment policy may be
backed by specifi c regulatory provisions that
allow an ex ante identifi cation of IFs by the
nature of their investment. In these countries,
the classifi cation of IFs by the nature of the
investment should therefore be based on these
national provisions.4
In countries where national regulatory provisions
do not allow IFs to be identifi ed by the nature of
their investment, the classifi cation should also be
undertaken on an ex ante basis and be determined,
as specifi ed in the Guideline, on the basis of the
IFs’ prospectuses or other relevant documents.
The ex ante approach consists in assessing the
investment policy, on the basis of what has been
declared by the IF (or the fund manager) and not
on the actual investments made.
In the case of IFs which defi ne lower limits for
the investment in specifi ed asset classes, the
word “primarily” in the defi nition of equity,
bond and real estate funds should be understood
as “more than 50%”. In other words, if an IF is
defi ned, for example, as investing at least 50%
of its assets in equity, the IF should be classifi ed
as an equity fund.
In case the IF only defi nes lower limits and only
invests in two instruments (bond and equity), the
IF should be classifi ed as a mixed fund when the
lower limits for each of the two instruments lie
close to 50% (i.e. a fund is not required to have
a predefi ned investment mix of exactly 50/50).
In the case of IFs which defi ne only upper limits
for the investment in specifi ed asset classes,
“primarily” should be interpreted with some
fl exibility. In general the following guiding
principles apply:
(a) If an IF defi nes an upper limit for one type
of asset, which shows that the IF assigns
a prominent role to the specifi c asset
class (even though it may not at all times
invest more than 50% in it), the IF should
be classifi ed according to this asset class.
Therefore if, for example, an IF has defi ned
its investment strategy as investing up to
90% of the assets in equity, the IF should
be classifi ed as an equity fund.
The content of these provisions may, of course, differ across 4
countries. Therefore, it may occur that IFs in one country are
required to invest only 50% in a certain asset category in order to
be classifi ed in the respective IF sub-sector, while the threshold in
another country may be higher (for example 75% or even 90%).

77ECB
Manual on investment fund statistics
May 2009 7
3 CLASS IF ICAT ION OF INVESTMENT
FUNDS BY THE NATURE OF THE
INVESTMENT
(b) If an IF assigns upper limits of above 50%
for both “securities other than shares” and
“shares and other equity”, without stating
any explicit preference for either asset class
(see (d) below), the IF should be classifi ed
as a mixed fund. For example, if an IF has
defi ned its investment strategy as investing
up to 60% of the assets in equity and up to
80% of its assets in bonds, the IF should be
classifi ed as a mixed fund.
(c) If an IF defi nes upper limits from which
a lower limit of “more than 50%” for the
investment in a specifi c asset class can
be derived, the IF should be classifi ed
according to this asset class. For example,
if an IF has defi ned its investment strategy
as investing up to 10% in bonds, up to
20% in money market instruments and
up to 15% in non-fi nancial assets and not
investing in fi nancial derivatives, the IF
should be classifi ed as an equity fund since
it can be derived that the IF invests more
than 50% in equity.
(d) If an IF assigns upper limits of above 50%
for different asset classes, but specifi cally
states its primary objective under normal
market conditions, then the IF should
be classifi ed according to its primary
investment policy as declared for normal
market conditions. For example, if an IF
has defi ned its investment strategy as one
of investing up to 90% of the assets in
equity and up to 70% of its assets in bonds,
but it specifi cally states in its prospectus
that under normal market conditions its
primary objective is to constitute an equity-
oriented portfolio (i.e. investing primarily
in equity) then the IF should be classifi ed
as an equity fund.
The aforementioned rules aim at obtaining a
meaningful classifi cation, and thereby also
improving the harmonisation of the “mixed
funds” category.
Consideration has also been given to classifying
IFs ex post, based on the asset allocation observed
on a quarterly basis. In this case, an IF which
actually invests more than 50% in equity would
be classifi ed as an equity fund and would be
reclassifi ed into another IF sub-sector when the
proportion of equity investment falls below 50%.
However, the ex post approach has a number of
drawbacks: (i) the allocation of IFs to the different
sub-sectors depending on the asset allocation at a
specifi c point in time would not be representative
of the investor’s intentions (i.e. an investor
decides in what fund to invest and is therefore ex
ante aware of the IF’s potential investment
decisions), (ii) each time the IF were allocated to
a different IF sub-sector, the NCB would have to
report a reclassifi cation adjustment,5 which could
potentially lead to a high level of instability in the
stock data, and (iii) the NCBs would have to
check the asset allocations of the IFs on a regular
basis and reclassify them where necessary, which
would entail signifi cant costs for the compilers.
Based on these considerations, the ex ante approach should, in principle, be applied.
However, under certain specifi c circumstances,
NCBs may also opt for the ex post approach. This
includes, for example, the case where the ex post
approach is the only practical way to confi rm the
original classifi cation in borderline cases.
A pan-European classifi cation of IFs broken
down by investment policy is being developed
by the European Fund Categorisation Forum
(EFCF). As an alternative to the IF classifi cation
based on national regulatory provisions, and
in particular for those countries where these
provisions do not exist, future classifi cation
could potentially be based on the rules defi ned
by the EFCF. However, for the time being,
the developments in this area are being
monitored and consideration would only be
given to applying this approach once the EFCF
classifi cation had been broadly accepted by
the industry.
Only changes in the investment policy which represent actual 5
changes in comparison with the investment policy given in the
prospectus or related documents should be treated as fi nancial
transactions. In this context, also refer to Annex V, Part 2,
Section 1.1.6, of the Guideline.

88ECB
Manual on investment fund statistics
May 20098
3.2 DEFINITION OF HEDGE FUNDS
In accordance with the Guideline, NCBs
must report statistical information on assets
and liabilities relating to hedge funds as a
distinct sub-category of IFs. In the glossary of
the Guideline, a “hedge fund” is defi ned for
statistical purposes as follows: “any collective
investment undertaking, regardless of its legal
structure under national laws, which applies
relatively unconstrained investment strategies
to achieve positive absolute returns, and
whose managers, in addition to management
fees, are remunerated in relation to the fund’s
performance. For that purpose, hedge funds
have few restrictions on the types of fi nancial
instrument in which they may invest and may
therefore fl exibly employ a wide variety of
fi nancial techniques, involving leverage, short-
selling or any other techniques. This defi nition
also covers funds that invest, in full or in
part, in other hedge funds provided that they
otherwise meet the defi nition. These criteria to
identify hedge funds must be assessed against
the public prospectus as well as fund rules,
statutes or by-laws, subscription documents
or investment contracts, marketing documents
or any other statement with similar effect of
the fund.”
Since a generally accepted defi nition for hedge
funds does not exist, it has proved diffi cult to
determine the key characteristics to be included
in the defi nition of hedge funds for statistical
purposes. Moreover, given the rapidly evolving
business, some predominant criteria today may
not be as relevant in a few years’ time. The idea
was therefore to defi ne key characteristics which
allow the identifi cation of hedge funds and their
differentiation from other IFs, while at the same
time discussing hedge fund characteristics in
more detail in this accompanying manual. This
chapter therefore contains further clarifi cations
regarding the concepts used in the defi nition
and discusses further potential characteristics of
hedge funds which are not explicitly included in
the defi nition given in the Guideline.
3.2.1 FURTHER CLARIFICATION OF THE
CONCEPTS
Positive absolute return
A key characteristic of hedge funds is their
commitment to achieve positive absolute returns
for their investors under all market conditions.
This is in contrast to the practice of “IFs other
than hedge funds”, which generally aim at
tracking a specifi c market benchmark,6 and their
performance is then measured relative to this
benchmark. Therefore, hedge funds typically
indicate in their prospectus and in their
advertising documentation that their performance
is de-correlated from market trends. In order to
achieve positive absolute returns, hedge funds
pursue and have the fl exibility to apply a much
wider range of investment strategies than “IFs
other than hedge funds”.
Investment strategies
In order to achieve positive absolute returns,
hedge funds have few restrictions on the type
of instruments in which they can invest or
strategies they can employ.
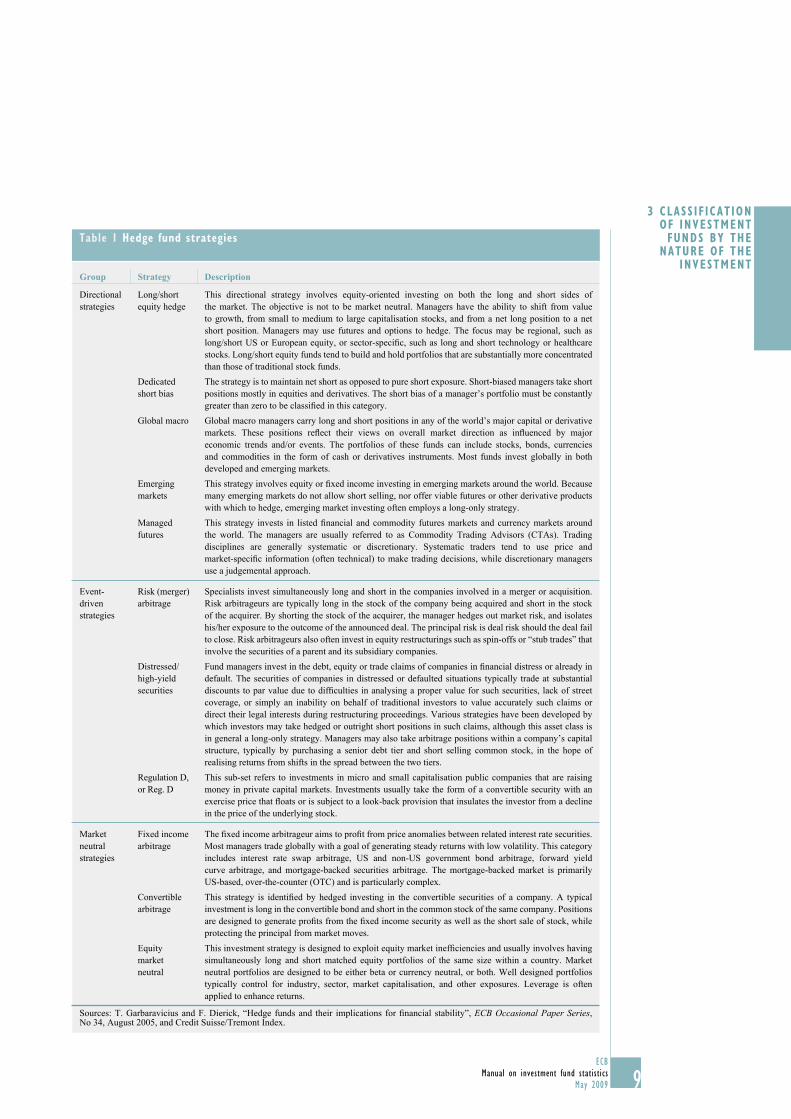
The investment styles of hedge funds vary
widely by taking different exposures, exploiting
different market opportunities, using different
techniques and different instruments. The
major strategies can be separated into three
general groups where each strategy consists of
different sub-categories. A detailed description
of the major sub-categories included in the
three general groups of strategies is provided
in Table 1. The three general groups of
strategies are:
Directional/market-trend strategies• consisting
of attempts to anticipate market movements
and taking positions based on market or
securities trends.
The goal of any IF (other than a hedge fund) is to beat the 6
index, even if only modestly. If, for example, an index is down
by 5%, while the IF is down only by 3%, the IF’s performance
is still good.
99ECB
Manual on investment fund statistics
May 2009 9
3 CLASS IF ICAT ION OF INVESTMENT
FUNDS BY THE NATURE OF THE
INVESTMENT
Table 1 Hedge fund strategies
Group Strategy Description
Directional
strategies
Long/short
equity hedge
This directional strategy involves equity-oriented investing on both the long and short sides of
the market. The objective is not to be market neutral. Managers have the ability to shift from value
to growth, from small to medium to large capitalisation stocks, and from a net long position to a net
short position. Managers may use futures and options to hedge. The focus may be regional, such as
long/short US or European equity, or sector-specifi c, such as long and short technology or healthcare
stocks. Long/short equity funds tend to build and hold portfolios that are substantially more concentrated
than those of traditional stock funds.
Dedicated
short bias
The strategy is to maintain net short as opposed to pure short exposure. Short-biased managers take short
positions mostly in equities and derivatives. The short bias of a manager’s portfolio must be constantly
greater than zero to be classifi ed in this category.
Global macro Global macro managers carry long and short positions in any of the world’s major capital or derivative
markets. These positions refl ect their views on overall market direction as infl uenced by major
economic trends and/or events. The portfolios of these funds can include stocks, bonds, currencies
and commodities in the form of cash or derivatives instruments. Most funds invest globally in both
developed and emerging markets.
Emerging
markets
This strategy involves equity or fi xed income investing in emerging markets around the world. Because
many emerging markets do not allow short selling, nor offer viable futures or other derivative products
with which to hedge, emerging market investing often employs a long-only strategy.
Managed
futures
This strategy invests in listed fi nancial and commodity futures markets and currency markets around
the world. The managers are usually referred to as Commodity Trading Advisors (CTAs). Trading
disciplines are generally systematic or discretionary. Systematic traders tend to use price and
market-specifi c information (often technical) to make trading decisions, while discretionary managers
use a judgemental approach.
Event-
driven
strategies
Risk (merger)
arbitrage
Specialists invest simultaneously long and short in the companies involved in a merger or acquisition.
Risk arbitrageurs are typically long in the stock of the company being acquired and short in the stock
of the acquirer. By shorting the stock of the acquirer, the manager hedges out market risk, and isolates
his/her exposure to the outcome of the announced deal. The principal risk is deal risk should the deal fail
to close. Risk arbitrageurs also often invest in equity restructurings such as spin-offs or “stub trades” that
involve the securities of a parent and its subsidiary companies.
Distressed/
high-yield
securities
Fund managers invest in the debt, equity or trade claims of companies in fi nancial distress or already in
default. The securities of companies in distressed or defaulted situations typically trade at substantial
discounts to par value due to diffi culties in analysing a proper value for such securities, lack of street
coverage, or simply an inability on behalf of traditional investors to value accurately such claims or
direct their legal interests during restructuring proceedings. Various strategies have been developed by
which investors may take hedged or outright short positions in such claims, although this asset class is
in general a long-only strategy. Managers may also take arbitrage positions within a company’s capital
structure, typically by purchasing a senior debt tier and short selling common stock, in the hope of
realising returns from shifts in the spread between the two tiers.
Regulation D,
or Reg. D
This sub-set refers to investments in micro and small capitalisation public companies that are raising
money in private capital markets. Investments usually take the form of a convertible security with an
exercise price that fl oats or is subject to a look-back provision that insulates the investor from a decline
in the price of the underlying stock.
Market
neutral
strategies
Fixed income
arbitrage
The fi xed income arbitrageur aims to profi t from price anomalies between related interest rate securities.
Most managers trade globally with a goal of generating steady returns with low volatility. This category
includes interest rate swap arbitrage, US and non-US government bond arbitrage, forward yield
curve arbitrage, and mortgage-backed securities arbitrage. The mortgage-backed market is primarily
US-based, over-the-counter (OTC) and is particularly complex.
Convertible
arbitrage
This strategy is identifi ed by hedged investing in the convertible securities of a company. A typical
investment is long in the convertible bond and short in the common stock of the same company. Positions
are designed to generate profi ts from the fi xed income security as well as the short sale of stock, while
protecting the principal from market moves.
Equity
market
neutral
This investment strategy is designed to exploit equity market ineffi ciencies and usually involves having
simultaneously long and short matched equity portfolios of the same size within a country. Market
neutral portfolios are designed to be either beta or currency neutral, or both. Well designed portfolios
typically control for industry, sector, market capitalisation, and other exposures. Leverage is often
applied to enhance returns.
Sources: T. Garbaravicius and F. Dierick, “Hedge funds and their implications for fi nancial stability”, ECB Occasional Paper Series, No 34, August 2005, and Credit Suisse/Tremont Index.

1010ECB
Manual on investment fund statistics
May 200910
Event-driven strategies• aimed at generating
profi ts from price movements associated
with specifi c corporate events, such as
restructuring, takeovers, mergers, liquidations
or bankruptcies.
Market-neutral/arbitrage/relative-value •
strategies that attempt to extract value from
arbitrage opportunities targeted at exploiting
market anomalies and ineffi ciencies. They
try to avoid exposure to market-wide
movements.
Two further umbrella approaches, which are
based on a mix of the categories above, are often
quoted as investment strategies:
Multi-strategy• : these funds allocate capital
dynamically according to different strategies,
in response to market opportunities.
Funds of hedge funds• : these funds invest
in other hedge funds for diversifi cation
(see below).
Furthermore, in the case of hedge funds, if risk dispersion rules (i.e. the maximum share of
investment allowed in a specifi c asset category)
are applicable, they tend to be more fl exible
than those applied in the case of “IFs other than
hedge funds”.
Performance-related fees
Hedge fund managers usually receive
performance-related fees, in addition to
traditional management fees. Some hedge funds
specify a “hurdle rate”, which means that the
fund manager will not receive a performance
fee until a minimum return has been generated.
Furthermore, fee structures often contain “high
watermark” provisions that require managers
to make up for losses before receiving further
performance-related fees.
Funds investing in other hedge funds
The defi nition of hedge funds also covers funds
that invest, in full or in part, in other hedge funds,
so-called “funds of hedge funds”, provided that
they otherwise meet the defi nition.
Funds of hedge funds can be defi ned as IFs that
invest primarily in hedge funds. In line with the
defi nition of funds of funds in Section 3.3, the
word “primarily” should be understood as “more
than 50%”. In other words, if an IF is defi ned as
one investing at least 50% of its assets in hedge
fund shares, the IF should be classifi ed as a
hedge fund.
Funds of hedge funds should also cover IFs that
track indices of hedge funds, thereby providing
investors with exposure to multiple hedge funds
in a single product. Although such IFs could be
considered to be tracking a market benchmark,
they should nevertheless be classifi ed as
hedge funds since they fulfi l the hedge fund
criteria, such as fl exible investment policies,
the commitment to achieve positive absolute
returns, the minimum investment threshold and
the frequent commitment by managers of their
own money.
3.2.2 OTHER CRITERIA NOT INCLUDED IN THE
DEFINITION
Investors in hedge funds and the distribution
channels
Hedge funds are targeted mainly (but not
exclusively) at high net worth individuals and
institutional investors, such as pension funds
and insurance companies. This targeting strategy
is often achieved by imposing a high minimum investment threshold. Furthermore, hedge funds
are often distributed via private placements and
thus not promoted to retail investors.
However, hedge funds have also become more
accessible to retail investors, mainly through the
development of funds of hedge funds.
Subscription/withdrawal
Hedge funds often have predefi ned schedules
with quarterly or monthly subscriptions and
redemptions. Furthermore, many hedge funds
have a lock-in period, which is an initial period
of time during which investors cannot remove
their money. Some hedge funds retain the right
to suspend redemptions under exceptional
circumstances.

1111ECB
Manual on investment fund statistics
May 2009
3 CLASS IF ICAT ION OF INVESTMENT
FUNDS BY THE NATURE OF THE
INVESTMENT
11
Hedge fund managers
Hedge funds managers will often have their
own capital invested in the hedge fund that they
manage, so that the preservation of capital is
very important.
3.2.3 SUMMARY OF HEDGE FUND
CHARACTERISTICS
Table 2 provides a summary of the main
characteristics of hedge funds, both those
explicitly included in the defi nition of hedge
funds given in the Guideline, as well as
additional possible characteristics not specifi ed
in the defi nition.
3.3 FUNDS OF FUNDS
The glossary of the Guideline defi nes “funds of
funds” as “investment funds investing primarily
in investment funds’ shares or units”. According
to the Guideline, “for the purpose of IFs broken
down by the nature of the investment, funds of
funds shall be classifi ed under the category of
funds in which they primarily invest.”
When classifying funds of funds, the same
logic applies as in the case of the IFs broken
down by the nature of the investment discussed
in Section 3.1. For example, in the case of an
IF that defi nes a lower limit for its investment
policy, an IF which invests at least 50% of its
assets in equity fund shares should be classifi ed
as an equity fund. Similarly, the same guiding
principles as described in Section 3.1 also apply
to funds of funds which defi ne only upper limits for the investment in specifi ed types of
investment funds.
Regarding the ex post approach, the same
drawbacks as outlined in Section 3.1 above
apply. In such an ex post approach, in the context
of funds of funds, the classifi cation should be
based on the actual assets held by the IFs in
which the funds of funds invest. These assets
would have to be monitored at any relevant point
in time. Further to the drawbacks outlined in
Section 3.1, it would be even more burdensome
for the compilers who would have to aggregate
portfolios of several IFs to determine the correct
IF sub-category. Therefore, as already stated
in Section 3.1, the ex ante approach should, in principle, be applied. However, as outlined on
page 7, under certain specifi c circumstances,
NCBs may also opt for the ex post approach.
Table 2 Hedge fund category characteristics – distinctive features
Characteristics covered by defi nition
Positive absolute return Positive absolute return under all market conditions, without regard to a
particular benchmark.
Relatively unconstrained investment strategies Few restrictions on the type of instruments or investment strategies. May employ
a wide variety of investment techniques, including leverage, derivatives, long
and short positions in securities or any other assets in a wide range of markets.
More fl exible risk dispersion rules.
Performance fees In general, managers receive performance-related fees in addition to traditional
management fees.
Additional characteristics not specifi ed in defi nition
Investors and distribution channels Traditionally (although not exclusively) targeted at high net worth individuals
and institutional investors. This is often achieved by imposing a high minimum
investment threshold. Not widely available to the public. Mainly distributed via
private placements.
Subscription/withdrawal Often predefi ned schedule with quarterly or monthly subscription and
redemption and lock-in periods until fi rst redemption.
Managers Usually managers also commit their own money.
See also T. Garbaravicius and. F. Dierick, “Hedge funds and their implications for fi nancial stability”, ECB Occasional Paper Series, No 34. August 2005.

1212ECB
Manual on investment fund statistics
May 200912
3.4 MONEY MARKET FUNDS AND BORDERLINE
CASES
Regulation ECB/2001/13 defi nes “money
market funds” as “those [collective investment
undertakings] of which the units are, in terms
of liquidity, close substitutes for deposits
and which primarily invest in money market
instruments and/or in [money market fund]
shares/units and/or in other transferable debt
instruments with a residual maturity of up to and
including one year, and/or in bank deposits, and/
or which pursue a rate of return that approaches
the interest rates of money market instruments”.
Regulation ECB/2001/13 further specifi es that
“primarily shall be deemed to be at least 85% of
the investment portfolio”.
Since the defi nition of money market funds
(MMFs) also covers the investment in MMF
shares/units, funds of MMFs are covered by
this defi nition, to the extent that they meet the
specifi ed criteria.
Classifi cation issues may arise when an IF
invests, for example, 80% in money market
instruments and, given its other investments,
does not comply with the MMF defi nition. In
this case, the IF must be classifi ed according
to the IF classifi cation. In this context, the
investment in money market instruments should
be considered equivalent to an investment in
fi xed income securities. Thus, if an IF invests
“more than 50%, but less than 85%” in money
market instruments and does not meet the MMF
defi nition, that IF should be classifi ed as a bond
fund. Similarly, an IF investing for example
40% in shares, 30% in bonds and 30% in money
market instruments should also be classifi ed as
a bond fund.
Classifi cation issues may also arise when an IF
invests for example 80% in deposits and, given
its other investments, does not comply with the
MMF defi nition. In this case, deposits should be
viewed as a separate asset class. Thus, if an IF
invests “more than 50%, but less than 85%,” in
deposits and does not meet the MMF defi nition,
the IF should be classifi ed as an “other fund”.
An IF investing for example 40% in shares,
30% in bonds and 30% in deposits would be
classifi ed as a mixed fund.
For simplicity, guiding principles similar to
those given for money market instruments apply
to investment in MMF shares/units. Similarly
in this case, investment in MMF shares/units
should be considered equivalent to an investment
in debt securities. Thus, if an IF invests, for
example, 80% in MMF shares/units and, given
its other investments, does not comply with the
MMF defi nition, this IF should be classifi ed as
a bond fund. In theory of course, in order to
be consistent with the approaches followed in
the paragraphs above, the ultimate investments
underlying the issue of MMF shares/units
should be considered when allocating the IF to
one of the IF sub-categories.
3.5 CHANGES IN INVESTMENT POLICY
In this context, Annex V, Part 2, Sub-section
1.1.6 of the Guideline discusses the treatment
of changes in the investment policy of an IF,
including MMFs. According to the Guideline,
the default is that a change in an IF’s or MMF’s
investment policy is recorded as a fi nancial
transaction. This follows from the fact that any
change in investment policy has to be agreed by
the investors prior to the change, so that it is seen
as an active investment decision. An NCB may
deviate from this default approach and report a
reclassifi cation adjustment only if it has ex ante
information that the policy change was not due
to a conscious decision made by the investors.
In case an NCB discovers that it has misclassifi ed
an IF which should actually be classifi ed as an
MMF (or vice versa), it should inform the ECB
and agree on a follow-up in order to assure a
consistent reporting of MMF and IF data, also
regarding historical data.

1313ECB
Manual on investment fund statistics
May 2009 13
4 CLASS IF ICAT ION OF INVESTMENT FUNDS BY TYPE
OF FUND
4 CLASSIFICATION OF INVESTMENT FUNDS
BY TYPE OF FUND (OPEN-END VERSUS
CLOSED-END INVESTMENT FUNDS)
In accordance with the Guideline, NCBs shall
report statistical information on IF assets and
liabilities broken down into open-end funds and
closed-end funds, i.e. by type of IF. This chapter
provides guidance on how to classify IFs broken
down by type.
The glossary of the Guideline defi nes open-end
IFs as “IFs the units or shares of which are, at the
request of the holders, repurchased or redeemed
directly or indirectly out of the undertaking’s
assets”, and closed-end IFs as “IFs with a fi xed
number of issued shares whose shareholders
have to buy or sell existing shares to enter or
leave the fund.”
In some cases, IFs fall somewhere inbetween
the closed-end and open-end defi nition, since
they have certain restrictions regarding the
issue or redemption of their shares/units.
This includes, for example, IFs that only allow
investors to buy new shares or redeem shares
above a certain minimum amount, which may
be very high. In some cases, participations in
the IF can only be redeemed or issued at pre-
determined points in time (e.g. on a monthly or
quarterly basis), or the redemptions and issues
may be temporarily suspended due to prevailing
market conditions.
In these cases, the IFs should still be recorded as
open-end IFs, since the possibility exists, albeit
with some restrictions, to buy and/or sell the
shares/units directly from/to the IF.
In principle, only IFs that do not issue new shares
after the IF is launched and whose shares are
not redeemable until the IF liquidates should be
recorded as closed-end IFs. However, in the case
of closed-end IFs, new shares may also be issued
and/or redeemed in exceptional occasions.

1414ECB
Manual on investment fund statistics
May 200914
5 TREATMENT OF MASTER AND FEEDER FUNDS
The master-feeder fund structure generally
involves the use of a master fund into which
separate and distinct feeder funds invest. Chart 1
shows an example of a master-feeder fund
structure:
In this structure, an investment management
company may have multiple feeder funds, each
tailored for a certain category of investors (for
example, retail investors or institutional investors).
The feeder funds do not invest the capital
themselves, but instead buy shares/units from a
master fund which invests the capital raised. This
structure may be a purely internal structure within
the investment management company in order
to make use of economies of scale and thereby
reduce costs. In this case, the feeder funds only
invest in master funds of their own investment
management company, and these master funds
only receive money from the feeder funds of their
own investment management company.
Feeder and master funds, even though
encapsulated within one structure, are
considered separate legal entities and both
comply with the defi nition of IF provided for
by the Regulation. Each feeder fund and master
fund should therefore be reported separately
to the list of investment funds. In accordance
with Article 5.1 of the Regulation, the assets
and liabilities of these funds should also be
reported on a fund-by-fund basis, i.e. all master
and feeder funds should report their assets and
liabilities individually.
The reporting of assets and liabilities by both
the master and feeder funds leads to a double
counting in the aggregated assets and liabilities
of the IF statistics, which could be seen as
undesirable since the double fi gures may have a
purely administrative background. However, the
derivation of consolidated assets and liabilities
of IFs at the euro area level will account for this
double-counting by netting the inter-IF holdings
of shares/units issued by euro area IFs.
Chart 1 Example of master-feeder fund structure
Buys sharesBuys shares
Master fund
Institutional investors
Investment
Feeder fund BFeeder fund ARetail investors
Investment management company
Source: ECB.

1515ECB
Manual on investment fund statistics
May 2009
5 TREATMENT OF MASTER AND
FEEDER FUNDS
15
Taking into account Article 5.3, which specifi es
that “subject to the prior approval and in
accordance with the instructions of the relevant
NCB, IFs may report their assets and liabilities
as a group, provided that this leads to results
that are similar to fund-by-fund reporting”,
and the fact that the ECB will ultimately derive
consolidated assets and liabilities of euro area
IFs, group reporting could be applied in the case
of master-feeder fund structures. Therefore,
if the reporting by master and feeder funds on
a consolidated basis is preferable in practice,
this approach may be followed by NCBs as
long as all feeder funds and master funds of
one structure are located in the same national
territory and belong to the same IF sub-sector in
line with Article 18.1(a) of the Guideline. In this
case, the consolidated balance sheet will show
on its assets side the investments made by the
master fund, and on its liabilities side the shares/
units issued by the feeder funds broken down by
different holders.
However, irrespective of whether or not group
reporting is applied, each feeder and master fund
must be reported separately in the list of IFs.

1616ECB
Manual on investment fund statistics
May 20091616
6 TREATMENT OF SHORT SELLING
Short positions occur when an institutional unit
sells securities of which it is not the economic
owner. The party with the short position records
a negative asset. Therefore, if an IF short sells
securities, this should be recorded as a negative
transaction in securities. This applies in the case
of selling securities which were acquired by
means of both reverse repo-type operations and
securities borrowing.
This treatment overcomes the double-counting
that would otherwise arise in the global
holdings of a security, given that the security is
recorded as an asset both on the balance sheet
of the ultimate outright purchaser of the security
and on the balance sheet of the original lender
(“security provider”) of the security.
6.1 SECURITIES REPURCHASE AGREEMENTS
(REPOS)
Repos are securities repurchase agreements
where an institutional unit sells securities
for cash (“security provider”) at a specifi ed
price to another unit (“security taker”) with a
commitment to repurchase the same or similar
securities at a fi xed price on a future date. It
is called a repo from the perspective of the
security provider and a reverse repo from the
perspective of the security taker.
In principle, the security taker should not record
the acquisition of the security under a reverse
repo as a transaction in securities. However,
if the security taker sells on the security
(i.e. short sells the security) to a third party,
then the security taker/temporary acquirer
should record a negative transaction (and the
outright purchaser a positive transaction) in
the security.
As specifi ed in Annex II, Part 1, paragraph 7,
of the Regulation, in the case of repos, “where
the temporary acquirer sells the securities/gold
received by way of a repo operation, this sale
must be recorded as an outright transaction in
securities/gold and entered in the balance sheet
of the temporary acquirer as a negative position
in the securities/gold portfolio.”
It follows, that in the case of reverse repos, when
the IF is the temporary acquirer of a security and
sells on the security, this sale should be recorded
as a negative (“short”) position in securities.
The interest accrued should also be recorded
as a negative position (i.e. the interest accrued
increases the negative position).
6.2 LENDING OF SECURITIES
Securities lending/borrowing without cash
collateral involves one party lending securities
to another party with a fi rm commitment
to returning the same (or similar) securities
on a specifi ed future date. Contrary to
repo-type operations, there is no exchange
of cash collateral; instead, securities lending/
borrowing is either backed by non-cash
collateral or there is no collateral at all.
As set out in the Regulation, securities lending
operations are recorded in the same way as
repo-type operations. Annex II, Part 1,
paragraph 2, of the Regulation specifi es that “in
order to maintain consistency with the treatment
of repo-type operations, securities lent out
under securities lending operations remain on
the original owner’s balance sheet (and are not
transferred to the balance sheet of the temporary
acquirer) where there is a fi rm commitment to
reverse the operation and not simply an option
to do so”.
It follows that short sales of securities borrowed
without cash collateral should also be recorded
in a way consistent with that required for short
sales of securities received in a reverse repo,
namely as negative transactions in securities.
Again the interest accrued should be also
recorded as a negative position.

17ECB
Manual on investment fund statistics
May 2009 17
7 COMPILAT ION OF STAT IST ICS
BASED ON SECURITY-BY-
SECURITY REPORTING
17
7 COMPILATION OF STATISTICS BASED ON
SECURITY-BY-SECURITY REPORTING
The Regulation foresees the so-called
“combined approach” as its main reporting
approach. This approach, described in Annex I,
Part 1.2(a), of the Regulation, consists of
reporting agents providing the IFs’ debt and
equity positions on a security-by-security basis,
and other assets and liabilities positions on an
aggregated basis.
The information to be provided on a security-
by-security basis is defi ned in Table 2 of Annex I
to the Regulation. In general, reporting agents
are required to report for each such position two
of the following three variables:7 (1) number of
units (equity) or aggregated nominal amount
(debt); (2) security price; and/or (3) total
amount.8 NCBs may also choose to collect
transactions on a security-by-security basis in
line with Table 2(c) in Annex I to the
Regulation.
Based on the information collected on a security-
by-security basis and on an aggregated basis,
NCBs then derive the aggregated quarterly
assets and liabilities of the IF sub-categories in
line with Table 1 of Part 14 of Annex III to the
Guideline.
This chapter describes, in conceptual terms,
how the statistics on the assets and liabilities
of IFs based on the security-by-security data
collected from the IFs can be derived. This
description covers both the derivation of stocks
(including estimation procedures where the
necessary information is only partly, or not
at all, available from the ESCB’s Centralised
Securities Database (CSDB) or compatible
national securities database) and the derivation
of transactions/revaluation adjustments from
these stocks in case security-by-security
information on transactions is not collected
directly from reporting agents.
The solutions presented in this manual should
be seen as one possible approach. NCBs may
choose to apply different methods.
7.1 COMPILATION OF STOCKS
Article 18.5 of the Guideline describes in
general terms how the aggregated quarterly 9
assets and liabilities of the IF sub-categories
(in line with Table 1 of Part 14 of Annex III)
are derived.
The compilation of stock statistics can be split
into two steps: (1) the calculation of the totals
for each asset/liability category and also for total
assets/total liabilities; and (2) the enrichment of
the securities information with reference data
covering the issuer sector, issuer residency and
issuing currency, as well as the instrument/
maturity classifi cation as provided by a reference
database, e.g. the CSDB.
The value of each asset and liability position,
as shown in Chart 2, can either be derived
based on the reported security-by-security
information or is directly provided by the
reporting agents.
For those aggregated positions where values or
prices are reported in currencies other than the
euro, the fi rst step includes a currency
conversion into euro. For the securities items,
the missing third value out of “number of units
or aggregated nominal amount”, “price” and
“total amount” is also derived, based on the
two reported values. With these data, it is
possible to add up total assets and total
liabilities. Any (positive) discrepancy between
total assets and total liabilities will be added as
a lump sum either to the (total) securities
position on the asset or liability side.
As detailed in Table 2e) of Annex I to the Regulation, NCBs 7
may also choose to only collect data for the number of units or
aggregated nominal amount. This chapter of the manual only
covers those cases where NCBs collect data on two of three
variables. Chapter 12 provides details on the quality report to
be provided by NCBs who choose to collect data on only one
variable.
As specifi ed in Table 2 of Annex I to the Regulation, if an IF 8
reports transaction data on a security-by-security basis, it would
be suffi cient to report only the total amount of the position.
Or monthly, where NCBs collect data on IF assets and liabilities 9
on a monthly basis in accordance with Article 6(3) of Regulation
ECB/2007/8.

18ECB
Manual on investment fund statistics
May 20091818
Alternatively the discrepancy may also be
added to remaining assets or remaining
liabilities 10.
In a second step, the security-by-security data
are enriched with securities reference data from
the CSDB or compatible national securities
database, covering the following variables:
(1) instrument category, (2) instrument
maturity,11 (3) issuing currency, (4) issuer
sector and (5) issuer residency. “Incomplete”
reference information can either mean that
the entire securities reference information is
missing (security identifi er cannot be matched
to the CSDB, either because the security is not
covered in the CSDB, or because the identifi er
is inaccurate or incomplete) or that one or more
individual fi elds in the CSDB or local securities
database are missing.12 The proposed estimation
method, explained below, aims at fi lling these
gaps by deriving missing information from
the most similar complete records, thereby
exploiting the information available to the
largest extent possible.
Taking into account the fi ve reference variables
for stock statistics, there are 31 possible
combinations of gaps in the reference data,
including the case where no reference data are
available at all (error type 1 in Table 3 below).
Such discrepancies, if any, should be insignifi cant, given that all 10
amounts are reported, and IFs should report the required statistical
information in accordance with the minimum standards for
accuracy, as specifi ed in Annex IV to the Regulation. The allocation
of the discrepancy to the securities item is performed mainly due
to the fact that the securities item is likely to be the most relevant
position. However, in order to simplify the calculations, the
discrepancy may also be allocated to remaining assets or remaining
liabilities since these are not further broken down.
The instrument maturity should fi rst be determined by the 11
instrument category, which provides a split into short-term
(up to one year) and long-term (over one year) debt. This
approach ensures consistency with other statistics. The long-term
debt category should then be broken down into the following
groups: “over one and up to two years” and “over two years” by
making use of the variables “issue date” and “maturity date”.
In practice, the case of missing fi elds should become less relevant 12
since the CSDB or compatible national securities databases
should, in principle, have built-in procedures to estimate missing
reference information in a consistent way for all statistics relying
on the CSDB or a compatible national securities database.
However, fallback solutions should be available to fi x gaps in the
reference data which have not been previously fi xed.
Chart 2 Schematic presentation of assets and liabilities of an investment fund
A1. Deposits and loan claims
A2. Securities other than shares and A3. Shares and other equity
A5. Non-financial assets(including fixed assets)
aggregated 1)
in principle s-b-s 2)
aggregated
aggregated
aggregated
aggregated 1)
in principle s-b-s 2)
aggregated
aggregated
and other eqquityy
A4. Financial derivatives
A6. Remaining assets
L1. Loans and depositsreceived
L2. IF shares/ units
L3. Financial derivatives
L4. Remaining liabilities
Assets Liabilities
Total assets Total liabilities
Notes:1) Item may be reported “currency-by-currency” to facilitate the derivation of transactions.2) For securities with publicly available identifi cation codes. The relevant NCB may also require reporting agents to report security-by-security information for securities without publicly available identifi cation codes.

19ECB
Manual on investment fund statistics
May 2009 19
7 COMPILAT ION OF STAT IST ICS
BASED ON SECURITY-BY-
SECURITY REPORTING
19
After classifying the gaps by “error type”,
the estimation procedure looks for complete
security records with similar reference
information for all fi elds which are fi lled
in, including the complete and incomplete
record(s). Data are then only estimated for the
fi eld(s) with the gap, based on the complete
record(s). The advantage of this method is that
the estimation of, for example, the issuer sector
for a debt security with over two years original
maturity issued by a US resident has no impact
on the data referring to securities issued by
euro area residents. The estimation is carried
out separately for assets and liabilities.
In case there is no matching complete security
record 13 where all completed fi elds coincide
with those of the incomplete security, the
incomplete record is downgraded to a record in
which all fi elds are missing (error type 1 in
Table 3) and is distributed in a second round of
processing according to the overall structure of
all complete securities records (again separately
for the asset and liability side). More
sophisticated procedures are in theory also
possible, where the record is downgraded step-
by-step, i.e. where the requirements for
matching are gradually reduced to fewer and
fewer fi elds.
A complete security record refers to a security record where all 13
necessary fi elds have been completed.
Table 3 Different error types in the reference information [X marks missing data]
VariableError type
1 2 3 4 5 6 7 8 9 10 11 12 13 14 15 16
Instrument category
Instrument maturity
Issuing currency
Issuer sector
Issuer residency
X X X X X X X X X X X
X X X X X X X X X X X
X X X X X X X X X X X
X X X X X X X X X X X
X X X X X X X X X X X
VariableError type
17 18 19 20 21 22 23 24 25 26 27 28 29 30 31
Instrument category
Instrument maturity
Issuing currency
Issuer sector
X X X X X
X X X X X
X X X X X
X X X X X
Issuer residency X X X X X
Chart 3 Matching of complete and incomplete records for the estimation of reference data
Complete record(s)
Incomplete record(s)
Longterm debt
) Longterm debt
> 2 years
> 2 years
GBP40%
corporates60% banks
GBP
US
Instrumentcategory
Instrumentmaturity
Issuingcurrency
40%
Issuer sector Issuerresidency
US??
Source: ECB.

20ECB
Manual on investment fund statistics
May 20092020
This estimation procedure guarantees that the
statistical categorisation is applied to all balance
sheet categories where this is required. All
assets and liabilities can now be aggregated for
reporting.
7.2 DERIVATION OF TRANSACTIONS/
REVALUATION ADJUSTMENTS
Section 1(b) of Article 18 in the Guideline
specifi es that “where [security-by-security]
stock information is available, revaluation
adjustments may be derived in accordance with
a common Eurosystem method, i.e. the fl ow-
derivation method referred to in Annex V”.
The stock data, as presented in Section 7.1,
form the basis for the derivation of transaction/
revaluation adjustments and investment income
data for securities following a security-by-security
approach (i.e. separately for each security).
This section outlines conceptual solutions for
the derivation of transactions. The approach
presented here consists in the direct calculation
of transactions. Revaluation adjustments
(consisting of price revaluations and exchange
rate adjustments) and other adjustments, which
are ultimately to be provided by the NCBs to the
ECB, are derived as “stock difference between
t1 and t
0 minus transactions”.
7.2.1 SECURITIES OTHER THAN SHARES
Transactions in securities other than shares
which occur between t0 and t
1 can be derived
either by dirty prices or by clean prices. With
dirty prices, the transactions are calculated as:
( )2t0t1 DTt1 DTt0TR = −+( )DPt0 DPt1∗ (1)
where
DT = debt securities (aggregated nominal
amount) and
DP = debt securities (dirty) price in euro.
When clean prices are used in the derivation
of transactions, the interest income between
two reporting periods must be incorporated in
the transactions. The derivation of the interest
income is described in Chapter 8.
( )2t0t1 DTt1 DTt0TR INDTt0t1+= −+( )CPt0 CPt1∗ (2)
where
DP = debt securities (aggregated nominal
amount) and
CP = debt securities (clean) price in euro.
The following example shows the effect of
accrued interest and coupon payments on
the IF balance sheet. The example has been
simplifi ed in order to distinguish between the
effect of accrued interest (which occurs in the
fi rst period) and the effect of coupon payments
(which occurs in the following period). Further
examples are provided in Chapter 8.
At t0 the IF owns securities other than shares
that are worth 100:
As interest accrues, the holdings of securities
other than shares increase (between t0 and t
1 by
5% in one year):
The securities other than shares record a positive
transaction due to the interest accrued (+5)
which is refl ected in IF shares/units.
If – at t2 – the IF then receives the coupon
payment of 5 stemming from the IF’s holdings
A Balance sheet (t0 ) L
100 Securities other than
shares
IF shares/units 100
A Balance sheet (t1 ) L
105 Securities other than
shares
IF shares/units 105
A Transactions (t0, t1 ) L
5 Securities other than
shares (accrued interest)
IF shares/units 5

21ECB
Manual on investment fund statistics
May 2009 21
7 COMPILAT ION OF STAT IST ICS
BASED ON SECURITY-BY-
SECURITY REPORTING
21
of securities other than shares (i.e. 0.5 per share),
“deposit and loan claims” increase by 5 and the
holdings of “securities other than shares” again
decrease to 100.
The payment of coupons is recorded as a
transaction of 5 in “deposit and loan claims”.
The securities other than shares record a
negative transaction due to the payment of
coupon (-5).
If dividends are distributed to the IF’s
shareholders, these would be recorded as a
negative transaction in IF shares/units issued,
together with a corresponding negative
transaction on the assets side.
7.2.2 SHARES AND OTHER EQUITY
Transactions in shares and other equity which
occur between t0 and t
1 can be approximated by
the following basic formula:
( )2t0t1 EQt1 EQt0TR = −+( )pt0 pt1∗ (3)
where
EQ = number of shares and
P = price per share in euro.
In line with the ESA 95 14, the following sections
describe the treatment of dividend payments and
stock splits that have occurred during the
reporting period, when deriving transactions/
revaluation adjustments.
Dividends paid in cash
The following example shows the effect of
dividend payments on the IF balance sheet in
the case of dividends paid in cash. The example
is simplifi ed in order to distinguish between the
effects of accumulation of retained earnings
(which occur in the fi rst period) and the effects
of payment of dividend (which occur in the
second period).
At t0, the IF owns 10 shares of a given
corporation at a price of 10 per share.
During the period t0,t
1 the value of the
shares increases to 10.5 per share due to the
accumulation of retained earnings.
If – at t2 – the IF then receives a dividend of
5 stemming from the IF’s holdings of shares
(i.e. 0.5 per share), “deposit and loan claims”
increase by 5 and the value of “shares and other
equity” decreases again to 100.
The following would be recorded as
“revaluation adjustments”: before a dividend is
paid, any increase in the value of shares due
to accumulation of retained earnings is to be
treated as a revaluation adjustment in “shares
and other equity”. The decrease in the price
of the shares (due to payment of dividends)
is recorded as a revaluation adjustment. The
counterpart entry would be recorded as a
revaluation adjustment under IF shares/units
issued.
Council Regulation (EC) No 2223/96 of 25 June 1996 on the 14
European System of National and Regional A ccounts in the
Community (OJ L 310, 30.11.1996, p.1.).
A Balance sheet (t2 ) L
5 Deposit and loan
claims
IF shares/units 105
100 Securities other
than shares
A Transactions (t1, t2 ) L
5 Deposit and loan
claims
IF shares/units 0
-5 Securities other than
shares (minus coupon
payment)
A Balance sheet (t0 ) L
100 Shares and other equity IF shares/units 100
A Balance sheet (t1 ) L
105 Shares and other equity IF shares/units 105
A Balance sheet (t2 ) L
5 Deposit and loan claims IF shares/units 105
100 Shares and other equity

22ECB
Manual on investment fund statistics
May 20092222
The payment of dividends in cash is recorded
as a transaction of 5 in “deposit and loan
claims” and passed on to the IF shareholders as
reinvestment in “IF shares/units” issued.
If dividends are distributed to the IF’s
shareholders, these would be recorded as a
negative transaction in IF shares/units issued,
together with a corresponding negative
transaction on the assets side.
Scrip dividends
In the case of scrip dividends, shareholders
are offered a choice between cash dividends
or more shares – the scrip dividend. The
distribution of a dividend in the form of shares
increases the investment in the shares by the
shareholders.
The following example shows the effect of
dividend payments on the IF balance sheet in
case of dividends paid in shares, taking the same
simplifi ed example as in the previous section
where dividends were paid in cash.
In this case, when the IF receives the dividend
of 5 in the form of shares stemming from the
IF’s holdings of shares (i.e. 0.5 per share),
“shares and other equity” increase by 5 and the
value of “shares and other equity” remains at
105 (due to the simultaneous decrease in the
value per share).
The amounts recorded under “revaluation
adjustments” would be identical to those
recorded under the example on dividends paid
in cash.
In this case, the shareholder has taken an active
decision to allocate a proportion of its portfolio
in the company instead of cash. Therefore, the
payment of dividends in shares is recorded as a
transaction of 5 in “shares and other equity” and
passed on to the IF shareholders as reinvestment
in “IF shares/units” issued.
Treatment of bonus shares and stock splits
In the case of bonus shares (also referred to as
stock dividend or scrip issue) or stock splits,
companies increase the number of shares in
issue by either further sub-dividing the stock
that is already outstanding (stock splits) or
by distributing more shares as dividends. In
other words, the shares are restructured and
shareholders are offered a number of new shares
for each share previously held. As an example,
a two-for-one scrip issue (i.e. two new shares
in addition to one old share) is equivalent to
a three-for-one stock split. In contrast to the
case when new shares are issued in return for
additional funds, no new resources are provided
in these cases. Furthermore, these cases do not
correspond to active portfolio decisions, given
that the shareholder does not have a choice
of receiving cash. Therefore, stock splits or
the issue of bonus shares do not represent
transactions.
Both bonus shares and stock splits increase the
number of shares, and both reduce the value
per share, all other things being equal. The
distinction between the two is a technical one:
a bonus share is shown in the accounts of the
company as a transfer from retained earnings to
equity capital, whereas a stock split is shown as
a reduction in the par value of each share.
The CSDB contains two attributes that can be
used to derive the correct transactions in case
A Revaluation adjustments (t0, t1 ) L
5 Shares and other equity
(increase in share prices
due to expectation of
dividend)
IF shares/units
(increase in asset
prices)
5
A Revaluation adjustments (t1, t2 ) L
-5 Shares and other equity
(decrease in share prices
following payment of
dividend)
IF shares/units
(decrease in asset
prices)
-5
A Transactions (t1, t2 ) L
5 Deposit and loan claims IF shares/units 5
A Balance sheet (t2) L
105 Shares and other equity IF shares/units 105
A Transactions (t1, t2 ) L
5 Shares and other equity IF shares/units 5

23ECB
Manual on investment fund statistics
May 2009 2323
7 COMPILAT ION OF STAT IST ICS
BASED ON SECURITY-BY-
SECURITY REPORTING
of stock splits, namely “last split date” and
“last split factor”. First, the last split date is
used to determine whether a stock split
occurred during the reporting period. Second,
if a stock split did occur, the last split factor 15
is used to adjust the number of shares and the
price of period t1 holdings in the basic formula
(3) to calculate transactions. The amended
formula to calculate transactions taking into
account stock splits is:
( )2EQt0t1 SFEQt1 EQt0TR
+ /= −
( )pEQt0 pEQt1 SF∗∗ (4)
where
SF = last split factor.
7.2.3 INVESTMENT FUNDS SHARES/UNITS ISSUED
According to Paragraph 5.141 of the ESA 95,
fi nancial transactions in mutual fund shares
include:
the value of net contributions to a fund (a)
(i.e. subscriptions minus redemptions), and
the property income (interest, dividends), (b)
net of a part of management cost, received
by mutual funds from the investments they
have made and which are allocated but not
distributed to the shareholders of the mutual
funds. The effect is that property income is
reinvested in the fund.
It follows that fi nancial transactions in
investment funds shares/units issued can be
derived as follows:
Transactions in IF shares/units =(Subscriptions – Redemptions) + (Property income – Management charges)
Alternatively, transactions in IF shares/units
issued can be derived as the difference between
the transactions in assets and the transactions in
liabilities other than IF shares/units issued. This
would lead to the same results as the formula of
the above paragraph.
7.2.4 ESTIMATIONS WHEN THERE IS NO PRICE
INFORMATION IN THE CENTRALISED
SECURITIES DATABASE
The formulae to calculate transactions in
Sub-sections 7.2.1 and 7.2.2 above require price
information for t0, as well as t
1. As price data are
reported together with the corresponding stocks,
they will not be available from the reporting
agents where positions are zero either in t0 or t
1. In
such cases, the price information is sourced from
the reference database. In practice, the reference
database may lack the price data for any given
security. In this case, it may not be suffi ciently
accurate to use only the price in t1 or in t
0 to
estimate the transactions, in particular, during
periods with strong moves in share prices.
Moreover, an approach is needed to derive
transactions for those positions where the
reference information has been estimated for the
stock data, i.e. where no price information can
be available on a security-by-security basis as
there is no link to an individual security.
In both cases, transactions on these records may
be calculated by using price indices derived
from those security-by-security records reported
by the reporting agents where full price data are
available. The basic idea behind this approach
is comparable to the solution for the stock data
(Section 7.1) whereby missing information is
also derived from the most similar complete
records. For transactions, volume-weighted
Laspeyres price indices are derived from the
records with complete reference data for each
equity or debt category (X) of the securities held
by the IFs at the end of the previous quarter:
PR X =( )t0t1∗∑ P St1 t0
∗∑ P St0 t0
where
P = price and
S = stock.
The “last split factor” is defi ned as the number of shares before 15
the split divided by the number of shares after the split, i.e. the
value ½ denotes a two-for-one stock split.

24ECB
Manual on investment fund statistics
May 20092424
In cases where the price information for an
individual security is missing either in t0 or in t
1
because the position is zero and the price is not
available in the reference database, these price
indices (PR(X)t0t1) can be used to estimate the
missing price by defl ating the price observed in
t0 or in t
1 with the price index, and used as input
to calculate transactions in line with formulae (1)
and (3). If the price is missing in t0, the formula
used to calculate transactions, using the formula
for shares and other equity as an example, is
( )2
Xt0t1 EQt1 EQt0TR
+= −
( ( ))t0t1pt1 PR/ pt1∗ , (5)
and, analogously, if price is missing in t1
( )2t0t1 EQt1 EQt0TR = − ∗
X( ( ))t0t1pt0 pt0+ ∗PR. (6)
The same price indices can also be used to price-
adjust the aggregate balance sheet positions in
t0 where no complete reference information is
available (AGG). As a last step, transactions are
derived as the difference in (adjusted) aggregate
positions.
Adjustment of positions in t0:
( )t0_adjAGG AGGX ( )t0X PR ( )t0t1X= ∗ (7)
Calculation of transactions:
TRt0t1 AGG ( )t1X AGG ( )t0_adjX= − (8)
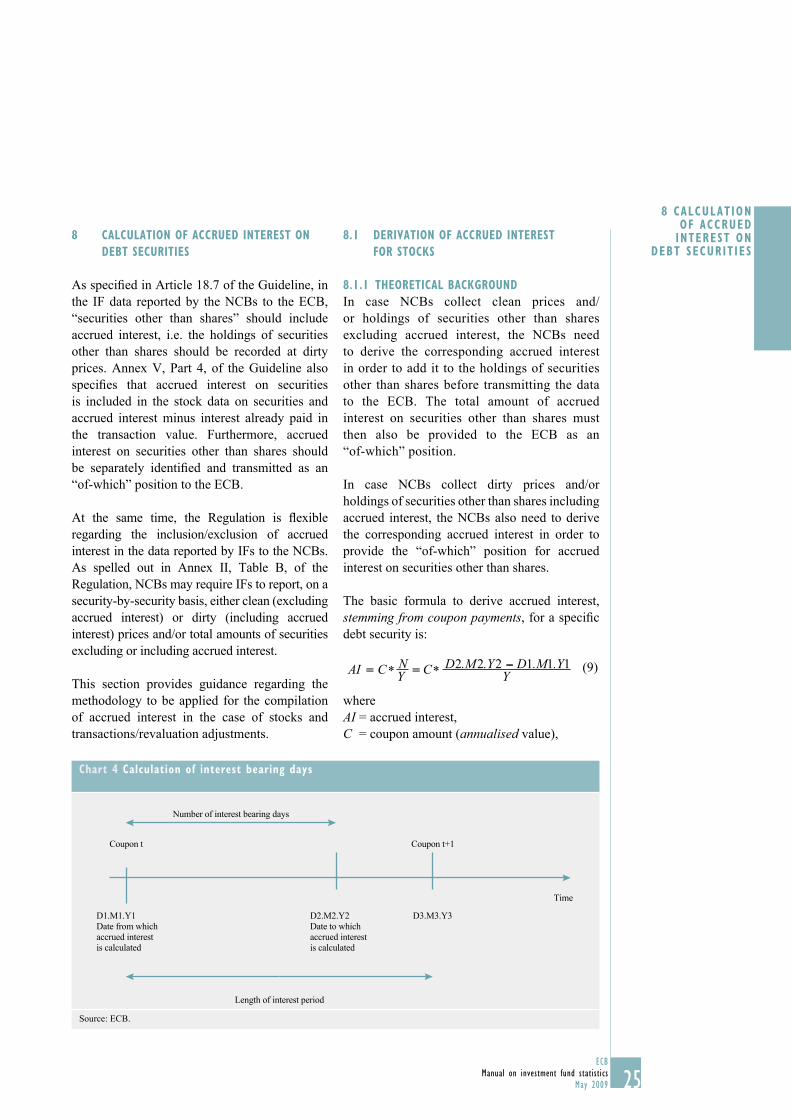
25ECB
Manual on investment fund statistics
May 2009 2525
8 CALCULATION OF ACCRUED
INTEREST ON DEBT SECURIT IES
8 CALCULATION OF ACCRUED INTEREST ON
DEBT SECURITIES
As specifi ed in Article 18.7 of the Guideline, in
the IF data reported by the NCBs to the ECB,
“securities other than shares” should include
accrued interest, i.e. the holdings of securities
other than shares should be recorded at dirty
prices. Annex V, Part 4, of the Guideline also
specifi es that accrued interest on securities
is included in the stock data on securities and
accrued interest minus interest already paid in
the transaction value. Furthermore, accrued
interest on securities other than shares should
be separately identifi ed and transmitted as an
“of-which” position to the ECB.
At the same time, the Regulation is fl exible
regarding the inclusion/exclusion of accrued
interest in the data reported by IFs to the NCBs.
As spelled out in Annex II, Table B, of the
Regulation, NCBs may require IFs to report, on a
security-by-security basis, either clean (excluding
accrued interest) or dirty (including accrued
interest) prices and/or total amounts of securities
excluding or including accrued interest.
This section provides guidance regarding the
methodology to be applied for the compilation
of accrued interest in the case of stocks and
transactions/revaluation adjustments.
8.1 DERIVATION OF ACCRUED INTEREST
FOR STOCKS
8.1.1 THEORETICAL BACKGROUND
In case NCBs collect clean prices and/
or holdings of securities other than shares
excluding accrued interest, the NCBs need
to derive the corresponding accrued interest
in order to add it to the holdings of securities
other than shares before transmitting the data
to the ECB. The total amount of accrued
interest on securities other than shares must
then also be provided to the ECB as an
“of-which” position.
In case NCBs collect dirty prices and/or
holdings of securities other than shares including
accrued interest, the NCBs also need to derive
the corresponding accrued interest in order to
provide the “of-which” position for accrued
interest on securities other than shares.
The basic formula to derive accrued interest,
stemming from coupon payments, for a specifi c
debt security is:
AI = =C* C*NY Y
D2.M2.Y2 D1.M1.Y1- (9)
where
AI = accrued interest,
C = coupon amount (annualised value),
Chart 4 Calculation of interest bearing days
Number of interest bearing days
Time
Coupon t+1Coupon t
D1.M1.Y1
Date from which
accrued interest
is calculated
D2.M2.Y2
Date to which
accrued interest
is calculated
D3.M3.Y3
Length of interest period
Source: ECB.

26ECB
Manual on investment fund statistics
May 20092626
N = number of interest bearing days = Number
of days between “date from which accrued
interest is calculated (inclusive) – D1.M1.
Y1” and “date to which accrued interest
is calculated (exclusive) – D2.M2.Y2”
(see Chart 4) and
Y = number of days between two coupon
payments (length of interest period),
annualised = number of days in a “year”.
There are various ways to calculate the number
of interest bearing days and the number of days
in a “year”. The accrued interest calculation for
a debt security is dependent on the day-count
convention specifi ed for the security. The most
commonly used day-count conventions are
30/360, 30E/360, Actual/365, Actual/360 and
Actual/Actual where the numerator denotes
the “number of interest bearing days” and the
denominator denotes the number of days in a
“year”. Table 4 provides a summary of the most
commonly used day-count conventions and a
numerical example showing the calculations
and their outcome for a particular security using
the different day-count conventions.
The accrued interest for a security should, in
principle, be calculated using the day-count
conventions which are applicable to that specifi c
security. Day-count conventions are, in principle,
available from the CSDB (or a compatible
national securities database). In case no
information regarding the day-count convention
is available, the day-count convention “Actual/
Actual” (ICMA 16 method) should be used.
Under the “Actual/Actual” convention, the
denominator is the actual number of days in
the coupon period multiplied by the number of
coupon periods in the year (subject to exceptions
International Capital Market Association.16
Table 4 Day count conventions 1)
Characteristics of security A:
Nominal amount: 10,000
Annual coupon rate: 2.75%
Coupon frequency: 2 per year
Start of interest period (last coupon date): 22/10/2003
Date to which accrued interest is calculated: 31/03/2004
End of interest period (next relevant coupon date): 22/04/2004
Day-count convention
Basic rule for determining the number of interest-bearing days (N)
Basic rule for determining the number of days in a “year”
Formula Amount
30/360 30 days/month
N=(D2-D1)+30*
(M2-M1)+360*(Y2-Y1)
- if D1 is 31, change to 30.
- if D2 is 31 and D1 is 30 or 31, change
D2 to 30, otherwise leave at 31
360 days/year (10,000*0.0275)
*
(159/360)
121.45831
30E/360 30 days/month
N=(D2-D1)+30* (M2-M1)+360*(Y2-Y1)
- if D1 is 31, change to 30
- if D2 is 31, change to 30
360 days/year (10,000*0.0275)
*
(158/360)
120.69442
Actual/365 Days/month as per calendar
N=number of days between D1.M1.Y1
and D2.M2.Y2
365 days/year (10,000*0.0275)
*
(161/365)
121.30136
Actual/360 Days/month as per calendar
N=number of days between D1.M1.Y1
and D2.M2.Y2
360 days/year (10,000*0.0275)
*
(161/360)
122.98611
Actual/Actual
[ICMA method]
Days/month as per calendar
N=number of days between D1.M1.Y1
and D2.M2.Y2
Days/year as per calendar
(based on interest period length)
(10,000*0.0275)
*
[161/(183*2)]
120.96994
1) The number of days between two dates includes the earlier date but not the later.

27ECB
Manual on investment fund statistics
May 2009 2727
8 CALCULATION OF ACCRUED
INTEREST ON DEBT SECURIT IES
in relation to irregular coupon periods).
This method raises particular issues in relation
to irregular coupon or calculation periods. When
the coupon period is regular:
AI = C * N*D F (10)
where
F = coupon frequency and
D = number of days between two coupon
payments (D1.M1.Y1 and D3.M3.Y3).
In the case of irregular calculation periods, the
approach used is to divide the interest period
into notional interest periods.
Similarly to the derivation of the actual amount
of accrued interest, the dirty price can also be
derived from the clean price and vice versa.
Example: if the clean price is 102 (per cent of
the par value) on 31 March 2004, then the dirty
price is derived as follows (assuming the 30/360
convention):
+= cPP cdNY
⎛
⎝⎪ ⎛
⎝⎪
(11)
where
Pd = dirty price,
Pc = clean price and
C = annual coupon rate.
In this particular example:
Pd = 102+2.75(159/360) = 103.214583
The following paragraphs refer to the
calculations of outstanding amount of accrued
interest for different types of bonds.
In the case of bonds that are issued at discount 17/
premium on their face value, when the bond
matures, the investor will receive a lump sum
equal to the initial investment plus/less interest
that has accrued. In other words, in the case of
securities issued at a discount or at a premium
and which do not pay coupons, the accrued
interest is equal to the difference between the
redemption price and the issue price of the
security. In this case, the interest accrues over the
life of the bond and is automatically refl ected in
the price of the instrument. The interest accrued
over a given period can be derived by taking the
difference between the nominal amount valued
at the redemption price and the nominal amount
valued at the issue price divided by the life of
the instrument (for the same nominal amount).
The clean price in the case of a bond issued at
a discount or at a premium can be derived by
subtracting from the dirty price the part related
to the interest accrued.
In the case of bonds issued at a discount/premium
and with coupon payments, the interest accrued
has two components: (1) the interest accrued
due to coupon payments; and (2) the amount of
interest accruing due to the difference between
redemptions price and issue price.
In the case of bonds issued at a discount and
paying a coupon, the interest due to the discount
accrues until the bond is redeemed and is added
to the accrued interest due to coupon payments.
In this case, the total accrued interest is
greater than the accrued interest due to coupon
payments since the issuer price is lower than the
redemption price.
In the case of bonds issued at a premium and
paying a coupon, the interest due to the premium
accrues negatively until the bond is redeemed
and is added to the accrued interest due to
coupon payments. In this case, the total accrued
interest is lower than the accrued interest due to
coupon payments since the issuer price is greater
than the redemption price.
8.1.2 USE OF THE CENTRALISED SECURITIES
DATABASE
In the CSDB, a daily accrued income factor
(which provides the accrued income per unit
and per day) is calculated for each security.18
Zero coupon bonds should be treated as securities issued 17
at a discount.
The CSDB includes the possibility of calculating accrued income 18
on a security-by-security basis following the so-called debtor and
creditor approach. In conformity with the SNA 93, the approach
chosen for the purpose of this manual is the debtor approach.

28ECB
Manual on investment fund statistics
May 20092828
This daily accrued income factor takes into
account the accrued interest for bonds paying a
coupon as well as the interest accrued in the case
of bonds issued at a discount or at a premium.
Therefore the accrued income can be derived as
follows:
Interest income (debt):
ACFDAYSINDTt0t1= 2
( )DTDTt0 + t1 (12)
where
DT = debt securities (aggregated nominal
amount),
DAYS = number of interest bearing days
= number of days between “date
from which accrued interest is
calculated (inclusive), t0” and “date
to which accrued interest is calculated
(exclusive), t1” = number of days
between t0 and t
1 and
ACF = accrued income factor = daily security
specifi c accrued income factor in %,
calculated following the debtor
approach. The factor includes the
combined effect of interest due to
coupons and income accrued due to a
difference between the issue and the
redemption price.
Using the CSDB, the accrued interest can
therefore be derived using the attribute “accrued
income factor” and the “last coupon date” which
allows deriving the number of interest bearing
days. Alternatively, since the CSDB explicitly
provides the attribute “accrued interest”, this
attribute can be directly used instead of deriving
it based on “accrued income factor” and the
“last coupon date”.
8.2 DERIVATION OF ACCRUED INTEREST FOR
TRANSACTIONS
As specifi ed in the ESA 95 (Paragraph 4.50),
accrued interest is to be recorded as a transaction
until it is paid. The interest accruing in each
period prior to maturity should be recorded as
a fi nancial transaction that represents a further
acquisition of the fi nancial asset. When accrued
interest is paid, it is considered as a decrease in
the amount held of the respective fi nancial asset.
The amount of accrued interest between t0 and t
1
to be added to the total value of the transactions
as defi ned in Section 7, can be derived according
to the following basic formula:
Interest income (debt):
ACF IPDAYSINDTt0t1= 2
( )DTDTt0 + t1 - t0t1 (13)
where
DT = debt securities (aggregated nominal
amount),
DAYS = number of interest bearing days
= number of days between “date
from which accrued interest is
calculated (inclusive), t0” and “date
to which accrued interest is calculated
(exclusive), t1” = number of days
between t0 and t
1,
ACF = accrued income factor = daily security
specifi c accrued income factor in
%, calculated following the debtor
approach. The factor includes the
combined effect of interest due to
coupons and income accrued due to a
difference between the issue and the
redemption price and
IPt0t1 = interest paid during the period t0 to t
1.
In order to derive the interest paid during the
period t0 to t
1 (IPt0t1), the attributes shown in
Table 5 are also available from the CSDB.
Table 5 Attributes available from the CSDB in order to derive the interest paid
Attribute name Description
Last coupon rate (Ct ) Last coupon rate in % actually paid.
Last coupon date Date of last coupon rate paid.
Coupon frequency (F) Frequency per year, in which the last coupon
rate is being paid out: “annual” transforms
into 1, “semi-annual” into 2, etc.

29ECB
Manual on investment fund statistics
May 2009 29
8 CALCULATION OF ACCRUED
INTEREST ON DEBT SECURIT IES
29
Interest paid:
IPt0t1 =2
( )DTDTt0 + t1
F1
Ct n (14)
where
n = number of coupons paid in the period t0 to t
1.
The date of the last coupon rate paid makes it
possible to identify whether the last coupon rate
actually paid falls into the reporting period or not.
An alternative way to derive accrued interest for
transactions is by taking the difference between
the total income accrued for stock positions on
the respective end-period reporting dates.
IA IAINDTt0t1 = - t0t1 (15)
where
IAt0 = interest accrued in t
0 and
IAt1 = interest accrued in t
1.
The following numerical example shows the
calculations and their outcome for transactions
in accrued interest for a particular security:
Table 6 Calculation of transactions in accrued interest – numerical example
Characteristics of security A:Nominal amount (DT): 10,000
Annual coupon rate: 2.75%
Coupon frequency: 2 per year
Last coupon date: 22/10/2007
Next coupon date: 22/04/2008
ACF (using Actual/Actual) = 0.000075136 (=0.0275/366)
Number - of days of accrued
interest (N)
Accrued interest (AI)=N*DT*ACF
Coupon paid (IP)
Number of days between
end-period reporting date
Monthly transactions
(DT*ACF*days) –IP [Approach 1]
Monthly transactions
AI (t) – AI (t-1)[Approach 2]
22/10/07 0 0.0 0.0
31/10/07 9 6.8 0.0
30/11/07 39 29.3 0.0 30 22.50 22.5
31/12/07 70 52.6 0.0 31 23.30 23.3
31/01/08 101 75.9 0.0 31 23.30 23.3
29/02/08 130 97.7 0.0 29 21.75 21.8
31/03/08 161 121.0 0.0 31 23.30 23.3
22/04/08 137.5
30/04/08 8 6.0 0.0 30 -115.00 -115.0
31/05/08 39 29.3 0.0 31 23.30 23.3
30/06/08 69 51.8 0.0 30 22.50 22.5
31/07/08 100 75.1 0.0 31 23.30 23.3
31/08/08 131 98.4 0.0 31 23.30 23.3
30/09/08 161 121.0 0.0 30 22.50 22.6
22/10/08 137.5
31/10/08 9 6.8 0.0 31 -115.00 -114.0
30/11/08 39 29.3 0.0 30 22.50 22.5
31/12/08 70 52.6 0.0 31 23.30 23.3
Note: Differences between Approach 1 and Approach 2 may be due to rounding.

3030ECB
Manual on investment fund statistics
May 200930303030
9 DERIVATION OF TRANSACTIONS FOR ITEMS
REPORTED ON AN AGGREGATED BASIS
9.1 OVERVIEW
As set out in Table 1 of Part 14 to Annex III of the
Guideline, NCBs report all assets and liabilities
of IFs, in terms of stocks and fl ow adjustments
(revaluation adjustments and reclassifi cation
adjustments) to the ECB. However, according
to the Regulation, in the case of revaluation
adjustments/transactions, not all these items
are necessarily reported by reporting agents
to the NCB, although the NCB may extend its
requirements to cover all these items.
As a minimum, IFs report data on revaluation
adjustments or transactions for the following
set of items: (i) securities not collected on a
security-by-security basis (total currencies),19
(ii) total fi nancial derivatives (if not exempted),
and (iii) total non-fi nancial assets, mainly real
estate (if not exempted).
Items where no revaluation adjustments
or transactions need to be reported by the
IFs include (i) deposits and loans claims,
(ii) remaining assets, (iii) loans and deposits
received, (iv) remaining liabilities and (v) those
items where the NCBs may exempt IFs from
reporting them, if the quarterly stocks represent
less than 5% of IF shares/units issued (fi nancial
derivatives and non-fi nancial assets).
For the purpose of deriving data on revaluation
adjustments or transactions, reporting agents
can, subject to the instructions of the NCB,
apply the two alternative methods that are
already used in the context of MFI balance sheet
statistics,20 the so-called “transaction method” or
the so-called “balance sheet method”. Under the
transaction method, reporting agents consider
all transactions which occur during the reference
period and report them at transaction value.
It follows that this method includes realised
gains/losses, resulting from a sale of a security,
in revaluation adjustments. Under the balance
sheet method, transactions are calculated by
taking the sales at the value at which they were
recorded in the balance sheet at the end of the
previous period, and purchases at the value at
which they are recorded in the balance sheet
at the end of the current period. Intra-period
buy-sell operations of the same security are not
recognised. It follows that realised gains/losses
are not covered.
9.2 DEPOSITS AND LOANS
The value of euro denominated deposits will not
change over time and net transactions can be
derived directly as differences in stocks.21
For deposits in other currencies, the value
expressed in euro will change dependent on the
development of the exchange rate against the
euro. Therefore, in order to derive the revaluation
adjustment for deposits, the NCBs might choose
to collect deposits broken down by the
relevant currencies.
The same approach could also be followed
in case of loans which may be taken by
IFs, in particular hedge funds, to leverage
the investments.
IFs may also hold loans as investments on the
assets side. The value of these loans may depend
not only on the currency of the loan, but also on
the interest rates prevailing on the market and
the creditworthiness of the debtor. Therefore,
collection of a currency breakdown may not be
suffi cient to compile high quality revaluation
adjustments. In cases where the investment in
loans by IFs is signifi cant on a national level,
the relevant NCBs should consider collecting
the revaluation adjustments or transactions from
the reporting agents.
The transaction value of deposits and loans
excludes fees. It also excludes accrued interest
that is receivable/payable but has not yet been
In the case of the combined approach, for securities without 19
publicly available identifi cation codes and, in the case of the
aggregated approach, for all securities.
For a detailed description of the two methods in the context of 20
MFI balance sheet statistics, please refer to the “Guidance notes
to the Regulation ECB 2001/13 on MFI balance sheet statistics”.
Valuation changes in the case of time deposits with a fi xed 21
interest rate are disregarded in this example.

3131ECB
Manual on investment fund statistics
May 2009
9 DERIVAT ION OF TRANSACTIONS
FOR ITEMS REPORTED ON AN
AGGREGATED BAS IS
31313131
received or paid. Accrued interest on deposits
and loans is recorded under remaining assets/
remaining liabilities.
9.3 FINANCIAL DERIVATIVES
When a new fi nancial derivative contract is
created, it should be recorded on balance sheet,
and the initial asset/liability position should be
recorded as a fi nancial transaction. The transaction
value should not include fees or repayable
margin payments. In the case of forward-type
contracts and warrants, the transaction value is
normally zero, and for option-type contracts, the
transaction value corresponds to the premium.
During the life of a fi nancial derivative, changes
in its market value should be recorded as
revaluation adjustments. Favourable (positive)
changes in the market price should be recorded
on the assets side and unfavourable (negative)
changes in the market price should be recorded
on the liability side. Payments due to marking to
market, which results in a change of value of a
fi nancial derivative position, should be recorded
as fi nancial transactions.
When a fi nancial derivative is settled, any
associated payments (excluding fees) should be
recorded as fi nancial transactions.
Purchases or sales of fi nancial derivatives on
secondary markets should be recorded as fi nancial
transactions, valued at transaction prices.
9.4 NON-FINANCIAL ASSETS
The most relevant item within non-fi nancial
assets is holdings of real estate. Given that
the geographical areas of investment, as well
as the type of real estate invested in, are likely
to differ considerably between investment
funds, it seems almost impossible to derive
transaction data from reported stocks without
further information.
From a practical point of view, there seem to be
two general approaches for the data provision:
given that transactions in real estate are
relatively infrequent, the NCBs might require
IFs to directly report transactions in real estate
in addition to the stock data. An alternative
approach would be for IFs to report revaluation
adjustments related to holdings of real estate
in addition to the stock data, providing the
necessary input to derive transactions.
In the context of non-fi nancial assets, it may be
diffi cult to allocate geographically non-fi nancial
assets that are not real estate, such as for
example works of art. In this case, for simplicity
purposes, the non-fi nancial assets could be
allocated as domestic.
9.5 REMAINING ASSETS/LIABILITIES
The most relevant item within remaining assets/
liabilities is accrued interest receivable/payable
on loans/deposits. Accrued interest that it is not
actually paid should be recorded as a fi nancial
transaction. The transaction value does not
exclude taxes levied on interest.

3232ECB
Manual on investment fund statistics
May 200932
10 DERIVATION OF MONTHLY DATA
(METHODS FOR ESTIMATION TECHNIQUES)
As specifi ed in Article 18.6 of the Guideline,
for reference months that are not end-quarter
months, the monthly data on IF assets and
liabilities other than investment fund shares/
units issued must be estimated on the basis of
the collected monthly and quarterly data.22
The estimates can be made either by the NCBs,
preferably at individual fund level (alternatively
by IF sub-sector), or the NCBs may request the
ECB to make the estimates, in which case the
ECB may request additional information such
as fund-by-fund or security-by-security data.
The purpose of this section is to describe some
possible methods to be used by the NCBs for the
purpose of estimating the monthly data, both for
stocks and transactions/revaluation adjustments.
Two approaches are considered: (i) the temporal disaggregation method, which may be used
when NCBs collect only IF shares/units on a
monthly basis and when the structure of the IF’s
securities portfolio is assumed to change during
the quarter, and (ii) use of the CSDB or local securities database, which would be possible
when the structure of the IF’s securities portfolio
can be assumed to be quite stable during the
quarter, or when monthly security-by-security
information is collected from IFs.
10.1 TEMPORAL DISAGGREGATION METHODS 23
These are methods that exploit the information
provided by the functional relationship estimated
at a lower frequency (e.g. quarterly) between an
indicator (“anchor” variable) and the variables
to be interpolated. The information provided by
the functional relationship is then used together
with the anchor variable, which is also available
at higher frequency (e.g. monthly), to obtain
monthly estimates of the other variables.
This procedure allows interpolating data for
both stocks and fl ows.
In the case of IF statistics, the estimation
of intra-quarter monthly data on assets and
liabilities of IFs (stocks and fl ows) will be based
on the data available at a monthly frequency
(stocks and fl ows), which will serve as anchor
values (such as the “investment funds shares/
units issued”), and the observed exhaustive
quarterly breakdowns (stocks and fl ows)
collected from reporting agents.
In the case of stock data, the quarterly end-
period stocks coincide with the monthly
stock data with reference to the end-quarter
month. The estimated intra-quarter monthly
observations are thus obtained by interpolating
available quarterly stock data. On the other
hand, in the case of fl ow data, monthly estimates
are derived by distributing the quarterly fl ow
data, since quarterly fl ows should be equal to
the sum of the three monthly fl ows.
Several alternative procedures have been
proposed in the literature to deal with the
temporal disaggregation of data and missing
observations (including forecasting) 24. Among
the procedures that make use of the indicators
available at the desired higher frequency and
related to the series to be estimated, is the
procedure proposed by Chow and Lin,25 and
further developed by others.26 These procedures
are presented in this manual as possible
“interpolation” techniques to derive monthly
data on IF assets and liabilities.
The Chow-Lin procedure can, in formal terms,
be expressed as follows: let yt be the unknown
series to be estimated at monthly level and
Yt its available quarterly values, while w
t is
Unless all required data are collected on a monthly basis, as set 22
out in Article 5(3) of the Regulation.
These methods were also used to compile historical monthly 23
series for euro area loans and deposits to other resident sectors
by type of sub-sector (www.ecb.int/stats/pdf/money/aggregates/
technical_notes.pdf).
For a review of the different methods, see Eurostat, 24 Handbook of Quarterly National Accounts, Part III, European Commission,
Luxembourg, 1999.
See G. Chow and A.L. Lin, “Best linear unbiased interpolation, 25
distribution and extrapolation of time series by related series”,
The Review of Economics and Statistics, 53, 1971.
See R.B. Fernández, “A methodological note on the estimation of 26
time series”, The Review of Economics and Statistics, 63, 1981,
and R.B. Litterman, “A random walk, Markov model for the
distribution of time series”, Journal of Business and Economic Statistics, 1, 1983.

3333ECB
Manual on investment fund statistics
May 2009 33
10 DERIVAT ION OF MONTHLY DATA
the indicator (or “anchor” series) available
at monthly level, and Wt in quarterly terms.
The unknown relationship at monthly level
between the anchor series and the variables to
be interpolated can be expressed as:
uwt t ty += α (16)
where
ut is the disturbance error, and is estimated
by using the information provided by the
relationship at quarterly level between the anchor
series and the variables to be interpolated:
t t teWY += β (17)
Thus, the Chow-Lin procedure takes into
account the historical relationship between the
control variable (e.g. investment fund shares/
units issued) and the sub-components at the
quarterly level.
In order to derive the fi nal monthly estimates,
a two-step procedure can be applied. As a fi rst step, the Chow-Lin procedure with AR(1)
errors is implemented, using as an indicator
the monthly investment fund shares issued.
However, in the case of assets and liabilities of
IFs, the interpolation problem is complicated
by the existence of horizontal (or adding-up)
constraints, e.g. the sum of the monthly series
for the assets and liabilities has to coincide
with the total assets/liabilities, and these are
not necessarily satisfi ed by the interpolation
procedure. To tackle this issue, in a second step the horizontal aggregation errors resulting
from the application of Chow-Lin (fi rst step)
can subsequently be distributed to the monthly
interpolated series by using the Denton
adjustment procedure.27
Finally, a non-negativity constraint has to be
imposed when deriving the monthly stock data.
This can be imposed in the second step of the
interpolation phase together with the additivity
constraint, such that in all the cases where the
result of the fi rst step interpolation is negative,
the observation is set to one,28 and any resulting
additivity discrepancy between the monthly
interpolated balance sheet items and the
correspondent total assets/liabilities is then
adjusted together with the other horizontal
discrepancies.
Where the Chow-Lin procedure is applied,
the initial forecasts must be based on a suffi cient
number of historical data points to obtain
acceptable results. Therefore, existing historical
data, even though not necessarily in line with
the requirements as set out in the Regulation,
will need to be used.
10.2 USE OF THE CENTRALISED
SECURITIES DATABASE OR A
LOCAL SECURITIES DATABASE
The information available on a security-by-
security basis regarding the holdings of securities
by IFs at the end of the quarter could possibly
be used (for certain IF sub-sectors) to estimate
transactions for the reference months that are
not end-quarter months. This approach would
be based on the assumption that the structure
of the IF’s securities portfolio does not change
during the quarter. In this case, the security-
by-security information on assets held by IFs
at the end of the previous quarter, combined
with security prices available from the CSDB
or local securities database, could be used as a
basis for estimating the developments during the
quarter. Given the irregular nature of transaction
data, price information should be taken in
consideration. In this way, this method can
also complement the temporal dissagregation
methods for deriving transactions, especially
when strong changes in prices for one or more
security category are observed.
See F. Denton, “Adjustment of Monthly or Quarterly Series to 27
Annual Totals: An Approach Based on Quadratic Minimization”,
Journal of the American Statistical Association, 66, 1971.
Negative values resulting from the application of the Chow-Lin 28
procedure in the fi rst step cannot be set to zero, since this would,
in the case of many negative values, lead to a problem of singular
matrices in the second step.

34ECB
Manual on investment fund statistics
May 20093434
11 DEROGATIONS REGARDING REPORTING
FREQUENCY
Article 3 of the Regulation states that
“derogations may be granted to IFs that are
subject to national accounting rules which allow
the valuation of their assets less frequently
than quarterly” and that “the IFs to which
such derogations apply shall be subject to
the requirements set out in Article 6 of this
Regulation at a frequency consistent with their
accounting obligations regarding the timing of
valuation of their assets”.
Furthermore, Article 18 of the Guideline
specifi es that “notwithstanding such derogation,
the monthly and quarterly IF data reported by
NCBs to the ECB shall always include data
relating to these IFs.”
In most cases, the IFs to which such derogations
will be granted are likely to be closed-end real
estate funds, since these type of funds often
value their non-fi nancial assets (mainly
consisting of property) only on an annual or
semi-annual basis. The categories of IFs to
which the derogations may be granted have been
published in a Decision of the European Central
Bank concerning derogations granted under
Regulation ECB/2007/8 concerning statistics on
the assets and liabilities of investment funds
(ECB/2009/4). 29
Since the changes in their non-fi nancial asset
positions will depend on the development of
property values as well as buying and selling of
properties, the estimated monthly and quarterly
data should ideally take these into account.
However, in case the appropriate information
is not available, NCBs could simply repeat the
last available stock data until new information
becomes available. Once the new information
becomes available, the transaction between time
t-1 and time t can be redistributed taking into
account the number of months between t-1 and t.
In case the assets are only valued on an
annual basis, the redistribution of the annual
transaction will lead to revisions in the monthly
and quarterly data provided for an entire year.
While this does not comply with the revision
policy set out in Article 18.3 of the Guideline,
an exception to the revision policy can be made
in this case.
In the case of IFs other than real estate funds
(or other funds investing mainly in non-
fi nancial assets) to which such derogations are
granted, monthly and quarterly estimations
could possibly be derived by using the CSDB
or local securities database as described in
Section 10.2. Alternatively, the same approach
as for real estate funds, as described above,
could be applied.
OJ L 72, 18.03.2009, p. 21.29

35ECB
Manual on investment fund statistics
May 2009 35
12 ANNUAL QUALITY REPORT REFERRED TO IN ANNEX I OF THE REGULATION
35
12 ANNUAL QUALITY REPORT REFERRED TO IN
ANNEX I OF THE REGULATION
As specifi ed in Annex I, Part 3, Table 2 (e), of
the Regulation, NCBs may choose to collect
only security-by-security information on the
“number of units or aggregated nominal amount”
instead of also collecting security-by-security
information such as the price of the security or
the total amount of the security. However, if an
NCB chooses to adopt this approach, it “must
check, and inform the ECB, at least once a year
that the quality of the aggregated data reported
by the NCB, including the frequency and size of
revisions, is unaffected”.
In order to check the quality of the aggregated
data reported to the ECB, the NCB could
cross-check the data, for a representative sample
of IFs, by comparing the data published in the
annual accounts of these IFs with the data derived
from the security-by-security information and
the prices available from the CSDB.

EURO AREA BALANCE OF PAYMENTS AND INTERNAT IONAL INVESTMENT POS I T ION STAT I ST I C S
MARCH 2009
2008Qualityreport