OVENANT PRESYTERIAN HURH 2439 McGregor lvd. Ft. Myers, FL ...
Manual on Implementationof a 300 m (1 000 ft) VerticalSeparation Minimum BetweenFL 290 and FL 410 Inclusive
Second Edition — 2002
Doc 9574AN/934
International Civil Aviation Organization
Approved by the Secretary General
and published under his authority
1-1
Chapter 1
INTRODUCTION
1.1 BACKGROUND
1.1.1 In the late 1950s it was recognized that, as aresult of the reduction in pressure-sensing accuracy ofbarometric altimeters with increasing altitude, there was aneed above a certain flight level (FL) to increase theprescribed vertical separation minimum (VSM) of 300 m(1 000 ft). In 1960, an increased VSM of 600 m (2 000 ft)was established for use between aircraft operating aboveFL 290 except where, on the basis of regional air navigationagreement, a lower flight level was prescribed for theincrease. The selection of FL 290 as the vertical limit forthe 300 m (1 000 ft) VSM was not so much an empirically-based decision but rather a function of the operationalceiling of the aircraft at that time. In 1966, this changeoverlevel was established at FL 290 on a global basis. At thesame time, it was considered that the application of areduced VSM above FL 290, on a regional basis and incarefully prescribed circumstances, was a distinctpossibility in the not too distant future. Accordingly, ICAOprovisions stated that such a reduced VSM could be appliedunder specified conditions within designated portions ofairspace on the basis of regional air navigation agreement.
1.1.2 It has long been recognized that any decisionconcerning the feasibility of reducing the VSM aboveFL 290 could not be based upon operational judgementalone, but would need to be supported by a rigorousassessment of the risk associated with such a reduction ofseparation. The lack of a clear-cut method of achieving suchan assessment was the primary cause of the failure of variousattempts to determine the feasibility of a reduced VSM.
1.1.3 In the mid-1970s, the series of world fuelshortages and the resultant rapid escalation of fuel costs,allied to the growing demand for a more efficient utilizationof the available airspace, emphasized the necessity for adetailed appraisal of the proposal to reduce the VSM aboveFL 290. Thus, at its fourth meeting (in 1980), the ICAOReview of the General Concept of Separation Panel(RGCSP) concluded that, despite the cost and timeinvolved, the potential benefits of reducing the VSM above
FL 290 to 300 m (1 000 ft) were so great that States shouldbe encouraged to conduct the major evaluations necessary.
1.1.4 In 1982, coordinated by the RGCSP, Statesinitiated programmes to study comprehensively thequestion of reducing the VSM above FL 290. Studies werecarried out by Canada, Japan, Member States ofEUROCONTROL (France, Federal Republic of Germany,Kingdom of the Netherlands and United Kingdom), Unionof Soviet Socialist Republics and United States, and inDecember 1988 the results were considered by the RGCSPat its sixth meeting (RGCSP/6).
1.1.5 These studies employed quantitative methods ofrisk assessment to support operational decisions concerningthe feasibility of reducing the VSM. The risk assessmentconsisted of two elements: first, risk estimation, whichconcerns the development and use of methods andtechniques with which the actual level of risk of an activitycan be estimated; and second, risk evaluation, whichconcerns the level of risk considered to be the maximumtolerable value for a safe system. The level of risk that isdeemed acceptable was termed the target level of safety(TLS).
1.1.6 The process for the estimation of risk in thevertical plane using the collision risk model (CRM)assumed that collisions result solely from verticalnavigation errors of aircraft to which procedural separationhad been correctly applied. The TLS was derived to applyto this contribution of collision risk alone; it does notaddress risk from other sources, such as height deviationsdue to turbulence, responses to airborne collision avoidancesystem alerts, emergency descents and operational errors inthe issuance of, or compliance with, air traffic control(ATC) instructions.
1.1.7 The recognition of several sources of risk inaddition to vertical navigation errors played a role in thechoice of TLS values by various States during their studies.Several approaches were followed in order to establish anappropriate range of values, including all en-route mid-aircollisions and the implicit period between collisions, and
Manual on Implementation of a 300 m (1 000 ft) Vertical1-2 Separation Minimum Between FL 290 and FL 410 Inclusive
adjusting the TLS until the period of time becameacceptable. Nevertheless, the primary approach, and thetraditional manner, was to use historical data from globalsources, predicted forward to approximately the year 2000to provide a safety improvement and to apportion resultantrisk budgets to derive the vertical collision risk element.
1.1.8 The derived values for the TLS ranged between1 × 10-8 and 1 × 10⁻⁹ fatal accidents per aircraft flight hour.On the basis of these figures, it was agreed that anassessment TLS of 2.5 × 10⁻⁹ fatal accidents per aircraftflight hour would be used to assess the technical feasibilityof a 300 m (1 000 ft) VSM above FL 290 and also todevelop aircraft height-keeping capability requirements foroperating in a 300 m (1 000 ft) VSM.
1.1.9 Using the assessment TLS of 2.5 × 10⁻⁹ fatalaccidents per aircraft flight hour, RGCSP/6 concluded thata 300 m (1 000 ft) VSM above FL 290 was technicallyfeasible. This technical feasibility refers to the fundamentalcapability of aircraft height-keeping systems, which couldbe built, maintained and operated in such a manner that theexpected, or typical, performance is consistent with safeimplementation and use of a 300 m (1 000 ft) VSM aboveFL 290. In reaching this conclusion on technical feasibility,the panel found it necessary to establish:
a) airworthiness performance requirements embodied ina comprehensive minimum aircraft system perform-ance specification (MASPS) for all aircraft utilizingthe reduced separation;
b) new operational procedures; and
c) a comprehensive means of monitoring the safeoperation of the system.
1.1.10 It is important to emphasize that the assess-ment TLS did not address all causes of risk of collision inthe vertical plane. In the first edition of this guidancematerial, regional planning authorities were advised of thenecessity to institute measures to ensure that the risksassociated with operational errors and emergency actionsdid not increase in the 300 m (1 000 ft) VSM environment.In the North Atlantic (NAT) Region, which on 27 March1997 became the first ICAO region to implement thereduced vertical separation minimum (RVSM), it wasagreed that a more formal approach was necessary toassessing all causes of risk in the vertical plane. On thebasis of the experience gained in the monitoring andanalysis of the causes of operational errors in NATminimum navigation performance specification (MNPS)airspace, the NAT Systems Planning Group (NAT SPG)agreed that limiting the risk of collision due to the loss of
planned vertical separation as a consequence of such eventsshould receive attention at least equal to that devoted tolimiting the effects of technical errors (errors of aircraftheight-keeping systems). Therefore, in addition to the TLSfor technical errors, i.e. 2.5 × 10⁻⁹ fatal accidents peraircraft flight hour, an overall TLS of 5 × 10⁻⁹ fatalaccidents per aircraft flight hour resulting from a loss ofvertical separation due to any cause was adopted.
1.2 PURPOSE OF MANUAL
1.2.1 The basic purpose of this manual is to provideregional planning groups (RPGs) with a basis for thedevelopment of documents, procedures and programmes toenable the introduction of a 300 m (1 000 ft) VSM aboveFL 290 within their particular regions in accordance withthe criteria and requirements developed by ICAO. Moredetailed justification and explanation of the various criteria,requirements and methodology outlined in this manual areprovided in the report of the RGCSP/6 Meeting(Doc 9536).
1.2.2 This manual also provides:
a) guidance to State aviation authorities on thosemeasures necessary to ensure that the criteria andrequirements are met within their area of responsi-bility; and
b) background information for operators to assist themin the development of operating manuals and flightcrew procedures.
1.3 CONTENT AND PRESENTATION
1.3.1 The sequence of the material in the first editionof this manual reflected the stages of implementation thatemerged from the deliberations of the RGCSP/6 Meeting,which, as a result of the vertical studies programme,determined the feasibility of a global application of thereduced vertical separation minimum. This second editionof the manual has been restructured to improve itspresentation and to take into account new material resultingfrom relevant RVSM-related developments since the firstedition was published in 1992. Chapter 2 describes thegeneral RVSM requirements in terms of, inter alia, safety,required aircraft height-keeping performance, and operatingaspects. Chapter 3 gives guidance on the steps to follow forregional implementation of RVSM, and Chapter 4 describesspecific aircraft RVSM requirements and approval aspects.
Chapter 1. Introduction 1-3
Chapter 5 gives general guidance on procedures, for bothATC and flight crew, and Chapter 6 provides informationon system monitoring, including the responsibilities andtasks of authorities in RVSM performance monitoring.Appendix A contains guidance on the quantitative aspectsof system performance monitoring, and Appendix Bprovides a list of reference documentation, such as regionaldocumentation developed in the context of regional RVSMimplementation programmes.
1.3.2 In this manual, RVSM refers to a verticalseparation minimum of 300 m (1 000 ft) between FL 290and FL 410 inclusive.
1.4 LIST OF ACRONYMS
AAD Assigned altitude deviationACAS Airborne collision avoidance system ACC Area control centreASE Altimetry system errorATC Air traffic controlATS Air traffic servicesCFL Cleared flight levelCMA Central monitoring agencyCRM Collision risk modelFAA Federal Aviation AdministrationFL Flight levelFTE Flight technical errorGAT General air trafficGMS GPS-based monitoring systemGMU GPS-based monitoring unitGPS Global positioning systemHF High frequencyHMU Height-monitoring unitJAA Joint Aviation AuthorityMASPS Minimum aircraft system performance
specificationMNPS Minimum navigation performance
specificationNAT North AtlanticNAT SPG North Atlantic Systems Planning GroupNOTAM Notice to airmenOAT Operational air trafficRGCSP Review of the General Concept of Separation
PanelRMA Regional monitoring agencyRNAV Area navigationRPG Regional planning groupRVSM Reduced vertical separation minimum of
300 m (1 000 ft) between FL 290 and FL 410 inclusive
SD Standard deviation
SSE Static source errorSSR Secondary surveillance radarTLS Target level of safetyTVE Total vertical errorVSM Vertical separation minimum
1.5 LIST OF DEFINITIONS
The following definitions are intended to clarify certainspecialized terms used in this manual.
Aberrant aircraft. Those aircraft which exhibit measuredheight-keeping performance that is significantlydifferent from the core height-keeping performancemeasured for the whole population of aircraft operatingin RVSM airspace.
Aircraft type groupings. Aircraft are considered to belongto the same group if they are designed and assembledby one manufacturer and are of nominally identicaldesign and build with respect to all details which couldinfluence the accuracy of height-keeping performance.
Airworthiness approval. The process of assuring the Stateauthority that aircraft meet RVSM MASPS. Typically,this would involve an operator meeting the require-ments of the aircraft manufacturer service bulletin forthat aircraft and having the State authority verify thesuccessful completion of that work.
Altimetry system error (ASE). The difference between thealtitude indicated by the altimeter display, assuming acorrect altimeter barometric setting, and the pressurealtitude corresponding to the undisturbed ambientpressure.
Altimetry system error stability. Altimetry system error foran individual aircraft is considered to be stable if thestatistical distribution of altimetry system error iswithin agreed limits over an agreed period of time.
Altitude-keeping device. Any equipment which is designedto automatically control the aircraft to a referencedpressure altitude.
Assigned altitude deviation (AAD). The difference betweenthe transponded Mode C altitude and the assignedaltitude/flight level.
Automatic altitude-keeping device. Any equipment whichis designed to automatically control the aircraft to areferenced pressure-altitude.
Manual on Implementation of a 300 m (1 000 ft) Vertical1-4 Separation Minimum Between FL 290 and FL 410 Inclusive
Collision risk. The expected number of mid-air aircraftaccidents in a prescribed volume of airspace for aspecific number of flight hours due to loss of plannedseparation.
Note.— One collision is considered to produce twoaccidents.
Flight technical error (FTE). The difference between thealtitude indicated by the altimeter display being used tocontrol the aircraft and the assigned altitude/flight level.
Height-keeping capability. The aircraft height-keepingperformance that can be expected under nominalenvironmental operating conditions with proper aircraftoperating practices and maintenance.
Height-keeping performance. The observed performanceof an aircraft with respect to adherence to cleared flightlevel.
Non-compliant aircraft. An aircraft configured to complywith the requirements of RVSM MASPS which,through height monitoring, is found to have a totalvertical error (TVE) or an assigned altitude deviation(AAD) of 90 m (300 ft) or greater or an altimetrysystem error (ASE) of 75 m (245 ft) or more.
NOTAM. A notice distributed by means of tele-communication containing information concerning theestablishment, condition or change in any aeronauticalfacility, service, procedure or hazard, the timelyknowledge of which is essential to personnel concernedwith flight operations.
Occupancy. A parameter of the collision risk model whichis twice the count of aircraft proximate pairs in a singledimension divided by the total number of aircraft flyingthe candidate paths in the same time interval.
Operational error. Any vertical deviation of an aircraftfrom the correct flight level as a result of incorrectaction by ATC or the aircraft crew.
Overall risk. The risk of collision due to all causes, whichincludes the technical risk (see definition) and all riskdue to operational errors and in-flight contingencies.
Passing frequency. The frequency of events in which twoaircraft are in longitudinal overlap when travelling inthe opposite or same direction on the same route atadjacent flight levels and at the planned verticalseparation.
RVSM approval. The term used to describe the successfulcompletion of airworthiness approval and operationalapproval (if required).
Target level of safety (TLS). A generic term representingthe level of risk which is considered acceptable inparticular circumstances.
Technical risk. The risk of collision associated with aircraftheight-keeping performance.
Total vertical error (TVE). The vertical geometricdifference between the actual pressure altitude flown byan aircraft and its assigned pressure altitude (flightlevel).
Track. The projection on the earth’s surface of the path ofan aircraft, the direction of which path at any point isusually expressed in degrees from North (true, magneticor grid).
Vertical separation. The spacing provided between aircraftin the vertical plane to avoid collision.
Vertical separation minimum (VSM). VSM is documentedin the Procedures for Air Navigation Services — AirTraffic Management (PANS-ATM, Doc 4444) as beinga nominal 300 m (1 000 ft) below FL 290 and 600 m(2 000 ft) above FL 290 except where, on the basis ofregional agreement, a value of less than 600 m (2 000ft) but not less than 300 m (1 000 ft) is prescribed foruse by aircraft operating above FL 290 withindesignated portions of the airspace.
2-1
Chapter 2
GENERAL REQUIREMENTS
2.1 SAFETY OBJECTIVES
2.1.1 Implementation of RVSM should be based on asafety assessment, demonstrating that RVSM safetyobjectives have been satisfied. The safety assessmentshould include using a CRM for the airspace in accordancewith the guidance provided in this manual (more detailedinformation on CRM methodologies are contained in thedocuments referenced in Appendix B).
2.1.2 RVSM safety objectives have been set for bothtechnical risk and overall risk and are as follows.
Safety objective for technical risk
2.1.3 Technical risk is the risk of collision associatedwith aircraft height-keeping performance. Risk associatedwith operational errors (e.g. controller/pilot errors) andin-flight contingencies is not included.
2.1.4 The RVSM safety objective for technical risk isa TLS of 2.5 x 10⁻⁹ fatal accidents per aircraft flight hour.This value for technical risk was used to derive the globalsystem performance specification and the global height-keeping performance specification, which are detailed in2.2 and 2.3, respectively.
Safety objective for overall risk
2.1.5 Overall risk is the risk of collision due to allcauses, which includes the technical risk (see above) and allrisk due to operational errors and in-flight contingencies,such as pilot/controller errors, height deviations due toemergency procedures, and turbulence.
2.1.6 The RVSM safety objective for overall riskshould be set by regional agreement. Due account shouldbe taken of existing ICAO guidance on safety objectivesand of safety objectives applied in other regions. To thisend, attention is drawn to:
a) the guidance provided in Annex 11, Attachment B,Section 3, which, with regard to spacing betweenparallel tracks or between parallel RNAV routecentre lines based on RNP type, recommends thatfor implementation of en-route systems after theyear 2000, a target level of safety of 5 × 10⁻⁹ fatalaccidents per flying hour per dimension should beapplied. However, other appropriate metrics andmethods of assessment providing an acceptablelevel of safety may be established by States and, asappropriate, implemented by regional agreement;
b) the overall safety objective applied for RVSM in theNAT Region, i.e. a TLS of 5 × 10⁻⁹ fatal accidentsper aircraft flight hour resulting from a loss ofvertical separation due to any cause (see 1.1.10); and
c) the reference list in Appendix B to this manual.
2.1.7 Guidance on the methodologies to estimate riskassociated with RVSM is contained in Chapter 6, SystemPerformance Monitoring.
2.1.8 Regional authorities should take into account allpossible means of quantifying and reducing the level of riskof collision resulting from operational errors and in-flightcontingencies in RVSM airspace. Whilst the frequency ofoccurrence of these events is not considered to be afunction of the separation minimum applied, it will beessential for RPGs to institute measures to ensure that therisk due to operational errors and in-flight contingenciesdoes not increase following the reduction of verticalseparation from 600 m to 300 m (2 000 ft to 1 000 ft).Guidance on the type of measures to be taken by RPGs,ATC and flight crews is outlined in Chapters 5 and 6.
2.1.9 In comparing estimated risk with a target riskvalue, such as a TLS, regional authorities should take intoaccount the estimation method applied, its accuracy, itsassumptions and the intended scope of applicability of thetarget risk value when making the final operationaljudgement as to whether implementation of RVSM willadversely affect overall airspace safety.
Manual on Implementation of a 300 m (1 000 ft) Vertical2-2 Separation Minimum Between FL 290 and FL 410 Inclusive
2.2 GLOBAL SYSTEM PERFORMANCESPECIFICATION
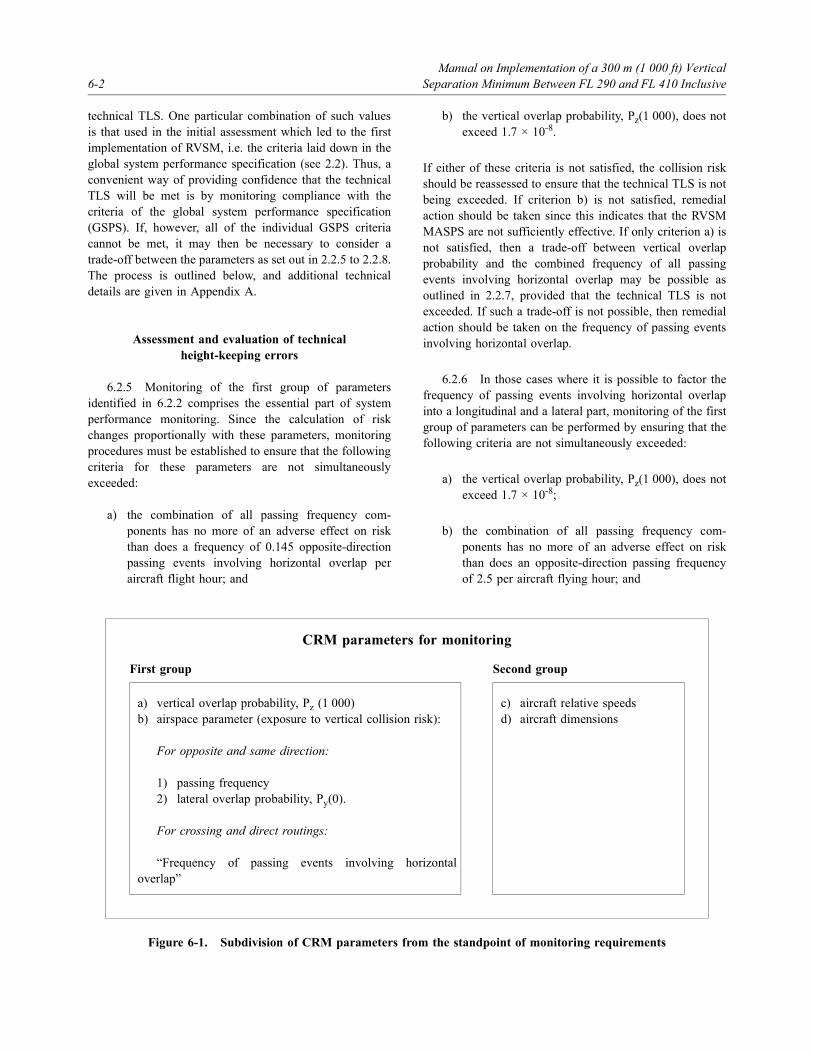
2.2.1 The global system performance specification isa statement of the parameters that form the basis fordefining the integrated set of requirements for aircraftheight-keeping, aircraft systems, aircraft operating proce-dures, ATC procedures and monitoring practices presentedin this manual. The global system performancespecification defines the height-keeping performancenecessary to meet the safety goal for RVSM technical risk(see 2.1). This level of height-keeping performance dependson specific values of important airspace parametersaffecting the risk of collision should vertical separation belost. The height-keeping performance requirement of thesystem performance specification is expressed as themaximum value for the probability that aircraft will losevertical separation equal to the RVSM value, P z(1 000). Theimportant airspace parameters concern the frequency withwhich aircraft pass while having procedural vertical separa-tion equal to RVSM and actual horizontal separation lessthan the horizontal size of an aircraft. These importantairspace parameters may be expressed in different ways,depending on the route structure of the airspace.
2.2.2 The global system performance specificationwas originally derived for opposite-direction traffic. In thatcase, the important airspace parameters are the frequencywith which aircraft pass while having procedural verticalseparation equal to RVSM and no nominal horizontalseparation, and the standard deviation of the error withwhich aircraft maintain assigned track in the lateraldimension. The quantitative statements of the global systemperformance specification are:
a) a passing frequency equal to 2.5 opposite-directionpassings per aircraft flight hour;
b) a standard deviation of lateral path-keeping errorequal to 550 m (0.3 NM); and
c) a probability that two aircraft will lose proceduralvertical separation of RVSM value, Pz(1 000), equalto 1.7 × 10⁻⁸.
The values for passing frequency and the standard deviationof lateral path-keeping were chosen to forecast futureglobal airspace conditions. These choices reflect theintention to ensure that the TLS will continue to be metwith the anticipated increase in global traffic volume andexpected technological improvements in navigation.
2.2.3 The global system performance specification in2.2.2 is based on factoring the frequency with which
aircraft pass, with an actual horizontal separation of lessthan the horizontal size of an aircraft, into a longitudinaland a lateral component. A standard deviation of lateralpath-keeping error of 550 m (0.3 NM) produces aprobability of lateral overlap of 0.058 for aircraft on thesame track. The combined effect of the requirementsof 2.2.2 a) and b) on vertical collision risk is equal to2.5 × 0.058 = 0.145. Therefore, an equivalent but moregenerally applicable quantitative statement of the globalsystem performance specification is:
a) a frequency of opposite-direction passing eventsinvolving lateral overlap equal to 0.145 passings peraircraft flight hour; and
b) a probability that two aircraft will lose proceduralvertical separation of RVSM value, Pz (1 000),equal to 1.7 × 10⁻⁸.
2.2.4 Although the global system performance speci-fication was derived and formulated in terms of opposite-direction traffic, it also applies to other route structures, e.g.same-direction traffic, crossing traffic and combinationsthereof. For each type of route structure, an equivalent formof the global system performance specification exists (forfurther details see 6.2.5 and Appendix A).
Trade-off between globalsystem performance
specification parameters
2.2.5 The parameters of the global system per-formance specification consist of the height-keepingperformance on the one hand and the specified airspaceparameters on the other. This allows for two types oftrade-offs between these parameters, depending on thevalue of the probability of vertical overlap, Pz(1 000), i.e.whether Pz(1 000) is equal to or well below the value of1.7 × 10-8, as defined in the global system performancespecification. However, Pz(1 000) may never be allowed toexceed the value of 1.7 × 10⁻⁸.
2.2.6 The first type of trade-off that may be used isbetween the airspace parameters of passing frequency andthe standard deviation of lateral path-keeping error,provided that the probability of vertical overlap is notgreater than 1.7 × 10⁻⁸. These two airspace parameters maybe traded off against one another provided that their jointeffect on vertical collision risk is not greater than that dueto an opposite-direction passing frequency of 2.5 passingsper aircraft flight hour and a lateral path-keeping error
Chapter 2. General Requirements 2-3
standard deviation of 550 m (0.3 NM). The numericalbound for this joint effect is 0.145 (see also 2.2.3). Thus,either a higher passing frequency in combination with lessaccurate lateral path-keeping or a lower passing frequencyin combination with more accurate lateral path-keepingwould be allowed as long as the bound of 0.145 was notexceeded. Note that this trade-off for opposite-directiontraffic is implicit in the more general form of the globalsystem performance specification in 2.2.3.
2.2.7 The second type of trade-off is between theprobability of vertical overlap, Pz(1 000), and the airspaceparameters, provided that the probability of vertical overlapis well below the value of 1.7 × 10⁻⁸. The margin providedby Pz(1 000) may then be used to increase the upper boundof 0.145 for the combined effect of passing frequency andlateral path-keeping error standard deviation. Within thislarger upper bound, the two airspace parameters may bevaried as set out in 2.2.6. This second type of trade-offshould be performed with great care since the height-keeping performance of the aircraft population may changeover time, e.g. aircraft new to the airspace underconsideration are only required to meet the global Pz(1 000)value of 1.7 × 10⁻⁸ and not a lower value.
2.2.8 It should be noted that conducting the trade-offprocess is more complex than carrying out a straight-forward check against a fixed upper bound. The benefit,however, is more flexibility with regard to the allowableparameter values.
2.3 GLOBAL HEIGHT-KEEPINGPERFORMANCE SPECIFICATION
2.3.1 In order to ensure safe transition betweenregions, a global height-keeping performance specificationwas developed so that, if met, the required Pz(1 000) valueof the global system performance specification would bemet. The global height-keeping performance specificationapplies to the aggregate of height-keeping errors ofindividual aircraft and simultaneously satisfies thefollowing four requirements:
a) the proportion of height-keeping errors beyond90 m (300 ft) in magnitude is less than 2.0 × 10⁻³;
b) the proportion of height-keeping errors beyond150 m (500 ft) in magnitude is less than 3.5 × 10⁻⁶;
c) the proportion of height-keeping errors beyond200 m (650 ft) in magnitude is less than 1.6 × 10⁻⁷;and
d) the proportion of height-keeping errors between290 m and 320 m (950 ft and 1050 ft) in magnitudeis less than 1.7 × 10⁻⁸.
2.3.2 The above requirements have been the basis forthe development of the RVSM minimum aircraft systemperformance specification (MASPS) (see Chapter 4, 4.1).The global height-keeping performance specification is alsoapplied in the process to monitor Pz(1 000) (see Chapter 6,6.2).
3-1
Chapter 3
IMPLEMENTATION PLANNING
3.1 IMPLEMENTATIONCONSIDERATIONS
3.1.1 The introduction of RVSM should be based ona regional air navigation agreement. This may require thatStates or regions establish specially designated airspacewherein aircraft are required to comply with additionalATC procedures and equipment carriage specifications.Application of these requirements and specifications mustbe included in Doc 7030 — Regional SupplementaryProcedures and/or national aeronautical informationpublications where applicable. When this action is taken,all aircraft operating within the designated airspace mustmeet the height-keeping performance as defined in thismanual. The following factors, where applicable, should beconsidered in the process of reaching a decision toimplement RVSM:
a) the costs that operators will incur in order to meetthe RVSM MASPS;
b) system users: types/mix of aircraft (military andcivil); origin and destination of flights; primaryroutes and flight levels; aircraft passing frequency;
c) due account should be taken of:
1) the proportion of the aircraft population thathave been equipped to meet existing require-ments for RVSM operations in other regions;and
2) the requirements imposed by the future RVSMimplementation plans of adjacent regions;
d) airspace organization and ATC system: routestructure (bi/unidirectional and crossing); desig-nated military airspace; flow control procedures;radar/procedural control; availability of secondarysurveillance radar (SSR) or other means of altitudereporting capability; other airspace constraints.Additional consideration should also be given to the
ability of the ATS infrastructure to fully supportRVSM, including examination of the equipmentand procedures necessary to achieve the goal of theelimination of operational errors;
e) in the case of densely populated airspace or wherethe introduction of navigation systems that signifi-cantly improve the lateral track-keeping accuracymay cause violation of the technical TLS,States/regions may need to consider other options toreduce the collision risk, e.g. the application ofsystematic track offsets;
f) the possible effects of regional meteorologicalconditions (e.g. severe turbulence, standing waves);and
g) procedures to assist States in fulfilling theirresponsibilities for ensuring that aircraft on theirregistry, or for which they have a responsibilitybecause they are the State of the Operator, do notoperate in RVSM airspace unless approved to do so.
3.1.2 The lateral and vertical dimensions of theairspace in which RVSM is to be applied must be definedand promulgated in appropriate national and regionaldocumentation.
3.1.3 The table of cruising levels specified inAppendix 3 of Annex 2 to the Convention on InternationalCivil Aviation, for use in RVSM airspace, should be used.
3.2 OPERATING CONDITIONS
A single statement of operating conditions and require-ments cannot encompass the many and varied airspacestructures, meteorological environments, air traffic controlsystems, and air traffic mixes that exist in different Statesand regions. The following provides a basic frameworkwhich should be met as conditions of operation whereRVSM airspace has been established:
Manual on Implementation of a 300 m (1 000 ft) Vertical3-2 Separation Minimum Between FL 290 and FL 410 Inclusive
a) procedures must be developed to provide a transi-tion between RVSM airspace and areas maintaininga 600 m (2 000 ft) VSM;
b) all operations must be conducted in accordancewith instrument flight rules;
c) additional plans and procedures must be developedto ensure separation is maintained in areas wheremeteorological conditions develop that adverselyaffect height-keeping performance (see 5.2.6 to5.2.8). This should include the provision to forecastsuch conditions and to implement contingencyplans when the conditions occur (see 5.2.7).
d) strategic ATC procedures must be developed andimplemented to provide adjustments when systemperformance monitoring indicates that establishedtolerances are exceeded. This action may requirethe introduction of flow control measures, one-wayroutes, systematic offset flying, or other methods;and
e) contingency plans must be developed for in-flightfailures (see 5.1.1g) and 5.2.4).
3.3 IMPLEMENTATION STRATEGY
It is the responsibility of the appropriate RPG to determinewhether or not RVSM should be introduced in the airspaceof a particular region. The following steps, which togetherconstitute an outline implementation strategy, were definedinitially by the RGCSP and further refined as a result of thepractical experience gained from the work in the NAT andEUR Regions. This strategy employs a formal collision riskassessment methodology as a decision-making tool insupport of operational judgement.
a) Step 1 — Identify the need for RVSM. This stepshould be conducted in consultation with providerStates and user organizations and should include anassessment of:
1) the potential for an increase in the airspacesystem capacity;
2) the ability to provide improved vertical flightprofiles to aircraft;
3) the consequences for ATS in terms of:
— workload;
— required facilities;
— resectorization; and
— transition procedures;
4) the costs to non-RVSM approved operators ofhaving to operate outside RVSM airspace;
5) the overall cost/benefit of the implementation ofRVSM; and
6) the state of RVSM implementation in adjacentregions.
b) Step 2 — Preliminary assessment of system safety.This step should be undertaken to determinewhether RVSM can be implemented in the definedairspace in conformance with the agreed safetyobjectives. This step should address conditionsexpected after RVSM implementation, and include:
1) an estimate of the maximum aircraft passingfrequency within the region;
2) an assessment of the typical lateral track keepingaccuracy of RVSM-approved aircraft of theregion;
3) an evaluation of whether a TLS budget of2.5 × 10-9 fatal accidents per flight hour, as aconsequence of technical height-keeping devia-tions, can be satisfied;
4) an analysis of height deviations as a conse-quence of operational errors and emergencyactions. This should assess the frequency ofoccurrence of such deviations together with anassessment of the level of risk of collision in theexisting environment and in the planned RVSMairspace, the causes of the errors, and recom-mended measures to reduce the risk in RVSMairspace. Possible sources of informationinclude:
— incident and/or occurrence reports ofinadvertent departures from assigned flightlevels;
— transponder height data;
— routine position reports that may identifyoperations at an incorrect flight level; and
— specific data collection;
Chapter 3. Implementation Planning 3-3
5) an evaluation of whether the overall riskobjectives (see 2.1) can be satisfied; and
6) consideration of any other operational problemswhich may affect safety, e.g. wake turbulence(see also 6.3).
c) Step 3 — Planning and preparation. This stepshould include:
1) the continued consultation, cooperation andcommitment of regulatory authorities, ATSproviders and airspace users;
2) the development of a detailed work programmeand identification of those issues which lie onthe critical path. The programme shouldincorporate:
— implementation considerations and require-ments (Section 3.1);
— airworthiness issues (Section 4.2);
— procedures for the State approval of aircraft(Section 4.3);
— flight crew operating procedures (Section5.1) and training;
— ATC system requirements, simulations,procedures and training (Section 5.2);
— system performance monitoring consider-ations (Chapter 6);
— if applicable, an agreed means of handlingnon-RVSM approved aircraft;
— completion of any remedial measuresnecessary; and
— possible requirements for phased implement-ation;
3) regional agreement on implementation time-scales.
d) Step 4 — Verification phase. Before commencingthis phase, it is essential that a high proportion ofthe anticipated RVSM aircraft population meetRVSM requirements. Further, an appropriate meansof monitoring aircraft height-keeping should be inplace if sufficient height-keeping data are not
already available. The verification process will takeplace over an agreed period of time during whichthe total system operation will be evaluated in theexisting 600 m (2 000 ft) VSM environment. Thisphase should continue until:
1) it has been demonstrated that RVSM approvalrequirements and related guidance material areadequate, in the sense that compliance withsuch requirements leads to an observed height-keeping performance consistent with the globalheight-keeping performance specification of2.3; and
2) the causes of observed errors inconsistent withthe global height-keeping performance speci-fication have been remedied; and
3) the technical TLS of 2.5 × 10⁻⁹ fatal accidentsper aircraft flight hour has been met with apredetermined level of statistical confidence;
4) the system integrity has been verified; thisshould include confirmation, with a predeter-mined level of statistical confidence, that theintroduction of RVSM does not increase therisk due to operational errors and in-flightcontingencies. This may require theimplementation of additional effective safetymeasures to reduce the risk as a result of theseevents; and
5) if quantification of the level of overall riskindicates, with a predetermined level ofconfidence, that the overall safety objectives(see 2.1) will be violated in an RVSMenvironment, additional effective safetymeasures need to be determined andimplemented in order to meet the overall safetyobjectives.
e) Step 5 — Operational use of RVSM. Thecommencement of the 300 m (1 000 ft) RVSMoperations will be conditional upon the satisfactorycompletion of the 600 m (2 000 ft) verificationphase. At the beginning of the operationalapplication of RVSM, a comprehensive evaluationof all elements of RVSM operations should becarried out. After this evaluation, it will benecessary to ensure continued system safety.Particular attention will be required to ensure that:
1) all aircraft operating in RVSM airspace areRVSM approved;
Manual on Implementation of a 300 m (1 000 ft) Vertical3-4 Separation Minimum Between FL 290 and FL 410 Inclusive
2) the RVSM approval process remains effective;
3) the TLS of 2.5 × 10⁻⁹ fatal accidents per aircraftflight hour (in respect of monitored technicalheight-keeping performance of a representativesample of the aircraft population) continues tobe met with a predetermined level of statisticalconfidence;
4) with a predetermined level of statistical con-fidence, the introduction of RVSM does not
increase the level of risk due to operationalerrors and in-flight contingencies;
5) additional safety measures, introduced toreduce the risk as a result of operational errorsand in-flight contingencies and to meet theoverall safety objectives (see 2.1), are effective;
6) evidence of altimetry system error (ASE)stability exists (see Chapter 6); and
7) ATC procedures remain effective.
4-1
Chapter 4
AIRCRAFT REQUIREMENTS AND APPROVAL
4.1 RVSM HEIGHT-KEEPINGPERFORMANCE
4.1.1 In accordance with the conclusions of theRGCSP/6 Meeting (Doc 9536), altimetry system andaltitude-keeping characteristics were developed to satisfythe global height-keeping performance specification asdescribed in 2.3. They describe the performance level thataircraft need to be capable of achieving in service,exclusive of Human Factors and extreme environmentalinfluences, if the airspace system TVE requirements are tobe satisfied.
4.1.2 The aforementioned characteristics were trans-lated by technical bodies into airworthiness standardsthrough the assessment of the characteristics of ASE andautomatic altitude control. These standards comprise thein-service aircraft height-keeping requirements for RVSMoperations and form part of the RVSM MASPS. The RVSMMASPS include specifications and procedures for theseparate aspects of type approval, release from production,and continued airworthiness and is included in thefollowing documents for global application:
a) Joint Aviation Authority (JAA) TemporaryGuidance Leaflet (TGL) No. 6 — GuidanceMaterial on the Approval of Aircraft and Operatorsfor Flight in Airspace above Flight Level 290 wherea 300 m (1 000 ft) Vertical Separation Minimum isApplied — or any subsequent version thereof; or
b) Federal Aviation Administration (FAA) Document91-RVSM, Interim Guidance Material on theApproval of Operators/Aircraft for RVSMOperations.
These documents are an acceptable means for RVSMapproval and were developed in compliance with theguidance material in this manual.
4.2 AIRWORTHINESS APPROVAL
Introduction
4.2.1 Airworthiness approval must in all cases be inaccordance with the requirements of the RVSM MASPS.As stated in 4.1.2, the RVSM MASPS, in addition tocharacterizing the ASE and automatic height-keepingcapability requirements, also contains specifications andprocedures for type approval and continued airworthiness.
4.2.2 All approvals will be applicable to an individualaircraft or to a group of aircraft, as defined in 4.2.3, that arenominally identical in aerodynamic design and items ofequipment contributing to height-keeping accuracy.
Definition of aircrafttype groupings
4.2.3 For aircraft to be considered as part of a groupfor the purposes of airworthiness approval, the followingconditions should be satisfied:
a) the aircraft should have been constructed to anominally identical design and should be approvedon the same Type Certificate (TC), TC amendment,or Supplemental TC, as applicable;
Note.— For derivative aircraft, it may be possible touse the data from the parent configuration to minimizethe amount of additional data required to showcompliance. The extent of additional data required willdepend on the nature of the differences between theparent aircraft and the derivative aircraft.
b) the static system of each aircraft should benominally identical. The static source error (SSE)corrections should be the same for all aircraft of thegroup; and
Manual on Implementation of a 300 m (1 000 ft) Vertical4-2 Separation Minimum Between FL 290 and FL 410 Inclusive
c) the avionics units installed on each aircraft to meetthe minimum RVSM equipment criteria shouldcomply with the manufacturer’s same specificationand have the same part number.
Note.— Aircraft that have avionics units which areof a different manufacturer or part number may beconsidered part of the group if it can be demonstratedthat this standard of avionics equipment providesequivalent system performance.
4.2.4 If an airframe does not meet the conditions of4.2.3 a) to c) to qualify as a part of a group, and ispresented as an individual airframe for approval, then it willbe considered to be a non-group aircraft. The significanceof this is that the certification processes for group andnon-group aircraft are different.
Continued airworthiness
4.2.5 It is imperative that all aircraft continue, duringtheir service life, to satisfy the requirements of the RVSMMASPS. While height-monitoring data from independentsources, as recommended by ICAO, should help to detectany long-term deterioration in altimetry system perform-ance, it is nevertheless essential that certifying authoritiesensure that, as part of the approval process, operatormaintenance and inspection practices are reviewed andupdated to reflect the specific airworthiness requirementsapplicable to RVSM operations.
4.3 STATE RVSM APPROVAL
Approval process
4.3.1 Where RVSM is applied, the specific aircrafttype or types that the operator intends to use will need tobe approved by the State of Registry of the aircraft or of theaircraft operator. RVSM approval will encompass thefollowing elements:
a) Airworthiness approval (including continuedairworthiness). The aircraft will be approved asmeeting the requirements of the appropriate Stateairworthiness document derived from the height-keeping capability requirements as defined by theRVSM MASPS. Furthermore, the aircraft altimetryand height-keeping equipment must be maintainedin accordance with approved procedures andservicing schedules.
b) Operational approval. As defined by ICAO regionalair navigation agreements, it may be necessary for anoperator to hold a separate RVSM-specificoperational approval in addition to an RVSMairworthiness approval to operate in RVSM airspace.Section 5.1 contains guidance on operationalprocedures that an operator may need to adopt forsuch airspace where RVSM is applied, includingadvice on the material that may need to be submittedfor review by the authority responsible.
Validity of approval
4.3.2 RVSM approval issued for one region will alwaysbe valid for RVSM operations in another region provided thatspecific operational approval as in 4.3.1 b) is not required.
Confirmation of approval status
4.3.3 Implementation of RVSM is dependent on theestablishment of an aircraft approval confirmation process,which is intended to exclude unqualified aircraft andoperators from operating in RVSM airspace unless theappropriate separation is applied. The process may haveregional variations, but the primary responsibility forconfirmation of the approval status of an aircraft/operatormust rest with the State of the Operator/State of Registry.The confirmation process will be facilitated by theapplication of the following measures:
a) maintaining a comprehensive record of allapprovals granted for operations in RVSM airspace;
b) providing the approvals records in 4.3.3 a) to theregional monitoring agency (RMA) for inclusion inits regional RVSM-approvals database; and
c) including a check of the approval status ofaircraft/operators in the schedule of routine in-flightinspections.
4.3.4 At the appropriate level, a secondary responsi-bility should rest with the ATS provider States to instituteroutine checks of the approval status of aircraft operatingwithin their area of authority and intending to operate inRVSM airspace. This responsibility could be met by:
a) scrutinizing ATS flight plans;
b) conducting cross-checks against the regionalRVSM-approvals database, taking into account thecurrency of its contents; and
Chapter 4. Aircraft Requirements and Approval 4-3
c) querying operators that are suspected of not beingin compliance with the airspace requirements.
4.3.5 Dependent on State regulations, clearances maybe withheld for operations that are not in compliance withthe airspace requirements.
4.3.6 In conjunction with the ATS provider States, afurther level of confirmation of approval can be effected bythe RMA of a region in which RVSM applies. This can beachieved by the RMA taking action, following a query bya controlling authority, to obtain confirmation of approval
status from the State of the Operator/State of Registry ofaircraft which are not listed in a regional RVSM-approvalsdatabase.
Note.— The role of the RMA is covered in detail in6.4.4.
4.3.7 The State of the Operator/State of Registryshould formulate policies and courses of action with respectto aircraft/operators that are found to be operating in RVSMairspace without approval, which could jeopardize thesafety of other users of the airspace.
A-1
Appendix A
QUANTITATIVE ASPECTS OFSYSTEM PERFORMANCE MONITORING
1. INTRODUCTION
1.1 This appendix provides guidance concerning thequantitative aspects of independent system performancemonitoring associated with implementation and continueduse of a reduced vertical separation minimum in anairspace. It includes the assembly, treatment and use of datanecessary to demonstrate that compliance with the globalsystem performance specification in Chapter 2, 2.2 issatisfactory. Extensive information is presented on thevertical overlap probability, Pz(1 000). This appendix alsopresents a height-keeping performance verification processfor the implementation of RVSM and contains an examplethat illustrates calculations of sample-size requirementsassociated with the verification phase of the implement-ation strategy in a hypothetical region.
1.2 More details on the material in this appendix canbe found in regional guidance material, such as theSupplement to NAT Doc 002 on risk assessment andmonitoring aspects in the context of NAT RVSM.
1.3 It is important to note that the guidance in thisappendix focuses primarily on the assessment of risk due totechnical height-keeping deviations. When assessing thesuitability of a region for RVSM implementation, con-sideration should also be given to the risk due tooperational errors and in-flight contingencies. Someinformation on this aspect is given in Section 5 of thisappendix.
2. COLLISION RISK ASSESSMENT
Introduction
2.1 The use of analytical methods to guide decision-makers on the safety of an activity is generally referred toas risk assessment. Such an assessment consists of two
elements: risk estimation and risk evaluation. Riskestimation refers to the process of determining the expectedlevel of risk that will result from the activity or proposalunder consideration. Risk evaluation refers to the process ofdeciding whether such a level of risk is acceptable.
2.2 The term risk is used to represent a numericalindex of safety. When applied to any particular problem, aformal definition of risk requires specification of the unitsin which it will be measured. For the purpose of collisionrisk assessment, the units adopted here are fatal accidentsper aircraft flight hour.
2.3 The risk estimation method consists of using aCRM, which expresses the risk of a mid-air collision in anairspace in terms of a number of quantifiable parameters.The risk evaluation method consists of determining thatlevel of risk which is deemed acceptable, termed the targetlevel of safety (TLS). It is against the TLS that theestimated risk can be compared, providing a quantitativebasis for judging the safety of operations in an airspace.
The collision risk model
2.4 The risk of collision to be modelled is that due tothe loss of procedural vertical separation between aircraftflying above FL 290 in a given portion of an airspace. Onecollision between two aircraft is counted as the occurrenceof two accidents. The risk of collision depends both on thetotal number and types of aircraft flying in the system andthe system characteristics.
2.5 The CRM provides an estimate of the number ofaccidents within an airspace system that might occur peraircraft flight hour due to aircraft collisions resulting fromthe loss of procedural vertical separation in an RVSMenvironment.
2.6 The basic model, which can be applied equiv-alently to vertical, lateral and longitudinal separation
Manual on Implementation of a 300 m (1 000 ft) VerticalA-2 Separation Minimum Between FL 290 and FL 410 Inclusive
analysis, is expressed in terms of quantifiable parameters.In the vertical dimension the CRM can be broken down inorder to separately model a single route on which aircraftare flying in the same or opposite directions at adjacentflight levels, pairs of crossing routes and combinations ofindividual and intersecting routes. A full description of theCRM can be found in the Report of the Sixth Meeting(RGCSP/6, Doc 9536) of the Review of the GeneralConcept of Separation Panel, and its associatedappendices.
2.7 Three parameters used within the basic model: thevertical overlap probability, denoted as Pz(1 000); thelateral overlap probability, denoted as Py(0); and the aircraftpassing frequency, are the most important quantities indetermining the vertical collision risk. Of these, the verticaloverlap probability is the most difficult to estimate.
2.8 The global system performance specificationstated in Chapter 2, 2.2 limits the maximum valuesassociated with each of these parameters to ensure anacceptable level of collision risk due to the loss ofprocedural vertical separation throughout worldwideairspace. The global height-keeping performance speci-fication stated in Chapter 2, 2.3 presents requirements forthe height-keeping performance necessary to satisfy thePz(1 000) of the global system performance specification.
2.9 For crossing traffic and “direct-to” clearances, thegeneralized form of the global system performancespecification stated in 2.2.3 is more appropriate. This formlimits the maximum values for the vertical overlapprobability and the frequency of aircraft passings involvinghorizontal overlap to ensure an acceptable level of collision
risk due to the loss of procedural vertical separationthroughout worldwide airspace.
2.10 Section 3 of this appendix discusses themonitoring of the lateral overlap probability and the aircraftpassing frequency. Section 4 outlines possible methods formonitoring the vertical overlap probability and assessingwhether the associated height-keeping performancespecification is being met.
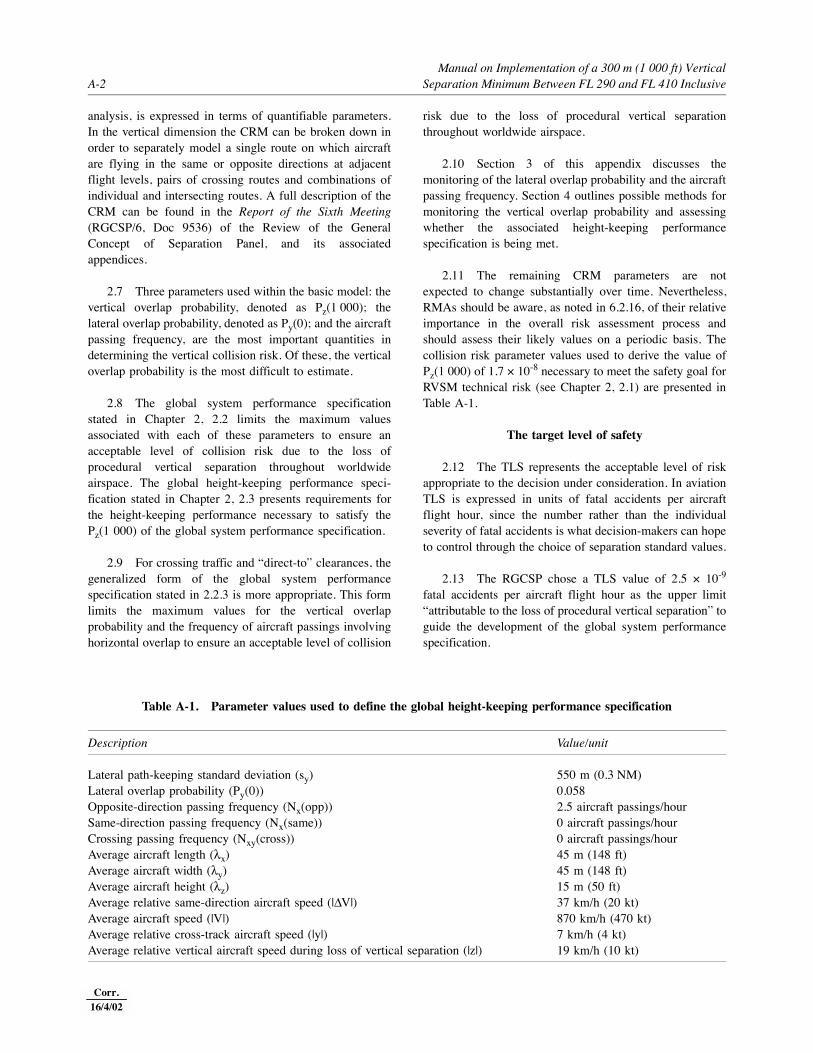
2.11 The remaining CRM parameters are notexpected to change substantially over time. Nevertheless,RMAs should be aware, as noted in 6.2.16, of their relativeimportance in the overall risk assessment process andshould assess their likely values on a periodic basis. Thecollision risk parameter values used to derive the value ofPz(1 000) of 1.7 × 10⁻⁸ necessary to meet the safety goal forRVSM technical risk (see Chapter 2, 2.1) are presented inTable A-1.
The target level of safety
2.12 The TLS represents the acceptable level of riskappropriate to the decision under consideration. In aviationTLS is expressed in units of fatal accidents per aircraftflight hour, since the number rather than the individualseverity of fatal accidents is what decision-makers can hopeto control through the choice of separation standard values.
2.13 The RGCSP chose a TLS value of 2.5 × 10⁻⁹
fatal accidents per aircraft flight hour as the upper limit“attributable to the loss of procedural vertical separation” toguide the development of the global system performancespecification.
Table A-1. Parameter values used to define the global height-keeping performance specification
Description Value/unit
Lateral path-keeping standard deviation (sy) 550 m (0.3 NM)Lateral overlap probability (Py(0)) 0.058Opposite-direction passing frequency (Nx(opp)) 2.5 aircraft passings/hourSame-direction passing frequency (Nx(same)) 0 aircraft passings/hourCrossing passing frequency (Nxy(cross)) 0 aircraft passings/hourAverage aircraft length (!x) 45 m (148 ft)Average aircraft width (!y) 45 m (148 ft)Average aircraft height (!z) 15 m (50 ft)Average relative same-direction aircraft speed (|"V|) 37 km/h (20 kt)Average aircraft speed (|V|) 870 km/h (470 kt)Average relative cross-track aircraft speed (|y|) 7 km/h (4 kt)Average relative vertical aircraft speed during loss of vertical separation (|z|) 19 km/h (10 kt)
Corr.16/4/02
Appendix A. Quantitative Aspects of System Performance Monitoring A-3
Note.— The TLS of 2.5 × 10⁻⁹ fatal accidents peraircraft flight hour applies only to technical height-keepingerrors.
3. MONITORING AIRCRAFT PASSING FREQUENCY AND LATERAL
NAVIGATION PERFORMANCE
3.1 Ensuring that the aircraft passing frequency andlateral navigational performance in an airspace areconsistent with the global system performance specificationis a requirement for introducing RVSM into an airspace.After its introduction, monitoring of these parameters isnecessary in accordance with Chapter 6 of this manual. Thefollowing presents procedures for estimating and testing theparameters in accordance with these requirements.
Monitoring passing frequency
Introduction
3.2 The proportion of time during which aircraft atadjacent flight levels are exposed to the risk of collision dueto the loss of procedural vertical separation is accounted forin the global system performance specification by defininga maximum frequency of opposite-direction passings ofaircraft on the same route. This value, 2.5 passings peraircraft flight hour, was chosen to accommodate growth inglobal traffic over the planning horizon set in this manual.In practice, exposure may occur due to aircraft passings inthe same or opposite directions on the same route atadjacent flight levels or due to passings of aircraft atadjacent flight levels on separate routes at a crossing point.(A closely related parameter often used in oceanic tracksystems is “occupancy”, which is a measure of the numberof aircraft at adjacent flight levels within a specifieddistance of a typical aircraft). Independent systemperformance monitoring requires that the combined effectof the frequency of these various types of passings beestimated using traffic movement data from RVSMairspace, or simulated data prior to RVSM implementation,and be compared to 2.5 opposite-direction aircraft passingsper flight hour. These estimates should be determined overthe whole airspace of three adjacent ACCs covering theregion’s busiest traffic flows or highest passing frequency,in order to address the problem of high traffic flows wherehigher-than-average collision risk may pertain.
3.3 The overall approach to estimating the frequencyof the various types of aircraft passings is presented in 3.4to 3.13 below. Procedures for comparing the combined
effect of the estimated frequency to that used in developingthe global height-keeping performance specification arepresented in 3.14 to 3.19 below.
Estimating aircraft passing frequency
Data required
3.4 Aircraft flight data in the form of flight progressstrips, or the equivalent, are necessary to estimate thepassing frequency (or occupancy, where appropriate). Thedata should reflect the range of traffic flows in RVSMairspace consistent with the requirements of Chapter 2, 2.2,occasioned by daily, weekly and seasonal fluctuations indemand. Such sampling has been accomplished in practiceby choosing a specific date or week of the month andgathering traffic movement data (actual or simulated) at thattime for a year.
3.5 Originally, studies of aircraft passing frequencyused flight strip data as the primary source of information.Alternative methods may be used in order to monitoraircraft passings on a continuous basis by automaticsystems using radar tracking data. Such methods require anaircraft passing to be defined in terms of a volume ofairspace within which the two aircraft must be contained.
Use of radar data
3.6 Because of the many crossing routes and anincreasing number of “direct-to” clearances in the EURRegion, the feasibility of using radar data for estimating thefrequency of passing events involving horizontal overlaphas been established. The basic principle remains the sameas with the use of flight progress strips, i.e. calculating thetotal number of passing events, multiplying by 2 anddividing by the total number of flight hours above FL 290in straight and level flight.
3.7 The following time- and flow-related data shouldbe obtained from the radar tracks for each ACC sector:
a) the time during which radar tracks were recorded;
b) the total number of aircraft within the sector;
c) the flow rate (per hour at each flight level) acrossthe sector boundary;
d) the total number of flight hours in level flight,classified by nearest flight level; and
e) the total number of flight hours in climb/descent,classified by adjacent flight levels.
Manual on Implementation of a 300 m (1 000 ft) VerticalA-4 Separation Minimum Between FL 290 and FL 410 Inclusive
Estimating the passing frequency of aircraft on same- and opposite-direction routes
3.8 All routes within the three adjacent ACCs shouldbe examined on an individual basis when estimating aircraftpassing frequency or occupancy. If this is not practical, careshould be taken that the routes analysed providerepresentative estimates. Each route should be divided intosegments, for example, by reporting points or navigationaid locations. The traffic movement data, organized byflight level on each segment, must then be examined eithermanually or automatically to determine the number of pairsof aircraft at adjacent flight levels that pass each other inthe same or in opposite directions. The number of same-and opposite-direction aircraft passings should then becombined with similar counts from all other route segmentsanalysed. The sum of the overall same- andopposite-direction aircraft passings should then bemultiplied by 2 and divided by the total number of flighthours above FL 290 in straight and level flight on thesegments during the periods analysed, giving the same- andopposite-direction aircraft passing frequency estimates. Ifoccupancy analysis is deemed appropriate, verticaloccupancy can be estimated in a manner analogous to thatfor estimating lateral occupancy shown in the Air TrafficServices Planning Manual (Doc 9426), Part II, Section 2,Chapter 4, Appendix C.
Estimating aircraft passing frequency on crossing routes
3.9 After identifying crossing routes within the threeadjacent ACCs, the aircraft passing frequency at all thecrossing points should be estimated. If this is not practical,care should be taken that the crossings analysed providerepresentative estimates. The number of aircraft pairsinvolving horizontal overlap at crossing points should becounted, multiplied by 2 and divided by the total flight timein the sampled RVSM airspace to produce an estimate ofthe crossing passing frequency.
3.10 Aircraft passings involving horizontal overlap atroute crossing points are rare events and their frequency isdifficult to measure. Nonetheless, it is possible to estimatethis frequency; traffic flows representative of crossingroutes may be used in a model similar to that which ispresented in Doc 9426.
3.11 In busy continental airspace, flights are generallyunder radar surveillance and subject to tactical control byATC. This leads to highly complex and, frequently, veryvariable traffic patterns with the actual tracks flown oftendeviating from the published ATS routes and crossing at a
variety of angles. As a result, it is not possible to accuratelyestimate a frequency of passing events just based on theinformation on traffic flows on the ATS routes.
3.12 A realistic picture of the actual traffic patternscan be obtained from radar data. From the radar data it canbe determined first of all whether a pair of aircraft passwithin a specified volume of airspace. If this is the case, itcontributes to the frequency of such passing events in theairspace considered. The actual relative velocity can also beestimated from the radar data. This information can then beprocessed in a way similar to that for an airspace withcrossing routes.
3.13 Like aircraft passing events involving horizontaloverlap at crossing points, passing events for direct routingsinvolving horizontal overlap are rare events and difficult toestimate. The problem can be addressed by suitablydefining vertical proximate events.
Checking aircraft passing frequency
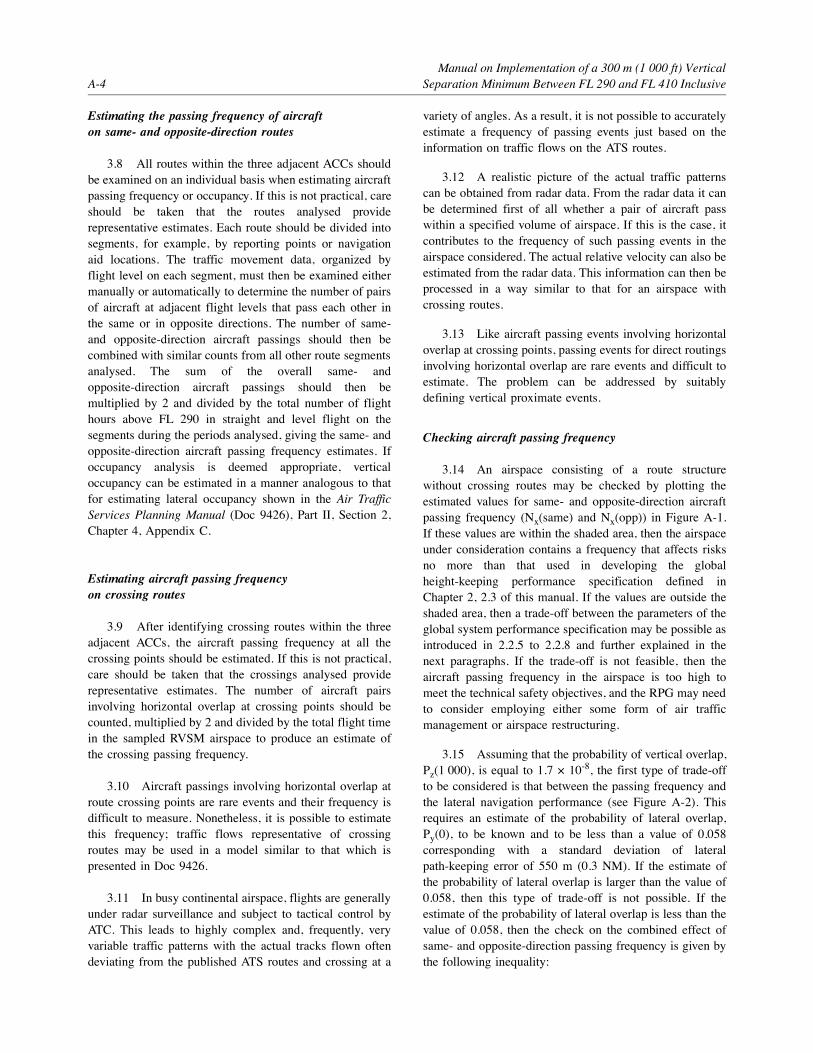
3.14 An airspace consisting of a route structurewithout crossing routes may be checked by plotting theestimated values for same- and opposite-direction aircraftpassing frequency (Nx(same) and Nx(opp)) in Figure A-1.If these values are within the shaded area, then the airspaceunder consideration contains a frequency that affects risksno more than that used in developing the globalheight-keeping performance specification defined inChapter 2, 2.3 of this manual. If the values are outside theshaded area, then a trade-off between the parameters of theglobal system performance specification may be possible asintroduced in 2.2.5 to 2.2.8 and further explained in thenext paragraphs. If the trade-off is not feasible, then theaircraft passing frequency in the airspace is too high tomeet the technical safety objectives, and the RPG may needto consider employing either some form of air trafficmanagement or airspace restructuring.
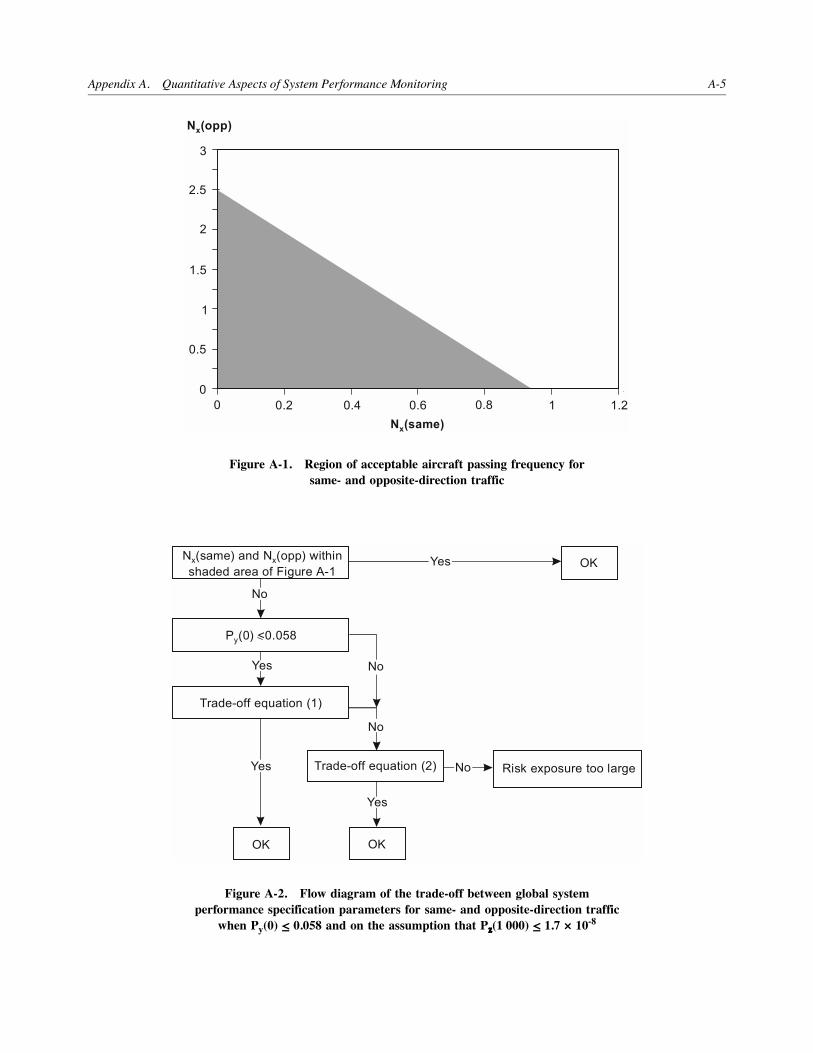
3.15 Assuming that the probability of vertical overlap,Pz(1 000), is equal to 1.7 × 10⁻⁸, the first type of trade-offto be considered is that between the passing frequency andthe lateral navigation performance (see Figure A-2). Thisrequires an estimate of the probability of lateral overlap,Py(0), to be known and to be less than a value of 0.058corresponding with a standard deviation of lateralpath-keeping error of 550 m (0.3 NM). If the estimate ofthe probability of lateral overlap is larger than the value of0.058, then this type of trade-off is not possible. If theestimate of the probability of lateral overlap is less than thevalue of 0.058, then the check on the combined effect ofsame- and opposite-direction passing frequency is given bythe following inequality:
Appendix A. Quantitative Aspects of System Performance Monitoring A-5
Figure A-1. Region of acceptable aircraft passing frequency forsame- and opposite-direction traffic
Figure A-2. Flow diagram of the trade-off between global systemperformance specification parameters for same- and opposite-direction traffic
when Py(0) < 0.058 and on the assumption that P(1 000) < 1.7 × 10⁻⁸
Manual on Implementation of a 300 m (1 000 ft) VerticalA-6 Separation Minimum Between FL 290 and FL 410 Inclusive
(1)
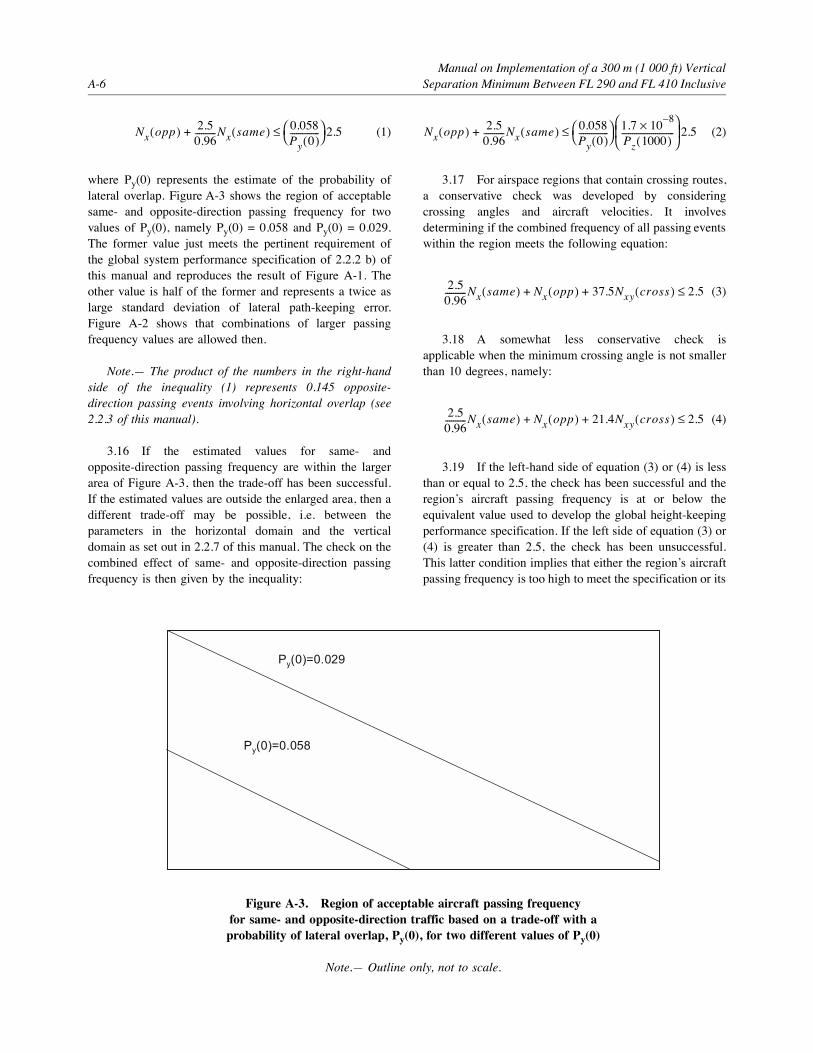
where Py(0) represents the estimate of the probability oflateral overlap. Figure A-3 shows the region of acceptablesame- and opposite-direction passing frequency for twovalues of Py(0), namely Py(0) = 0.058 and Py(0) = 0.029.The former value just meets the pertinent requirement ofthe global system performance specification of 2.2.2 b) ofthis manual and reproduces the result of Figure A-1. Theother value is half of the former and represents a twice aslarge standard deviation of lateral path-keeping error.Figure A-2 shows that combinations of larger passingfrequency values are allowed then.
Note.— The product of the numbers in the right-handside of the inequality (1) represents 0.145 opposite-direction passing events involving horizontal overlap (see2.2.3 of this manual).
3.16 If the estimated values for same- andopposite-direction passing frequency are within the largerarea of Figure A-3, then the trade-off has been successful.If the estimated values are outside the enlarged area, then adifferent trade-off may be possible, i.e. between theparameters in the horizontal domain and the verticaldomain as set out in 2.2.7 of this manual. The check on thecombined effect of same- and opposite-direction passingfrequency is then given by the inequality:
(2)
3.17 For airspace regions that contain crossing routes,a conservative check was developed by consideringcrossing angles and aircraft velocities. It involvesdetermining if the combined frequency of all passing eventswithin the region meets the following equation:
(3)
3.18 A somewhat less conservative check isapplicable when the minimum crossing angle is not smallerthan 10 degrees, namely:
(4)
3.19 If the left-hand side of equation (3) or (4) is lessthan or equal to 2.5, the check has been successful and theregion’s aircraft passing frequency is at or below theequivalent value used to develop the global height-keepingperformance specification. If the left side of equation (3) or(4) is greater than 2.5, the check has been unsuccessful.This latter condition implies that either the region’s aircraftpassing frequency is too high to meet the specification or its
Nx opp( ) 2.50.96----------Nx same( ) 0.058
Py 0( )--------------# $% & 2.5'+ Nx opp( ) 2.5
0.96----------Nx same( ) 0.058Py 0( )--------------# $
% & 1.7 10 8–(Pz 1000( )-------------------------
# $) *% &
2.5'+
2.50.96----------Nx same( ) Nx opp( ) 37.5Nxy cross( ) 2.5'+ +
2.50.96----------Nx same( ) Nx opp( ) 21.4Nxy cross( ) 2.5'+ +
Figure A-3. Region of acceptable aircraft passing frequencyfor same- and opposite-direction traffic based on a trade-off with a
probability of lateral overlap, Py(0), for two different values of Py(0)
Note.— Outline only, not to scale.
Appendix A. Quantitative Aspects of System Performance Monitoring A-7
combination of crossing angles and aircraft velocities areoutside the ranges considered in developing the check forinequality. If this situation applies, aircraft passingfrequency may be calculated using model parameters fromthe respective regions. The above inequality may also beused in place of Figure A-1 when there are no crossingroutes by setting Nxy(cross) to zero.
Monitoring lateralnavigational performance
3.20 As lateral navigational performance in anairspace improves, the risk of collision due to the loss ofprocedural vertical separation increases. This paradoxicaleffect requires that actual lateral path-keeping performancein RVSM airspace be examined to ensure that assumptionsmade in developing the global height-keeping performancespecification are not violated.
3.21 Lateral navigational performance influenceddetermination of the global height-keeping performancespecification through the standard deviation of lateralpath-keeping. Assuming a first Laplace distribution oflateral path-keeping, the lateral overlap probability, Py(0),may be represented symbolically as:
(5)
where !y is the average aircraft width and +y is thestandard deviation of lateral path-keeping. As shown inTable A-1, a standard deviation of 550 m (0.3 NM)representing a population of aircraft all equipped with asimilar precision area navigation (RNAV) system has beenassumed.
3.22 When different types of navigation systems arepresent, an estimate of the overall variance is obtained byweighting the individual variances with the proportions ofaircraft equipped with each type of navigation system. Tocheck a lateral navigation performance is straightforward:the estimated standard deviation value should be greaterthan that used to develop the global height-keepingperformance specification (i.e. 550 m (0.3 NM)).
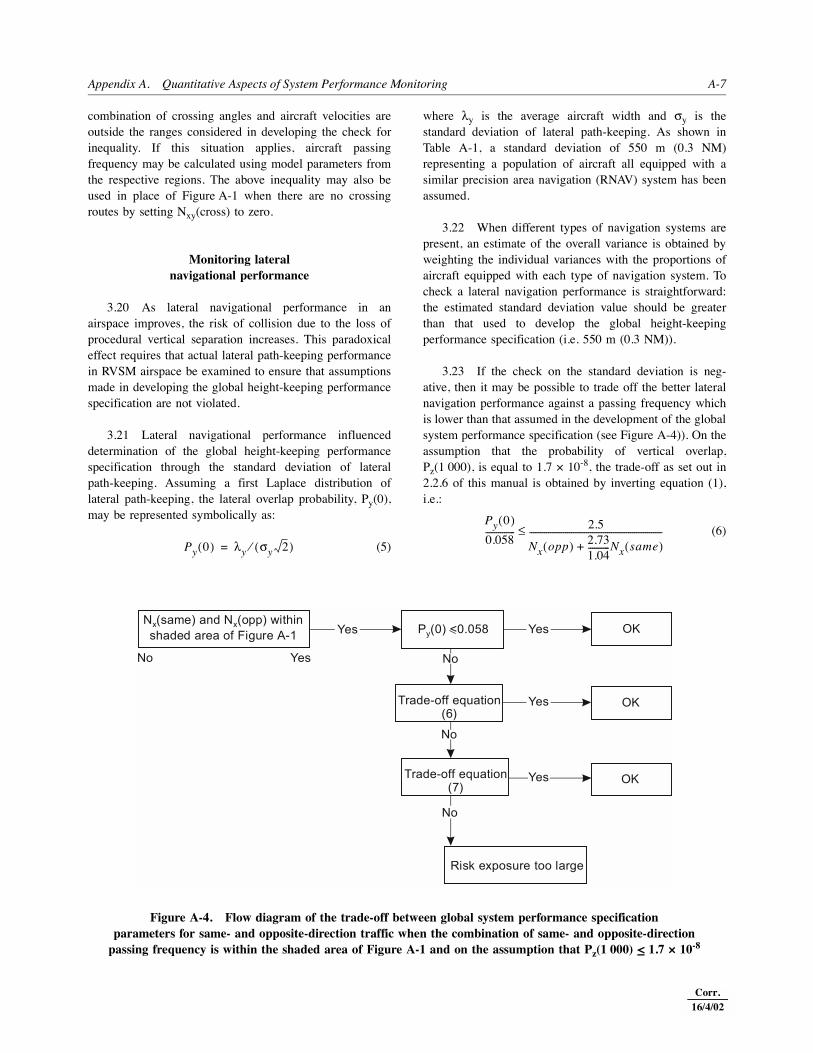
3.23 If the check on the standard deviation is neg-ative, then it may be possible to trade off the better lateralnavigation performance against a passing frequency whichis lower than that assumed in the development of the globalsystem performance specification (see Figure A-4)). On theassumption that the probability of vertical overlap,Pz(1 000), is equal to 1.7 × 10⁻⁸, the trade-off as set out in2.2.6 of this manual is obtained by inverting equation (1),i.e.:
(6)Py 0( ) !y +y 2( )⁄=
Py 0( )0.058-------------- 2.5
Nx opp( ) 2.731.04----------Nx same( )+
---------------------------------------------------------------'
Figure A-4. Flow diagram of the trade-off between global system performance specificationparameters for same- and opposite-direction traffic when the combination of same- and opposite-direction
passing frequency is within the shaded area of Figure A-1 and on the assumption that Pz(1 000) < 1.7 × 10⁻⁸
Corr.16/4/02
Manual on Implementation of a 300 m (1 000 ft) VerticalA-8 Separation Minimum Between FL 290 and FL 410 Inclusive
The denominator in the right-hand side of equation (6) willbe smaller than the value of 2.5 if the combined passingfrequency of all aircraft passing events is within theacceptable area of Figure A-1. The right-hand side will thenbe greater than one (1), which defines the margin by whichPy(0) may exceed its original bound of 0.058, without beinginconsistent with the horizontal part of the global systemperformance specification. The margin on Py(0) can bedirectly translated into a margin on the standard deviation+y of the lateral path-keeping error distribution by means ofequation (5).
3.24 If the trade-off in 2.2.6 of this manual is notpossible, it may finally be examined whether a trade-offbetween the vertical and horizontal domains as set out in2.2.7 is feasible. Thus, on the assumption that theprobability of vertical overlap, Pz(1 000), is well below thevalue of 1.7 × 10⁻⁸, the trade-off is obtained by invertingequation (2), i.e.:
(7)
3.25 The first ratio in the right-hand side of equation(7) provides the margin due to Pz(1 000) being well belowthe bound of 1.7 × 10⁻⁸, for example 1.7 × 10⁻⁹. This ratiothen results in a factor of 10. The resulting margin for Py(0)is dependent on the value of the passing frequency asshown by the second ratio in the right-hand side of equation(7). If the estimated values of the two passing frequencycomponents were within the allowable area of Figure A-1,then this provides some additional margin (which in itselfwas insufficient to cover the higher lateral navigationperformance as described for the first type of trade-off in3.21). If the estimated values of the two passing frequencycomponents were outside the allowable area of Figure A-1,then the second ratio is less than one and takes up part (orall) of the margin provided by the vertical dimension (thiswill already have been found independently in the check onpassing frequency, cf. 3.13 to 3.15). Thus, the ultimatemargin for Py(0) is given by the full right-hand side ofequation (7).
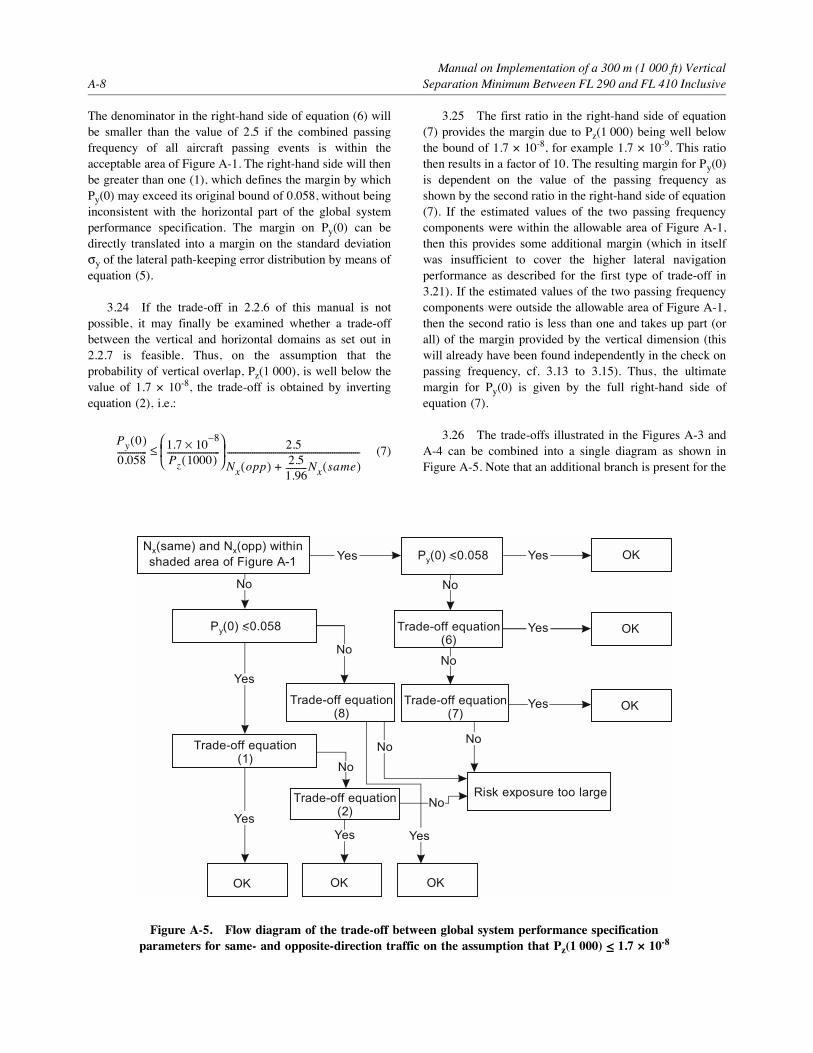
3.26 The trade-offs illustrated in the Figures A-3 andA-4 can be combined into a single diagram as shown inFigure A-5. Note that an additional branch is present for the
Py 0( )0.058-------------- 1.7 10 8–(
Pz 1000( )-------------------------# $) *% & 2.5
Nx opp( ) 2.51.96----------Nx same( )+
---------------------------------------------------------------'
Figure A-5. Flow diagram of the trade-off between global system performance specificationparameters for same- and opposite-direction traffic on the assumption that Pz(1 000) < 1.7 × 10⁻⁸
Appendix A. Quantitative Aspects of System Performance Monitoring A-9
case where Nx(same) and Nx(opp) are not within the shadedarea of Figure A-1 and Py(0) is not less than or equal to0.058. In that case, the trade-off in 2.2.7 of this manualbetween the probability of vertical overlap and the airspaceparameters may still be possible. The corresponding trade-off equation is given by:
(8)
Application of the checking process to airspacestudied by the RGCSP
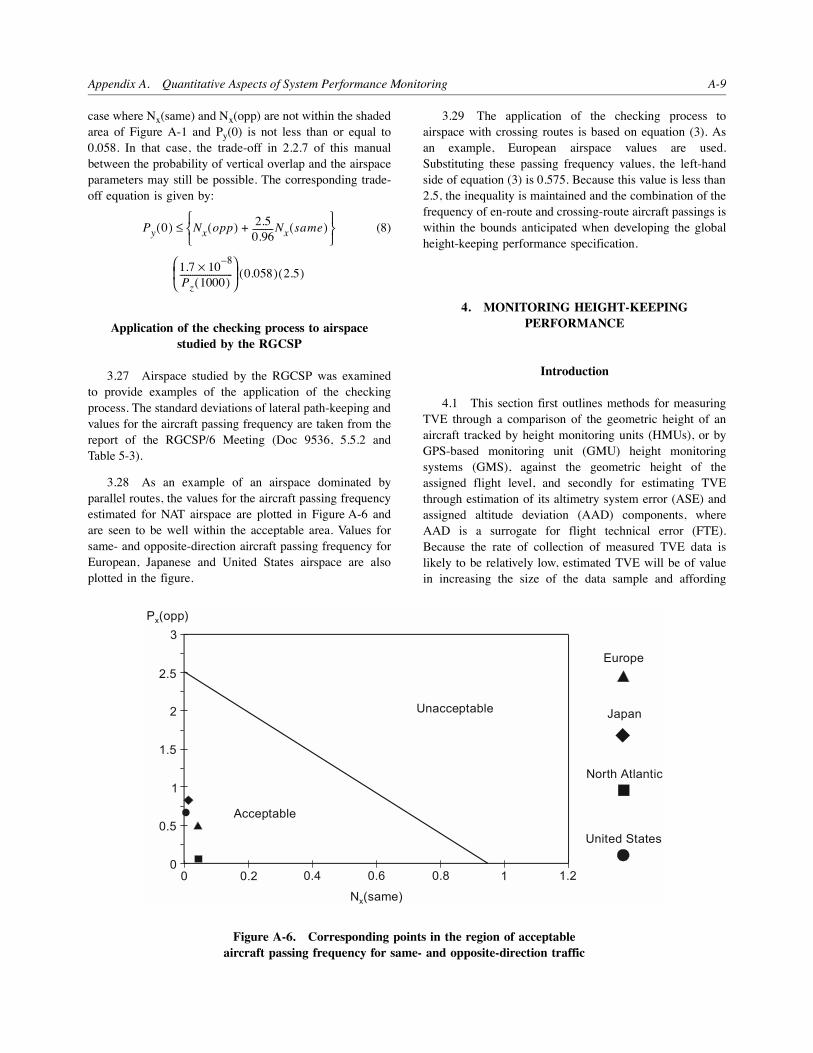
3.27 Airspace studied by the RGCSP was examinedto provide examples of the application of the checkingprocess. The standard deviations of lateral path-keeping andvalues for the aircraft passing frequency are taken from thereport of the RGCSP/6 Meeting (Doc 9536, 5.5.2 andTable 5-3).
3.28 As an example of an airspace dominated byparallel routes, the values for the aircraft passing frequencyestimated for NAT airspace are plotted in Figure A-6 andare seen to be well within the acceptable area. Values forsame- and opposite-direction aircraft passing frequency forEuropean, Japanese and United States airspace are alsoplotted in the figure.
3.29 The application of the checking process toairspace with crossing routes is based on equation (3). Asan example, European airspace values are used.Substituting these passing frequency values, the left-handside of equation (3) is 0.575. Because this value is less than2.5, the inequality is maintained and the combination of thefrequency of en-route and crossing-route aircraft passings iswithin the bounds anticipated when developing the globalheight-keeping performance specification.
4. MONITORING HEIGHT-KEEPING PERFORMANCE
Introduction
4.1 This section first outlines methods for measuringTVE through a comparison of the geometric height of anaircraft tracked by height monitoring units (HMUs), or byGPS-based monitoring unit (GMU) height monitoringsystems (GMS), against the geometric height of theassigned flight level, and secondly for estimating TVEthrough estimation of its altimetry system error (ASE) andassigned altitude deviation (AAD) components, whereAAD is a surrogate for flight technical error (FTE).Because the rate of collection of measured TVE data islikely to be relatively low, estimated TVE will be of valuein increasing the size of the data sample and affording
Py 0( ) Nx opp( ) 2.50.96----------Nx same( )+
, -. /0 1'
1.7 10 8–(Pz 1000( )-------------------------
# $) *% &
0.058( ) 2.5( )
Figure A-6. Corresponding points in the region of acceptableaircraft passing frequency for same- and opposite-direction traffic
Manual on Implementation of a 300 m (1 000 ft) VerticalA-10 Separation Minimum Between FL 290 and FL 410 Inclusive
greater statistical confidence that the global height-keepingperformance specification has been met. It is important tonote, however, that the component error methodology forestimating TVE is dependent upon the availability ofmeasured TVE from which to derive a value for ASE.
General approach
4.2 A four-element approach for the collection andassessment of height-keeping performance data in theverification phase is proposed in the following fourparagraphs. This approach may allow the regional planninggroup to gain a growing statistical confidence in meetingthe safety and monitoring objectives throughout theverification phase. The four elements will be conductedsimultaneously with each stage building one upon the other.In the first step, examining typical performance will includeestimating ASE values. Those aircraft with marginallyacceptable ASEs (aberrant aircraft) or those that developlarge values (non-compliant aircraft) are of major concernsince the presence of a small number of such aircraft woulddegrade system safety. The second element of the processconsists of conducting an ASE census in order to examineand eliminate, with a high degree of confidence, anyexcessive ASE. The third element counts the number oflarge errors that directly affect risk and provides theassociated confidence level for the target levels of safety.Finally, the process involves determining if the globalheight-keeping performance specification has been met.
4.3 The first element of the data evaluation consists ofexamining the typical height-keeping performance ofaircraft, with a given level of confidence, by identifying thenumber of TVE, ASE and AAD values beyond thetolerance limits given in 6.4.5 and counting the number ofoccurrences of each value. In addition, height-keepingperformance should be examined in order to detect adversetrends that could ultimately result in unacceptableperformance. This examination will focus on performanceexhibited by individual aircraft types and operators, withanalysis of mean TVE, ASE, and AAD performance andvariability about the means. This examination should berepeated periodically throughout the four-element process.
4.4 The second element of the four-element processconsists of conducting the ASE census. It will, of course,take a longer time to complete than the first element sinceits primary goal is to obtain estimates of the ASE of everyaircraft and to identify those that exceed the ASE tolerancelimit of 6.4.5 a) so that follow-up corrective action can betaken. When such a census cannot be conducted, it isnecessary to obtain a representative sample which, at aminimum, contains a census of the RVSM MASPS-
approved aircraft types and data on every combination ofaircraft/operator pairing. For example, in the NAT RVSMprogramme, somewhere in the order of 80 per cent of thepredicted population were monitored as part of theverification phase. On the basis of the quality of thecollected data, it was adjudged to be representative of thepopulation. A suggested approach to dealing with thecollected ASE data is described in this appendix.
4.5 The third element of the quantitative evaluationconsists of providing an indication of the currently achievedlevel of safety and the level of confidence that is beingattained within the system as early as possible. Riskestimation based on probability distribution fitting and/orcontrol charts for critically large ASEs, TVEs and AADs,similar to those described for typical height-keepingperformance, will be applied. This element should alsoinclude an evaluation of the level of risk caused byoperational errors and emergency actions.
4.6 The objective of the fourth element is todemonstrate compliance with the global height-keepingperformance specification. This objective will continue tobe pursued after the introduction of RVSM.
TVE component errors
Introduction
4.7 The TVE of an aircraft is taken to be the result ofthe statistically independent and additive contributions ofcontemporaneous errors in the aircraft’s altimetry andaltitude-keeping systems. These two component errors ofTVE are considered to have different characteristics.
4.8 Estimation of the ASE and AAD of an aircraft ispossible during independent system performancemonitoring operations. These component error estimatesare necessary in order to support the risk-reduction goal ofmonitoring so that any observed instances of large TVE canbe classified in regard to the height-keeping subsystemwhich is likely to be at fault.
Estimation of ASE
4.9 The ASE of an aircraft is expected to vary withinsome limits about some mean value which is characteristicfor each individual aircraft for a given set of operatingconditions. This characteristic mean is expected to belargely invariant over many flights, unless there is someintervention, such as damage or repair, which changes theerror characteristics. The interval over which ASE remains
Appendix A. Quantitative Aspects of System Performance Monitoring A-11
relatively constant, in the absence of intervention, is notprecisely known, but data and experience do indicate somemoderate increase in the magnitude of ASE as an altimetrysystem ages. Data and experience also indicate that theerrors of the independent altimetry systems of the pilot andco-pilot are not necessarily equal.
4.10 An aircraft’s actual ASE at any time is thedifference between its actual TVE and contemporaneousactual FTE. Given a measure of TVE and acontemporaneous AAD for the aircraft, the differencebetween TVE and AAD provides an estimate of ASE. Theaccuracy of this estimate is affected by the granularity ofthe 30-m (100-ft) quantization inherent in Mode C and anycorrespondence error between the Mode C return and thealtitude display. When averaged over a number of repeatedsamples, however, this approach should enable arepresentative value of ASE to be established.
Estimation of AAD
4.11 Errors in altitude-keeping can vary during asingle aircraft flight. Data on altitude-keeping errors fromsuch sources as flight data recorders and SSR systemsindicate that magnitudes of less than 15 m (50 ft)predominate but that, on relatively infrequent occasions,error magnitudes of 90 m (300 ft) or more occur. Theselatter error magnitudes typically persist for short periods, inthe order of 30 to 180 seconds. There are two approachesto estimating the performance of altitude-keeping systems.If either direct altimeter readings or flight data recorderinformation on pressure altitude as measured by thealtimetry system are used, the difference between thisaltitude and the aircraft’s cleared flight level is termed FTE.If SSR returns are used, the difference between atransponded Mode C reading and a cleared flight levelis AAD.
4.12 Where available and practicable within RVSMairspace, SSR Mode C data should be gathered. Typically,a Mode C altitude return will be available every 4 to 12seconds if a single SSR is tracking an aircraft. Each suchreturn provides an estimate of AAD for the aircraft whenCFL is subtracted. These AAD estimates will not bestatistically independent but will provide the opportunity toobserve larger altitude-keeping system errors that mayoccur. Consideration should also be given to the inclusionof large FTEs (e.g. due to turbulence, autopilot failures,etc.) that might be documented in occurrence reports.
Procedures for monitoringheight-keeping performance
Introduction
4.13 Independent system performance monitoringrequires the measurement of aircraft height-keeping errors.Direct measurement of TVE for an aircraft can, at present,be carried out only by measuring the aircraft’s geometricheight at a given time and estimating the contemporaneousand collocated geometric height of the flight level to whichit is assigned. The difference between these two heightsyields the TVE measurement.
4.14 Given the nature of the TVE component errors,independent system performance monitoring should consistof an integrated set of procedures for:
a) monitoring TVE, with a system having errorcharacteristics identified in 4.21 below, in theairspace so as to obtain as broadly based a sampleof aircraft types and users as is practicable;
b) monitoring AAD through Mode C coverage; and
c) producing a companion ASE estimate for each TVEmeasure.
4.15 Paragraph 6.2.18 indicates that future regionalimplementations of RVSM may not necessarily requireTVE data to be collected as part of the airspace safetyverification process, on the grounds that statisticallyrepresentative data may be available from other regionswith established monitoring programmes. However, it maystill be necessary to collect representative AAD data which,combined with the aforementioned TVE data, would beused in the estimation of Pz (1 000).
Measurement accuracy for TVE
4.16 States contributing TVE estimates to RGCSPdeliberations independently determined that the combinedstandard deviation of measurement error for both theaircraft and the flight level geometric heights should not begreater than 15 m (50 ft). The individual meanmeasurement error for the aircraft and the flight levelgeometric heights should be 0 m (0 ft). These measurementerror criteria should also be taken as applicable to anysystem performance monitoring programme.Characteristics of a height-monitoring system are describedin 4.21.
Manual on Implementation of a 300 m (1 000 ft) VerticalA-12 Separation Minimum Between FL 290 and FL 410 Inclusive
Aberrant and non-compliant aircraft
4.17 The criteria for non-compliant aircraft to beapplied by an RMA are:
a) TVE > 90 m (300 ft);
b) ASE > 75 m (245 ft); and
c) AAD > 90 m (300 ft).
In deciding whether or not an aircraft meets these criteria,the inherent inaccuracy (measurement error) of themonitoring system, as well as normal variation in anairframe’s ASE or TVE, needs to be taken into account.The decision process is affected by two types of statisticalerror: type I error and type II error. To avoid unjustifiedaction being initiated on the basis of a large measureddeviation (type I error), the trigger levels for action are tobe set at slightly larger values than the criteria above. Anairframe is deemed to be non-compliant if any of itsmonitored deviations exceed these trigger levels. However,the situation also needs to be avoided where an aircraft thatdoes not meet the above criteria is labelled as meeting thecriteria (type II error). To ensure this, the trigger levels foraction are to be set at slightly lower values than the aboveset of trigger levels. An aircraft whose measured height-keeping deviations exceed any of the lower trigger levels iscalled aberrant. Aberrant aircraft, thus, are those aircraftwhich exhibit measured height-keeping performance that issignificantly different from the core height-keepingperformance measured for the whole population.
4.18 As an example, the sets of trigger levelscurrently in use in the NAT Region are shown below.
a) trigger levels for aberrant aircraft: |ASE| > 49 m(160 ft) or |TVE| > 52 m (170 ft); and
b) trigger levels for non-compliant aircraft: |ASE| > 90m (300 ft) or |TVE| > 107 m (350 ft) or |AAD| > 90m (300 ft).
Since determination of these trigger values is dependent onan evaluation of the measurement accuracy of themonitoring system and also the height-keepingperformance of the whole NAT population, the triggerlevels will be subject to change.
Monitoring strategy for TVE/ASE
4.19 Because of the specialized systems required,TVE can be monitored in only limited portions of an
airspace. Thus, TVE monitoring should be planned andconducted so that as broad a cross-section as possible of theuser population and aircraft types can be observed. TVEmonitoring can be used to uncover instances of larger ASEnot detectable by in-flight drills.
Monitoring strategy for AAD
4.20 Because of the generally short duration of largeAADs, this component error should be monitored, to theextent practicable, wherever there is SSR coverage inRVSM airspace. The actual monitoring process, however,should record only instances of AAD magnitudes of 90 m(300 ft) or more for both risk reduction, by means of errorfollow-up, and risk assessment. To conduct risk assessment,it will also be necessary to estimate the total amount oflevel-flight flying time in the SSR coverage area at andabove FL 290. With the count of larger AAD errors and thetotal flying time, an estimate of the proportion of timeduring which larger AAD errors occur can be made.
Characteristics of a height-monitoring system
4.21 The basic purpose of a height-monitoring systemis to collect data on the technical height-keepingperformance of aircraft in straight and level flight at FL 290or above. The following features form the basis of theoperational requirement for such a system:
a) it should be capable of automatic operation wherepracticable;
b) it should be capable of measuring the geometricheight of aircraft in straight and level flight at andabove FL 290 over a period of 30 seconds or more;
c) it should be capable of accepting input data on theestimated geometric height of the usable flightlevels between FL 290 and FL 450;
d) it should record the geometric height of the aircraftand the flight level;
e) it should be able to access aircraft identification andMode C SSR readings during the TVE trackingperiod;
f) it should be capable of deriving TVE, AAD andASE;
g) it should be capable of flagging “alerts” when a pre-determined TVE, ASE or AAD has been exceeded,
Corr.16/4/02
Appendix A. Quantitative Aspects of System Performance Monitoring A-13
and this information should be in such a format soas to be readily identifiable during the initialscrutiny of the data; and
h) it should record all data in a format that facilitatessubsequent analysis.
Risk reduction using observedheight-keeping performance data
4.22 In addition to taking investigative action onaircraft with observations of height-keeping performancenot considered to be in compliance with the RVSMMASPS, each observed instance of aberrant TVE, AAD orASE should also be the object of follow-up investigation.Errors of large magnitudes should be rare events in the lightof requirements on the component systems stipulated inChapter 4. It is important that records of these larger errorsbe analysed as a group to look for systematic causes ofdeviations and for adverse trends in the component errors.When such causes are identified, they should be the objectof appropriate remedial actions (affecting, for example, themaintenance practices of all users with a particular type ofaltimetry system if existing practices are implicated in thecauses of a systematically occurring large altimetry systemerror). If the cause of a specific larger error can be judgedto have been removed, it may be reasonable to conductsubsequent risk assessment with observed instances of theerror type removed from the monitoring results.
Note.— The values of aberrant TVEs, AADs or ASEsshould be determined based on typical performance of thepopulation as a whole and should also allow formeasurement error of the height-monitoring systememployed.
Composition of TVE samples
4.23 The composition of the TVE sample used forrisk assessment is important. Because the ASE componentof TVE for an aircraft is considered to be a rather long-duration error, which will be different for each aircraft typeand may be different for each airframe within an aircrafttype, the TVE sample should reflect a census of the ASE ofaltimetry systems used, or likely to be used, in RVSMairspace because undetected large ASE adverselyinfluences risk. Such a census may be a practicalimpossibility. Thus, it will be important during riskassessment to consider what the ASE of airframes that arenot included in the TVE sample may be in view of the ASEof identical aircraft types observed in the sample. The AADcomponent has been observed to reflect ATC operational
conditions, such as areas where flights transition betweenflight levels, and meteorological environments as well asvariations due to aircraft types and airspace users. Thus, theTVE sample should reflect these conditions andenvironments to the extent possible but, ideally, in theproportions in which they occur in RVSM airspace. As withthe considerations that apply to observations of the ASEcomponent of TVE, risk assessment should take intoaccount the proportions in which all conditions relevant toadequate representation of AAD are present in any TVEsample.
Estimation of the probability ofvertical overlap, Pz (1 000)
4.24 There were two methods adopted in the RGCSPanalysis to model the observed height-keeping errors. In thefirst method, an analytical probability density function(PDF) is fitted directly to the TVE data and is then self-convoluted to assess the vertical overlap probability. For thesecond method, individual PDFs are fitted to the ASEresults, broken down per aircraft group, and then re-combined in the proportions that these aircraft groups crossthe RVSM airspace under consideration. The aggregateASE distribution is then numerically convoluted with thePDF for the AAD data to produce a TVE distribution,termed TVEsyn. A self-convolution of this TVEsyndistribution is performed to obtain the vertical overlapprobability.
4.25 The second method is more complicated toperform but is likely to be more accurate since it takesaccount of how well the monitoring sample matches theoverall situation in the airspace under consideration. Forsmall monitoring samples, this is particularly important,although it is then difficult to obtain enough data to fitdistributions to the ASE data for individual aircraft groups.For large monitoring samples, it may be that the monitoringsample is sufficiently close (in terms of aircraft typeproportions) to the overall situation in the airspace, thusmaking it possible to fit a PDF directly to the TVE data.
5. ASSESSMENT AND EVALUATION OF OPERATIONAL ERRORS
AND IN-FLIGHT CONTINGENCIES
5.1 As set out in 1.1.10 and 6.3.1 to 6.3.3 of the maintext of this manual, the level of collision risk resulting fromerrors in ATC instructions and emergency procedures inRVSM airspace needs to be assessed in addition to thatresulting from technical height-keeping deviations. The
Corr.16/4/02
Manual on Implementation of a 300 m (1 000 ft) VerticalA-14 Separation Minimum Between FL 290 and FL 410 Inclusive
types of errors and their possible consequences may varyfrom region to region. The following briefly summarizestwo approaches to their assessment that have beendeveloped in the context of the NAT and the EUR Regions,respectively. For more information, see the regionaldocumentation.
NAT Region
5.2 The NAT approach comprises the followingelements:
a) definition of types of errors on the basis of theircause;
b) classification of errors for risk assessment purposes;
c) determination of appropriate parameter values foreach error;
d) estimation of probability of vertical overlap; and
e) estimation of vertical collision risk.
5.3 The assessment begins with identifying whattypes of operational errors could exist in the airspace underconsideration. In the NAT, large height deviations collectedby the CMA are divided into the following four main types:
a) ATC-pilot loop errors and incorrect clearances;
b) aircraft contingency events;
c) deviations due to meteorological effects; and
d) deviations due to ACAS.
Within each type, one or more error classes, characterizedby different CMA codes, are defined as shown below.(There is an additional error class O, Other) See theSupplement to NAT Doc 002 for a more detaileddescription of the various error classes.
ATC-pilot loop errors andincorrect clearances
D: Failure to climb/descend as cleared;E: Climb/descent without ATC clearance;F: Entry to MNPS airspace at an incorrect level; andG: ATC FL re-clearance resulting in loss of lateral or
longitudinal separation.
Aircraft contingency events
A: Contingency action due to engine fault;B: Contingency action due to pressurization failure; C: Contingency action due to other cause.
Deviations due to meteorological effects
I(W): Aircraft unable to maintain level due to weatherconditions.
Deviations due to ACAS
H: Deviation resulting from ACAS resolutionadvisories.
5.4 The next step is to classify each large heightdeviation for risk assessment purposes as either risk bearingor non-risk bearing. In the NAT, a large height deviation isclassified as non-risk bearing when it occurs wholly outsideMNPS airspace or when it is explicitly stated that correctcontingency procedures were followed and the aircraftturned off track prior to any change of level.
5.5 Risk-bearing height deviations are further brokendown into those involving whole numbers of flight levelsand those not involving whole numbers of flight levels.
5.6 During the development of a large heightdeviation involving whole numbers of flight levels, one ormore intermediate flight levels may have been crossed. Thisis taken into account in the NAT approach through thefollowing parameters of the incident:
a) the time spent around levels crossed, if any;
1) the number of flight levels crossed, if any;
2) the rate of climb/descent; and
b) the time spent in level flight at uncleared flightlevels, if any.
Item b) is mainly related to ATC-pilot loop errors andincorrect clearances (error classes D, E, F, G); item a) ismainly related to aircraft contingency events (error classesA, B, C) but may also play a part in ATC-pilot loop errorsand incorrect clearances.
5.7 It has been observed that the rate of climb/descentand the time spent in level flight at uncleared levels arerarely included in the incident reports. For those cases,
Appendix A. Quantitative Aspects of System Performance Monitoring A-15
cautious estimates have been developed for the NAT basedon information from operators and other sources.
5.8 Large height deviations of a few hundred feet, butnot involving whole numbers of flight levels, may occur asa result of turbulence or nuisance-ACAS resolutionadvisories. The parameters of this type of incident are themaximum deviation and the total duration from the start ofthe deviation until the cleared flight level is re-established.Again, cautious estimates of the latter have been developedfor the NAT because information about the duration hasbeen found to rarely be documented in the incident report.
5.9 Estimates of the probability of vertical overlapassociated with the different types of risk-bearing largeheight deviations can be made using the individualparameters. The probability of vertical overlap for aircraftin level flight at uncleared levels is computed as the productof the proportion of total flying time spent at incorrectlevels and the probability that two aircraft nominally flyingat the same level are in vertical overlap. For aircraft slowlycrossing an uncleared flight level, the probability of verticaloverlap can be estimated as the ratio of the average heightof an aircraft and the vertical separation minimum. (A morecomplicated relation is required for crossing an unclearedflight level at higher speeds.)
5.10 The probability of vertical overlap for largeheight deviations not involving whole numbers of flightlevels is not estimated separately. Rather, the relativefrequency for each deviation magnitude is estimated (bydividing its duration by the total MNPS system flighthours) and added to the distribution of assigned altitudedeviation (AAD) (cf. 4.6 and 4.18 of this appendix). In thisway, this type of large height deviation is included in thedistribution of technical height-keeping errors and in theestimate of the technical risk.
5.11 The vertical collision risk associated with eachlarge height deviation involving either flying at anuncleared level or crossing an uncleared level is calculatedwith the Reich collision risk model, where the probabilityof vertical overlap and the relative vertical velocity aredependent on the specific error. The individual vertical riskestimates are then combined into an overall estimate of thetotal vertical collision risk due to such large heightdeviations.
EUR Region
5.12 In addition to the NAT approach, an approachbased on hazard analysis has been developed for the EURRegion. A hazard identification process has resulted in twobroad categories of hazards:
a) loss of vertical separation following altitudedeviations, the main type of scenario being failureto level at the assigned altitude (level “bust”) andthe main causes being pilot errors and pilot-ATCmiscommunication; and
b) loss of vertical separation due to ATCmisjudgements, the main scenario being ATCplacing two aircraft in close proximity during aclimb or descent and the main causes appearing tobe controller aberrations, problems in coordinationbetween military and civil controllers andcoordination difficulties between controllers indifferent sectors.
5.13 An altitude deviation generally leads to one ormore of the following:
a) crossing one or more uncleared flight levels;
b) joining an uncleared flight level; and
c) levelling off between flight levels.
The approach then consists of determining the frequency ofaltitude deviations and calculating the associatedprobability of vertical overlap. The latter depends on thespecific effects and the probability of ATC failing tointervene successfully.
5.14 An ATC misjudgement has been defined as aloss of vertical separation where both aircraft follow theinstructed flight profiles. A key difference from altitudedeviations is that misjudgements always occur in thecontext of another aircraft being in the near vicinity. Theprocess developed involves first of all deriving thefrequency of ATC misjudgements leading to the loss ofvertical separation and dividing this frequency intocomponents involving joining and crossing levels andinvolving different traffic directions. This is followed bydetermining ATC intervention probabilities for eachcomponent and combining collision risks in the absence ofATC with probabilities of failed ATC intervention.