Manual of Power Factor Correction - frako.com€¦ · Basic theory 7 Active power 7 ... Group power...
72
Manual of Power Factor Correction Peter Riese Manual of Power Factor Correction Peter Riese Information • Tables • Formulas Everything on the subject of power factor correction for engineers and users
Transcript of Manual of Power Factor Correction - frako.com€¦ · Basic theory 7 Active power 7 ... Group power...
Manual of Power Factor CorrectionPeter Riese
Manual of Power Factor CorrectionPeter Riese
Information • Tables • FormulasEverything on the subject of power factor correction
for engineers and users

2

3
FRAKO power factor correction (PFC) systems make a major contribution to achieving energy efficiency and reducing CO2 emissions, and are thus an indispensable component of modern electrical installations.
At present-day electrical power tariffs, any investment in a PFC system usually pays for itself within one to three years, or even less. After that time the PFC system offers an improved energy balance and added company profitability, month after month. It is therefore a particularly lucrative investment when the system has a long service life; the longer it continues to operate, the greater is the return for your company. FRAKO PFC systems are renowned for their long operating life cycle, the power capacitors installed in them being exceptionally long-lived.
FRAKO power capacitors are constructed with three features crucial to reliability and safety: Self-healing capacitor film for protection against voltage peaks Segmented capacitor film for maximum reliability Mechanical fuses to disconnect the capacitor safely from the power supply if an excessive
internal pressure develops due to overloading or at the end of its service life.
The pollution of our public supply networks with harmonics continues to increase steadily. A major reason for this is the large number of switched-mode power supply units in computers, televisions, electronic ballast and similar devices. Our engineers have decades of experience in analysing power networks and designing PFC systems in challenging environments, and are thus well-equipped to assess specific situations in your company. They select the right PFC system that is best suited to your site conditions. The extreme robustness of our power capacitors is an additional bonus:
Overcurrent: up to 2.7 times the rated current as continuous load Peak inrush current: up to 450 times the rated current Ambient temperature: up to 65 °C Service life: up to 200,000 hours Up to 100,000 switching cycles per annum.
FRAKO is certified to the international standards ISO 9001, ISO 14001 and ISO 50001. For many years the quality of our manufactured products has been registered and documented both in the factory and in the field. For this our own internal product standards, which are significantly more demanding than EN 60831, have been applied for quality assessment. This is the only way in which a manufacturer can promise that product quality remains at a permanently high level. Not only in the manufacture of our products, but also when they reach the end of their long service lives, we pay particular attention to conserving resources, minimizing energy consumption and protecting the environment.
The quality of our products and our expertise in their application are the basis for providing the best possible benefits to our customers. This manual describes the technical fundamentals, our manufacturing philosophy and our ongoing commitment for interested readers. It provides the basic knowledge needed to select, install and operate our PFC systems.
Teningen, March 2012
Peter Herbst, Managing DirectorFRAKO Kondensatoren- und Anlagenbau GmbH

4
5
Contents
Basic theory 7Active power 7Active and reactive power 7Reactive power 8Apparent power 8Power factor (cos φ and tan φ) 9Why correct power factor? 10
Correction methods 11Individual power factor correction 11Group power factor correction 11Central power factor correction 12Hybrid power factor correction 13
Determination of required capacitor rating 14Tariffs 14Approximate estimates 14Determination of required capacitor rating by measurement 15Measurements with recording of active and reactive power 16
Applications 21Individual correction of discharge lamps 21Group power factor correction for discharge lamps 23Individual power factor correction for transformers 24Individual power factor correction for motors 25Power factor correction systems 28
Performance characteristics 30Power capacitors 30Reactive power control relays 32
Installation 36Current transformer 36Overcurrent protection and cables 37Ingress protection 40
Capacitor calculation formulas 42

6
Harmonics 44What are harmonics? 44How are harmonics produced? 46When can dangerous network resonances occur? 48What effect does the network configuration have on the problem of harmonics? 49Voltage and current loads on PFC systems without detuning 49
Designing for networks with harmonics 50Measures to counteract expected resonances 51
Maximum permissible harmonic levels 53Effect of PFC systems without detuning 55Effect of detuned PFC systems 56Versions of detuned PFC systems 58Monitoring PFC systems in operation 59
Activeharmonicfilters 60Operating principle of the active harmonic filter 60Applications 61
Active against harmonics 63
7
Basic theoryBefore venturing into the details in the design of power factor correction systems, we would first like to present a brief refresher of basic alternating current circuit theory.
Active power
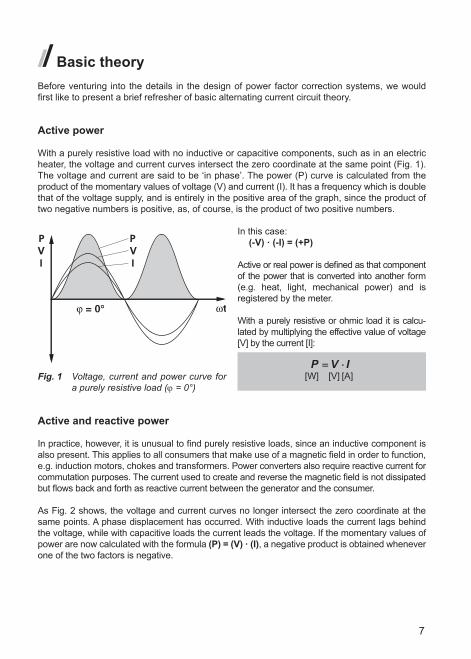
With a purely resistive load with no inductive or capacitive components, such as in an electric heater, the voltage and current curves intersect the zero coordinate at the same point (Fig. 1). The voltage and current are said to be ‘in phase’. The power (P) curve is calculated from the product of the momentary values of voltage (V) and current (I). It has a frequency which is double that of the voltage supply, and is entirely in the positive area of the graph, since the product of two negative numbers is positive, as, of course, is the product of two positive numbers.
In this case: (-V) · (-I) = (+P)
Active or real power is defined as that component of the power that is converted into another form (e.g. heat, light, mechanical power) and is registered by the meter.
With a purely resistive or ohmic load it is calcu-lated by multiplying the effective value of voltage [V] by the current [I]:
[W] [V] [A]P V I== ⋅⋅
Active and reactive power
In practice, however, it is unusual to find purely resistive loads, since an inductive component is also present. This applies to all consumers that make use of a magnetic field in order to function, e.g. induction motors, chokes and transformers. Power converters also require reactive current for commutation purposes. The current used to create and reverse the magnetic field is not dissipated but flows back and forth as reactive current between the generator and the consumer.
As Fig. 2 shows, the voltage and current curves no longer intersect the zero coordinate at the same points. A phase displacement has occurred. With inductive loads the current lags behind the voltage, while with capacitive loads the current leads the voltage. If the momentary values of power are now calculated with the formula (P) = (V) · (I), a negative product is obtained whenever one of the two factors is negative.
V V
Fig. 1 Voltage, current and power curve for a purely resistive load (ϕ = 0°)

8
In this example phase displacement φ = 45° has been chosen. This corresponds to an inductive cos φ of 0.707. Part of the power curve can be seen to be in the negative area.
The active power in this case is given by the formula:
Reactive power
Inductive reactive power occurs in motors and transformers when running under no-load conditions if the copper, iron and, where appropriate, frictional losses are ignored. With FRAKO power capacitors we can think in terms of virtually pure capacitive reactive power, since these display extremely low losses (less than 0.05%).
If the voltage and current curves are 90° out of phase, one half of the power curve lies in the positive area, with the other half in the negative area (Fig. 3). The active power is therefore zero, since the positive and negative areas cancel each other out.
Reactive power is defined as that power which flows back and forth between the generator and the consumer at the same frequency as the supply voltage in order for the magnetic/electric field to build up and decay.
Apparent power
The apparent power is critical for the rating of electric power networks. Generators, transformers, switchgear, fuses, circuit breakers and conductor cross sections must be adequately dimensioned for the apparent power that results in the system.
[W] [V] [A]P V I== ⋅⋅ ⋅⋅cosϕϕ
[var] [V] [A]Q V I== ⋅⋅ ⋅⋅ sinϕϕ
V V
Fig. 2 Voltage, current and power with a resistive and an inductive load (φ = 45°)
VV
Fig. 3 Voltage, current and power curves under a purely reactive load (φ = 90°)
9
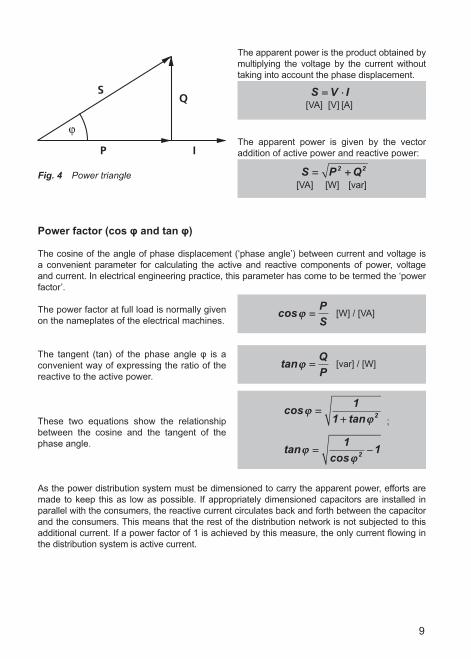
The apparent power is the product obtained by multiplying the voltage by the current without taking into account the phase displacement.
The apparent power is given by the vector addition of active power and reactive power:
Powerfactor(cosφandtanφ)
The cosine of the angle of phase displacement (‘phase angle’) between current and voltage is a convenient parameter for calculating the active and reactive components of power, voltage and current. In electrical engineering practice, this parameter has come to be termed the ‘power factor’.
The power factor at full load is normally given on the nameplates of the electrical machines.
The tangent (tan) of the phase angle φ is a convenient way of expressing the ratio of the reactive to the active power.
These two equations show the relationship between the cosine and the tangent of the phase angle.
As the power distribution system must be dimensioned to carry the apparent power, efforts are made to keep this as low as possible. If appropriately dimensioned capacitors are installed in parallel with the consumers, the reactive current circulates back and forth between the capacitor and the consumers. This means that the rest of the distribution network is not subjected to this additional current. If a power factor of 1 is achieved by this measure, the only current flowing in the distribution system is active current.
[VA] [V] [A]S V I== ⋅⋅
[VA] [W] [var]S P Q== ++2 2
Fig. 4 Power triangle
[W] / [VA]cosϕϕ ==PS
[var] / [W]tanϕϕ ==QP
costan
ϕϕϕϕ
==++
11 2
tancos
ϕϕϕϕ
== −−1
12
;

10
The reactive power QC corrected by the capacitor is given by the difference between the inductive reactive power Q1 before correction and the reactive power Q2 after correction, i.e.
QC = Q1 - Q2.
Why correct power factor?
The reactive current circulating between the utility company’s generator and the consumer converts electrical energy into heat in the power distribution system, and there is an additional load on generators, transformers, cabling and switchgear. Energy losses and voltage drops are incurred. If there is a high proportion of reactive current, the installed conductor cross sections cannot be fully utilized for transmitting useful power, or must be appropriately overdimensi-oned. From the utility company’s standpoint, a poor power factor increases the investment and maintenance costs for the power distribution system, and these additional costs are passed on to those responsible, i.e. those power consumers with poor power factors. A meter for reactive energy is therefore installed in addition to the one for active energy.
Fig. 5 Power triangle showing the effect of correction
[var] [W]Q PC == ⋅⋅ −−(tan tan )ϕϕ ϕϕ1 2
Fig. 6 Active and reactive power in the power distribution system: without PFC
Fig. 7 Active and reactive power in the power distribution system: with PFC
GENActive power P
Reactive power Q
Active power P
Reactive power Q
cos ϕ = 0.7
GENActive power P
Saving
Active power P
Saving
cos ϕ = 1
Rea
ctiv
e po
wer
QThebenefits: Cost-effectiveutilizationof:
- Generators (utility company) - Transformers - Cabling - Switchgear
Reduced losses Lower voltage drops
hence: Lower energy costs!
11
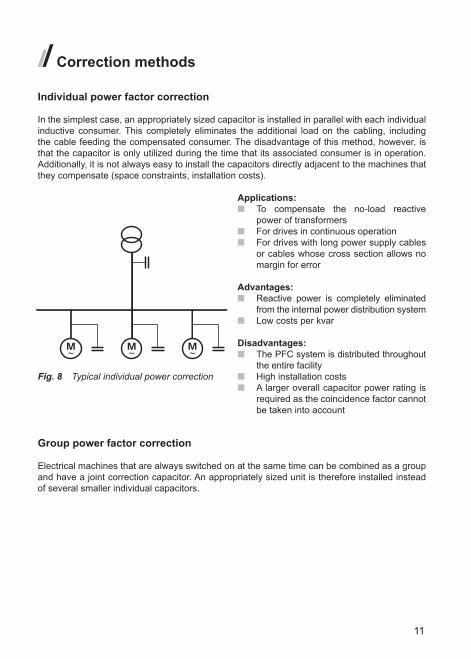
Correction methods
Individual power factor correction
In the simplest case, an appropriately sized capacitor is installed in parallel with each individual inductive consumer. This completely eliminates the additional load on the cabling, including the cable feeding the compensated consumer. The disadvantage of this method, however, is that the capacitor is only utilized during the time that its associated consumer is in operation. Additionally, it is not always easy to install the capacitors directly adjacent to the machines that they compensate (space constraints, installation costs).
Applications: To compensate the no-load reactive
power of transformers For drives in continuous operation For drives with long power supply cables
or cables whose cross section allows no margin for error
Advantages: Reactive power is completely eliminated
from the internal power distribution system Low costs per kvar
Disadvantages: The PFC system is distributed throughout
the entire facility High installation costs A larger overall capacitor power rating is
required as the coincidence factor cannot be taken into account
Group power factor correction
Electrical machines that are always switched on at the same time can be combined as a group and have a joint correction capacitor. An appropriately sized unit is therefore installed instead of several smaller individual capacitors.
Fig. 8 Typical individual power correction

12
Applications: For several inductive consumers provided
that these are always operated together
Advantages: Similar to those for individual power factor
correction, but more cost-effective
Disadvantages: Only for groups of consumers that are
always operated at the same time
Central power factor correction
The PFC capacitance is installed at a central point, for example, at the main low voltage distribution board. This system covers the total reactive power demand. The capacitance is divided into several sections which are automatically switched in and out of service by automatic reactive power control relays and contactors to suit load conditions.
This method is used today in most instances. A centrally located PFC system is easy to monitor. Modern reactive power control relays enable the contactor status, cos φ, active and reactive currents and the harmonics present in the power distribution system to be monitored continuously. Usually the overall capacitance installed is less, since the coincidence factor for the entire industrial operation can be taken into account when designing the system. This installed capacitance is also better utilized. It does not, however, eliminate the reactive current circulating within the user’s internal power distribution system, but if adequate conductor cross sections are installed, this is no disadvantage.
Applications: Can always be used where the user’s
internal power distribution system is not underdimensioned
Advantages: Clear-cut, easy-to-monitor concept Good utilization of installed capacitance Installation usually relatively simple Less total installed capacitance, since
the coincidence factor can be taken into account
Less expensive for power distribution sys-tems troubled by harmonics, as controlled devices are simpler to choke
Disadvantages: Reactive currents within the user’s internal power distribution system are not reduced Additional costs for the automatic control system
Fig. 9 Typical group power factor correction
Fig. 10 Typical central PFC system
reactive powercontrol relay

13
Hybrid power factor correction
Economic considerations often show that it is advantageous to combine the three methods described above.
Fig. 11 Typical hybrid PFC system
reactive powercontrol relay

14
Determination of required capacitor rating
Tariffs
Utility companies as a rule have fixed tariffs for their smaller power consumers, while individual supply contracts are negotiated with the larger consumers.
With most power supply contracts the costs for electrical power comprise: Power [kW] – measured with a maximum demand meter, e.g. monthly
maximum demand over a 15 minute period. Active energy [kWh] – measured with an active current meter usually split into
regular and off-peak tariffs. Reactive energy [kvarh] – measured with a reactive current meter, sometimes split
into regular and off-peak tariffs.
It is normal practice to invoice the costs of reactive energy only when this exceeds 50% of the active power load. This corresponds to a power factor cos φ = 0.9. It is not stipulated that the power factor must never dip below this value of 0.9. Invoicing is based on the power factor monthly average. Utility companies in some areas stipulate other power factors, e.g. 0.85 or 0.95.
With other tariffs the power is not invoiced as kW but as kVA. In this case the costs for reactive energy are therefore included in the power price. To minimize operating costs in this case, a power factor cos φ =1 must be aimed for. In general, it can be assumed that if a PFC system is correctly dimensioned, the entire costs for reactive energy can be saved.
Approximate estimates
Accurate methods for determining the required reactive capacity are given in a subsequent section of this manual. Sometimes, however, it is desirable to estimate the approximate order of magnitude quickly. Cases may also occur where an engineer has performed an accurate calculation but is then uncertain of the result, in case somewhere a mistake has occurred in his or her reasoning. This can then be used to verify that the results calculated have the right magnitude.
Consumer Capacitor rating
→ Motors with individual PFC → 35–40% of motor rating
→ Transformers with individual PFC → 2.5% of transformer capacity → 5% for older transformers
→ Central PFC → 25–33% of transformer capacity when aiming for cos φ = 0.9 → 40–50% of transformer capacity when aiming for cos φ = 1
Table 1 Approximate estimates for the required capacitor rating
15
Consumer listWhen designing a new installation for a new plant or a section of a plant, it is appropriate to first make an approximate estimate of requirements. A more accurate picture is achieved by listing the consumers to be installed, together with their electrical data, by taking into account the coincidence factor. In cases where a later extension may be considered, the PFC system should be designed and installed so that the extension will not involve great expenditure. The cabling and protected circuits to the PFC system should be dimensioned to cater for expansion, and space should be reserved for additional capacitor units.
Determination of required capacitor rating by measurement
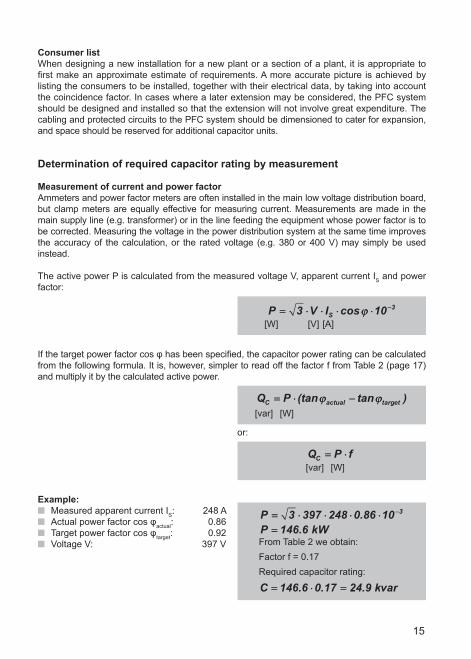
Measurement of current and power factorAmmeters and power factor meters are often installed in the main low voltage distribution board, but clamp meters are equally effective for measuring current. Measurements are made in the main supply line (e.g. transformer) or in the line feeding the equipment whose power factor is to be corrected. Measuring the voltage in the power distribution system at the same time improves the accuracy of the calculation, or the rated voltage (e.g. 380 or 400 V) may simply be used instead.
The active power P is calculated from the measured voltage V, apparent current IS and power factor:
If the target power factor cos φ has been specified, the capacitor power rating can be calculated from the following formula. It is, however, simpler to read off the factor f from Table 2 (page 17) and multiply it by the calculated active power.
or:
Example: Measured apparent current IS: 248 A Actual power factor cos φactual: 0.86 Target power factor cos φtarget: 0.92 Voltage V: 397 V
[W] [V] [A]P V IS== ⋅⋅ ⋅⋅ ⋅⋅ ⋅⋅ −−3 10 3cosϕϕ
[var] [W]Q PC actual t et== ⋅⋅ −−(tan tan )argϕϕ ϕϕ
[var] [W]Q P fC == ⋅⋅
From Table 2 we obtain:Factor f = 0.17Required capacitor rating:
P == ⋅⋅ ⋅⋅ ⋅⋅ ⋅⋅ −−3 397 248 0 86 10 3.P kW== 146 6.
C k== ⋅⋅ ==146 6 0 17 24 9. . . var

16
Note:Measurements made as described above naturally only give momentary values. The load conditions can, however, vary considerably depending on the time of day and the season of the year. Measurements should therefore be made by someone who is familiar with the installation. Several measurements should be made, ensuring that the consumers whose power factor is to be corrected are actually switched on. The measurements should also be made quickly - if possible reading all instruments simultaneously - so that any sudden change of load does not distort the results.
Measurements with recording of active and reactive power
More reliable results are obtained with recording instruments. The parameters can be recorded over a longer period of time, peak values also being included. Required capacitor power rating is then calculated as follows:
QC = required capacitor ratingQL = measured reactive powerP = measured active powertan φtarget = the corresponding value of
tan φ at the target cos φ (can be obtained from Table 2, e.g. when cos φ = 0.92 the correspon-ding tan φ = 0.43)
Measurement by reading metersThe active and reactive current meters are read at the start of a shift. Eight hours later both meters are read again. If there has been a break in operation during this time, the eight hours must be extended by the duration of this break.
RM1 = reactive current meter reading at start
RM2 = reactive current meter reading at finish
AM1 = active current meter reading at startAM2 = active current meter reading at finish
Using this calculated value of tan φ and the target cos φ we can then obtain the factor f from Table 2. The required capacitor power rating can then be calculated from the following equation, where k is the CT ratio of the current transformers for the meters:
[var] [var] [W]Q Q PC L== −− ⋅⋅( tan )ϕϕtarget
RM RMAM AM
2 1
2 1
−−−−
== tanϕϕ
QAM AM k
fC ==−− ⋅⋅
⋅⋅( )2 1
8

17
Example:The following meter readings have been obtained:
Active current meter readings (AM1) = 115.3 (AM2) = 124.6
Reactive current meter readings (RM1) = 311.2 (RM2) = 321.2
The meters work with current transformers rated at 150/5 A, so here the CT ratio k = 30.
Uncorrected Target cos φ ←Inductive(i)→ ←Capacitive(c)→
tan φ cos φ 0.80i 0.85i 0.90i 0.92i 0.95i 0.98i 1.00 0.98c 0.95c 0.92c 0.90c
3.18 ↔ 0.30 2.43 2.56 2.70 2.75 2.85 2.98 3.18 3.38 3.51 3.61 3.66
2.96 ↔ 0.32 2.21 2.34 2.48 2.53 2.63 2.76 2.96 3.16 3.29 3.39 3.45
2.77 ↔ 0.34 2.02 2.15 2.28 2.34 2.44 2.56 2.77 2.97 3.09 3.19 3.25
2.59 ↔ 0.36 1.84 1.97 2.11 2.17 2.26 2.39 2.59 2.79 2.92 3.02 3.08
2.43 ↔ 0.38 1.68 1.81 1.95 2.01 2.11 2.23 2.43 2.64 2.76 2.86 2.92
2.29 ↔ 0.40 1.54 1.67 1.81 1.87 1.96 2.09 2.29 2.49 2.62 2.72 2.78
2.16 ↔ 0.42 1.41 1.54 1.68 1.73 1.83 1.96 2.16 2.36 2.49 2.59 2.65
2.04 ↔ 0.44 1.29 1.42 1.56 1.61 1.71 1.84 2.04 2.24 2.37 2.47 2.53
1.93 ↔ 0.46 1.18 1.31 1.45 1.50 1.60 1.73 1.93 2.13 2.26 2.36 2.41
1.83 ↔ 0.48 1.08 1.21 1.34 1.40 1.50 1.62 1.83 2.03 2.16 2.25 2.31
1.73 ↔ 0.50 0.98 1.11 1.25 1.31 1.40 1.53 1.73 1.94 2.06 2.16 2.22
1.64 ↔ 0.52 0.89 1.02 1.16 1.22 1.31 1.44 1.64 1.85 1.97 2.07 2.13
1.56 ↔ 0.54 0.81 0.94 1.07 1.13 1.23 1.36 1.56 1.76 1.89 1.98 2.04
1.48 ↔ 0.56 0.73 0.86 1.00 1.05 1.15 1.28 1.48 1.68 1.81 1.91 1.96
1.40 ↔ 0.58 0.65 0.78 0.92 0.98 1.08 1.20 1.40 1.61 1.73 1.83 1.89
1.33 ↔ 0.60 0.58 0.71 0.85 0.91 1.00 1.13 1.33 1.54 1.66 1.76 1.82
1.27 ↔ 0.62 0.52 0.65 0.78 0.84 0.94 1.06 1.27 1.47 1.59 1.69 1.75
1.20 ↔ 0.64 0.45 0.58 0.72 0.77 0.87 1.00 1.20 1.40 1.53 1.63 1.68
1.14 ↔ 0.66 0.39 0.52 0.65 0.71 0.81 0.94 1.14 1.34 1.47 1.56 1.62
1.08 ↔ 0.68 0.33 0.46 0.59 0.65 0.75 0.88 1.08 1.28 1.41 1.50 1.56
1.02 ↔ 0.70 0.27 0.40 0.54 0.59 0.69 0.82 1.02 1.22 1.35 1.45 1.50
0.99 ↔ 0.71 0.24 0.37 0.51 0.57 0.66 0.79 0.99 1.19 1.32 1.42 1.48
0.96 ↔ 0.72 0.21 0.34 0.48 0.54 0.64 0.76 0.96 1.17 1.29 1.39 1.45
0.94 ↔ 0.73 0.19 0.32 0.45 0.51 0.61 0.73 0.94 1.14 1.26 1.36 1.42
Table 2 Factor f (= tan φactual - tan φtarget)
For a target cos ϕ of 0.92 Table 2 gives a factor f = 0.65The capacitor power rating is thus:
tan. .. .
.ϕϕ ==−−−−
==321 2 311 2124 6 115 3
1 08
Q
k
C ==−− ⋅⋅
⋅⋅
==
( . . ).
. var
124 6 115 3 308
0 65
22 67

18
Uncorrected Target cos φ ←Inductive(i)→ ←Capacitive(c)→
tan φ cos φ 0.80i 0.85i 0.90i 0.92i 0.95i 0.98i 1.00 0.98c 0.95c 0.92c 0.90c
0.91 ↔ 0.74 0.16 0.29 0.42 0.48 0.58 0.71 0.91 1.11 1.24 1.33 1.39
0.88 ↔ 0.75 0.13 0.26 0.40 0.46 0.55 0.68 0.88 1.08 1.21 1.31 1.37
0.86 ↔ 0.76 0.11 0.24 0.37 0.43 0.53 0.65 0.86 1.06 1.18 1.28 1.34
0.83 ↔ 0.77 0.08 0.21 0.34 0.40 0.50 0.63 0.83 1.03 1.16 1.25 1.31
0.80 ↔ 0.78 0.05 0.18 0.32 0.38 0.47 0.60 0.80 1.01 1.13 1.23 1.29
0.78 ↔ 0.79 0.03 0.16 0.29 0.35 0.45 0.57 0.78 0.98 1.10 1.20 1.26
0.75 ↔ 0.80 ‒ 0.13 0.27 0.32 0.42 0.55 0.75 0.95 1.08 1.18 1.23
0.72 ↔ 0.81 ‒ 0.10 0.24 0.30 0.40 0.52 0.72 0.93 1.05 1.15 1.21
0.70 ↔ 0.82 ‒ 0.08 0.21 0.27 0.37 0.49 0.70 0.90 1.03 1.12 1.18
0.67 ↔ 0.83 ‒ 0.05 0.19 0.25 0.34 0.47 0.67 0.88 1.00 1.10 1.16
0.65 ↔ 0.84 ‒ 0.03 0.16 0.22 0.32 0.44 0.65 0.85 0.97 1.07 1.13
0.62 ↔ 0.85 ‒ ‒ 0.14 0.19 0.29 0.42 0.62 0.82 0.95 1.05 1.10
0.59 ↔ 0.86 ‒ ‒ 0.11 0.17 0.26 0.39 0.59 0.80 0.92 1.02 1.08
0.57 ↔ 0.87 ‒ ‒ 0.08 0.14 0.24 0.36 0.57 0.77 0.90 0.99 1.05
0.54 ↔ 0.88 ‒ ‒ 0.06 0.11 0.21 0.34 0.54 0.74 0.87 0.97 1.02
0.51 ↔ 0.89 ‒ ‒ 0.03 0.09 0.18 0.31 0.51 0.72 0.84 0.94 1.00
0.48 ↔ 0.90 ‒ ‒ ‒ 0.06 0.16 0.28 0.48 0.69 0.81 0.91 0.97
0.46 ↔ 0.91 ‒ ‒ ‒ 0.03 0.13 0.25 0.46 0.66 0.78 0.88 0.94
0.43 ↔ 0.92 ‒ ‒ ‒ ‒ 0.10 0.22 0.43 0.63 0.75 0.85 0.91
0.40 ↔ 0.93 ‒ ‒ ‒ ‒ 0.07 0.19 0.40 0.60 0.72 0.82 0.88
0.36 ↔ 0.94 ‒ ‒ ‒ ‒ 0.03 0.16 0.36 0.57 0.69 0.79 0.85
0.33 ↔ 0.95 ‒ ‒ ‒ ‒ ‒ 0.13 0.33 0.53 0.66 0.75 0.81
0.29 ↔ 0.96 ‒ ‒ ‒ ‒ ‒ 0.09 0.29 0.49 0.62 0.72 0.78
0.25 ↔ 0.97 ‒ ‒ ‒ ‒ ‒ 0.05 0.25 0.45 0.58 0.68 0.73
0.20 ↔ 0.98 ‒ ‒ ‒ ‒ ‒ ‒ 0.20 0.41 0.53 0.63 0.69
0.14 ↔ 0.99 ‒ ‒ ‒ ‒ ‒ ‒ 0.14 0.35 0.47 0.57 0.63
0.00 ↔ 1.00 ‒ ‒ ‒ ‒ ‒ ‒ ‒ 0.20 0.33 0.43 0.48
Table 2 Factor f (= tan φactual - tan φtarget)
Determination of required capacitor rating from the utility company’s invoice
The required capacitor power rating can be determined relatively easily and accurately from the power supply company’s monthly invoice. If power consumption is constant throughout the year, the annual electricity consumption or any desired monthly invoice (but not for the month in which the annual shutdown occurs) may be taken as a basis. If seasonal variations are apparent, an invoice from the ‘high season’ must of course be selected. If regular and off-peak tariffs are measured separately, usually the regular tariffs are used for calculation purposes. It can be assumed that the capacitor power rating derived will be adequate to cover the reactive current circulating at night. In special cases, however, where the less expensive off-peak power is used predominantly, the off-peak consumption may not be neglected.

19
Kilowatt-hour tariffWith the kilowatt-hour tariff
Max. potential demand Active energy Reactive energy
are invoiced as separate items.
With most power supply contracts, no charge is made for reactive energy if its magnitude is up to 50% of the active energy. Only amounts that exceed this figure must be paid for. This corresponds approximately to a cos φ of 0.9. It is recommended, however, to use a slightly higher figure, e.g. 0.92, for calculation purposes, in order to have a small margin of reserve in the capacitor power rating.
Specimen calculation using figures from the utility company’s invoice:
Active power 99 kW Active energy (regular tariff) 17,820 kWh Reactive tariff (off-peak) 19,245 kvarh
The actual value of cos φ can now be obtained from Table 2, since the calculated tan φ of 1.08 corresponds to a cos φactual of 0.68.
A factor f = 0.65 is then obtained from Table 2.(cosφtarget = 0.92)
The required capacitor power rating is calculated from:
Active power x factor f
In this case a capacitor rating of 75 kvar must be selected. If a possible future expansion of the facility is also to be taken into account, then a somewhat larger capacitance (e.g. 100 kvar) could also be selected.
Demand tariffIn this case the utility company bases its invoice on the maximum amount of power drawn by the user during the given month. If it is not the active power but the apparent power that is measured for this purpose, it is advisable to select a capacitor power rating that will achieve a cos φ of 1.
Specimen calculation using figures from the utility company’s invoice:
Maximum active power 104 kW cos φactual 0.62
tan( )
( ), v
ϕϕ ==
==
reactive power regularactive power regular
k
19 245 aar,
.h
kWh17 8201 08==
99 0 65 64 35kW k⋅⋅ ==. . var
max.cos .
active power kW
kVAϕϕ
==
==
1040 62
168

20
From Table 2, with an uncorrected cos φactual = 0.62 and a target cos φtarget = 1, a factor f of 1.27 is read off.
The required capacitor power rating can then be calculated:
Active power x factor f
For this duty a reactive power control relay with a capacitor power rating of 150 to 175 kvar is arranged as a switched variable bank.
99 0 65 64 35kW k⋅⋅ ==. . var
21
Applications
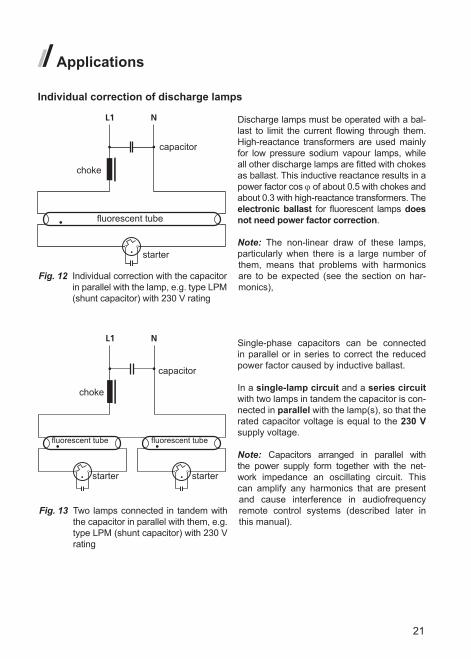
Individual correction of discharge lamps
Discharge lamps must be operated with a bal-last to limit the current flowing through them. High-reactance transformers are used mainly for low pressure sodium vapour lamps, while all other discharge lamps are fitted with chokes as ballast. This inductive reactance results in a power factor cos ϕ of about 0.5 with chokes and about 0.3 with high-reactance transformers. The electronic ballast for fluorescent lamps does not need power factor correction.
Note: The non-linear draw of these lamps, particularly when there is a large number of them, means that problems with harmonics are to be expected (see the section on har-monics),
Single-phase capacitors can be connected in parallel or in series to correct the reduced power factor caused by inductive ballast.
In a single-lamp circuit and a series circuit with two lamps in tandem the capacitor is con-nected in parallel with the lamp(s), so that the rated capacitor voltage is equal to the 230 V supply voltage.
Note: Capacitors arranged in parallel with the power supply form together with the net-work impedance an oscillating circuit. This can amplify any harmonics that are present and cause interference in audiofrequency remote control systems (described later in this manual).
Fig. 12 Individual correction with the capacitor in parallel with the lamp, e.g. type LPM (shunt capacitor) with 230 V rating
capacitor
choke
starter
fluorescent tube
Fig. 13 Two lamps connected in tandem with the capacitor in parallel with them, e.g. type LPM (shunt capacitor) with 230 V rating
capacitor
choke
starter
fluorescent tubefluorescent tube
starter
22
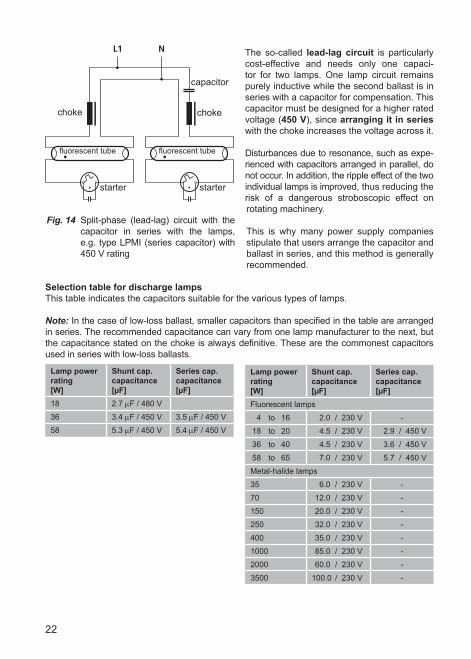
The so-called lead-lag circuit is particularly cost-effective and needs only one capaci-tor for two lamps. One lamp circuit remains purely inductive while the second ballast is in series with a capacitor for compensation. This capacitor must be designed for a higher rated voltage (450 V), since arranging it in series with the choke increases the voltage across it.
Disturbances due to resonance, such as expe-rienced with capacitors arranged in parallel, do not occur. In addition, the ripple effect of the two individual lamps is improved, thus reducing the risk of a dangerous stroboscopic effect on rotating machinery.
This is why many power supply companies stipulate that users arrange the capacitor and ballast in series, and this method is generally recommended.
Selection table for discharge lampsThis table indicates the capacitors suitable for the various types of lamps.
Note: In the case of low-loss ballast, smaller capacitors than specified in the table are arranged in series. The recommended capacitance can vary from one lamp manufacturer to the next, but the capacitance stated on the choke is always definitive. These are the commonest capacitors used in series with low-loss ballasts.
Lamp power rating[W]
Shunt cap. capacitance[µF]
Series cap. capacitance[µF]
18 2.7 µF / 480 V
36 3.4 µF / 450 V 3.5 µF / 450 V
58 5.3 µF / 450 V 5.4 µF / 450 V
Fig. 14 Split-phase (lead-lag) circuit with the capacitor in series with the lamps, e.g. type LPMI (series capacitor) with 450 V rating
capacitor
choke
starter
fluorescent tubefluorescent tube
starter
choke
Lamp power rating[W]
Shunt cap. capacitance[µF]
Series cap. capacitance[µF]
Fluorescent lamps
4 to 16 2.0 / 230 V -
18 to 20 4.5 / 230 V 2.9 / 450 V
36 to 40 4.5 / 230 V 3.6 / 450 V
58 to 65 7.0 / 230 V 5.7 / 450 V
Metal-halide lamps
35 6.0 / 230 V -
70 12.0 / 230 V -
150 20.0 / 230 V -
250 32.0 / 230 V -
400 35.0 / 230 V -
1000 85.0 / 230 V -
2000 60.0 / 230 V -
3500 100.0 / 230 V -

23
Lamp power rating[W]
Shunt cap. capacitance[µF]
Series cap. capacitance[µF]
High pressure mercury lamps
50 7.0 / 230 V -
80 8.0 / 230 V -
125 10.0 / 230 V -
250 18.0 / 230 V -
400 25.0 / 230 V -
700 40.0 / 230 V -
1000 60.0 / 230 V -
Low pressure sodium lamps
18 5.0 / 230 V -
35 20.0 / 230 V -
55 20.0 / 230 V -
90 25.0 / 230 V -
135 45.0 / 230 V -
150 10.0 / 230 V -
180 40.0 / 230 V -
Lamp power rating[W]
Shunt cap. capacitance[µF]
Series cap. capacitance[µF]
High pressure sodium lamps
50 8.0 / 230 V -
70 12.0 / 230 V -
100 12.0 / 230 V -
150 20.0 / 230 V -
250 32.0 / 230 V -
400 50.0 / 230 V -
1000 100.0 / 230 V -
Group power factor correction for discharge lamps
If several discharge lamps are switched on and off together and they are arranged sym-metrically, a common three-phase capacitor assembly with a rated voltage of 440 V can be used.
Capacitor power rating:
where
Qc = capacitor power rating in kvarn = number of lamps, distributed bet-
ween the three phasesC = shunt capacitance per lamp in
µFExample: 24 fluorescent lamps each rated at 58 W 24 · 7 µF · 0.015 = 2.52 kvar
Fig. 15 Group correction for several discharge lamps distributed between the three phases (e.g. with type LKT power capacitor plus accessories)
capacitor
star
ter
fluor
esce
nt tu
be
chokechokechoke
star
ter
star
ter
fluor
esce
nt tu
be
fluor
esce
nt tu
be
Q n CC == ⋅⋅ ⋅⋅0 015.

24
Individual power factor correction for transformers
The utility company regulations for the allowable size of capacitors permanently connected to a transformer vary according to region. Before installing a PFC system of this type, it is therefore advisable to consult the utility company concerned. The modern design of transformer features core laminations that only require a small amount of power for reversal of magnetization. If the capacitor power rating is too high, overvoltage conditions may occur during no-load operation.
Capacitors with built-in fuse switch-disconnectors are well suited for this duty. If capacitors with fuse switch-disconnectors are connected directly to the transformer terminals, the designer should be aware of the fact that the lines to the capacitor are dimensioned for the full short-circuit power.
Transformer nominal rating [kVA] Capacitor power rating [kvar]
100 to 160 2.5
200 to 250 5.0
315 to 400 7.5
500 to 630 12.5
800 15.0
1000 20.0
1250 25.0
1600 35.0
2000 40.0
Table 3 Approximate capacitor ratings for individual power factor correction of transformers according to the German Association of Energy and Water Industries (BDEW)
The capacitor with fuse switch can be directly connected to the terminals of the transformer. This means that the lines to the capacitor must be dimensioned for the full short-circuit power.
Note: The fuse switches are operated under purely capacitive load. They must therefore never be withdrawn when under load or dange-rous arcing may otherwise occur!
If it is possible to disconnect the capacitor even when the transformer is switched on, a power capacitor with an automatic circuit breaker must be used.
Fig. 16 Typical transformer with permanent power factor correction
25
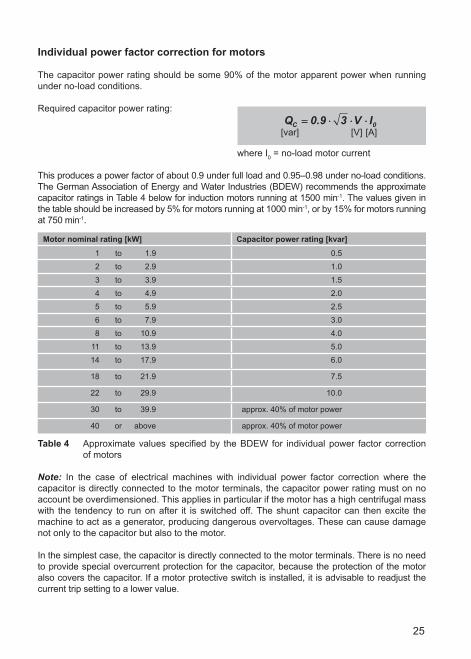
Individual power factor correction for motors
The capacitor power rating should be some 90% of the motor apparent power when running under no-load conditions.
Required capacitor power rating:
where I0 = no-load motor current
This produces a power factor of about 0.9 under full load and 0.95–0.98 under no-load conditions. The German Association of Energy and Water Industries (BDEW) recommends the approximate capacitor ratings in Table 4 below for induction motors running at 1500 min-1. The values given in the table should be increased by 5% for motors running at 1000 min-1, or by 15% for motors running at 750 min-1.
Motor nominal rating [kW] Capacitor power rating [kvar]
1 to 1.9 0.5
2 to 2.9 1.0
3 to 3.9 1.5
4 to 4.9 2.0
5 to 5.9 2.5
6 to 7.9 3.0
8 to 10.9 4.0
11 to 13.9 5.0
14 to 17.9 6.0
18 to 21.9 7.5
22 to 29.9 10.0
30 to 39.9 approx. 40% of motor power
40 or above approx. 40% of motor power
Table 4 Approximate values specified by the BDEW for individual power factor correction of motors
Note: In the case of electrical machines with individual power factor correction where the capacitor is directly connected to the motor terminals, the capacitor power rating must on no account be overdimensioned. This applies in particular if the motor has a high centrifugal mass with the tendency to run on after it is switched off. The shunt capacitor can then excite the machine to act as a generator, producing dangerous overvoltages. These can cause damage not only to the capacitor but also to the motor.
In the simplest case, the capacitor is directly connected to the motor terminals. There is no need to provide special overcurrent protection for the capacitor, because the protection of the motor also covers the capacitor. If a motor protective switch is installed, it is advisable to readjust the current trip setting to a lower value.
[var] [V] [A]Q V IC == ⋅⋅ ⋅⋅ ⋅⋅0 9 3 0.

26
Reduced trip current:
whereIth = new current trip setting (in A)IN = motor rated current as per name-
plate (in A)cos φ1 = cos φ as per nameplatecos φ2 = cos φ with PFC (approx. 0.95)
The capacitor discharges directly through the low ohmic resistance of the motor windings. Special discharge resistors are therefore not absolutely necessary.
Individual power factor correction for elevator and hoist motorsElevator and hoist motors work with safety devices, such as the brake release magnet, which actuates a quick-acting brake if power failure occurs. If the capacitor were directly in parallel with the motor, its residual energy could delay this emergency braking or even prevent it from being effective. The capacitors must therefore only be connected to the circuit before the switchgear. A separate contactor should be provided for the capacitor with its own rapid discharge facility, effected either by means of a discharge choke connected directly to the capacitor or with rapid discharge resistors switched in by the capacitor contactor.
An interlock must be incorporated in the control system to prevent the capacitor being switched in again before the discharge time has expired.
Fig. 17 Typical permanently installed power factor correction for a motor
I Ith N== ⋅⋅coscos
ϕϕϕϕ
12
25 kW induction motor running at 1500 min-1
10 kvar power capacitor e.g.: LKN 10-400-D32
Fig. 18 Elevator motor with own capaci-tor switching contactor and rapid discharge facility
controller disc
harg
e ch
oke
brak
e re
leas
e
mag
net
27
Because of the frequency of switching and the resultant wear and tear of the contactors, it is advisable to use capacitor sections with solid-state switches. These switch the capacitors in and out at zero current, response times in the order of milliseconds being attainable.
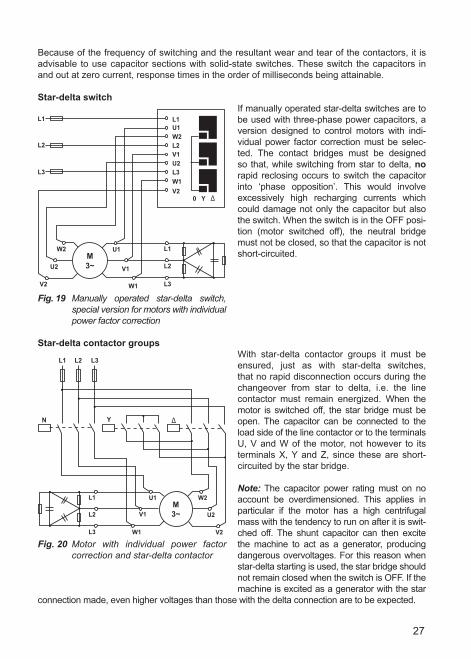
Star-delta switchIf manually operated star-delta switches are to be used with three-phase power capacitors, a version designed to control motors with indi-vidual power factor correction must be selec-ted. The contact bridges must be designed so that, while switching from star to delta, no rapid reclosing occurs to switch the capacitor into ‘phase opposition’. This would involve excessively high recharging currents which could damage not only the capacitor but also the switch. When the switch is in the OFF posi-tion (motor switched off), the neutral bridge must not be closed, so that the capacitor is not short-circuited.
Star-delta contactor groupsWith star-delta contactor groups it must be ensured, just as with star-delta switches, that no rapid disconnection occurs during the changeover from star to delta, i.e. the line contactor must remain energized. When the motor is switched off, the star bridge must be open. The capacitor can be connected to the load side of the line contactor or to the terminals U, V and W of the motor, not however to its terminals X, Y and Z, since these are short-circuited by the star bridge.
Note: The capacitor power rating must on no account be overdimensioned. This applies in particular if the motor has a high centrifugal mass with the tendency to run on after it is swit-ched off. The shunt capacitor can then excite the machine to act as a generator, producing dangerous overvoltages. For this reason when star-delta starting is used, the star bridge should not remain closed when the switch is OFF. If the machine is excited as a generator with the star
connection made, even higher voltages than those with the delta connection are to be expected.
Fig. 19 Manually operated star-delta switch, special version for motors with individual power factor correction
L1 L1U1
U1
V1
W1
W1
V1
V2
V2
L2 L2
U2
U2
W2
W2
L3 L3
L3
L2M3~
0 Y ∆
L1
Fig. 20 Motor with individual power factor correction and star-delta contactor
U1
V1
W1 V2
U2
W2
L3
L2M3~
L1
L1 L2 L3
N Y ∆
28
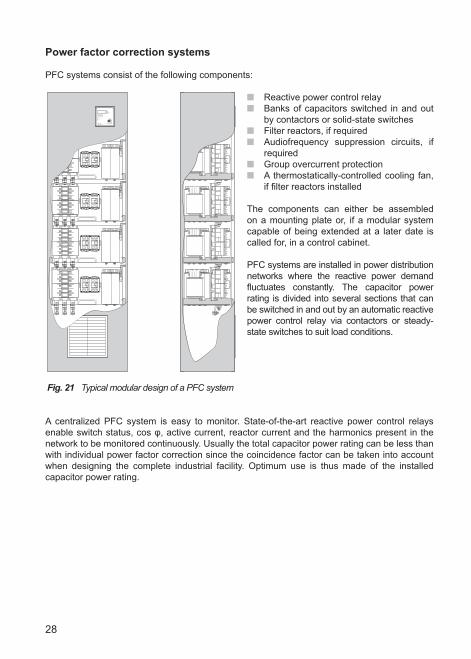
Power factor correction systems
PFC systems consist of the following components:
Reactive power control relay Banks of capacitors switched in and out
by contactors or solid-state switches Filter reactors, if required Audiofrequency suppression circuits, if
required Group overcurrent protection A thermostatically-controlled cooling fan,
if filter reactors installed
The components can either be assembled on a mounting plate or, if a modular system capable of being extended at a later date is called for, in a control cabinet.
PFC systems are installed in power distribution networks where the reactive power demand fluctuates constantly. The capacitor power rating is divided into several sections that can be switched in and out by an automatic reactive power control relay via contactors or steady-state switches to suit load conditions.
A centralized PFC system is easy to monitor. State-of-the-art reactive power control relays enable switch status, cos φ, active current, reactor current and the harmonics present in the network to be monitored continuously. Usually the total capacitor power rating can be less than with individual power factor correction since the coincidence factor can be taken into account when designing the complete industrial facility. Optimum use is thus made of the installed capacitor power rating.
Fig. 21 Typical modular design of a PFC system

29
Fig. 22 Typical PFC system circuit
Voltage path
3-phase supplyTo load circuitSupply side
Current transformer…/1 A to …/5 A
openedcosϕ1
closedcosϕ2
Power supply
Closed to give alarm
Alarm
cosϕ1/2
30
Performance characteristics
Power capacitors
FRAKO type LKT series power capacitors are PCB-free. They are manufactured with a self-healing dielectric. If this is punctured due to overload conditions (e.g. overvoltage), the capacitor element effectively repairs itself. As an additional protective measure, every capacitor has a reliable internal safety device which responds to excessive pressure.
Three key factors are important in the operation of power capacitors in power distribution systems: Rugged construction Long life expectancy Safety under overload conditions
Power capacitors are components with a very high power density, nowadays a reactive power of some 16 kvar being accommodated in a volume of one litre! This is achieved by attaining a very low dissipation factor and a high degree of utilization of the dielectric. To achieve a long service life despite this high energy density, partial discharges (i.e. negligible electrical discharges within the dielectric material) must be suppressed.
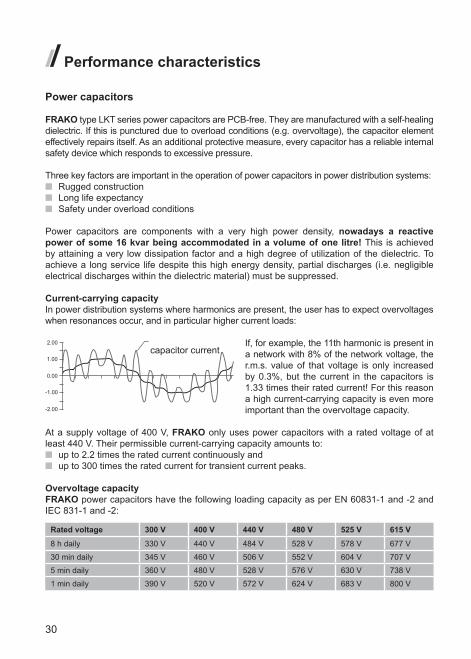
Current-carrying capacityIn power distribution systems where harmonics are present, the user has to expect overvoltages when resonances occur, and in particular higher current loads:
If, for example, the 11th harmonic is present in a network with 8% of the network voltage, the r.m.s. value of that voltage is only increased by 0.3%, but the current in the capacitors is 1.33 times their rated current! For this reason a high current-carrying capacity is even more important than the overvoltage capacity.
At a supply voltage of 400 V, FRAKO only uses power capacitors with a rated voltage of at least 440 V. Their permissible current-carrying capacity amounts to:
up to 2.2 times the rated current continuously and up to 300 times the rated current for transient current peaks.
Overvoltage capacityFRAKO power capacitors have the following loading capacity as per EN 60831-1 and -2 and IEC 831-1 and -2:
Rated voltage 300 V 400 V 440 V 480 V 525 V 615 V
8 h daily 330 V 440 V 484 V 528 V 578 V 677 V
30 min daily 345 V 460 V 506 V 552 V 604 V 707 V
5 min daily 360 V 480 V 528 V 576 V 630 V 738 V
1 min daily 390 V 520 V 572 V 624 V 683 V 800 V
2.00
1.00
0.00
-2.00
-1.00
capacitor current

31
Service lifeOvervoltage, overheating and harmonics shorten the life expectancy of a capacitor. Only extreme cleanliness in the production process and maximum purity of the materials used prevent a worsening of the loss factor and thus a reduction in dielectric strength and current-carrying capacity. Voltage endurance tests under very severe test conditions (1.5 x rated voltage, 60 °C ambient temperature, high harmonic distortion) are regularly carried out on capacitors from the production line. The loss of capacitance is far less than 1%, the failure rate is infinitesimal and the dissipation factors remain stable at a very low level.
The stated life expectancy of our LKT power capacitors is 100,000 to 170,000 operating hours, depending on capacitor type.
Safety characteristics at the end of the capacitor’s service lifeAn important safety consideration is to ensure that, in the event of the capacitor being overloaded and at the end of its service life, no danger to personnel or damage to other equipment can arise. This safety feature is only offered by modern power capacitors with a built-in interrupting device that
is activated by excessive internal pressure, disconnects the capacitor from the power supply and thus prevents the capacitor can being destroyed.
Because of the high power density of modern capacitors, FRAKO uses the most sophisticated and effective interrupting device, the flanged diaphragm lid.
The aluminium can and lid are rolled together and bonded with an elastic sealant.
The flanged diaphragm lid fitted in this way supports the capacitor terminals securely in position during normal operation. If an internal pressure develops inside the capacitor and reaches about 3 bar, the diaphragm lid bulges outwards, thus displacing the terminals axially by more than 10 mm at a pressure well below the critical figure. In most cases the internal leads act as mechanical fuses, breaking cleanly at a displacement of about 5 mm, thus disconnecting the element from the power supply without restriking. Manufacturing quality for this overpressure disconnecting mechanism is monitored at FRAKO by type testing and random sample tests. The test conditions are as set out in EN 60831-2.
FRAKO power capacitors therefore offer a high degree of safety when overloaded and at the end of their service life.
Fig. 23 Sectional view through a FRAKO power capacitor showing the mechanical fuses under excess internal pressure

32
Reactive power control relays
FRAKO reactive power control relays types EMR 1100, RM 9612 and RM 9606 use micro-processor technology to perform complex management tasks going way beyond the con-trol of the power factor itself to a given cos ϕ set point. Their innovative control characteris-tics meet all the requirements of present-day industrial power supply networks, giving these control relays universal applicability.
Their high accuracy and sensitivity even in networks badly affected by harmonics are worthy of mention, as is their ability to master continuous or sporadic reverse flow of power in networks with in-plant generators.
All components of the PFC system are care-fully managed by these control relays and are protected from overloads. This results in the life expectancy of the complete system being considerably extended.
Keyfeaturesindetail: Accurate measurement of cos ϕ even in networks badly affected by harmonics with
0.02 A to 5 A in the measurement circuit.Exact measurement of the power factor of the fundamental oscillation, even when the currents measured are very small, means that high precision is achieved in the cos ϕ control loop.
Adherence to the set cos ϕ as minimum value, while at the same time avoiding over-correction under low-load conditions.These seemingly contradictory properties are achieved by means of the patented ‘bent’ control characteristic, which ensures that under normal network loading the power factor is corrected to maintain its target value, but when the loading is low, overcorrection (often a problem with conventional systems) does not occur.
Measurement and monitoring of harmonics in low voltage networks(5th, 7th, 11th and 13th harmonics). This monitoring function keeps the user permanently informed about the network power quality and warnings are given in good time whenever critical parameters go beyond set limits. This enables distortions in the power distribution system and user circuits to be combated at an early stage by taking appropriate measures.
Overcurrent trip function for excessive r.m.s. current input of PFC systems without reactors.In addition to providing overload protection for PFC systems without reactors, the function also protects the complete electrical system against harmonic resonance. Disconnection is carried out if the set limit is exceeded for more than 75 seconds. Overcurrent disconnection is quicker to act than the protective device at the distribution board, which only affords pro-tection against short circuits because of the high current-carrying capacity of the capacitors.
Fig. 24 Type EMR 1100 reactive power control relay
EMR 1101Energy Management System
Reactive Power Control Relay
FRAKO Germany
Man
Set
IQ
–IP
+
IS
Harm
cos phi / Power Factor
Ampere
Harmonics
Regeneration
Alarm
Manual
Ind
Cap
1
12
6
7
2 3 4 5
8 9 10 11

33
The speed of response is dependent on the power demand.High load fluctuations are responded to quickly, while low load fluctuations are compensated for more slowly. This ensures that only completely discharged capacitor elements are switched into the network. Selective switching in relation to the power demand with the least possible number of switching operations - cyclic control for all stages of equal capacitance.
→ This combination of control characteristics results in the lowest possible number of switching operations, thus minimizing wear and tear and contributing to a longer service life for the PFC system.
→ At the same time critical network constellations are avoided by adjusting the capacitor power rating quickly and accurately to meet demand when heavy load changes occur. This contrasts with the conventional step-by- step process.
→ When correcting for large reductions in load, a prolonged overcorrection of idling trans-formers is prevented.
→ In networks with harmonic distortion, attenuation of the harmonic currents by the filter circuits is ensured in the shortest possible time. This is a reliable means of preventing the maximum permissible level of harmonic distortion being exceeded when a current converter is subjected to heavy load changes.
No-volt and zero-current release. This safety function disconnects the PFC system from the power supply if there is a break in the voltage or current measurement circuit. This precaution is to prevent violent surges, such as the system with its entire power demand being switched into the idling transformer following a transient interruption of voltage. After the voltage is re-established, the control relay switches in the appropriate number of capacitor stages again to suit the power demand.
Power factor control for systems with plant generators operating in parallel with the utility company’s supply network and feeding active energy into that network. The control relays use four-quadrant measurement for this function. In addition, various different control characteristic curves can be selected for the import and export of active energy. This ensures that when electrical energy is being drawn from the network no over-correction occurs, and when feeding energy into the network no reactive current is drawn. Only this combination of control characteristics can ensure that no costs are incurred for reactive current when energy is being fed into the supply network for prolonged periods of time.
Fixed amounts of capacitance for power factor correction independent of load. Fixed numbers of switched-in capacitor stages can be set that are not integrated in the control process but remain permanently switched in for as long as the operating voltage is applied to the control relay. All safety functions, such as the no-volt and zero-current release plus the overcurrent trip are also effective for the fixed stages that have been programmed.
Two control programs which work separately, with changeover activated by an external contact.Two programs can be assigned different cos ϕ set points and different control characteristic curves. This enables certain requirements by the utility company to be complied with, such as greater power factor correction during the day and less at night.

34
Start-up and operation Automatic adjustment to the power supply network and the PFC system to be controlled.
Start-up is greatly simplified by the fact that the control relay performs this function itself. The choice of the phase in which the current transformer is fitted and the polarity with which the current transformer is connected to the control relay is left to the installer. Phase angle and direction of power flow are determined by the control relay in the course of calibration. At the same time it measures the power ratings of the capacitor stages to which it is connected and disables those control relay output contacts that are not in use.If the installation is faulty, the control relay gives precise information on what is lacking to ensure correct operation.In the case of a subsequent increase in the rating of the PFC system, calibration should be repeated, so that the new capacitor stages can be immediately integrated in the control process. If this is not carried out, the relay identifies them after several days and integrates them automatically.The relay acts conversely if it identifies a defective stage during operation, separating it from the control process and marking it.
Indication and messages.All variables measured by the control relay can be shown in the display. When in operation, the display shows the actual cos ϕ measured at the location where the instrument transformer is installed. The display can also be switched over to show the following measured variables:
→ Apparent, active and reactive currents of the phase conductor that is monitored. → Relative harmonic levels of the 5th, 7th, 11th and 13th harmonics in relation to the voltage
measured in the connected circuit. → The peaks that occur when set limits are exceeded (overcurrent, harmonics and cos ϕ)
can also be accessed and displayed. Counting and display of the switching cycles of each control contact and appropriate
messaging when the set limit has been reached.Contactors are subject to considerable stress when switching capacitive loads. Chattering switching contacts result in high recharging currents in the capacitors and severe wear and tear of the switching contacts themselves. Replacing the switching contactors in good time can considerably prolong the service life of the PFC system. The reactive power control relay indicates the optimum point in time when the switching contactors should be replaced and thus helps to cut costs. For preventive maintenance purposes, the user can display the cumulative total of switching cycles for each individual capacitor element.
Fig. 25 Control process with a classical reactive power control relay using step-by-step switching
stag
e re
actio
nre
activ
e po
wer
dem
and
approx. 150 seconds approx. 150 seconds
stag
e re
actio
nre
activ
e po
wer
dem
and
5-30 seconds 5-30 seconds
Fig. 26 Control process with FRAKO state-of-the-art reactive power control relays RM 9606, EMR 1100 S and EMR 1100

35
Indicated parameters, messages and alarms
Information Communicated via Alarm contact
Actual cos ϕ indicator display
Apparent, active, reactive current (true values)
indicator display
Harmonics (5th, 7th, 11th, 13th) indicator display
Harmonics (5th, 7th, 11th, 13th) alarm display / LED closes
Overcurrent (adjustable from 1.05 Inom to 3.0 Inom)
alarm display / LED closes
Actual cos ϕ outside characteristic curve with indication of extra capacitive power needed
alarm display / LED closes (can be disabled)
Number of switching cycles per control contact
indicator display
Set limit for number of switching cycles exceeded
alarm display / LED closes
No measured voltage alarm display closes
No measured current message display
Control relay detects no capaci-tance at any control contact
alarm display closes
Capacitor stages switched in indicator LED
No operating voltage closes

36
Installation
Current transformer
A current transformer is necessary to ope-rate PFC systems. This is not included in the scope of supply, but can be provided with the system after clarification of user requirements. The primary current in the transformer is deter-mined by the user’s current input, i.e. this unit is designed for the maximum current loading or the installed load connected to the power transformer. The reactive power control relay current circuit is designed for a .../ 1 to .../5 A current transformer with a 5 VA rating and Class 3 accuracy. If ammeters are installed in series with the control relay, the rating of the current transformer must be increased to suit. The internal power consumption in the control relay current circuit amounts to some 1.8 VA for a current transformer of rated current 5 A.
If further instruments need to be powered from the same current transformer, this must be taken into account when specifying its rating.
Losses also occur in the current transformer wiring, and these must also be taken into account if there are long lengths of cable between the current transformer and the reactive power control relay.
Power losses in copper conductorsfrom the current transformer with a secondary current of 5 A:
Cross section
[mm²]
Losses per metre of two-wire line[VA]
2.5 0.36
4.0 0.22
6.0 0.15
10.0 0.09
Fig. 27 Correctly installed current transformer registers load current and capacitor current
reactive power control relay
Fig. 28 Incorrect! The current transformer only registers the load current: the capacitor bank is switched in but not out again. The reactive power control relay gives the message “C = 0” (no capacitor current can be measured)
reactive power control relay

37
Note: The current transformer must be installed in one of the three phases so that the entire current to the consumers requiring PFC and the capacitor current flow through it (as shown in the diagrams on the left). The terminal P1 (K) is connected to the supply side, terminal P2 (L) to the consumer side.
Caution: When the primary circuit is broken, voltage surges occur which could destroy the current transformer. The terminals S1 (k) and S2 (l) must therefore be short-circuited before the transformer circuit is broken.
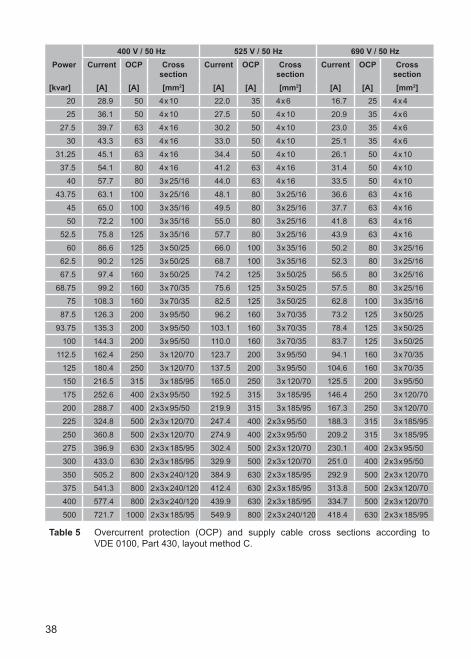
Overcurrent protection and cables
When installation work is carried out, the regulations VDE 0100 and VDE 0105 of the German Association for Electrical, Electronic & Information Technologies, the general guidelines of the BDEW (German Association of Energy and Water Industries) and the conditions of supply of the utility company concerned must be complied with. VDE 0560 Part 46 states that capacitor units must be suitable for a continuous r.m.s. current of 1.3 times the current that is drawn at the sinusoidal rated voltage and nominal frequency. If the capacitance tolerance of 1.1 x CN is also taken into account, the maximum allowable current can reach values of up to 1.38 x IN. This overload capability together with the high in-rush current to the capacitors must be taken into account when designing protective devices and cable cross sections.
Note: FRAKO power capacitors offer a current load capacity of up to 2.2 x IN.
400 V / 50 Hz 525 V / 50 Hz 690 V / 50 HzPower Current OCP Cross
sectionCurrent OCP Cross
sectionCurrent OCP Cross
section[kvar] [A] [A] [mm2] [A] [A] [mm2] [A] [A] [mm2]
2.5 3.6 10 4 x 1.5 2.7 10 4 x 1.5 2.1 10 4 x 1.5
5 7.2 10 4 x 1.5 5.5 10 4 x 1.5 4.2 10 4 x 1.5
6.25 9.0 16 4 x 2.5 6.9 10 4 x 1.5 5.2 10 4 x 1.5
7.5 10.8 16 4 x 2.5 8.2 16 4 x 2.5 6.3 10 4 x 1.5
10 14.4 20 4 x 2.5 11.0 16 4 x 2.5 8.4 16 4 x 2.5
12.5 18.0 25 4 x 4 13.7 20 4 x 2.5 10.5 16 4 x 2.5
15 21.7 35 4 x 6 16.5 25 4 x 4 12.6 20 4 x 2.5
17.5 25.3 35 4 x 6 19.2 35 4 x 6 14.6 25 4 x 4
Table 5 Overcurrent protection (OCP) and supply cable cross sections according to VDE 0100, Part 430, layout method C.
Fig. 29 Incorrect! The current transformer only registers the capacitor current: the capa-citor is not switched in. The reactive power control relay gives the message I = 0 (no current in transformer circuit)!
reactive power control relay
38
400 V / 50 Hz 525 V / 50 Hz 690 V / 50 HzPower Current OCP Cross
sectionCurrent OCP Cross
sectionCurrent OCP Cross
section[kvar] [A] [A] [mm2] [A] [A] [mm2] [A] [A] [mm2]
20 28.9 50 4 x 10 22.0 35 4 x 6 16.7 25 4 x 4
25 36.1 50 4 x 10 27.5 50 4 x 10 20.9 35 4 x 6
27.5 39.7 63 4 x 16 30.2 50 4 x 10 23.0 35 4 x 6
30 43.3 63 4 x 16 33.0 50 4 x 10 25.1 35 4 x 6
31.25 45.1 63 4 x 16 34.4 50 4 x 10 26.1 50 4 x 10
37.5 54.1 80 4 x 16 41.2 63 4 x 16 31.4 50 4 x 10
40 57.7 80 3 x 25/16 44.0 63 4 x 16 33.5 50 4 x 10
43.75 63.1 100 3 x 25/16 48.1 80 3 x 25/16 36.6 63 4 x 16
45 65.0 100 3 x 35/16 49.5 80 3 x 25/16 37.7 63 4 x 16
50 72.2 100 3 x 35/16 55.0 80 3 x 25/16 41.8 63 4 x 16
52.5 75.8 125 3 x 35/16 57.7 80 3 x 25/16 43.9 63 4 x 16
60 86.6 125 3 x 50/25 66.0 100 3 x 35/16 50.2 80 3 x 25/16
62.5 90.2 125 3 x 50/25 68.7 100 3 x 35/16 52.3 80 3 x 25/16
67.5 97.4 160 3 x 50/25 74.2 125 3 x 50/25 56.5 80 3 x 25/16
68.75 99.2 160 3 x 70/35 75.6 125 3 x 50/25 57.5 80 3 x 25/16
75 108.3 160 3 x 70/35 82.5 125 3 x 50/25 62.8 100 3 x 35/16
87.5 126.3 200 3 x 95/50 96.2 160 3 x 70/35 73.2 125 3 x 50/25
93.75 135.3 200 3 x 95/50 103.1 160 3 x 70/35 78.4 125 3 x 50/25
100 144.3 200 3 x 95/50 110.0 160 3 x 70/35 83.7 125 3 x 50/25
112.5 162.4 250 3 x 120/70 123.7 200 3 x 95/50 94.1 160 3 x 70/35
125 180.4 250 3 x 120/70 137.5 200 3 x 95/50 104.6 160 3 x 70/35
150 216.5 315 3 x 185/95 165.0 250 3 x 120/70 125.5 200 3 x 95/50
175 252.6 400 2 x 3 x 95/50 192.5 315 3 x 185/95 146.4 250 3 x 120/70
200 288.7 400 2 x 3 x 95/50 219.9 315 3 x 185/95 167.3 250 3 x 120/70
225 324.8 500 2 x 3 x 120/70 247.4 400 2 x 3 x 95/50 188.3 315 3 x 185/95
250 360.8 500 2 x 3 x 120/70 274.9 400 2 x 3 x 95/50 209.2 315 3 x 185/95
275 396.9 630 2 x 3 x 185/95 302.4 500 2 x 3 x 120/70 230.1 400 2 x 3 x 95/50
300 433.0 630 2 x 3 x 185/95 329.9 500 2 x 3 x 120/70 251.0 400 2 x 3 x 95/50
350 505.2 800 2 x 3 x 240/120 384.9 630 2 x 3 x 185/95 292.9 500 2 x 3 x 120/70
375 541.3 800 2 x 3 x 240/120 412.4 630 2 x 3 x 185/95 313.8 500 2 x 3 x 120/70
400 577.4 800 2 x 3 x 240/120 439.9 630 2 x 3 x 185/95 334.7 500 2 x 3 x 120/70
500 721.7 1000 2 x 3 x 185/95 549.9 800 2 x 3 x 240/120 418.4 630 2 x 3 x 185/95
Table 5 Overcurrent protection (OCP) and supply cable cross sections according to VDE 0100, Part 430, layout method C.

39
Conductor cross section
NYM NYY NYCY/NYCWY H05VV-F H07RN-F
[mm2] ∅ [mm] ∅ [mm] ∅ [mm] ∅ [mm] ∅ [mm] 2 x 1.5 9.0 11.0 12.0 10.5 11.5
2 x 2.5 10.5 13.0 14.0 12.5 13.5
3 x 1.5 10.0 11.0 13.0 11.0 12.5
3 x 2.5 11.0 13.0 14.0 13.0 14.5
3 x 4.0 12.5 15.0 16.0 - 16.0
3 x 6.0 14.0 16.0 17.0 - 20.0
3 x 10.0 17.0 19.0 18.0 - 25.5
3 x 16.0 20.0 21.0 21.0 - 29.0
4 x 1.5 10.5 13.0 14.0 12.5 13.5
4 x 2.5 12.0 14.0 15.0 14.0 15.5
4 x 4.0 14.0 16.0 17.0 - 18.0
4 x 6.0 15.0 17.0 18.0 - 22.0
4 x 10.0 18.0 20.0 20.0 - 28.0
4 x 16.0 23.0 23.0 23.0 - 32.0
4 x 25.0 27.5 27.0 28.0 - 37.0
4 x 35.0 31.0 30.0 29.0 - 42.0
4 x 50.0 - 35.0 34.0 - 48.0
4 x 70.0 - 40.0 37.0 - 54.0
4 x 95.0 - 45.0 42.0 - 60.0
4 x 120.0 - 50.0 47.0 - -
4 x 150.0 - 53.0 52.0 - -
4 x 185.0 - 60.0 60.0 - -
4 x 240.0 - 71.0 70.0 - -
5 x 1.5 11.0 13.5 15.0 13.5 15.0
5 x 2.5 13.0 15.0 17.0 15.5 17.0
5 x 4.0 15.0 16.5 18.0 - 19.0
5 x 6.0 18.0 19.0 20.0 - 24.0
5 x 10.0 20.0 21.0 - - 30.0
5 x 16.0 24.0 23.0 - 35.0 -
7 x 1.5 - 13.5 - - -
10 x 1.5 - 17.0 - - -
12 x 1.5 - 17.5 - - -
14 x 1.5 - 18.0 - - -
16 x 1.5 - 19.0 - - -
24 x 1.5 - 23.0 - - -
Table 6 Outer diameters of cables and conductors

40
NYM Light plastic-sheathed cableNYY Cable with plastic sheathNYCY Cable with concentric conductor
and plastic sheathNYCWY Cable with concentric, waveconal
conductor and plastic sheathH05VV-F Ordinary rubber-sheathed flexible
cable (NLH. NMH)H07RN-F Heavy rubber-sheathed flexible
cable (NSH)
Metric thread Pg Cable outer diameter Knockout diameter[mm]
M 16 x 1.5 11 6.5 - 10.5 19.0
- 13.5 8.0 - 12.5 21.0
M 20 x 1.5 16 10.0 - 15.0 23.0
M 25 x 1.5 21 12.0 - 20.0 29.0
M 32 x 1.5 29 19.0 - 26.5 38.0
M 40 x 1.5 36 29.0 - 34.0 49.0
- 42 34.0 - 41.0 55.0
M 50 x 1.5 48 40.0 - 45.0 60.0
Table 7 Cable entry with cable glands
Ingress protection
The standard EN 60529 specifies the degree of protection for electrical enclosures by means of two letters and a two-digit number. IP stands for ingress protection, while the first and second numbers specify the protection against solid objects and liquids respectively. The following are the most frequently encountered combinations:
Protection Against accidental contact
Against solid objects Against liquids
IP 00 none none none
IP 10 against accidental or inadvertent contact
over 50 mm diameter none
IP 20 against fingers and objects up to 80 mm long
over 50 mm diameter none
IP 30 against tools and wires thicker than 2.5 mm
over 50 mm diameter none
IP 31 against tools and wires thicker than 2.5 mm
over 50 mm diameter drops of water falling vertically
IP 40 against wires or strips thicker than 1 mm
over 50 mm diameter none
Table 8 Common ingress protection codes

41
Protection Against accidental contact
Against solid objects Against liquids
IP 41 against wires or strips thicker than 1 mm
over 50 mm diameter drops of water falling vertically
IP 42 against wires or strips thicker than 1 mm
over 50 mm diameter drops of water falling at up to 15° from the vertical
IP 43 against wires or strips thicker than 1 mm
over 50 mm diameter water sprayed at up to 60° from the vertical
IP 54 complete protection dust deposits water splashed from all directions
IP 65 complete protection dust ingress water jets from all directions
Table 8 Common ingress protection codes
42
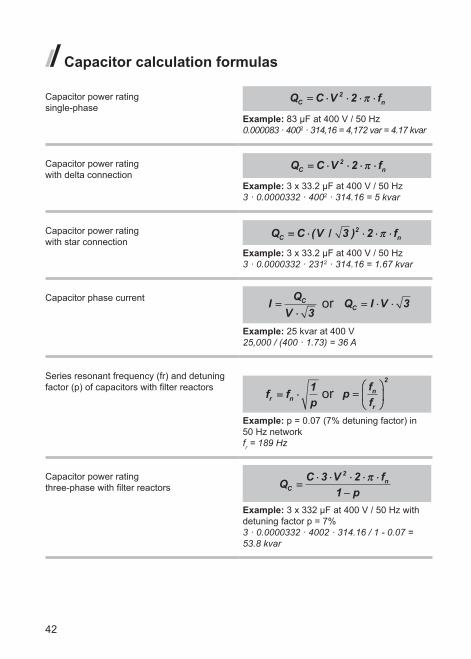
Capacitor calculation formulas
Capacitor power rating single-phase
Q C V fC n== ⋅⋅ ⋅⋅ ⋅⋅ ⋅⋅2 2 ππ
Example: 83 µF at 400 V / 50 Hz0.000083 · 4002 · 314,16 = 4,172 var = 4.17 kvar
Capacitor power rating with delta connection
Q C V fC n== ⋅⋅ ⋅⋅ ⋅⋅ ⋅⋅2 2 ππ
Example: 3 x 33.2 µF at 400 V / 50 Hz3 · 0.0000332 · 4002 · 314.16 = 5 kvar
Capacitor power rating with star connection
Q C V fC n== ⋅⋅ ⋅⋅ ⋅⋅ ⋅⋅( / )3 22 ππ
Example: 3 x 33.2 µF at 400 V / 50 Hz3 · 0.0000332 · 2312 · 314.16 = 1.67 kvar
Capacitor phase current IQ
VC==⋅⋅ 3
Q I VC == ⋅⋅ ⋅⋅ 3or
Example: 25 kvar at 400 V25,000 / (400 · 1.73) = 36 A
Series resonant frequency (fr) and detuning factor (p) of capacitors with filter reactors orf f
pr n== ⋅⋅1
pffn
r
==
2
Example: p = 0.07 (7% detuning factor) in 50 Hz networkfr = 189 Hz
Capacitor power rating three-phase with filter reactors Q
C V fpC
n==⋅⋅ ⋅⋅ ⋅⋅ ⋅⋅ ⋅⋅
−−3 2
1
2 ππ
Example: 3 x 332 µF at 400 V / 50 Hz with detuning factor p = 7%3 · 0.0000332 · 4002 · 314.16 / 1 - 0.07 = 53.8 kvar
43
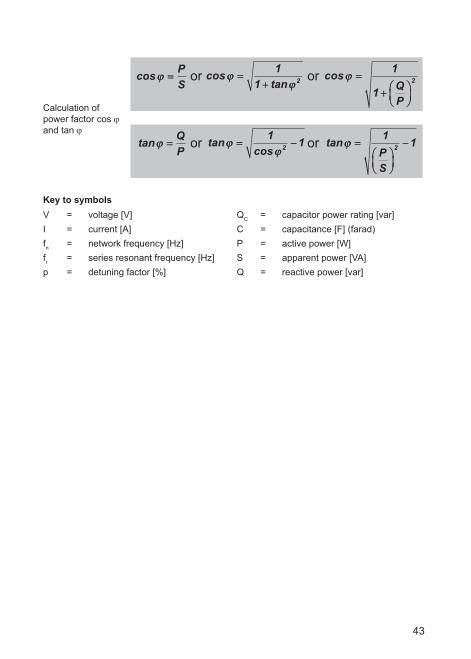
Calculation of power factor cos ϕ and tan ϕ
orcosϕϕ ==PS
costan
ϕϕϕϕ
==++
11 2 cosϕϕ ==
++
1
12Q
P
or
or ortanϕϕ ==QP
tancos
ϕϕϕϕ
== −−1
12 tanϕϕ ==
−−1
12PS
Key to symbolsV = voltage [V] QC = capacitor power rating [var]I = current [A] C = capacitance [F] (farad)fn = network frequency [Hz] P = active power [W]fr = series resonant frequency [Hz] S = apparent power [VA]p = detuning factor [%] Q = reactive power [var]
44
Harmonics
What are harmonics?
Modern low voltage networks increasingly have loads installed that draw non-sinusoidal currents from the power distribution system. These load currents cause voltage drops through the system impedances which distort the original sinusoidal supply voltage. Fourier analysis can be used to separate these superposed waveforms into the basic oscillation (supply frequency) and the individual harmonics. The frequencies of the harmonics are integral multiples of the basic oscillation and are denoted by the ordinal number ‘n’ or ‘ν’ (Example: supply frequency = 50 Hz → 5th harmonic = 250 Hz).
Linear loads are: Ohmic resistances (resistance heaters, light bulbs, etc.) Three-phase motors Capacitors
Non-linear loads (harmonics generators) are: Transformers and chokes Electronic power converters Rectifiers and converters, especially when controlling variable-speed induction motors Induction and electric arc furnaces, welding equipment Uninterruptible power supplies (UPS systems) Single-phase switched-mode power supply units for modern electronic loads such as televisions,
VCRs, computers, monitors, printers, telefax machines, electronic ballasts, compact energy-saving lamps
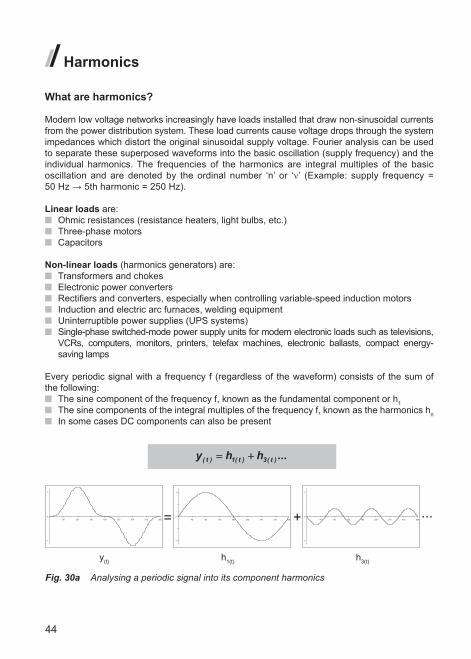
Every periodic signal with a frequency f (regardless of the waveform) consists of the sum of the following:
The sine component of the frequency f, known as the fundamental component or h1 The sine components of the integral multiples of the frequency f, known as the harmonics hn In some cases DC components can also be present
y h ht t t( ) ( ) ( ) ...== ++1 3
Fig. 30a Analysing a periodic signal into its component harmonics
+= ...
y(t) h1(t) h3(t)
45
Harmonics can be divided into: Even harmonics (2nd, 4th, 6th, etc.)
as a rule only occur due to sudden load variations or faults in converters Odd harmonics (3rd, 5th, 7th, etc.)
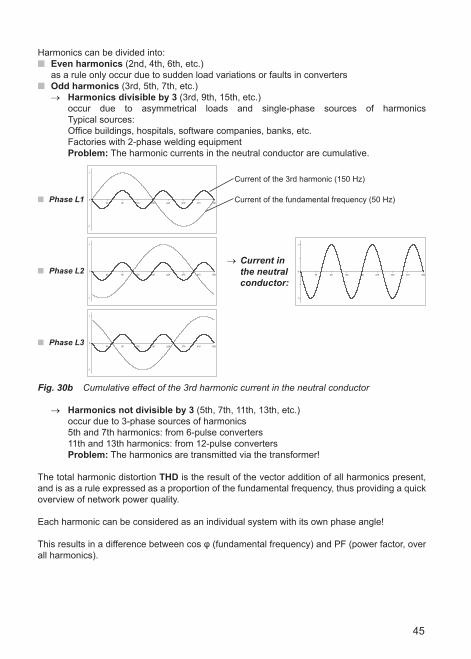
→ Harmonics divisible by 3 (3rd, 9th, 15th, etc.) occur due to asymmetrical loads and single-phase sources of harmonics Typical sources:Office buildings, hospitals, software companies, banks, etc.Factories with 2-phase welding equipmentProblem: The harmonic currents in the neutral conductor are cumulative.
→ Harmonics not divisible by 3 (5th, 7th, 11th, 13th, etc.)occur due to 3-phase sources of harmonics5th and 7th harmonics: from 6-pulse converters11th and 13th harmonics: from 12-pulse convertersProblem: The harmonics are transmitted via the transformer!
The total harmonic distortion THD is the result of the vector addition of all harmonics present, and is as a rule expressed as a proportion of the fundamental frequency, thus providing a quick overview of network power quality.
Each harmonic can be considered as an individual system with its own phase angle!
This results in a difference between cos φ (fundamental frequency) and PF (power factor, over all harmonics).
Fig. 30b Cumulative effect of the 3rd harmonic current in the neutral conductor
Phase L1
Phase L2
Phase L3
→ Current in the neutral conductor:
Current of the 3rd harmonic (150 Hz)
Current of the fundamental frequency (50 Hz)

46
Harmonics are generated not only in industrial installations, but also increasingly in private households.
As a rule the devices generating these har-monics only feed in the odd orders, so that it is only the 3rd, 5th, 7th, 9th, 11th, etc. harmonics that are encountered.
How are harmonics produced?
In a commercial facility’s own low voltage network, especially when variable-speed drives are installed.
In every household: in every television, computer and in compact energy-saving lamps with electronic ballasts. The sheer number of these loads in the evenings with the currents in phase gives rise to high levels of harmonics in some medium voltage networks.
What is the level of these harmonics if no PFC system has yet been installed?a.) Inafacility’sownlowvoltagesystem:
depending on the power of the installed converters and rectifiers.
If, for example, a large 6-pulse converter is installed in the network and its power rating is 50% of the transformer nominal rating, this gives rise to about
4% of the 5th harmonic (250 Hz) and 3% of the 7th harmonic (350 Hz)
Fig. 30c Network current and voltage superposed with the following har-monics: 5% of the 5th harmonic, 4% of the 7th harmonic and 2.5% of the 11th harmonic
CurrentVoltage
Fig. 31 Current of a power rectifier Fig. 32 Line current of a converter for induction motors
47
It is more usual, however, for several small converters that are not linked to each other to be installed in a network. The fact that the currents to the individual rectifiers are not all in phase means that the resulting harmonic voltages are less than in the above case.
If, for example, several rectifiers with a combined power of some 25% of the transformer nominal rating are installed, this gives rise to some
1 – 1.5% of the 5th harmonic and 0.7 – 1% of the 7th harmonic.
These are approximate values to help in the initial assessment of whether a detuned PFC system needs to be installed.
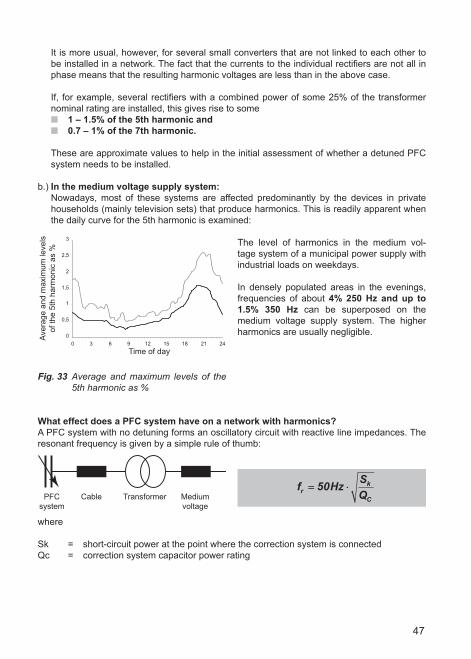
b.) Inthemediumvoltagesupplysystem:Nowadays, most of these systems are affected predominantly by the devices in private households (mainly television sets) that produce harmonics. This is readily apparent when the daily curve for the 5th harmonic is examined:
The level of harmonics in the medium vol-tage system of a municipal power supply with industrial loads on weekdays.
In densely populated areas in the evenings, frequencies of about 4% 250 Hz and up to 1.5% 350 Hz can be superposed on the medium voltage supply system. The higher harmonics are usually negligible.
What effect does a PFC system have on a network with harmonics?A PFC system with no detuning forms an oscillatory circuit with reactive line impedances. The resonant frequency is given by a simple rule of thumb:
where
Sk = short-circuit power at the point where the correction system is connectedQc = correction system capacitor power rating
Fig. 33 Average and maximum levels of the 5th harmonic as %
Aver
age
and
max
imum
leve
ls
of th
e 5t
h ha
rmon
ic a
s %
Time of day
PFC system
Cable Transformer Medium voltage
f HzSQr
k
C
== ⋅⋅50
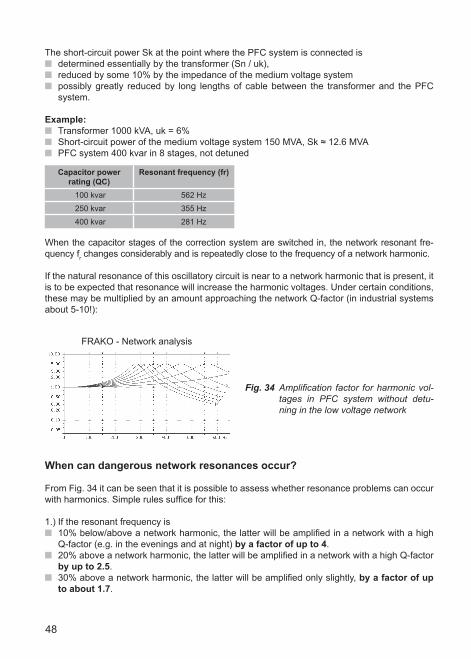
48
The short-circuit power Sk at the point where the PFC system is connected is determined essentially by the transformer (Sn / uk), reduced by some 10% by the impedance of the medium voltage system possibly greatly reduced by long lengths of cable between the transformer and the PFC
system.
Example: Transformer 1000 kVA, uk = 6% Short-circuit power of the medium voltage system 150 MVA, Sk ≈ 12.6 MVA PFC system 400 kvar in 8 stages, not detuned
Capacitor power rating (QC)
Resonant frequency (fr)
100 kvar 562 Hz
250 kvar 355 Hz
400 kvar 281 Hz
When the capacitor stages of the correction system are switched in, the network resonant fre-quency fr changes considerably and is repeatedly close to the frequency of a network harmonic.
If the natural resonance of this oscillatory circuit is near to a network harmonic that is present, it is to be expected that resonance will increase the harmonic voltages. Under certain conditions, these may be multiplied by an amount approaching the network Q-factor (in industrial systems about 5-10!):
When can dangerous network resonances occur?
From Fig. 34 it can be seen that it is possible to assess whether resonance problems can occur with harmonics. Simple rules suffice for this:
1.) If the resonant frequency is 10% below/above a network harmonic, the latter will be amplified in a network with a high
Q-factor (e.g. in the evenings and at night) by a factor of up to 4. 20% above a network harmonic, the latter will be amplified in a network with a high Q-factor
by up to 2.5. 30% above a network harmonic, the latter will be amplified only slightly, by a factor of up
to about 1.7.
Fig. 34 Amplification factor for harmonic vol-tages in PFC system without detu-ning in the low voltage network
FRAKO - Network analysis
49
2.) In a network with no harmonic generator of its own, but with pronounced harmonics present in the medium voltage system, the following can occur:
at a resonant frequency below 400 Hz - resonance peaks of the 7th harmonic, at a resonant frequency below 300 Hz - dangerous resonance peaks of the 5th harmonic
(250 Hz).
Whateffectdoesthenetworkconfigurationhaveontheproblemofharmonics?
The network short-circuit power determines the resonant frequency and, where harmonic generators are present in that network, the amplitude of the harmonics in the network voltage.
If the network short-circuit power at the point where the PFC system is connected is too low, this causes problems.
If the short-circuit power is changed radically due to altered switching conditions, this causes problems.
Example:In many large commercial facilities continuity of power supply is achieved by connecting the low voltage distribution points via a ring circuit. This network has a high short-circuit power even with large PFC systems and heavy rectifier loads with hardly any harmonics problems arising since the resonant frequency is high and the harmonic currents are dissipated with low voltage drops into the medium voltage system. If a break is made in the ring circuit, for example for maintenance work, the short-circuit power can decrease considerably under certain conditions, so that the resonant frequency can fall below 300 Hz!
Voltage and current loads on PFC systems without detuning
When resonance occurs, the network r.m.s. voltage only increases slightly, but the r.m.s. value of the capacitor current increases considerably. In the case of resonance with the fifth harmonic, this can reach a level of, say, 15% in which case:
The network r.m.s. voltage increases by 1% The crest working line voltage increases by 10-15% (depending on phase angle) The r.m.s. value of the capacitor current increases by 25%!
In the case of resonance with the 11th harmonic, this can reach a level of, say, 10% in which case: The network r.m.s. voltage increases by 0.5% The peak value of the mains voltage increases by 6-10% The r.m.s. value of the capacitor current increases by 50%!
For this reason a high current-carrying capacity is one of the most important quality characteristics for a capacitor!
FRAKO capacitors can withstand an overcurrent up to 2.7 times the rated current as a continuous load!

50
Designing for networks with harmonicsWhat must be done if resonance is possible but rather unlikely?A considerable proportion of installations being designed today fall into this category, e.g.:
No internal harmonic generators installed in the network, no harmonics in the medium voltage system, but a resonant frequency below 400 Hz.
If changes are made in the network configuration, for example, during maintenance work, the resonant frequency can fall below 400 Hz. Harmonics are present in the medium voltage distribution system.
It is planned to build installations with rectifiers at a later date.
To protect an installation without detuning from the occurrence of resonance, even if this may only happen occasionally, it is highly advantageous to use the EMA 1101 Mains Monitoring Instrument. This device monitors all three phases of the power supply system, shuts the installation down if a dangerous level of harmonics is exceeded and switches it automatically in again when this level falls below the critical value. The peak values that have occurred are stored, however, and can be retrieved via the EMA 1101 bus interface.
For distribution systems that are symmetrically loaded, the EMR 1100 Power Factor Control Relay can also be installed. This instrument monitors the system to detect any resonance that may occur. The EMR 1100 power factor control relay determines the harmonic voltages in the measured phase and calculates the r.m.s. current to the capacitors. If a programmed maximum limit is exceeded, the installation is shut down and switched in when the level falls below its critical value.
Incasesofthisdescription,PFCsystemsthatcanberetrofittedwithdetuningareofteninstalled.
Planning for PFC systems in networks with harmonicsThe best information on the operational characteristics of a planned PFC system is obtained by a combination of two planning activities:
Measuring the harmonic voltages and currents over several days with no PFC system installed. Theoretical calculation of the network resonance characteristics.
In the measured network the following harmonic levels are to be expected with PFC:
Maximum value of measurement without power factor correction multiplied by the resonance factor from the network analysis.

51
Example:An average-size low voltage system with a 1000 kVA transformer. The installation, com-plete with the PFC system, is connected via two 20 m long cables laid in parallel (equivalent to the impedance of a 10 m cable). Only purely ohmic loads may be taken into account as equipment such as induction motors have no damping effect on harmonics. With a 400 kvar installation and all capacitor sections switched in, the 5th harmonic (250 Hz) is amplified by a factor of about 3. At 250 kvar the 7th harmonic is amplified by a factor of about 4!
During the day, with increased network damping, these factors are lower, but in the evenings and at weekends the amplification factor for the 7th can be higher.
Measures to counteract expected resonances
If harmonics with high voltage levels, such as:
4% of the 3rd harmonic (150 Hz) 5% of the 5th harmonic (250 Hz) 4% of the 7th harmonic (350 Hz) 3% of the 11th harmonic (550 Hz) 2.1% of the 13th harmonic (650 Hz)
due to resonance induced amplification are anticipated when planning a PFC system, serious disruptions can occur in the low voltage distribution system:
Problems with IT systems and CNC machines Damage to rectifiers and/or converters Uncontrolled tripping of a variable capacitor bank and circuit breakers Shutdown of PFC systems without detuning Voltage peaks in the distribution system Increased eddy current losses in transformers and induction motors
If the level of individual harmonics with no PFC system amounts to more than 1.5% (7th and higher harmonics) or 2% (5th harmonic) and the resonant frequency of the network can be close to these harmonics, then it must be assumed that these permissible limits will be exceeded by resonance-induced amplification.
In situations of this type, only detuned PFC systems should be used in order not to jeopardize the reliability of the low voltage distribution system.
FRAKO - Network analysis
Fig. 35 Amplification of harmonic voltages as a function of the capacitor stages switched in FRAKO - Mains Analysis

52
A detuned capacitor consists of a capacitor in series with a filter reactor. Its series resonant
frequency is adjusted by appropriate design of the filter reactor so that it is below the frequency of the 5th harmonic (250 Hz). This combination therefore has an inductive characteristic for all frequencies above the series resonant frequency. Resonance between the capacitors and the reactive network impedances is no longer possible. A detuned system suppresses some of the harmonic currents. To prevent overloads due to the 5th harmonic still present in the network, it is present-day practice to adjust the resonant frequency of the detuned circuit to 189 Hz or less.
The detuned circuit is characterized either by the capacitor-choke resonant frequency (fr) or by the relative voltage drop (p) at the choke. These two parameters are related by the following formula:
Example:p = 0.07 (7%)fr = 189 Hz
FRAKO - Network analysis
Fig. 36 Damping of harmonic voltages as a function of the detuned capacitor sections
Detuning reduces the resonant frequency to a value below 250 Hz. All harmonics above the resonant frequency of the detuned system are attenuated.
f Hzpr == ⋅⋅501
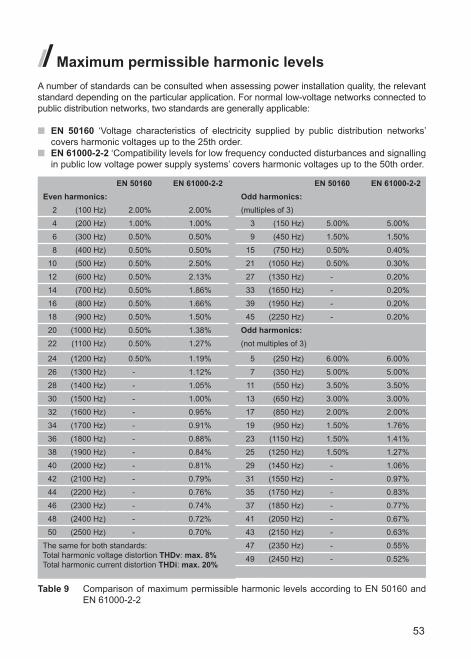
53
Maximum permissible harmonic levelsA number of standards can be consulted when assessing power installation quality, the relevant standard depending on the particular application. For normal low-voltage networks connected to public distribution networks, two standards are generally applicable:
EN 50160 ‘Voltage characteristics of electricity supplied by public distribution networks’ covers harmonic voltages up to the 25th order.
EN 61000-2-2 ‘Compatibility levels for low frequency conducted disturbances and signalling in public low voltage power supply systems’ covers harmonic voltages up to the 50th order.
EN 50160 EN 61000-2-2 EN 50160 EN 61000-2-2Evenharmonics: Oddharmonics:
2 (100 Hz) 2.00% 2.00% (multiples of 3)
4 (200 Hz) 1.00% 1.00% 3 (150 Hz) 5.00% 5.00%
6 (300 Hz) 0.50% 0.50% 9 (450 Hz) 1.50% 1.50%
8 (400 Hz) 0.50% 0.50% 15 (750 Hz) 0.50% 0.40%
10 (500 Hz) 0.50% 2.50% 21 (1050 Hz) 0.50% 0.30%
12 (600 Hz) 0.50% 2.13% 27 (1350 Hz) - 0.20%
14 (700 Hz) 0.50% 1.86% 33 (1650 Hz) - 0.20%
16 (800 Hz) 0.50% 1.66% 39 (1950 Hz) - 0.20%
18 (900 Hz) 0.50% 1.50% 45 (2250 Hz) - 0.20%
20 (1000 Hz) 0.50% 1.38% Oddharmonics:22 (1100 Hz) 0.50% 1.27% (not multiples of 3)
24 (1200 Hz) 0.50% 1.19% 5 (250 Hz) 6.00% 6.00%
26 (1300 Hz) - 1.12% 7 (350 Hz) 5.00% 5.00%
28 (1400 Hz) - 1.05% 11 (550 Hz) 3.50% 3.50%
30 (1500 Hz) - 1.00% 13 (650 Hz) 3.00% 3.00%
32 (1600 Hz) - 0.95% 17 (850 Hz) 2.00% 2.00%
34 (1700 Hz) - 0.91% 19 (950 Hz) 1.50% 1.76%
36 (1800 Hz) - 0.88% 23 (1150 Hz) 1.50% 1.41%
38 (1900 Hz) - 0.84% 25 (1250 Hz) 1.50% 1.27%
40 (2000 Hz) - 0.81% 29 (1450 Hz) - 1.06%
42 (2100 Hz) - 0.79% 31 (1550 Hz) - 0.97%
44 (2200 Hz) - 0.76% 35 (1750 Hz) - 0.83%
46 (2300 Hz) - 0.74% 37 (1850 Hz) - 0.77%
48 (2400 Hz) - 0.72% 41 (2050 Hz) - 0.67%
50 (2500 Hz) - 0.70% 43 (2150 Hz) - 0.63%
The same for both standards:Total harmonic voltage distortion THDv: max. 8%Total harmonic current distortion THDi: max. 20%
47 (2350 Hz) - 0.55%
49 (2450 Hz) - 0.52%
Table 9 Comparison of maximum permissible harmonic levels according to EN 50160 and EN 61000-2-2
54
Designing for networks with audiofrequency remote control systems
The impedance of the detuned capacitor at 250 Hz is smaller than the impedance of the capacitor without detuning by a factor x.
The detuned PFC system has the following characteristics for the 5th harmonic: Acceptor circuit characteristics when x > 1 Rejector circuit characteristics when x < 1
With strong acceptor circuit characteristics (series resonant circuit), the maximum allowable level of the 250 Hz harmonic must be limited so as not to overload the filter reactor.
→ p = 5.7% fr = 210 Hz x = 2.4 → V250max = 4% → p = 7% fr = 189 Hz x = 1.33 → V250max = 5% → p = 8% fr = 177 Hz x = 1.0 → V250max = 5% → p = 14% fr = 134 Hz x = 0.42 → V250max = 5%
Example:If 4% of the 5th harmonic is superposed on the network voltage, a detuned PFC system attenu-ates the 5th harmonic as follows:
→ at 7% detuning: by 4% x 5 (= 250 Hz / 50 Hz) x 1.33 = 0.27 x In
→ at 5.7% detuning: by 4% x 5 (= 250 Hz / 50 Hz) x 2.4 = 0.48 x In
→ at 14% detuning: by 4% x 5 (= 250 Hz / 50 Hz) x 0.42 = 0.08 x In
(In = system rated current at 50 Hz)
When designing a detuned PFC system the following factors must always be taken into account:
Capacitors with and without detuning must never be operated in parallel on the same low voltage system.
Parallel operation of filter circuit systems with different detuning factors (p) is possible, but the loading of the filter circuits is different and should be accurately analysed at high levels of harmonics.
If the low voltage systems are electrically isolated (transformers not capable of being coupled at the low voltage side), then, if required, one network can be detuned while the other system has power factor correction without detuning.
The type of installation selected must comply with the requirements of the utility company concerned.
Power factor correction in networks with audiofrequency remote control systemsAudiofrequency (AF) remote control systems are installed in utility company supply networks in order to perform switching functions (such as tariff changeover) by means of special receivers in the consumer’s circuit. To do this, control voltages at a high frequency (AF pulses) are super-posed on the power distribution system. These frequencies are usually in the range of 166 to 1350 Hz.
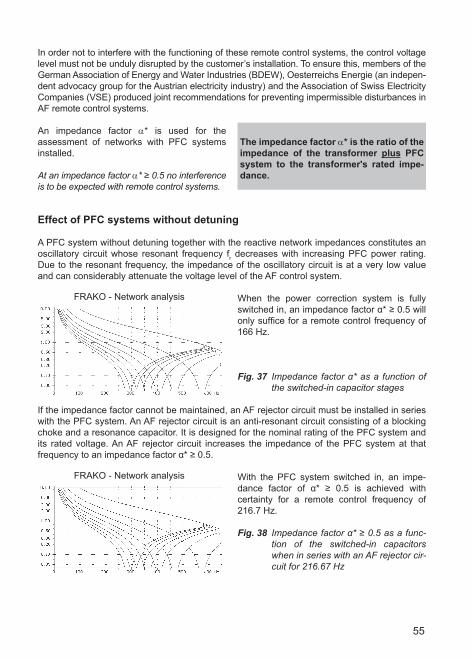
55
In order not to interfere with the functioning of these remote control systems, the control voltage level must not be unduly disrupted by the customer’s installation. To ensure this, members of the German Association of Energy and Water Industries (BDEW), Oesterreichs Energie (an indepen-dent advocacy group for the Austrian electricity industry) and the Association of Swiss Electricity Companies (VSE) produced joint recommendations for preventing impermissible disturbances in AF remote control systems.
An impedance factor α* is used for the assessment of networks with PFC systems installed.
At an impedance factor α* ≥ 0.5 no interference is to be expected with remote control systems.
Effect of PFC systems without detuning
A PFC system without detuning together with the reactive network impedances constitutes an oscillatory circuit whose resonant frequency fr decreases with increasing PFC power rating. Due to the resonant frequency, the impedance of the oscillatory circuit is at a very low value and can considerably attenuate the voltage level of the AF control system.
When the power correction system is fully switched in, an impedance factor α* ≥ 0.5 will only suffice for a remote control frequency of 166 Hz.
If the impedance factor cannot be maintained, an AF rejector circuit must be installed in series with the PFC system. An AF rejector circuit is an anti-resonant circuit consisting of a blocking choke and a resonance capacitor. It is designed for the nominal rating of the PFC system and its rated voltage. An AF rejector circuit increases the impedance of the PFC system at that frequency to an impedance factor α* ≥ 0.5.
With the PFC system switched in, an impe-dance factor of α* ≥ 0.5 is achieved with certainty for a remote control frequency of 216.7 Hz.
The impedance factor α* is the ratio of the impedance of the transformer plus PFC system to the transformer's rated impe-dance.
FRAKO - Network analysis
Fig. 37 Impedance factor α* as a function of the switched-in capacitor stages
FRAKO - Network analysis
Fig. 38 Impedance factor α* ≥ 0.5 as a func-tion of the switched-in capacitors when in series with an AF rejector cir-cuit for 216.67 Hz
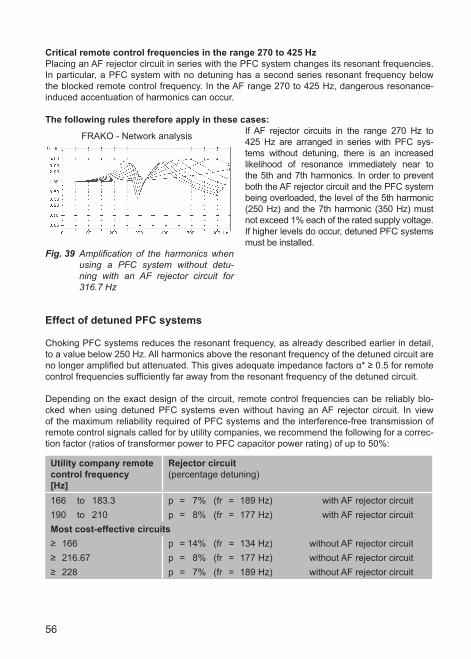
56
Critical remote control frequencies in the range 270 to 425 HzPlacing an AF rejector circuit in series with the PFC system changes its resonant frequencies. In particular, a PFC system with no detuning has a second series resonant frequency below the blocked remote control frequency. In the AF range 270 to 425 Hz, dangerous resonance-induced accentuation of harmonics can occur.
Thefollowingrulesthereforeapplyinthesecases:If AF rejector circuits in the range 270 Hz to 425 Hz are arranged in series with PFC sys-tems without detuning, there is an increased likelihood of resonance immediately near to the 5th and 7th harmonics. In order to prevent both the AF rejector circuit and the PFC system being overloaded, the level of the 5th harmonic (250 Hz) and the 7th harmonic (350 Hz) must not exceed 1% each of the rated supply voltage. If higher levels do occur, detuned PFC systems must be installed.
Effect of detuned PFC systems
Choking PFC systems reduces the resonant frequency, as already described earlier in detail, to a value below 250 Hz. All harmonics above the resonant frequency of the detuned circuit are no longer amplified but attenuated. This gives adequate impedance factors α* ≥ 0.5 for remote control frequencies sufficiently far away from the resonant frequency of the detuned circuit.
Depending on the exact design of the circuit, remote control frequencies can be reliably blo-cked when using detuned PFC systems even without having an AF rejector circuit. In view of the maximum reliability required of PFC systems and the interference-free transmission of remote control signals called for by utility companies, we recommend the following for a correc-tion factor (ratios of transformer power to PFC capacitor power rating) of up to 50%:
Utility company remote control frequency[Hz]
Rejector circuit (percentage detuning)
166 to 183.3 p = 7% (fr = 189 Hz) with AF rejector circuit190 to 210 p = 8% (fr = 177 Hz) with AF rejector circuitMost cost-effective circuits≥ 166 p = 14% (fr = 134 Hz) without AF rejector circuit≥ 216.67 p = 8% (fr = 177 Hz) without AF rejector circuit≥ 228 p = 7% (fr = 189 Hz) without AF rejector circuit
FRAKO - Network analysis
Fig. 39 Amplification of the harmonics when using a PFC system without detu-ning with an AF rejector circuit for 316.7 Hz

57
For frequencies ≥ 216.7 Hz an impedance factor α* ≥ 0.5 is achieved with certainty in this case even without an AF rejector circuit.
The impedance factor α* ≥ 0.5 is reached with certainty in all stages.
In this case as well, the impedance factor α* ≥ 0.5 is reached with certainty in all stages
For all frequencies ≥ 166 Hz (i.e. all commonly used remote control frequencies) the impe-dance factor α* ≥ 0.5 is reached with certainty in all stages!
These recommendations were issued in 1993 and are based on years of practical experience by the members of BDEW, Oesterreichs Energie and VSE.
FRAKO - Network analysis
Fig. 40 Example 1 Impedance factor α* as a function of number of switched-in capacitors, with 8% detuning
Fig. 41 Example 2 Impedance factor α* as a function of number of switched-in capacitors, with 7% detuning plus AF rejector circuit for 175 Hz
FRAKO - Network analysis
FRAKO - Network analysis
Fig. 42 Example 3 Impedance factor α* as a function of number of switched-in capacitors, with 8% detuning plus AF rejector circuit for 190 Hz
FRAKO - Network analysis
Fig. 43 Example 4 Impedance factor α* as a function of number of switched-in capacitors, with 14% detuning
58
Versions of detuned PFC systems
1.) 7and8%detuning:PFC systems with 7% detuning have a proven track record for most industrial applications. The resonant frequency is at an optimum level to suppress the harmonics (mainly the 5th and 7th) encountered in industry, while at the same time offering enough margin so as to not become overloaded. For industrial networks that are more or less symmetrically loaded with normal levels of harmonics and remote control frequency above 220 Hz this is the ideal solution.
Versions with 8% detuning are for networks using a remote control frequency of 216.67 Hz.
2.) 12.5to14%detuning:A version with 12.5 to 14% detuning is an inexpensive variant with no AF rejector circuit for distribution systems with remote control frequencies of 166 to 210 Hz. The essential disadvantage of this version is in its low absorption capability for harmonics. In low voltage networks with high levels of the 5th harmonic, the use of these versions should not be con-sidered especially for systems > 200 kvar. Instead, a version with p = 7% or 8% and an AF rejector circuit should be selected.
Low voltage networks with extremely high levels of the 3rd harmonic (150 Hz) are, however, an exception. The 3rd harmonic is produced as a rule by a highly asymmetrically loaded low voltage network (e.g. operation of single-phase equipment such as welding sets, UPS systems, large numbers of lamps with electronic ballasts or computers and other office equipment with AC adapters).
High levels of the 3rd harmonic are therefore often found in office complexes, banks, hos-pitals, department stores, etc. To prevent resonance occurring at this frequency, detuning at a resonant frequency below 150 Hz must be used in such cases. The version with 14% detuning is the most suitable for this; versions with 7 or 8% detuning must not be used in these networks.
3.) 5to5.67%detuning:As a rule this version is used because of its increased absorption of harmonics. If, however, a high level of harmonics from the medium voltage distribution system is fed to the network, the use of the 5 to 5.67% detuned version should not be considered, in order to prevent overload conditions, and instead a version with p = 7% should be selected. At extreme levels of harmonics, specially customized filter circuits can also be designed.
4.) Combineddetuning:This PFC system variant is constructed with filter circuit stages of different resonant fre-quencies (as a rule 12.5 / 14% and 5 / 5.67%). The number and ratings of the filter circuit stages are selected so that the power ratio approaches1:1. Combined detuned circuits can be used in networks with utility company remote control frequencies in the range 166 to 190 Hz as a simpler variant instead of using detuned systems with AF rejector circuits.

59
Three important disadvantages of combined detuning must, however, be taken into account:
In order to maintain the blocking factor with certainty, the principle of uniform use for mini-mum wear and tear (= cyclic switching) of all units must be suppressed with variable banks of capacitors.
The absorption effect on harmonics is lower than with detuned systems with AF rejector circuits.
One half of the system has a low absorption effect, while the other half acts as a filter circuit for 210/223 Hz like an acceptor circuit. With a high proportion of harmonics in the medium voltage distribution system or in the facility’s own network, one half of the filter circuit sections is always under full thermal load, while the other half is not. These loading conditions inevitably result in different life expectancies. For this reason a combined choking circuit is only advisable when it is necessary to use choking to prevent resonance occurring. An AF between 166 and183 Hz is present, but only a low proportion of harmonic voltage (max. 3%) is anticipated.
The technically more sophisticated solution is to use a uniformly detuned version with p = 14%. With this system the harmonics are suppressed uniformly over all the capacitor stages, and all the advantages of modern control technology applied to reactive power control relays can be fully exploited.
Monitoring PFC systems in operation
The maintenance of PFC systems after their installation is just as important as the planning and design work beforehand. Once a PFC system has been commissioned, it is frequently forgotten about. The user is usually not reminded of the fact that the capacitor contactors are components subject to wear until the unpleasant effects of contactor failure have been experienced.
Contactors are subject to high stress levels when switching capacitive loads. Chattering switching contacts result in high charging and discharge currents in the capacitors and heavy wear and tear of the switching contacts themselves. Replacing the contactors in good time considerably prolongs the service life of the PFC system. Switching cycle counters have been integrated into state-of-the-art reactive power control relays such as the RM 9606, EMR 1100 S and EMR 1100 in order to give early information on the wear of the contactors. The reactive power control relay indicates the optimum point in time when the contactors should be replaced and thus helps to cut costs. For preventive maintenance purposes, the user can display the cumulative total of switching cycles for each individual stage.
Changed conditions in the network can also result in disturbances in the entire low voltage power system. The purpose of network monitoring is to identify these disturbances at an early stage. Power quality monitoring instruments of the EM-PQ series offer you the option of early alarms before the system or system components fail. All parameters relevant to safety and relia-bility in medium- and low voltage systems, the temperatures of sensitive system components and the consumption of active and reactive energy are registered, analysed and monitored.

60
ActiveharmonicfiltersWhat must be done if the harmonic factor is high, but the reactive power demand is small?Basically there are several solutions to limit harmonic currents caused by the operation of loads that generate them.
The most well-known measures to solve this problem by means of several passive filters tuned to work together (tuned acceptor circuits) or the assembly of highly non-linear loads and sensitive consumers into separate groups, feeding
each group through a separate transformer.
However, these solutions involve two main disadvantages: Improvement of the system disturbance characteristics applies only to the particular installation
involved. Each subsequent extension can mean that the initial investment becomes worthless. It is often very difficult to implement these solutions in practice for an existing installation.
Excessively high harmonics levels often occur due to the use of capacitors with no detuning in networks that are distorted by harmonics.
Today, the most cost-effective solution for these problems is still the use of heavy duty FRAKO filter circuit systems.
For problems with: excessively high levels of the 3rd, 9th and 15th harmonics and the high neutral conductor
current they give rise to, or the demand for tuned acceptor circuits to maintain the harmonic current returned to the
medium voltage system under a specified limit or low demand for reactive power but high harmonic currents, for example, due to a large pro-
portion of converter-controlled induction motors, the OSFM active filter or a combination of a FRAKO filter circuit system with an active filter is the optimum solution.
The decisive advantage of an active harmonic filter lies in the fact that the correction of network disturbances still remains effective if subsequent extensions are made to the installation. The flexibility of the FRAKO active filter means that the required nominal size can be selected quite simply from the current demand. Any additional demand due to extensions of the installation can be met at any time by adding further components.
Operatingprincipleoftheactiveharmonicfilter
The active filter is installed in parallel to the harmonic generators. It analyses the harmonic cur-rent produced by the nonlinear loads and supplies a 180° out-of-phase compensating current, either over the entire spectrum from the 2nd to the 25th harmonic or for a specially selected harmonic. This action neutralizes the corresponding harmonic currents completely at the point of connection, provided that the system has been appropriately dimensioned.

61
The combination of harmonic filter and harmonic load appears to the network as an overall linear load drawing a sinusoidal current. Installation is quite simple. A three-phase feeder with or without a neutral conductor needs to be available. The current transformer is then installed in the line to the non-linear load.
Applications
Typical applications are in: Low voltage systems with many converters that are under an obligation to return only limited
harmonic currents to the preceding network, where, for example, long spur lines to remote installations are involved.
Modern converter drives that return high levels of harmonics to the distribution system, but with only a low demand for reactive power. In a low voltage network with a 1000 kVA transformer and many small induction motors in use, it is quite possible that a PFC system rated at 400 kvar is necessary. When modern converters are used, the demand still amounts to some 100 kvar.
Low voltage systems with a large proportion of the 3rd harmonic due to the use of single-phase loads. These low voltage networks display an extraordinarily high current in the neutral conductor, which should be approximately 0 A when the load is distributed nearly symmetri-cally. Because of the electronic loads, however, the harmonic currents in the three phases are added together in the neutral conductor in addition to any imbalance in the ohmic loads. This is because the 3rd, 9th and 15th harmonics in the three phases have the same phase angle.
Fig. 44 Operating principle of the OSFM active filter series
LoadSupply
OSFM
I1 = fundamental currentIH = harmonic current
Fig. 45 Harmonics measured without filter Fig. 46 Harmonics measured with filter

62
The result is a current in the neutral conductor, which, under certain conditions, can be greater than the phase current and overloads the neutral conductor, which has not been dimensioned for loads of that magnitude.

63
Active against harmonicsPower consumers have been offered to date hardly any means of minimizing harmonics in their distribution systems at reasonable cost. The usual method has been to try to eliminate or attenuate the harmonics at the device that generates them by installing passive elements in the circuit. This means, however, that a tuned acceptor circuit with inductance and capacitance must be installed for each harmonic in order to reduce its undesirable effects. The problem can now be solved more conveniently with the help of an active harmonic filter.
All integral multiples of a fundamental fre-quency are known as harmonics. It is common practice to label each individual harmonic with the ordinal number n. This is equal to the fre-quency of the harmonic divided by that of the fundamental waveform. When the supply fre-quency is 50 Hz, the 5th harmonic thus has a frequency of 250 Hz. Mathematical analysis has revealed that any complete and repetitive waveform is made up of a set of numerous purely sinusoidal frequencies. These har-monics are generated when operating with loads in the consumer circuit that do not draw current sinusoidally. The waveform for the current drawn by these loads determines the number and amplitude of the harmonics. The greater the deviation from the sinusoidal ideal, the more harmonics are returned by the con-sumer to the supply network and the greater the amplitude of the individual harmonics. The mathematical technique of Fourier analysis is used to divide the complex waveform into a set of harmonics, each of which is assigned the appropriate value of n and its amplitude.
A simple method for determining individual harmonics is by measuring with a clamp meter that can filter out and display individual harmonics from the measurement signal. Although only one harmonic at a time can be displayed with this method, it is relatively quick and simple to obtain a rough overview of the amplitudes of the individual harmonics. There is a variety of symptoms that indicate the presence of harmonics in a system: PCs crash, hard disk errors occur, monitors flicker, the neutral conductor overheats, damage occurs to PFC systems or corrosion is detected in other parts of the installation.
OperatingprincipleofaharmonicfilterThe underlying concept of the harmonic filter is the use of an active correction function. This is done not by absorbing currents, but by injecting additional current whenever required. A current transformer first measures the current being drawn momentarily by the load. The control unit in the harmonic filter then analyses this current for amplitude and harmonics. It consequently feeds a current into the supply system whose amplitude and individual harmonic number is
Fig. 47 OSFM active harmonic filter as compact module

64
exactly equal to the current drawn by the load but which is, however, 180° out of phase with it. The harmonic currents cancel each other out and the supply network only has to supply the fundamental frequency and is not contaminated with harmonics. One great advantage of the active filter compared to conventional techniques is its flexibility in adapting the corrective power. Depending on requirements, the filter can supply more or less corrective current.
Even on overload, the filter does not switch off but assumes a current-limiting mode, i.e. the filter supplies its maximum current and in so doing compensates for a large proportion of the harmonics.
Interaction with other system components, such as detuned PFC systems or UPS units, is therefore reduced to a minimum that is not critical. There is no problem to extend the system or install a combination of several filters. If operating or network conditions change, the filter automatically adapts to the new conditions within the scope of its nominal rating.
SignificanceofelectricalinstallationCorrect installation of the electrical system is of fundamental importance for the satisfactory func-tioning of a harmonics compensation unit. Both the type of network and the quality of its installa-tion can not only detract from the effectiveness of the harmonic filter but can also encourage or even cause disturbances in the electric power supply. Every electrical installation relies funda-mentally upon its earthing. An effective and consistently applied earthing system is the basis of every power supply installation. If there is a ‘gremlin’ in the earthing system, ideal conditions are brought about for parasitic voltages, electromagnetic disturbances and, of course, for harmonics to be propagated without hindrance. The main function of the earthing system is to ensure that, if a fault occurs, no dangerous voltages can arise where contact can cause injury or death, and that the current can flow to earth without hindrance. This is the only way to ensure that an overcurrent protection device in the supply current can respond and trip out the circuit within the prescribed time limit. In addition, the earthing system is intended to maintain the various items of electrical apparatus at a uniform potential which is as low as possible and to correct any differences in potential that might otherwise arise.
Fig. 48 Current waveform without harmonic filter
Fig. 49 Current waveform with harmonic filter

65
Strict separation of N and PEIf this separation is not achieved, for example because load currents are flowing in the PE con-ductor, electromagnetic fields are then formed around the earthing and potential equalization conductor, which can have considerable negative effects. Since these fields are also formed in the shielding of data cables, the interference produced can result in data being lost. Con-necting the PE conductor to other conductive systems such as water, gas or central heating installations causes additional load currents in these parts of the system. The consequences are parasitic voltages and corrosion.
For this reason it is a major requirement for modern power supply systems that attention is paid as early as possible to ensure that there is a clear separation between N and PE conductors, and that they are always isolated from one another once work on their installation has started. In one specific case telephones were disrupted and monitor screens made to flicker due to the effects of harmonics. Measurement of these harmonics revealed a heavy proportion of the third har-monic amounting to up to 35% of the nominal current; not only in the N conductor but also in the PE conductor. Before measures can be taken to counteract harmonics in such cases, the wiring must be optimized to comply with the foregoing criteria. Unfortunately, the regu-
lations in force in Germany in 2001 did not categorically prescribe the separation of N and PE. There are only recommendations stemming mainly from the IT and telecommunications industry and from VdS (a subsidiary of GDV, the German Insurance Association) for supply cables to consistently use the 5-wire system. Filter currents, of course, cannot be avoided in the PE conductor, but they can be tolerated provided that no service currents or harmonics are also present. The present day EMC directives mean that the designers of both electrical installati-ons and devices have to contend with a technical trade-off. On the one hand the instruments and installations should feed as little interference as possible into the network, on the other hand they themselves must function interference-free and the interference currents generated should be dissipated. This is achieved mainly by leakage through filter capacitors directly to the earth conductor. With permanently connected systems this leakage can also be to the neutral conductor. However, this is not possible with devices fitted with German earthed plugs, since they can be turned through 180°, and their polarity is therefore not defined.
A typical exampleA conventional PC with a 250 W AC adapter has a leakage current of about 1 mA. This is com-posed of a 50 Hz fundamental component and various harmonics. The leakage currents ‘conta-minate’ the PE conductor that, in general, is not critical for the reliability of a system. With 100 PCs this therefore gives rise to a leakage current of about 0.1 A. Assuming that the resistance of the PE conductor is about 1 Ω, the resultant voltage drop is 0.1 V. The entire earthing system usually has a low resistance. (A conductor with a cross-sectional area of 10 mm2 has a resistance of 0.0012 Ω). By contrast, however, with a system having a rated load current of 100 A, the third harmonic can easily result in a harmonic current of 40 A, thus giving rise to a voltage drop of no
Fig. 50 Schematic of a simulated single-phase system
Load1
Load2
OSFM

66
less than 40 V. This is a classical application for an OSFM active harmonic filter. By compen-sating for loads that generate heavy harmonic currents, the filter removes harmonics from the distribution system and protects other consumers from the effects of the harmonics. This can only work, however, if there is a strict separation of N and PE conductors. In practice it has been shown that the use of an OSFM enables the harmonics to be reduced from over 30% to about 5%. This was achieved with loads having highly distorted current input curves and in addition involved current peaks.
Simulation of different conditions in distribution systems can give a clear picture of the effect on harmonics content. For the sake of simplicity, it suffices to illustrate this with a single-phase network with N and PE conductors. Two loads are connected to the system, with the first of these returning harmonics to the power supply system, the second load, however, either gene-rating no harmonics or else these being com-pensated by a harmonic filter. In the ideal case, the only current flowing in the PE conductor consists of the consumer filter currents caused, for example, by switched-mode power supply units or network input filters. Harmonics are, of course, also discharged to the PE conductor via these filters. In order to carry out the simulation under conditions that were as realistic as pos-sible, the amplitude and harmonic number of each component were adopted from a network analysis.
The profile of the current curve is an approxi-mation to the conditions actually occurring in a power supply system under load. The filter leakage current is in the order of milliamperes, despite the presence of harmonics, and therefore has only a slight negative impact on the functio-ning of the PE conductor. If the strict separation of N and PE is now removed, then load currents flow in the PE conductor, for example, by instal-ling a jumper between the N and PE busbars in a sub-distribution board. Since the N and PE con-ductors are effectively arranged in parallel, the currents are distributed between the two accor-ding to their relative resistances.
Fig. 51 Current in RN2 with and without bridge resistor RB
Fig. 52 Current in RPE2 with and without bridge resistor RB

67
This connection between the N and PE conductors means that voltages and conse-quently electromagnetic fields are developed in cable shielding, conduits, water, central heating and gas piping. The use of all-metal components in the building can become sources of interference. The earth conductor is now burdened with load currents and its potential relative to earth is raised. Depen-ding on the magnitudes of the current and the resistance, voltages up to the order of 100 V can occur. When harmonic currents flow in the earth conductor, the amperage can rise to levels considerably higher than the actual rated current of the load. Apart from causing the system to malfunction, this can also result in an impermissible tempera-ture rise in the PE/N conductors. In the worst case, this can even result in a fire. The vol-tage in the PE conductor naturally increases in proportion to the current, thus developing a high potential relative to earth. As the PE conductor is no longer at earth potential, it cannot fulfil the task for which it has been provided in the first place.
SummaryAn effective measure to reduce harmonics and their undesirable effects on the power distri-bution system is to install active harmonic filters. It is just as important, however, to have an electrical system that has been installed correctly and as simply as possible. In practice it is therefore imperative to measure currents in the earth conductor. This means that impermissible currents can be detected immediately. Far more effort is involved, however, in locating the surplus connections between the N and PE conductors. This requires accurate knowledge of the cable layouts and the construction of the building. Only by following the above-mentioned guidelines systematically is it possible to ‘clean up’ the power supply system and improve the quality of the mains voltage.
Fig. 53 Voltage in PE conductor at Load 2 relative to earth

68
Notes

69
Notes

70
Notes

71
Notes

Power factor correction
Fast-acting, no wear. Maximum power density in the smallest space.
Power quality
Acquisition, documentation and evaluation of electrical data. Improvement of network quality.
Management of energy costs
Billing for cost centres. Creates transparency and supplies data for your environmental audit.
Energie management systems
Maximum demand controllers, timers, acquisition, storage, visualization and documentation of energy and process data.
Tscheulinstr. 21a · 79331 Teningen · GermanyTel. +49-7641-453-0 · Fax +49-7641-453-545 http://www.frako.com · E-Mail:[email protected]
Kondensatoren- und Anlagenbau GmbH
It’s all about
saving your mon
ey!
FRA
KO
95-
0020
2 / 1
0 / 1
2 /8
715
S
ubje
ct to
tech
nica
l cha
nges