
Manual for the International Bottom Trawl Surveys
72
SERIES OF ICES SURVEY PROTOCOLS SISP 1-IBTS VIII Manual for the International Bottom Trawl Surveys Revision VIII The International Bottom Trawl Survey Working Group
Transcript of Manual for the International Bottom Trawl Surveys
SERIES OF ICES SURVEY PROTOCOLS
SISP 1-IBTS VIII
Manual for the International Bottom Trawl Surveys
Revision VIII
The International Bottom Trawl Survey Working Group
International Council for the Exploration of the Sea Conseil International pour l’Exploration de la Mer H. C. Andersens Boulevard 44–46DK-1553 Copenhagen VDenmarkTelephone (+45) 33 38 67 00Telefax (+45) 33 93 42 [email protected]
Recommended format for purposes of citation: ICES. 2012. Manual for the International Bottom Trawl Surveys. Series of ICES Survey Protocols. SISP 1-IBTS VIII. 68 pp.
http://doi.org/10.17895/ices.pub
For permission to reproduce material from this publication, please apply to the General Secretary.
This document is a product of an Expert Group under the auspices of the International Council for the Exploration of the Sea and does not necessarily represent the view of the Council.
ISBN 978-87-7482-112-0
ISSN 2304-6252
© 2012 International Council for the Exploration of the Sea
Series of ICES Survey Protocols SISP - IBTS VIII | i
Contents
1 Introduction .................................................................................................................... 1
2 IBTS survey ..................................................................................................................... 3
2.1 Current objectives ................................................................................................. 3 2.2 History of the survey ............................................................................................ 4
2.3 History of the survey gear ................................................................................... 5
2.4 Survey design ........................................................................................................ 5
2.5 GOV-trawl construction .................................................................................... 15 2.6 GOV trawl rigging .............................................................................................. 15
2.7 Standard fishing method ................................................................................... 18
2.8 Monitoring net geometry ................................................................................... 19
2.9 Fishing Positions ................................................................................................. 21
3 Sampling of GOV-trawl catches ............................................................................... 28
3.1 Catch sorting and sampling .............................................................................. 28 3.2 Length composition ............................................................................................ 31
3.3 Sampling for age, sex and maturity ................................................................. 32
3.4 Collection of marine litter from trawl .............................................................. 32 3.5 Measurement types for deep-water species .................................................... 35
3.5.1 Smoothheads and Searsids (Alepocephalidae and Searsidae) .............. 36 3.5.2 Grenadiers (Macrouridae) − PAFL − Pre Anal Fin Length ................. 36 3.5.3 Chimaeridae (Rabbitfish) — PSCFL — Pre Supra Caudal
Fin Length ............................................................................................... 37
4 MIK net .......................................................................................................................... 38
4.1 Q1 sampling ........................................................................................................ 38
5 Environmental data ..................................................................................................... 38
6 Exchange specifications for IBTS data ..................................................................... 39
7 References ..................................................................................................................... 47
Annex 1a: Chronology of the International Bottom Trawl Survey ............................. 48
Annex 1b: History of the North Sea IBTS surveys ......................................................... 49
Annex 2: IBTS standard gear check sheet 1 ..................................................................... 52
Annex 3: IBTS standard gear check sheet 2 ..................................................................... 53
Annex 4: IBTS standard gear check sheet 3 ..................................................................... 54
Annex 5a: IBTS standard gear check sheet 4 – Groundgear A ..................................... 55
Annex 5b: IBTS standard gear check sheet 4 – Groundgear B ..................................... 56
Annex 6: Catch sampling summary for North Sea IBTS quarter 1 surveys ............... 57
ii | Series of ICES Survey Protocols SISP - IBTS VIII
Annex 7: Catch sampling summary for North Sea IBTS quarter 3 surveys ............... 58
Annex 8: Finfish maturity key ........................................................................................... 59
Annex 9: Four stage maturity key for skates and rays (Rajidae) ................................. 61
Annex 10: Haul information ............................................................................................... 62
Annex 11: Length frequency information ........................................................................ 64
Annex 12: Smalk ................................................................................................................... 65
Annex 13: Area type codes: Sampling areas and standard areas for the calculation of abundance indices .............................................................................. 66
Annex 14: Length splits used to provide preliminary numbers-at-age ...................... 66
Annex 15: Data sheet for collection of marine litter ...................................................... 67
Series of ICES Survey Protocols SISP - IBTS VIII | 1
1 Introduction
The International Bottom Trawl Survey Working Group (IBTSWG), formerly known as the International Young Fish Survey Working Group, has the responsibility of coordinating various research vessel surveys conducted within certain ICES areas. The first survey to be coordinated was the International Young Fish Survey (IYFS) that was conducted in the North Sea and Skagerrak/Kattegat in February of each year starting in the late 1960s. A procedural manual was produced for the use of scientists involved in this survey and subsequently two revised editions were produced as international cooperation developed. In 1991, this cooperative programme was expanded to include the three other quarters in the North Sea and Skagerrak/Kattegat. This necessitated major alterations to the manual and the revised edition was published as ICES CM 1992/H:3.
During the Annual Science Conference in St John's, Newfoundland in 1994 the recommendation was made that the International Bottom Trawl Survey Working Group should also incorporate the coordination of bottom trawl surveys in ICES Sub-Areas VI, VII and VIII and Division IXa (these areas are designated as the western and southern areas).
In 1995 the manual was revised for a fifth time in order to clarify certain aspects of the surveys in the North Sea and Skagerrak/Kattegat. At the same time the opportunity was taken to review the manual to establish whether or not the same procedures could be applied to Sub-Areas VI, VII and VIII and Division IXa. It was decided that some aspects of the manual applied equally to all areas but some procedures required dedicated text. At the same time it was decided that a manual for the western and southern areas required further discussion and input from countries closely associated with these areas but who were unable to attend the meeting. Consequently procedures unique to the western and southern areas were provided in Annex 11, of the fifth revision, as a draft awaiting approval by all participants.
At the IBTS Working Group meeting in 1999 (Lisbon 7–10 April) it became apparent that a single manual covering such an extensive area was inappropriate. As corrections and amendments were outstanding for the North Sea IBTS Manual, the opportunity was taken to revise the document (the sixth revision).
A separate manual for the western and southern waters was originally produced for the IBTS meeting in Dublin, in 2002, but has been updated in 2010 and is available separately. Also during 2002 other major revisions were required to the North Sea manual (the seventh revision) and these were completed in 2004. Table 1.1 gives the history of the survey manual creation for the IBTS North Sea surveys.
In 2012, the procedure for deploying the MIK net was removed from this manual and a new manual was produced. This is available from the ICES website.
2 | Series of ICES Survey Protocols SISP - IBTS VIII
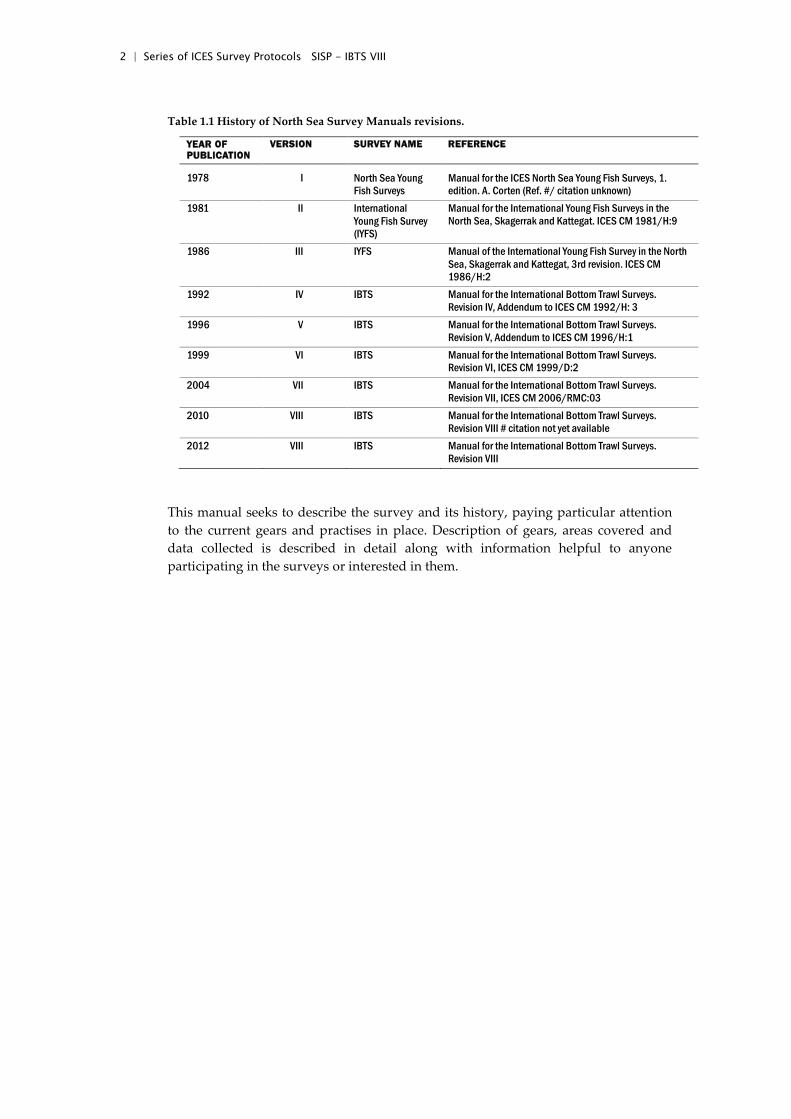
Table 1.1 History of North Sea Survey Manuals revisions.
YEAR OF PUBLICATION
VERSION SURVEY NAME REFERENCE
1978 I North Sea Young Fish Surveys
Manual for the ICES North Sea Young Fish Surveys, 1. edition. A. Corten (Ref. #/ citation unknown)
1981 II International Young Fish Survey (IYFS)
Manual for the International Young Fish Surveys in the North Sea, Skagerrak and Kattegat. ICES CM 1981/H:9
1986 III IYFS Manual of the International Young Fish Survey in the North Sea, Skagerrak and Kattegat, 3rd revision. ICES CM 1986/H:2
1992 IV IBTS Manual for the International Bottom Trawl Surveys. Revision IV, Addendum to ICES CM 1992/H: 3
1996 V IBTS Manual for the International Bottom Trawl Surveys. Revision V, Addendum to ICES CM 1996/H:1
1999 VI IBTS Manual for the International Bottom Trawl Surveys. Revision VI, ICES CM 1999/D:2
2004 VII IBTS Manual for the International Bottom Trawl Surveys. Revision VII, ICES CM 2006/RMC:03
2010 VIII IBTS Manual for the International Bottom Trawl Surveys. Revision VIII # citation not yet available
2012 VIII IBTS Manual for the International Bottom Trawl Surveys. Revision VIII
This manual seeks to describe the survey and its history, paying particular attention to the current gears and practises in place. Description of gears, areas covered and data collected is described in detail along with information helpful to anyone participating in the surveys or interested in them.
Series of ICES Survey Protocols SISP - IBTS VIII | 3
2 IBTS survey
2.1 Current objectives
The International Bottom Trawl Survey Working Group (IBTSWG) coordinates fishery‐independent multi‐species bottom trawl surveys within the ICES area. These surveys aim to provide ICES assessment and science groups with consistent and standardized data for examining spatial and temporal changes in (a) the distribution and relative abundance of fish and fish assemblages; and (b) of the biological parameters of commercial fish species for stock assessment purposes.
In terms of groundfish surveys coordinated by IBTS, the main objectives are to:
1 ) To determine the distribution and relative abundance of pre‐recruits of the main commercial species with a view of deriving recruitment indices;
2 ) To monitor changes in the stocks of commercial fish species independently of commercial fisheries data;
3 ) To monitor the distribution and relative abundance of all fish species and selected invertebrates;
4 ) To collect data for the determination of biological parameters for selected species;
5 ) To collect hydrographical and environmental information; 6 ) To determine the abundance and distribution of late herring larvae
(February North Sea survey).
For a survey to be considered to be coordinated under IBTSWG it should fulfil the following criteria:
1 ) To be carried out in the ICES areas IIIa, or IV–IX. 2 ) A brief outline of the management need/context for the survey should be
provided by an ICES assessment working group; 3 ) It is an otter trawl survey, but noting that there may be other working
groups better placed to coordinate some bottom trawl surveys; 4 ) The survey either has appropriate sampling methods and protocols
(including gear descriptions) that conform to the standards encouraged by the IBTSWG, or that can be improved after joining IBTSWG;
5 ) The survey should aim to enhance existing IBTS surveys and improve data collection for important stocks. For example, proposed surveys for inclusion within IBTSWG should (i) overlap and extend existing survey areas using a comparable gear, or (ii) operate on more specific grounds/times of year with a gear more appropriate to the target species;
6 ) Store their data in the DATRAS database, and participate in data quality checking;
7 ) Attend and present data at the annual meetings of IBTSWG; 8 ) Assessment working groups should confirm (e.g. after a five year period)
that any surveys targeting specific stocks and not using gears used in the standard IBTS surveys are still providing data of high quality that are used for assessment and provision of advice.
4 | Series of ICES Survey Protocols SISP - IBTS VIII
2.2 History of the survey
The following account has been adapted from Heessen et al. (1997).
In spring and autumn of the years 1960 and 1961 a series of four large international research vessel trawl surveys were organized under the auspices of ICES, to map the distribution of juvenile herring Clupea harengus in the North Sea and to investigate the links between herring nursery grounds and the adult populations (ICES, 1963).
In the following years most of the countries participating in the former exercise continued similar surveys. From 1966 onwards these surveys were conducted annually with the objective of obtaining annual recruitment indices for the combined North Sea herring stocks. Gradually more countries started to participate in the survey, which was named the International Young Herring Survey (IYHS). For the first few years, sampling was restricted to the southern and central North Sea and, beginning in 1969, the Skagerrak and Kattegat.
Although the emphasis from the start of the surveys focused mainly on herring, data collected for whiting Merlangius merlangus were also analysed. In the course of the 1970s it was realized that the IYHS could provide recruitment indices not only for herring, but also for roundfish species such as cod Gadus morhua, haddock Melanogrammus aeglefinus and whiting. This growing interest resulted in a northwards extension of the survey area to cover the entire distribution of juvenile haddock in the North Sea, and also that of Norway pout Trisopterus esmarki. The whole North Sea, Skagerrak and Kattegat have been surveyed since 1974.
In 1981, the survey was renamed the International Young Fish Survey (IYFS), the first manual was produced (ICES, 1981), and in 1984 the ICES ‘Working Group on Young Herring Surveys’ and the “Gadoid 1-Group Working Group” were combined to form the International Young Fish Survey Working Group.
In 1990, the IYFS Working Group evaluated the usefulness of a number of bottom trawl surveys in the North Sea, Skagerrak and Kattegat (ICES, 1990). Apart from the international IYFS, these surveys were composed of at least seven national surveys. The IYFS WG proposed to combine the IYFS and the national surveys in Quarterly Coordinated Surveys in the North Sea, Skagerrak and Kattegat, which were to be known as the International Bottom Trawl Surveys (IBTS). It was recommended that quarterly surveys should run for a period of five years. These surveys should provide a full description of the seasonal distribution of the stocks sampled, which was considered urgently necessary for the further improvement of multispecies assessments and the development of spatially disaggregated assessment models.
This proposal resulted in a series of six years with quarterly surveys, which, with a few exceptions, covered the whole survey area in the North Sea, Skagerrak and Kattegat (ICES, 1996). Subsequently, it has proven impossible to maintain these high levels of research vessel effort, especially as research budgets have decreased in most countries and, from 1997, the majority of countries have only carried out a survey twice a year; a first quarter survey (January-February) and a third quarter survey (August-September).
Annex 1a shows the timeline of significant events in the history of the IBTS and Annex 1b shows the history of the how the surveys have been carried out.
Having evolved from a herring survey, when only pelagic data were collected, the IBTS survey dataset is now made up of data collected on all finfish species. However,
Series of ICES Survey Protocols SISP - IBTS VIII | 5
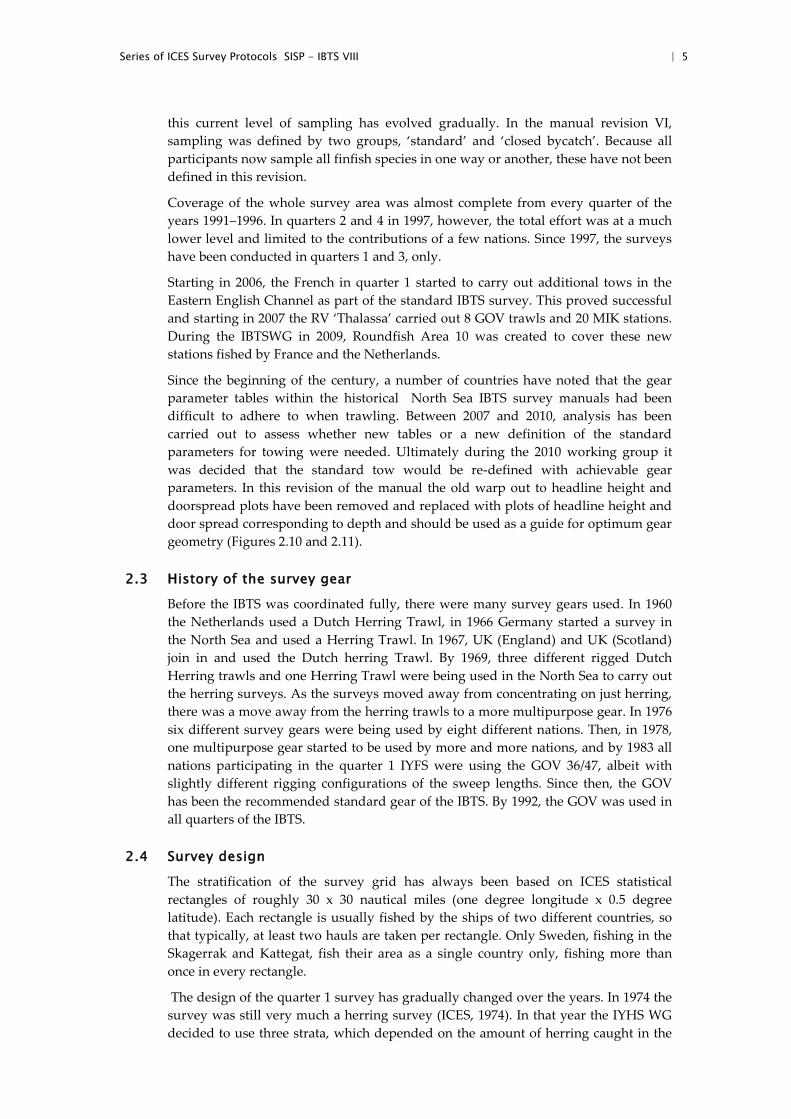
this current level of sampling has evolved gradually. In the manual revision VI, sampling was defined by two groups, ‘standard’ and ‘closed bycatch’. Because all participants now sample all finfish species in one way or another, these have not been defined in this revision.
Coverage of the whole survey area was almost complete from every quarter of the years 1991–1996. In quarters 2 and 4 in 1997, however, the total effort was at a much lower level and limited to the contributions of a few nations. Since 1997, the surveys have been conducted in quarters 1 and 3, only.
Starting in 2006, the French in quarter 1 started to carry out additional tows in the Eastern English Channel as part of the standard IBTS survey. This proved successful and starting in 2007 the RV ‘Thalassa’ carried out 8 GOV trawls and 20 MIK stations. During the IBTSWG in 2009, Roundfish Area 10 was created to cover these new stations fished by France and the Netherlands.
Since the beginning of the century, a number of countries have noted that the gear parameter tables within the historical North Sea IBTS survey manuals had been difficult to adhere to when trawling. Between 2007 and 2010, analysis has been carried out to assess whether new tables or a new definition of the standard parameters for towing were needed. Ultimately during the 2010 working group it was decided that the standard tow would be re-defined with achievable gear parameters. In this revision of the manual the old warp out to headline height and doorspread plots have been removed and replaced with plots of headline height and door spread corresponding to depth and should be used as a guide for optimum gear geometry (Figures 2.10 and 2.11).
2.3 History of the survey gear
Before the IBTS was coordinated fully, there were many survey gears used. In 1960 the Netherlands used a Dutch Herring Trawl, in 1966 Germany started a survey in the North Sea and used a Herring Trawl. In 1967, UK (England) and UK (Scotland) join in and used the Dutch herring Trawl. By 1969, three different rigged Dutch Herring trawls and one Herring Trawl were being used in the North Sea to carry out the herring surveys. As the surveys moved away from concentrating on just herring, there was a move away from the herring trawls to a more multipurpose gear. In 1976 six different survey gears were being used by eight different nations. Then, in 1978, one multipurpose gear started to be used by more and more nations, and by 1983 all nations participating in the quarter 1 IYFS were using the GOV 36/47, albeit with slightly different rigging configurations of the sweep lengths. Since then, the GOV has been the recommended standard gear of the IBTS. By 1992, the GOV was used in all quarters of the IBTS.
2.4 Survey design
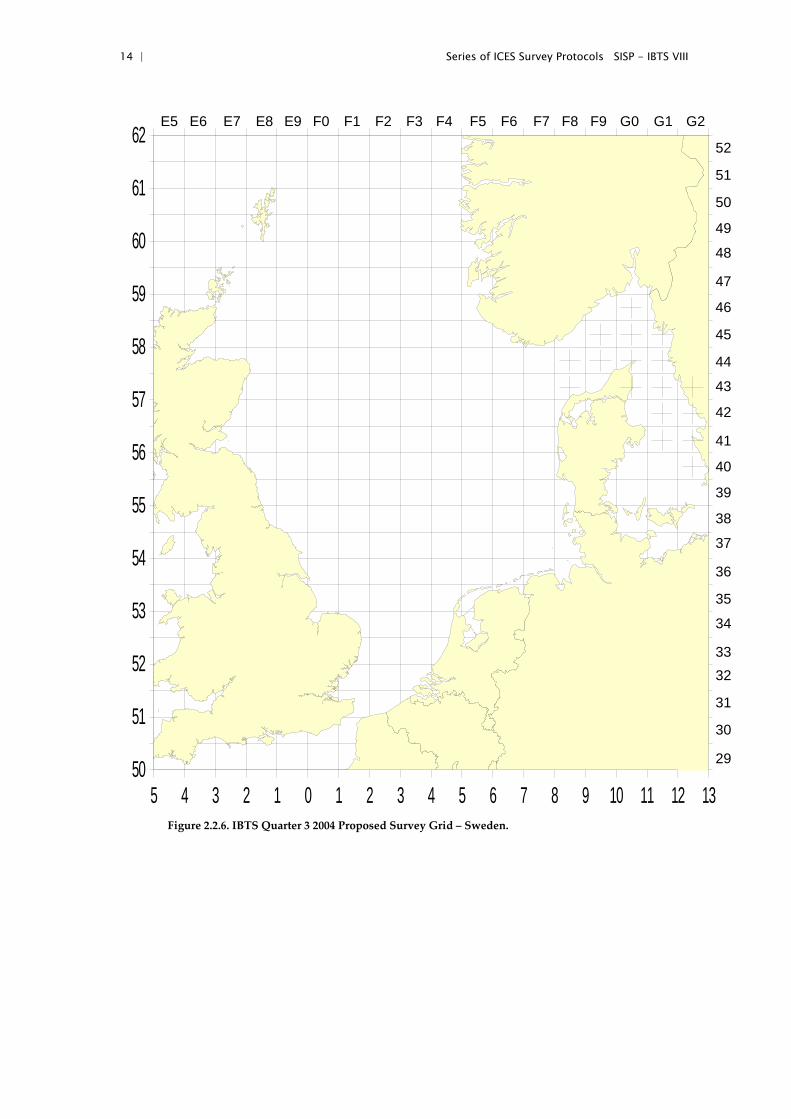
The stratification of the survey grid has always been based on ICES statistical rectangles of roughly 30 x 30 nautical miles (one degree longitude x 0.5 degree latitude). Each rectangle is usually fished by the ships of two different countries, so that typically, at least two hauls are taken per rectangle. Only Sweden, fishing in the Skagerrak and Kattegat, fish their area as a single country only, fishing more than once in every rectangle.
The design of the quarter 1 survey has gradually changed over the years. In 1974 the survey was still very much a herring survey (ICES, 1974). In that year the IYHS WG decided to use three strata, which depended on the amount of herring caught in the
6 | Series of ICES Survey Protocols SISP - IBTS VIII
former years. This would result in a total of 214 hauls. After some years this system was dropped and for several years four hauls per rectangle were made in the southeastern North Sea, the most important area for juvenile herring (between 50º30’ and 57ºN, and 4º and 8ºE), and two hauls per rectangle in the remaining area. In 1991, at the start of the quarterly surveys, part of the research vessel effort from quarter 1 was shifted to the other quarters and from that year on the target was to make at least two hauls per rectangle over the whole survey area.
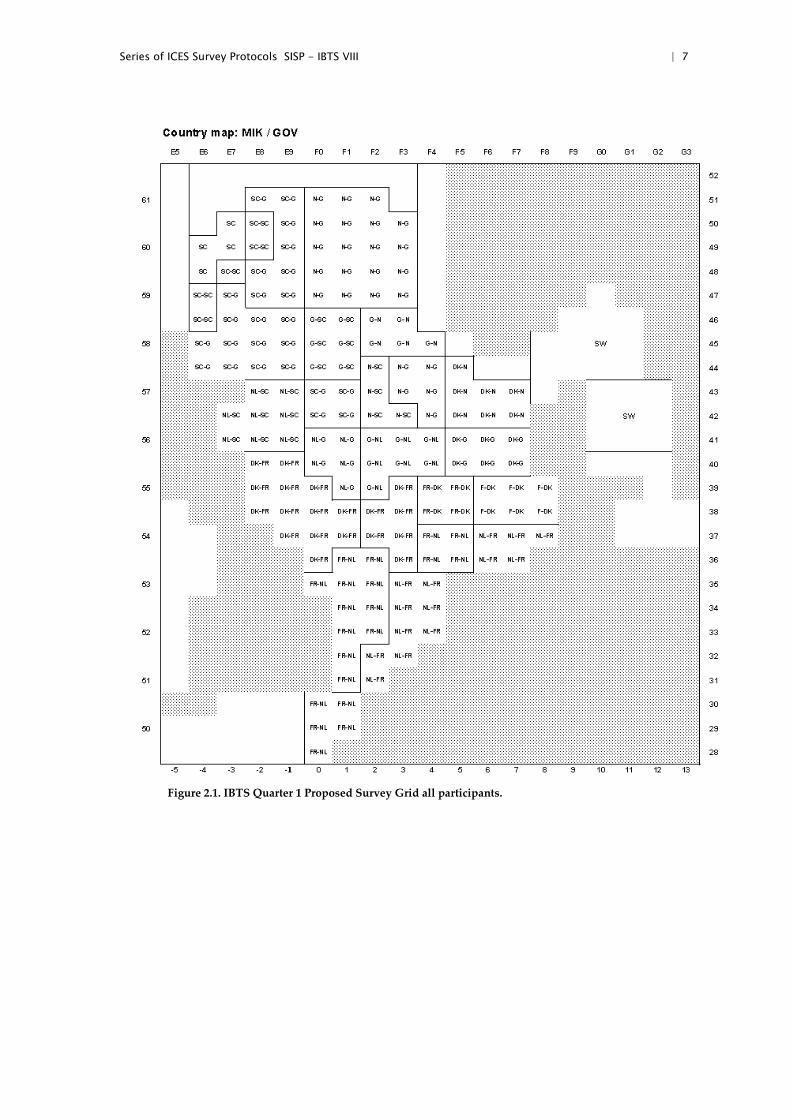
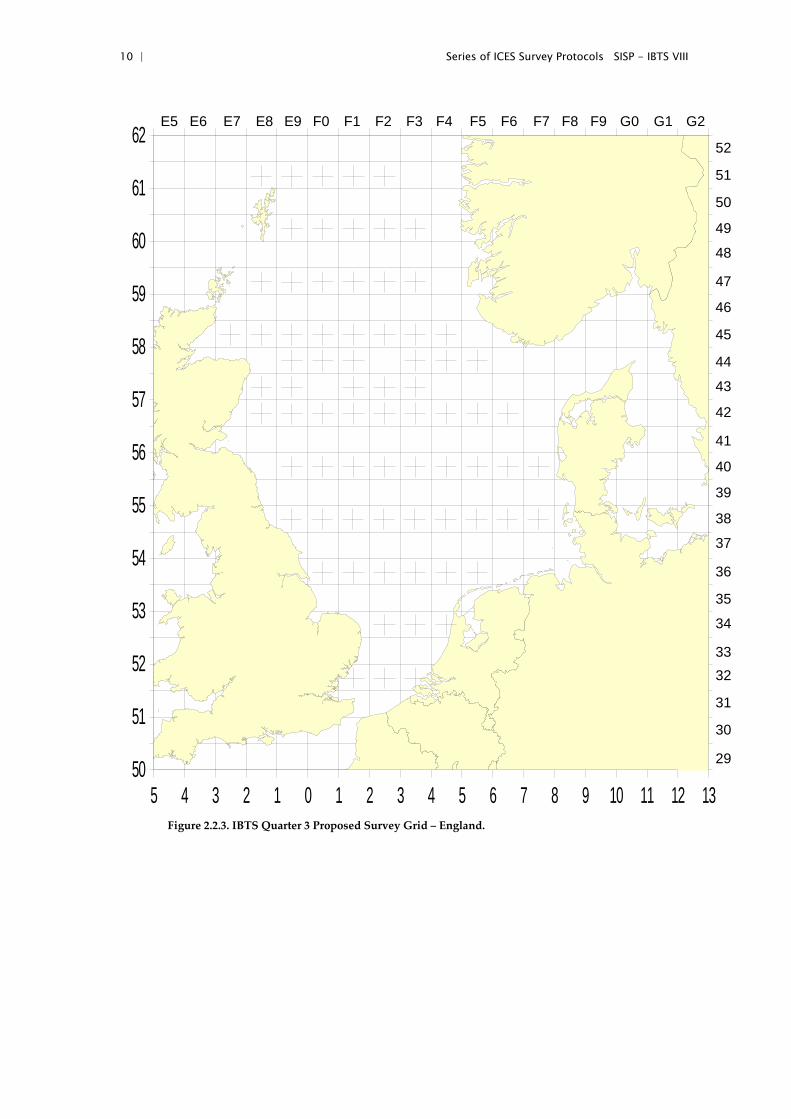
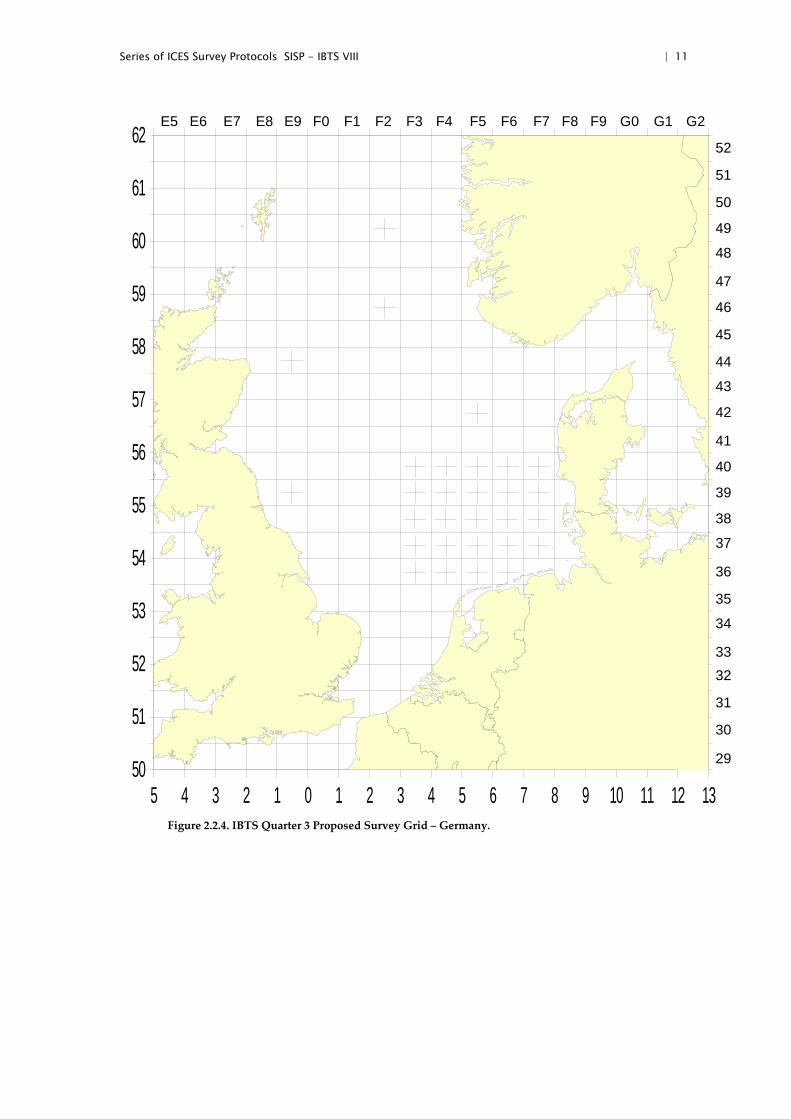
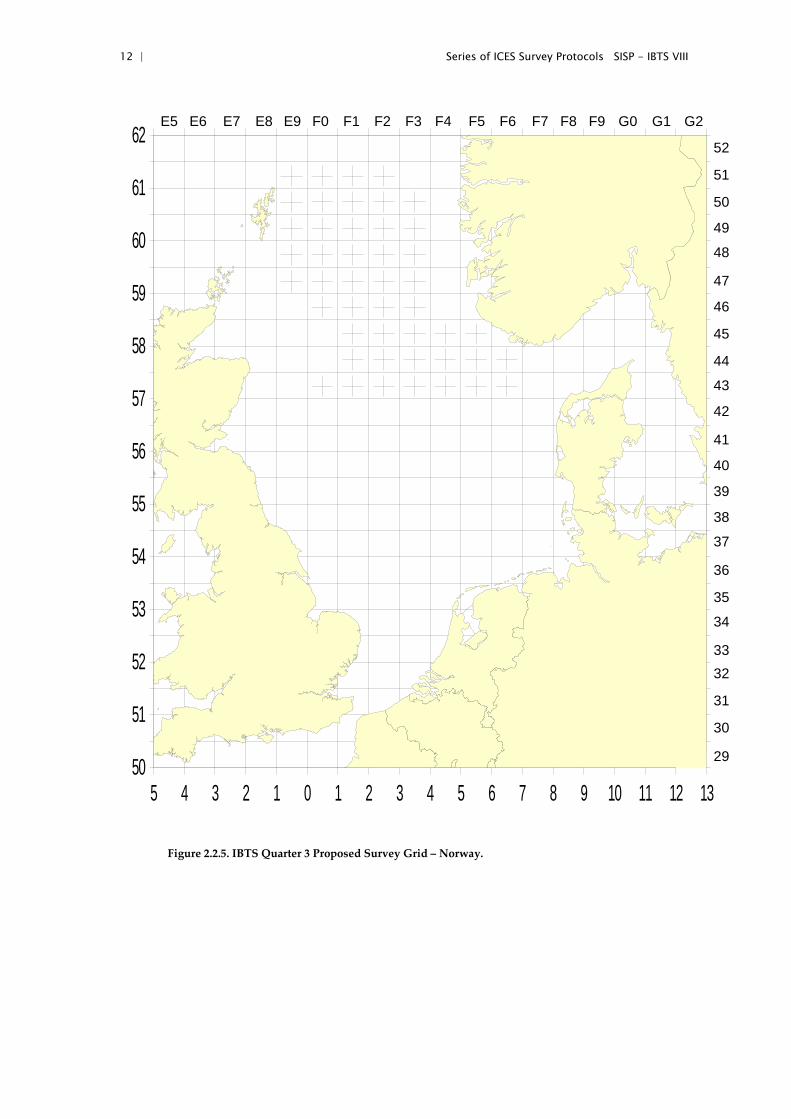
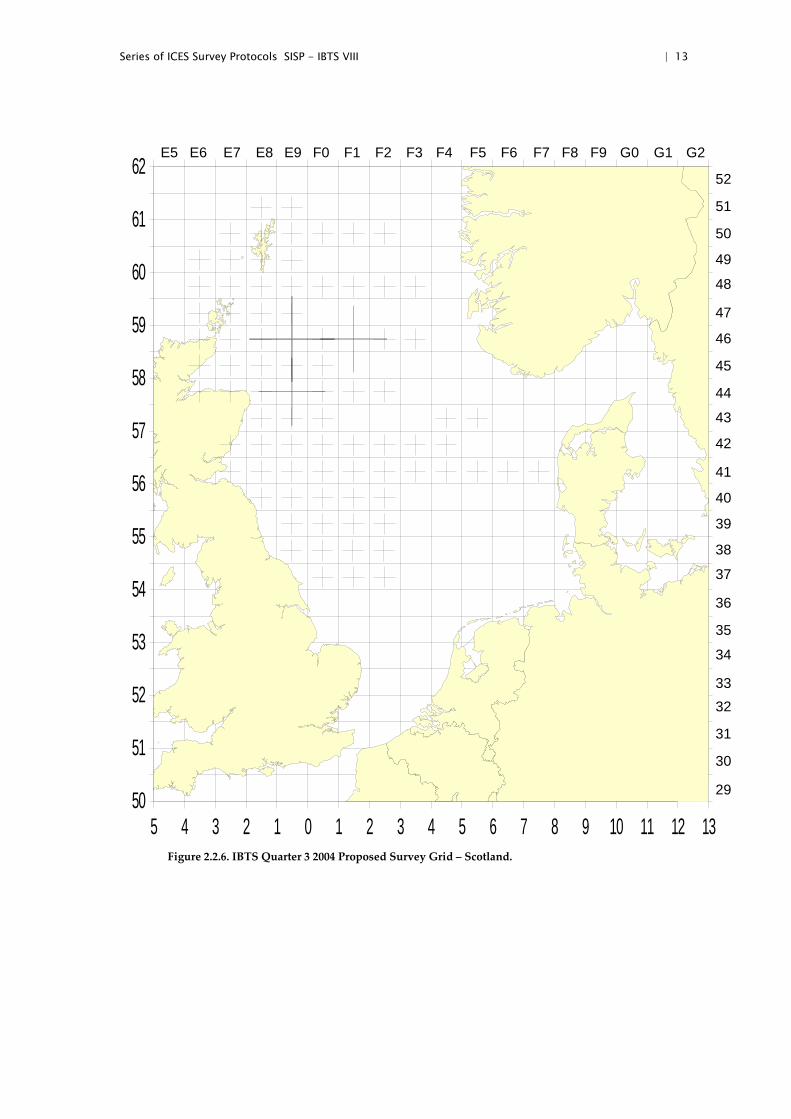
The allocation of stations to IBTS participants has changed slightly over the years. The latest main reallocation occurred in 1991, but it was then tried to keep at least one vessel in every subarea, which had fished there over the most recent years. A typical allocation of the different vessels during the quarter 1 survey is shown in Figure 2.1, and quarter 3 surveys in Figure 2.2.1 to 2.2.7.
For the other quarters three different grids were introduced (ICES, 1990): the ‘coarse’ grid based on the routine in the English Groundfish Surveys which covers half of the rectangles in the North Sea, the ‘complementary coarse grid’ covers the other half, and a grid that consists of all of the neighbouring rectangles in a certain area (as used for example in the Scottish Groundfish Surveys). The idea was that in every quarter at least 4 vessels should participate: one vessel should fish the coarse grid, one the complementary coarse grid, one should fish all of the rectangles in the southern half of the North Sea and one in the Northern half. In this way all rectangles should be fished twice, by two different vessels. As discussed above, only the quarter 3 surveys have had this coverage since 1997.
Initially one-hour hauls were made, but in 1976 with gadoid outburst contributing to increased catches and in order to allow for the opportunity to carry out more hauls in a day some participants changed to 30-minute tows. This was then made a recommendation at the Working Group in 1977 and all countries (with the exception of Scotland) reduced the standard haul duration to 30 minutes during the surveys in 1978. The Scottish institute continued to make one-hour hauls until 1998 when they changed to a new vessel and standardized to 30 minutes.
Series of ICES Survey Protocols SISP - IBTS VIII | 7
Figure 2.1. IBTS Quarter 1 Proposed Survey Grid all participants.
8 | Series of ICES Survey Protocols SISP - IBTS VIII
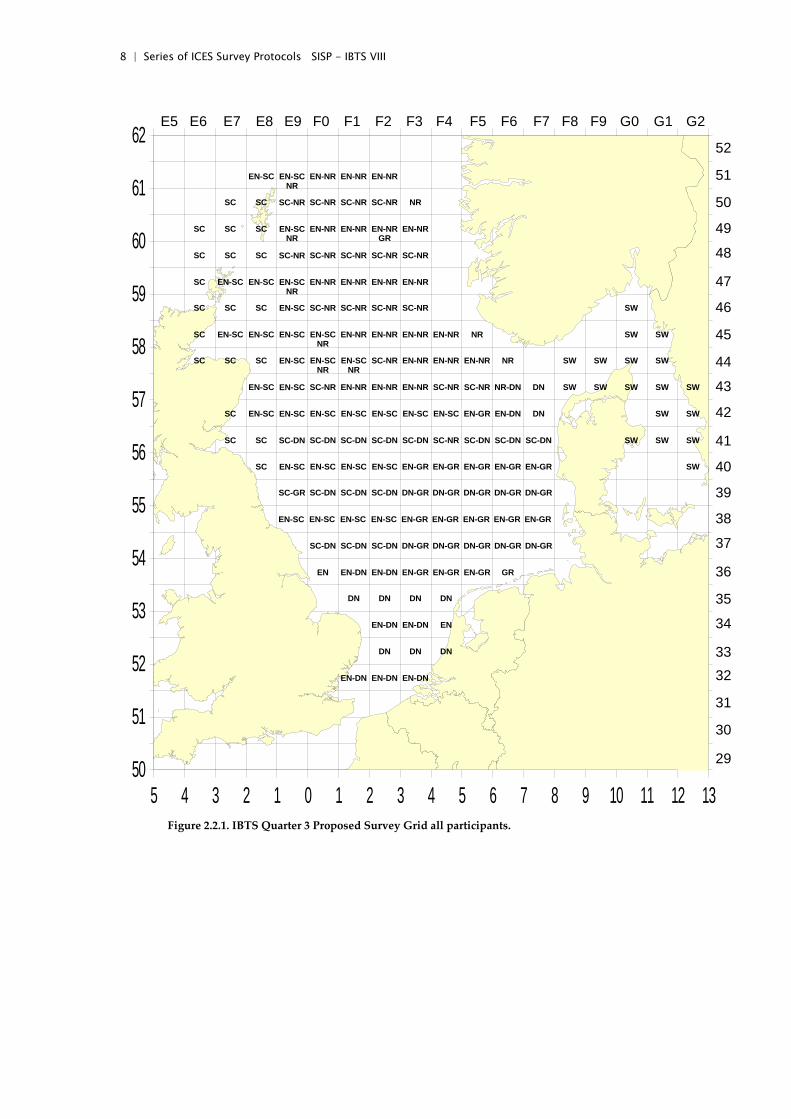
Figure 2.2.1. IBTS Quarter 3 Proposed Survey Grid all participants.
5 4 3 2 1 0 1 2 3 4 5 6 7 8 9 10 11 12 1350
51
52
53
54
55
56
57
58
59
60
61
62
29
30
31
3233
34
35
36
37
38
39
40
41
42
43
44
45
46
47
48
49
50
51
52
E5 E6 E7 E8 E9 F0 F1 F2 F3 F4 F5 F6 F7 F8 F9 G0 G1 G2
EN-DN EN-DN EN-DN
DN DN DN
EN-DN EN-DN EN
DN DN DN DN
EN EN-DN EN-DN EN-GR EN-GR EN-GR GR
SC-DN SC-DN SC-DN DN-GR DN-GR DN-GR DN-GR DN-GR
EN-SC EN-SCEN-SCEN-SCSC EN-NR EN-NR EN-NR EN-NR NR SW SW
EN-SC SC-NRSCSCSC SC-NR SC-NR SC-NR SW
EN-SC EN-NREN-SCEN-SCSC EN-NR EN-NR EN-NR
SC-NR SC-NRSCSCSC SC-NR SC-NR SC-NR
EN-SC EN-NRSCSCSC EN-NR EN-NR EN-NR
SC-NR SC-NRSCSC SC-NR SC-NR NR
EN-SC EN-NREN-SC EN-NR EN-NR
EN-SC EN-SC EN-SC EN-SC EN-GR EN-GR EN-GR EN-GR EN-GR
SC-GR SC-DN SC-DN SC-DN DN-GR DN-GR DN-GR DN-GR DN-GR
EN-SC EN-SCSC EN-SC EN-SC EN-GR EN-GR EN-GR EN-GR EN-GR SW
SC-DN SC-DNSCSC SC-DN SC-DN SC-DN SC-NR SC-DN SC-DN SC-DN SW SW SW
EN-SC EN-SCEN-SCSC EN-SC EN-SC EN-SC EN-SC EN-GR EN-DN DN SW SW
EN-SC SC-NREN-SC EN-NR EN-NR EN-NR SC-NR SC-NR NR-DN DN SW SW SW SW SW
EN-SC EN-SCSCSCSC EN-SC SC-NR EN-NR EN-NR EN-NR NR SW SW SW SW
NR
NR
NR GR
NR
NR NR

Series of ICES Survey Protocols SISP - IBTS VIII | 9
Figure 2.2.2. IBTS Quarter 3 Proposed Survey Grid – Denmark.
5 4 3 2 1 0 1 2 3 4 5 6 7 8 9 10 11 12 1350
51
52
53
54
55
56
57
58
59
60
61
62
29
30
31
3233
34
35
36
37
38
39
40
41
42
43
44
45
46
47
48
49
50
51
52
E5 E6 E7 E8 E9 F0 F1 F2 F3 F4 F5 F6 F7 F8 F9 G0 G1 G2
10 | Series of ICES Survey Protocols SISP - IBTS VIII
Figure 2.2.3. IBTS Quarter 3 Proposed Survey Grid – England.
5 4 3 2 1 0 1 2 3 4 5 6 7 8 9 10 11 12 1350
51
52
53
54
55
56
57
58
59
60
61
62
29
30
31
3233
34
35
36
37
38
39
40
41
42
43
44
45
46
47
48
49
50
51
52
E5 E6 E7 E8 E9 F0 F1 F2 F3 F4 F5 F6 F7 F8 F9 G0 G1 G2
Series of ICES Survey Protocols SISP - IBTS VIII | 11
Figure 2.2.4. IBTS Quarter 3 Proposed Survey Grid – Germany.
5 4 3 2 1 0 1 2 3 4 5 6 7 8 9 10 11 12 1350
51
52
53
54
55
56
57
58
59
60
61
62
29
30
31
3233
34
35
36
37
38
39
40
41
42
43
44
45
46
47
48
49
50
51
52
E5 E6 E7 E8 E9 F0 F1 F2 F3 F4 F5 F6 F7 F8 F9 G0 G1 G2
12 | Series of ICES Survey Protocols SISP - IBTS VIII
Figure 2.2.5. IBTS Quarter 3 Proposed Survey Grid – Norway.
5 4 3 2 1 0 1 2 3 4 5 6 7 8 9 10 11 12 1350
51
52
53
54
55
56
57
58
59
60
61
62
29
30
31
3233
34
35
36
37
38
39
40
41
42
43
44
45
46
47
48
49
50
51
52
E5 E6 E7 E8 E9 F0 F1 F2 F3 F4 F5 F6 F7 F8 F9 G0 G1 G2
Series of ICES Survey Protocols SISP - IBTS VIII | 13
Figure 2.2.6. IBTS Quarter 3 2004 Proposed Survey Grid – Scotland.
5 4 3 2 1 0 1 2 3 4 5 6 7 8 9 10 11 12 1350
51
52
53
54
55
56
57
58
59
60
61
62
29
30
31
3233
34
35
36
37
38
39
40
41
42
43
44
45
46
47
48
49
50
51
52
E5 E6 E7 E8 E9 F0 F1 F2 F3 F4 F5 F6 F7 F8 F9 G0 G1 G2
14 | Series of ICES Survey Protocols SISP - IBTS VIII
Figure 2.2.6. IBTS Quarter 3 2004 Proposed Survey Grid – Sweden.
5 4 3 2 1 0 1 2 3 4 5 6 7 8 9 10 11 12 1350
51
52
53
54
55
56
57
58
59
60
61
62
29
30
31
3233
34
35
36
37
38
39
40
41
42
43
44
45
46
47
48
49
50
51
52
E5 E6 E7 E8 E9 F0 F1 F2 F3 F4 F5 F6 F7 F8 F9 G0 G1 G2
Series of ICES Survey Protocols SISP - IBTS VIII | 15
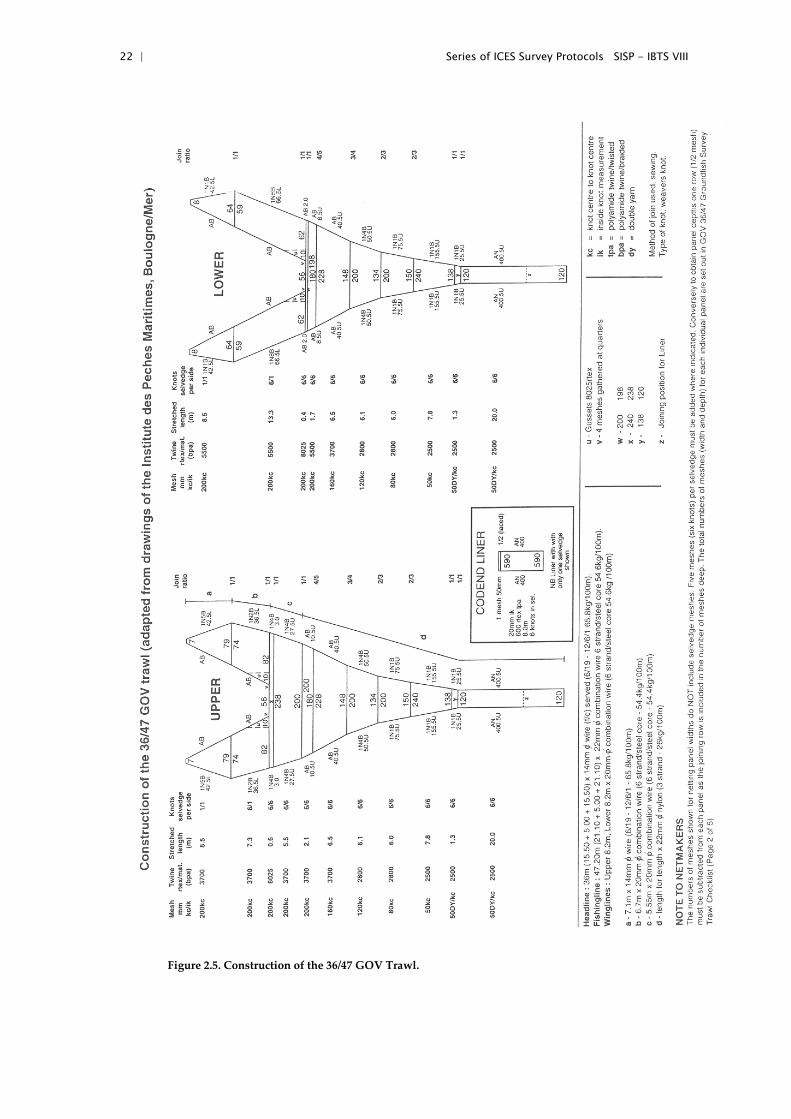
2.5 GOV-trawl construction
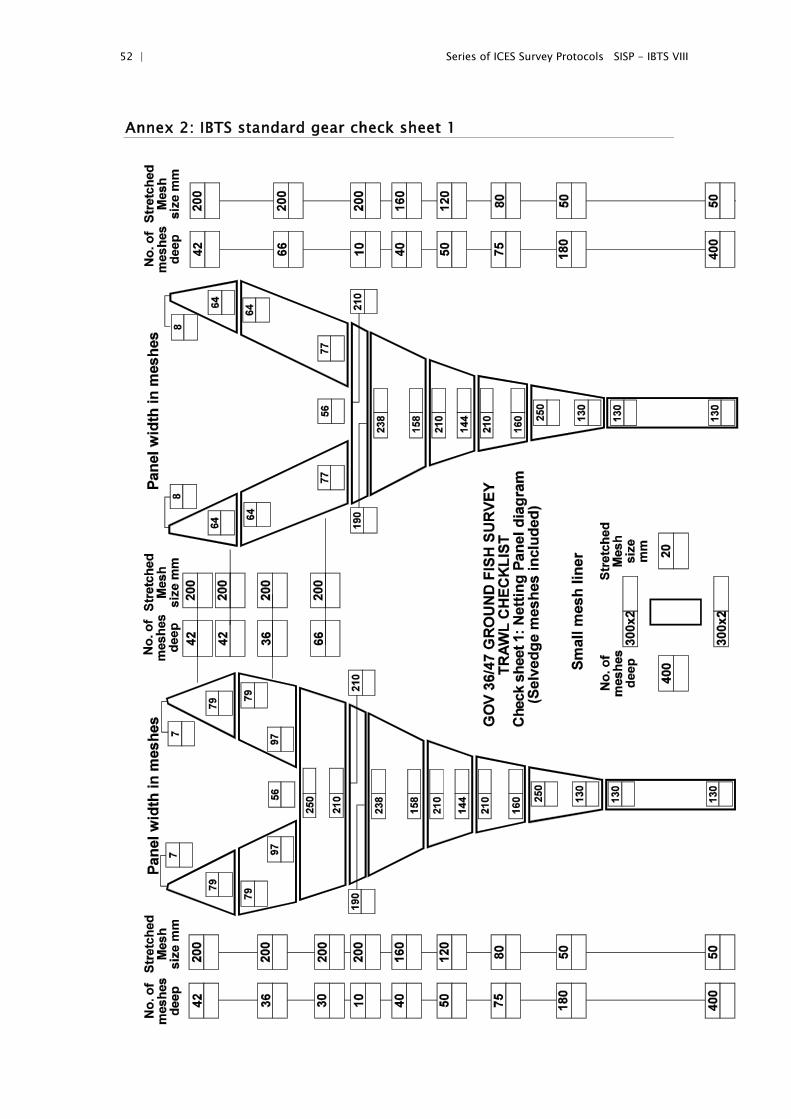
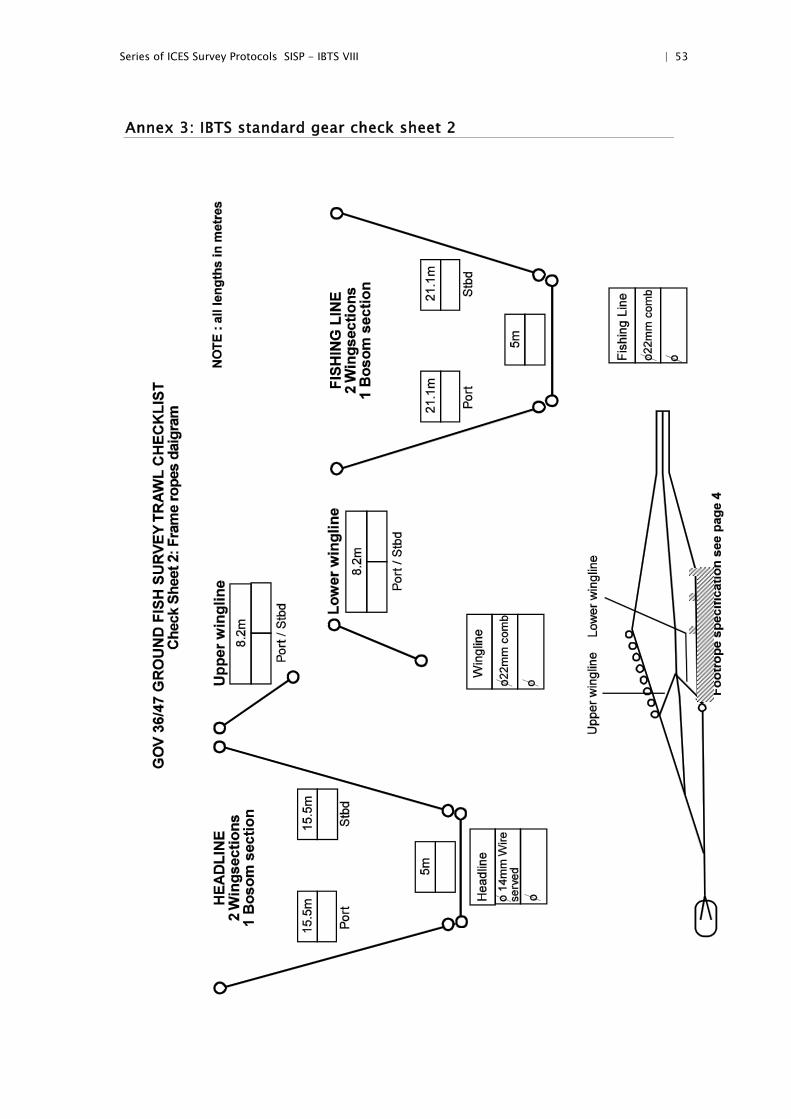
The construction of the 36/47 GOV-trawl is shown in Figure 2.5. A set of check sheets should be used to maintain a standard rigged GOV. These should be used to check all dimensions of the GOV and to ensure that it is rigged correctly on the vessel. When a new net is delivered check sheets 1 (Annex 2) and 2 (Annex 3) should be filled in to ensure that the net is manufactured to the correct specification.
Special attention is drawn to the lining of the codend. This lining should consist of 400 stretched meshes of 20 mm each, giving a total length of 8m. The total circumference of the lining should be 600 meshes.
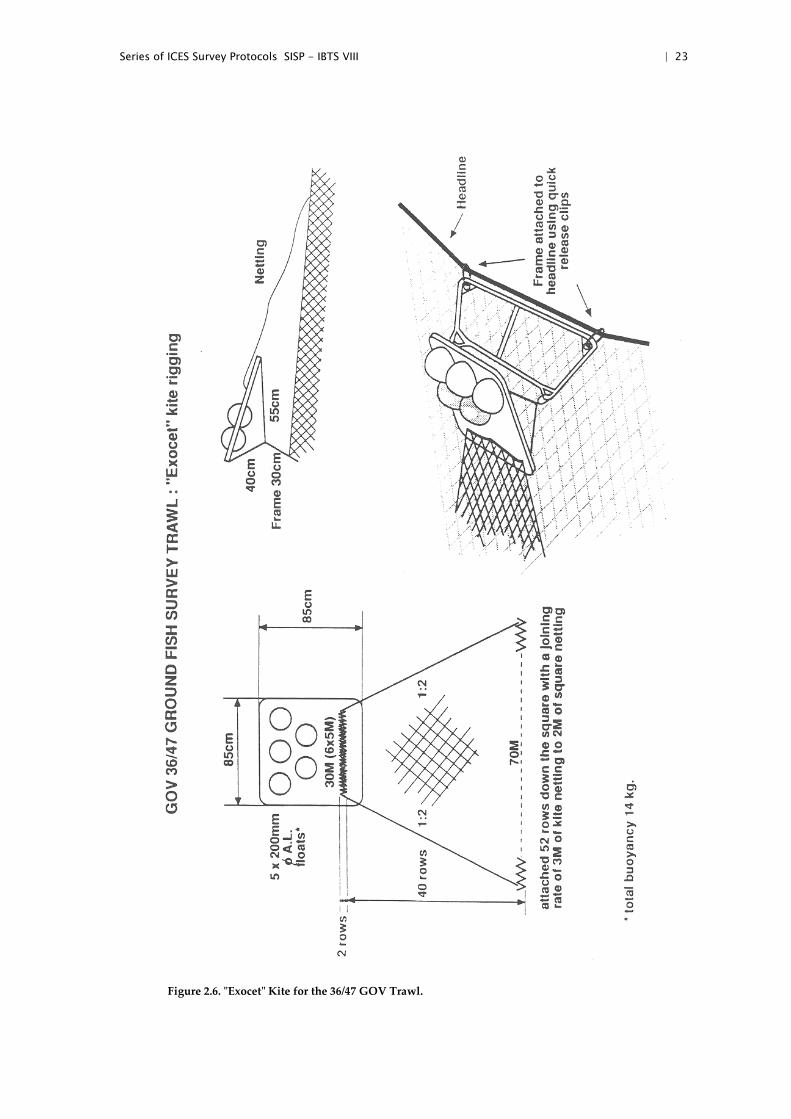
Details of the "Exocet" kite and suggestions how to attach the kite to the trawl are shown in Figure 2.6. Five floats with a buoyancy of 2.9 kg each should be attached to the kite. If a kite other than the recommended one is used then the lift of this kite should be the same as of the “Exocet” kite so that the configuration of the net conforms to expected parameters. Figures 2.11 and 2.12 illustrate the expected warp out / headline height ratio and the warp out / door spread ratio.
Total buoyancy of the floats on the net should be 172 kg. The floats should be spread as evenly as possible over the wings and the square.
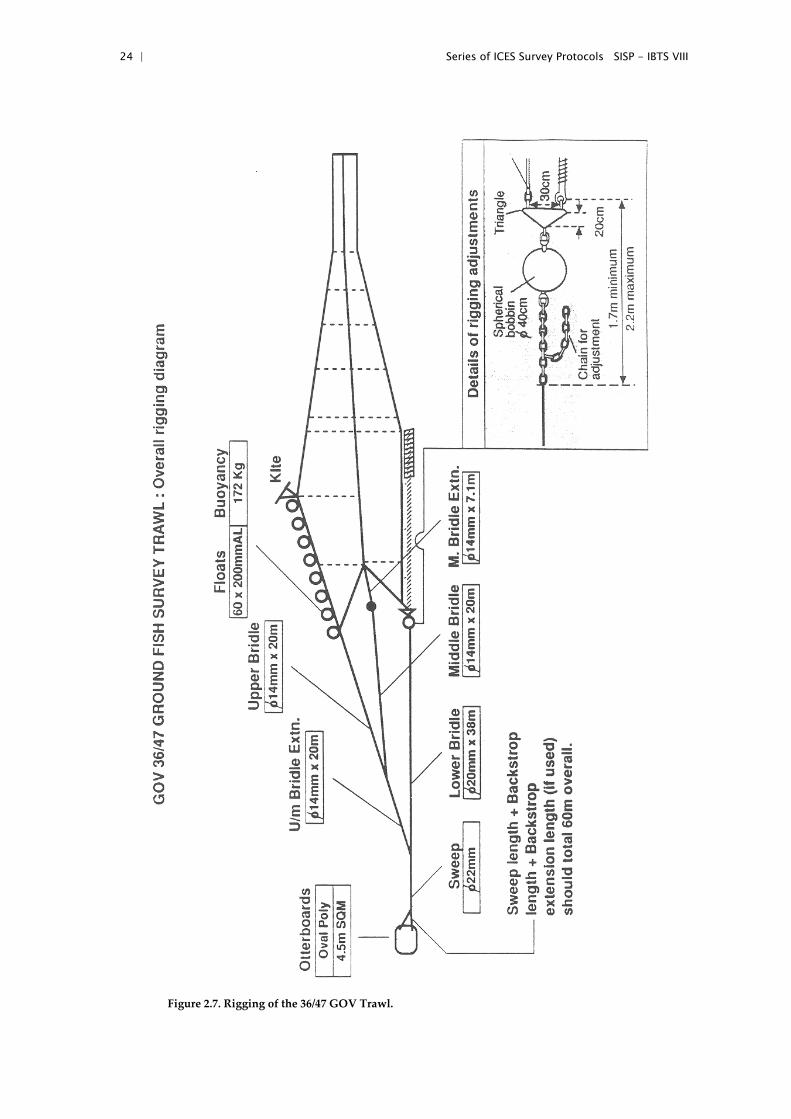
2.6 GOV trawl rigging
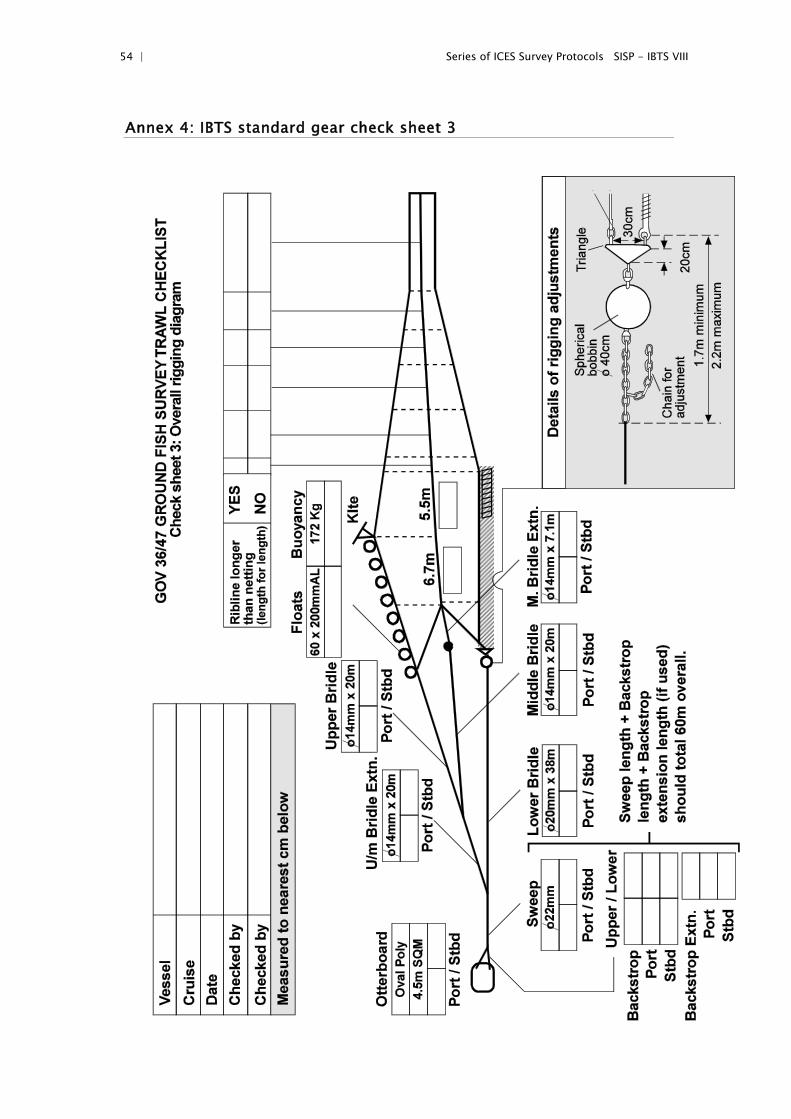
The rigging is given in Figure 2.7. On board the vessel when attaching the trawl to the bridles and doors, check sheet 3 (Annex 4) should be used.
Historically during the first quarter survey the length of the sweeps should have depended on the bottom depth:
• 60 m sweeps (including back-strops) are used in water depths less than 70 m,
• 110m sweeps (including back-strops) are used in deeper waters.
However in Q1 not all countries are carrying out these changes. It should be noted that the most important consideration is that the net geometry is within the acceptable limits for the depth of water.
In Q3, a sweep length of 60 m (including back-strops) is used throughout the survey area. The different sweep lengths in Q1 were kept for reasons of consistency over the time-series. The effect of the different sweep lengths was, however, doubted and therefore not copied when the quarterly surveys started in 1991.
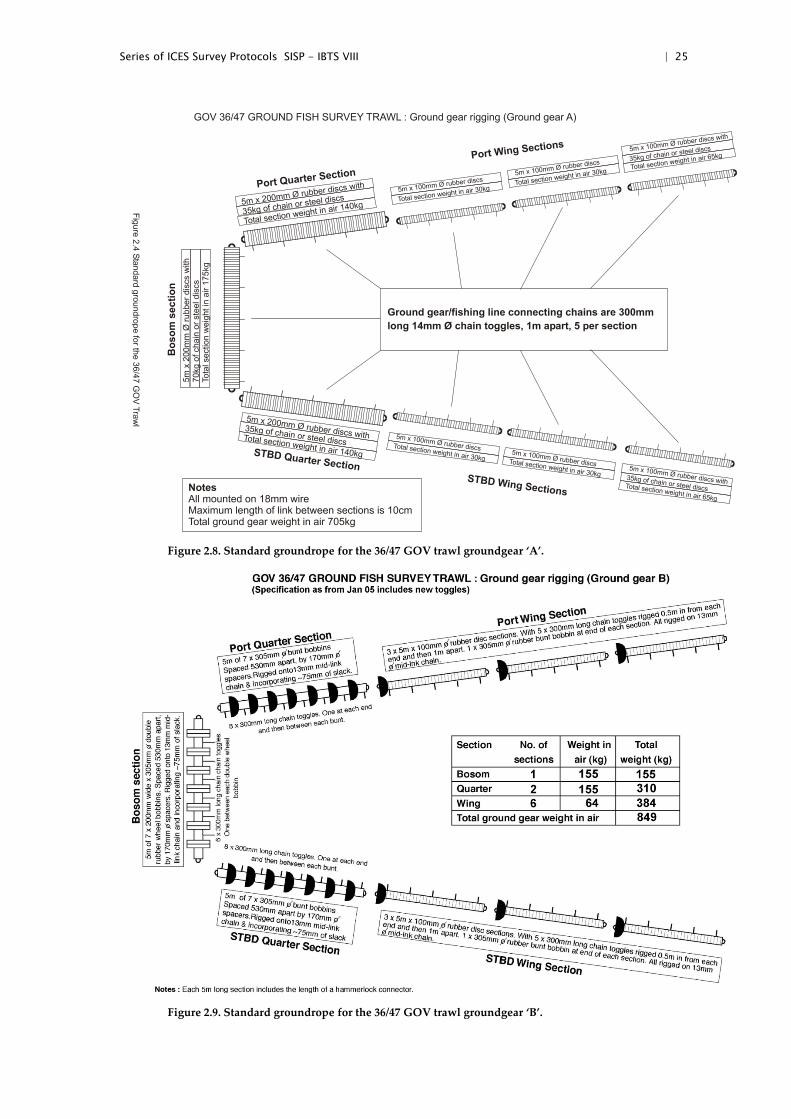
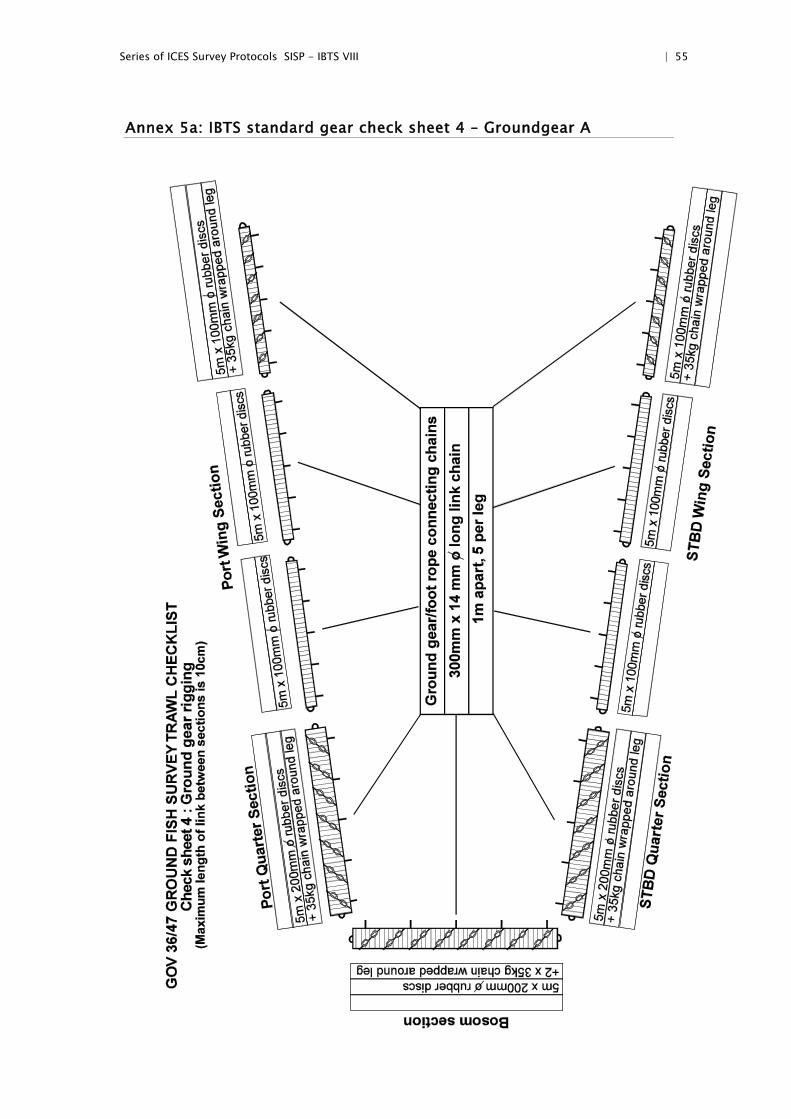
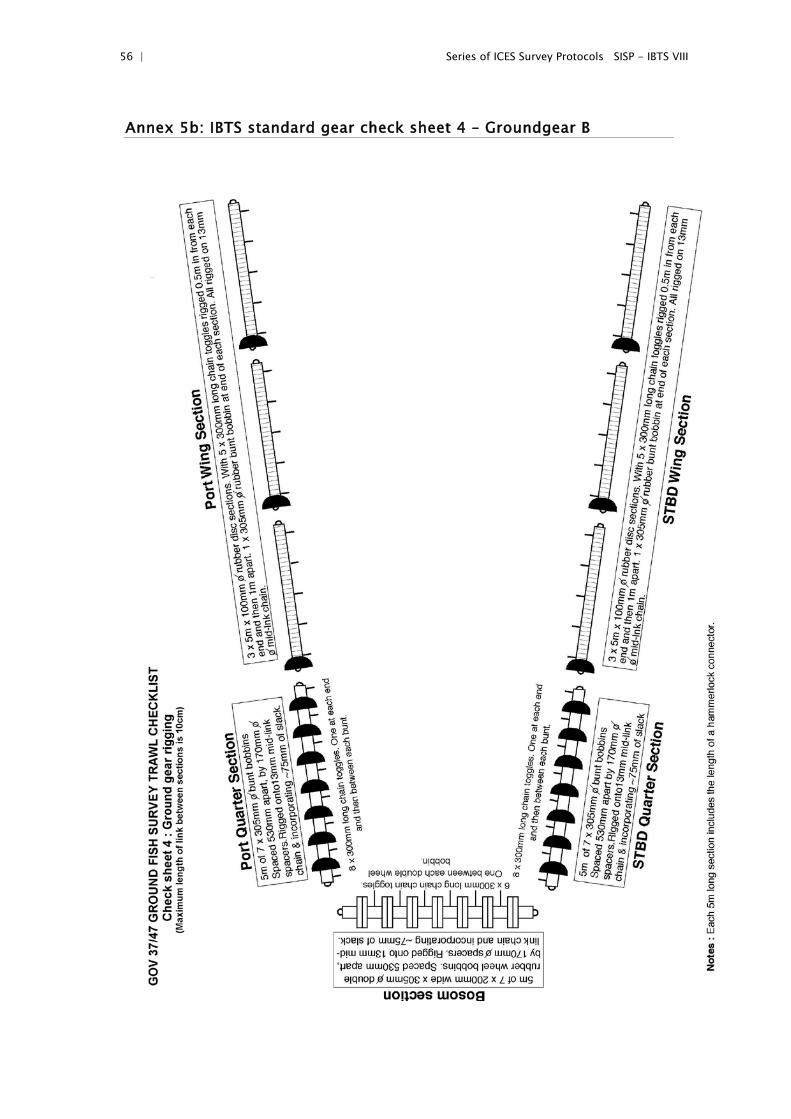
The standard groundrope with rubber discs (groundgear ‘A’) as shown in Figure 2.8 should be used throughout the survey area. However, since 1985 Scotland have used a hard groundgear ‘B’ on all stations north of 57° 30” North (Figure 2.9). Again a check sheet (Annexes 5a and 5b) should be used to ensure the groundgear is to specification. The extra weights in the groundrope are 70 kg in the square, 35 kg in each quarter and 35 kg in each forward wing-end. These weights should be evenly spread over the appropriate length of groundrope and this can be achieved by wrapping chain externally around the groundrope or, preferably, by interspersing the groundrope rubber discs with steel discs of the same diameter. Approximate weight in air is given for each section of the groundrope.
It is very important to achieve good bottom contact over the whole groundrope and this should be checked regularly. A proper contact of the net could be indicated by acoustic devices, wearing on chains and presence of benthic organisms and flatfish in
16 | Series of ICES Survey Protocols SISP - IBTS VIII
the catch. The contact of the net with the bottom can also be greatly influenced by changing the length of the adjustment chain between the lower leg and the bumper bobbin. The normal length of this chain is 2 metres but on rough ground it can be shortened to 1.7 metres; if the gear is fishing too light it can be lengthened to 2.2 metres.
For a proper performance of the net it is essential that the four upper bridles are of identical length, and regular checks should be made to ensure this. It is also recom-mended that a total check of the trawl is carried out prior to the survey.
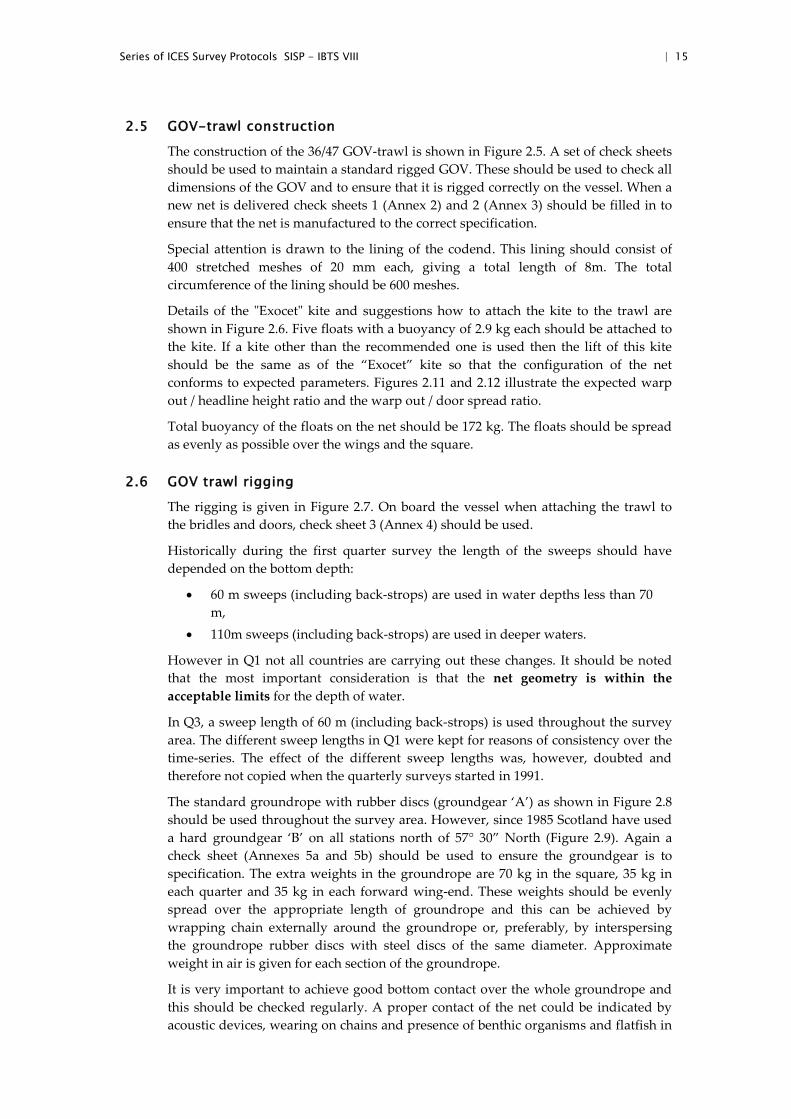
When checking the GOV mesh sizes, either during construction or on rigging the net, either an Omega net gauge or another standard net gauge should be used, measuring the stretched mesh (see figure below).
During measuring a 5% tolerance is allowed. When using the Omega Gauge, please follow the manufacturers’ instructions for correct use, as overstretching could be an issue. The net can be measured either wet or dry. This is a summary of the information taken from the working document presented at IBTSWG in 2008 (WD1: Mahé, J.C., Mortreux, S. 2008 – Review of measurement protocols for mesh size and effect of intensive use on the initial characteristics).
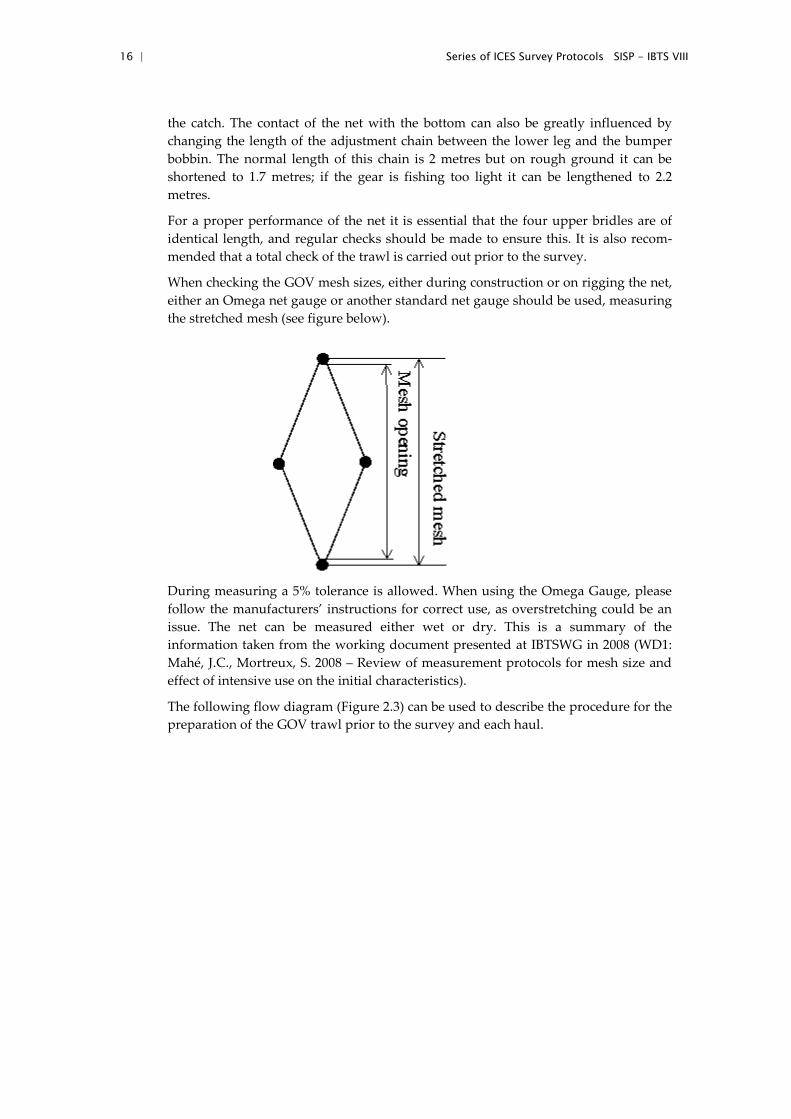
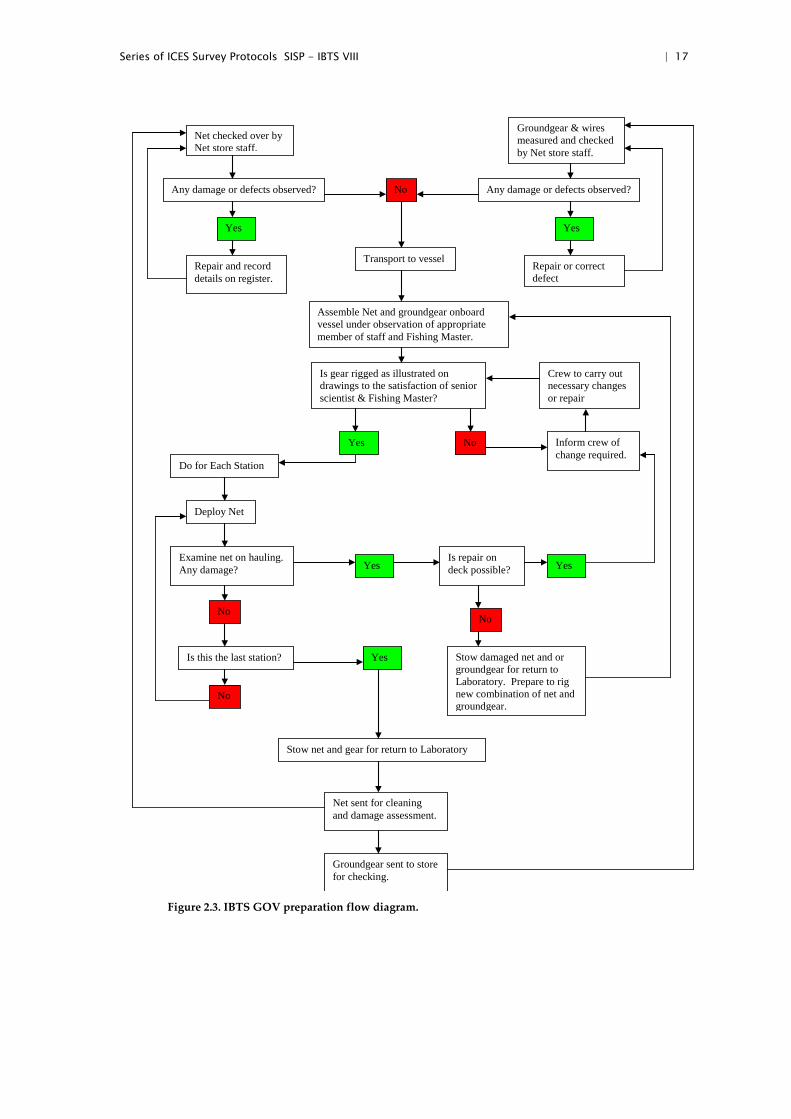
The following flow diagram (Figure 2.3) can be used to describe the procedure for the preparation of the GOV trawl prior to the survey and each haul.
Series of ICES Survey Protocols SISP - IBTS VIII | 17
Figure 2.3. IBTS GOV preparation flow diagram.
Net checked over by
Net store staff.
Groundgear & wires measured and checked by Net store staff.
Any damage or defects observed? Any damage or defects observed? No
Repair and record details on register.
Repair or correct defect
Transport to vessel
Assemble Net and groundgear onboard vessel under observation of appropriate member of staff and Fishing Master.
Is gear rigged as illustrated on drawings to the satisfaction of senior scientist & Fishing Master?
Yes Yes
Yes No Inform crew of change required.
Crew to carry out necessary changes or repair
Do for Each Station
Deploy Net
Examine net on hauling. Any damage?
Is this the last station?
No
No
Yes
Yes
Is repair on deck possible? Yes
No
Stow damaged net and or groundgear for return to Laboratory. Prepare to rig new combination of net and groundgear.
Stow net and gear for return to Laboratory
Net sent for cleaning and damage assessment.
Groundgear sent to store for checking.
18 | Series of ICES Survey Protocols SISP - IBTS VIII
2.7 Standard fishing method
It is suggested that all nations undertaking standardized surveys allocate some of the survey time to carrying out additional hauls at the start of the survey with the specific aim of ensuring that all standard elements of the groundfish survey are working correctly. This should include:
• Gear deployment: is the gear rigged correctly and being deployed and retrieved appropriately by the crew? Is the deck machinery all functioning?
• Ground contact: do the groundgear and doors indicate that the net is on the bottom and fishing correctly?
• Trawl sensors and CTDs: are all electronic equipment functioning correctly, and collecting meaningful data?
• Catch processing: are all elements of catch processing and data inputting functioning?
Though there are good reasons for having these additional hauls in the main survey area, for practical reasons they should be undertaken near the port of departure. This would then allow additional staff (including a gear technologist) to be present to fully check the gear and electronics, and would also save time in case something requires further attention.
Standard fishing speed is 4 knots measured as trawl speed over the ground. The recommended speed is set as a target and actual (ground) speed and distance towed should be monitored and reported. With tide and weather effecting the average speed of a vessel, as a guide the minimum trawl speed should not go below 3.5 knots and the maximum should not exceed 4.5 knots with the average for the entire tow being as close to 4 knots as possible. It is also recommended that if possible, the speed of the trawl through the water should be monitored and reported.
The maximum fishing depth for standard stations in the North Sea is 200 m and in Division IIIa 250 m.
A standard tow should be fished for 30 minutes. Start time is defined as the moment when the vertical net opening and doorspread are stable. Stop time is defined as the start of the winches hauling the net back in. It may be acceptable to fish for less than this i.e. haul early for safety reasons or in the case of very large catches, however any tow under 15 minutes should be either invalid or tagged as non-standard and reasons given for it.
As a minimum, vertical net opening and doorspread should be monitored at 30-second intervals and after appropriate filtering for invalid values the mean values should be reported. It is recommended that wingspread is also measured. In order to ensure that the gear performs correctly the net geometry should be within tolerances set out in Section 2.8.
It is preferable to only conduct trawling operations during daylight hours although it is recognized that some institutes may wish to trawl both during the day and night. Night-time hauls need to be entered as such and should not be used as standard IBTS hauls for direct comparison with daylight hauls. It is further strongly recommended that during the February survey the trawling in the old herring standard area (see Figure 6.4) is carried out during daytime only. In the morning the net should not be shot earlier than 15 minutes before sunrise. At the end of the day, the net must be hauled within 15 minutes after the time of sunset. A software package that calculates
Series of ICES Survey Protocols SISP - IBTS VIII | 19
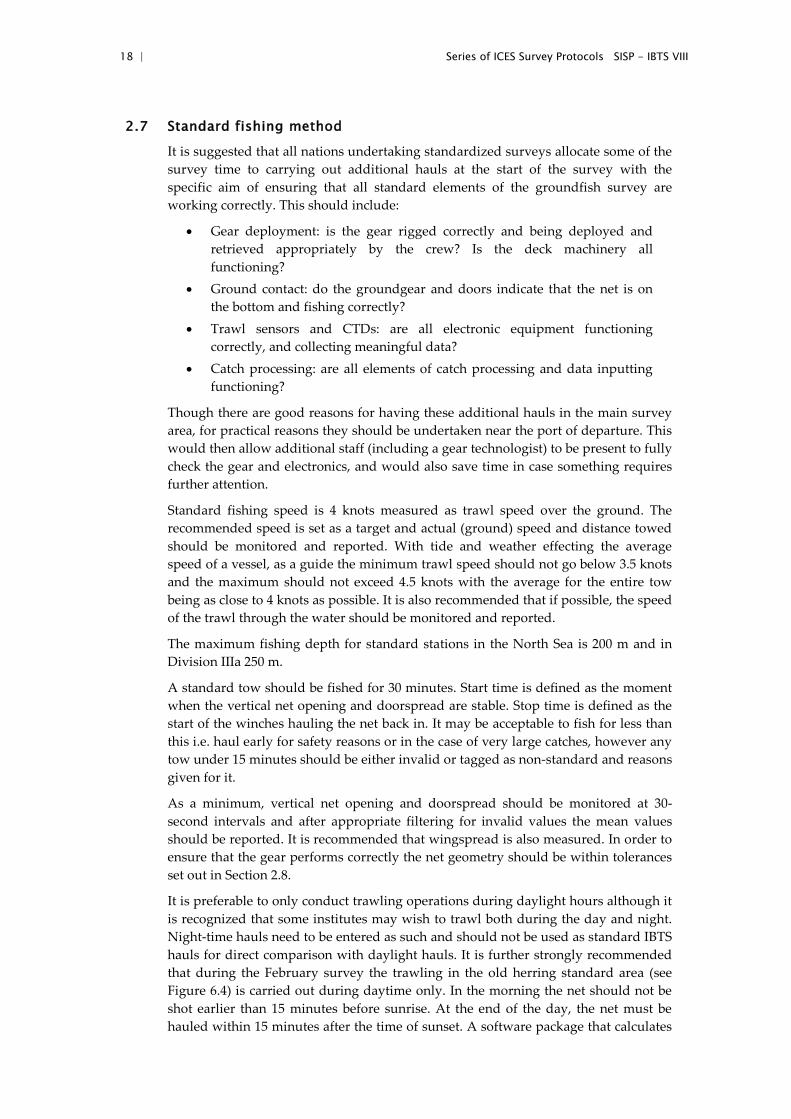
sunrise and sunset, known as “RiseAndSet”, is available from IMARES, but many other are available and may be used. In order to make a quick calculation, the daylight hours for various periods can be calculated with reference to current latitude and the text table below:
Daylight period in UTC at 0 degrees longitude.
Dates North of 57° 30' N
Sunrise Sunset Sunrise Sunset
01–10 Jan 08.09 15.58 08.45 15.25 10–20 Jan 08.01 16.17 08.31 15.45 21–31 Jan 07.47 16.35 08.15 16.07 01–10 Feb 07.29 16.58 07.49 16.36 11–20 Feb 07.08 17.20 07.23 17.05 21–28 Feb 06.47 17.41 06.55 17.30 01–10 Mar 06.27 17.57 06.32 17.50 11–20 Mar 06.03 18.18 06.05 18.15 21–31 Mar 05.35 18.38 05.32 18.39 01–10 Jul 03.15 20.55 02.28 21.40 11–20 Jul 03.26 20.47 02.49 21.24 21–31 Jul 03.41 20.33 03.08 21.03 01–10 Aug 04.00 20.12 03.34 20.38 11–20 Aug 04.19 19.50 03.59 20.09 21–31 Aug 04.37 19.26 04.23 19.42 01–10 Sep 04.57 19.00 04.48 19.09 11–20 Sep 05.16 18.34 05.12 18.38 21–30 Sep 05.35 18.08 05.35 18.08
Source: 'The Times Atlas' 1972, p 33.
For each degree longitude west, 4 minutes should be added and for each degree longitude east, 4 minutes should be subtracted.
2.8 Monitoring net geometry
All countries should use electronic equipment to monitor net geometry (e.g. SCANMAR). On all IBTS hauls, headline height and door spread should be recorded. The sensor manual should be referred to for the correct method for attaching the units to the gear. In order to ensure a valid tow, gear stability is crucial. In the first instance, the new warp out to depth ratios should be used to control net geometry. During the tow it is imperative that net geometry is measured and kept within the acceptable limits (Figure 2.10, Figure 2.11 and Figure 2.12 should be used as a guide until new updated plots can be produced). The user should continuously monitor net performance during a tow and if needed adjust the trawling conditions to return to accepted limits (e.g. by changing warp length). If the readings remain outside the recommended values for an unacceptable period of time it could mean that the gear has become fouled or damaged and should be hauled in.
It is recommended that the entire data stream, including all of the net sensor parameters that are recorded, is saved to allow mean and variance values to be calculated properly and entered into the individual institutes’ databases. These values should be calculated from the time the gear has stabilized on the bottom to the time the gear is hauled. Data screening should also be carried out, and the 2009 SGSTS report Section 4.2.1, gives guidance on how to carry this out. Data from these
20 | Series of ICES Survey Protocols SISP - IBTS VIII
calculations should be sent to DATRAS with the standard upload from institutes databases.
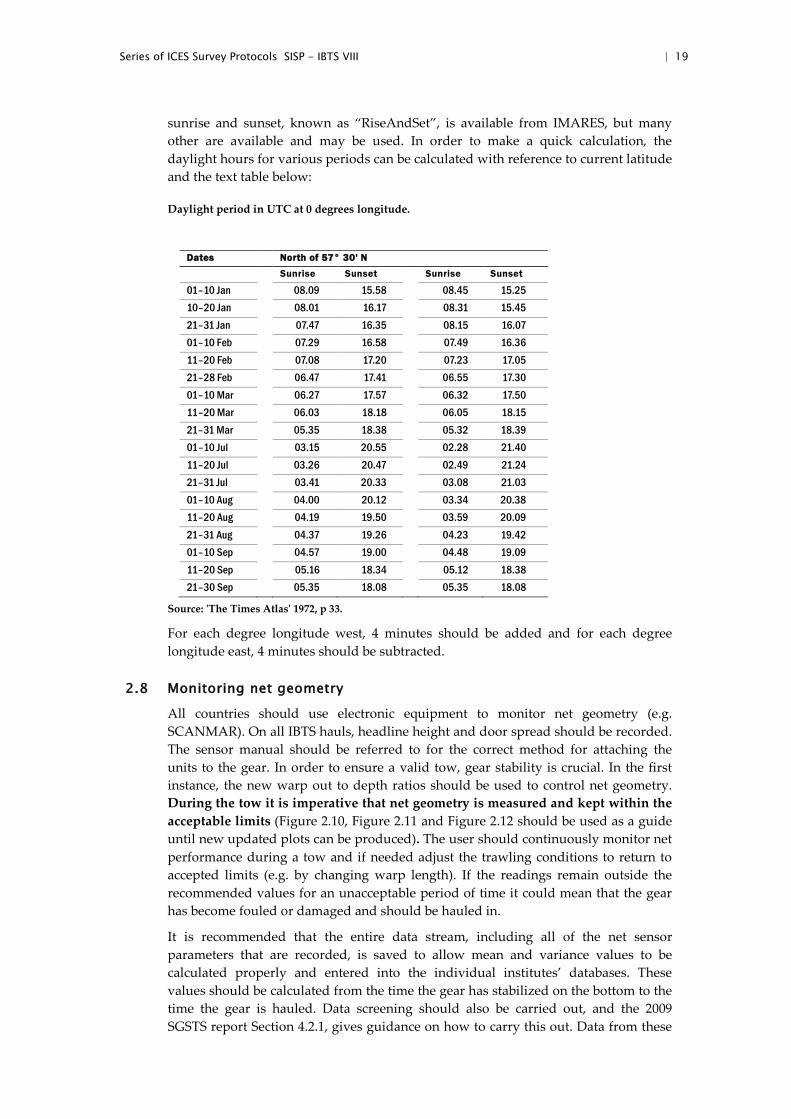
The following flow diagram (Figure 2.4) can be used to help in the process of using software for net performance sensors and units during a GOV haul.
Figure 2.4. IBTS flow diagram for use of data from net performance sensors.
Are Scanmar units attached as advised. No
Modify to meet requirements
Yes
Deploy Gear
Is Net and Gear free from obstruction. Ie Kite or Scanmar foul.
Continue shooting operations until gear is on bottom.
Record details when data indicates that the net is stable and readings within acceptable limits.
Are Scanmar readings within recognized ranges?
Is this due to one or more units not operating?
Haul l gear back
Continue monitoring
Do the data received indicate that the gear is still operating effectively?
Is duration of haul complete?
No Haul back gear and clear obstruction
Yes
No No
Yes
Yes
Check that net and ground-gear meet specification
Do for Each Haul
E nsure that all relevant sensor units alo ng with adequate backup and chargers are supplied to ship.
Yes No Do other readings indicate that gear is operating effectively?
Yes
No
Yes
No
Record details and haul gear back
Record details and haul gear back
Is duration of Tow acceptable?
Valid Haul Not Valid Haul
Yes No
Yes No End Cruise
Last Haul?
Series of ICES Survey Protocols SISP - IBTS VIII | 21
2.9 Fishing Positions
Most statistical rectangles contain a number of possible tows that are deemed to be free of obstruction. In some rectangles sampling may be further stratified as a result of significant changes in seabed depth, which may, in turn, cause variations in the fish population. Vessels are free to choose any positions in the rectangles that they are surveying if hauls are sufficiently far apart from each other: In rectangles or strata that are to be sampled more than once by the same vessel it is recommended that valid hauls are separated by at least one day or by at least 10 miles wherever this is possible. Tows in adjacent rectangles should also be separated by at least 10 miles. DATRAS holds all of the station data for historical surveys and could be used to help identify clear tows. Extra care should be taken if fishing using this information taken from the DATRAS database as some comments on obstructions at start and end of tows may not be available in the system.
Fish shoals located by sonar or echosounder should not influence fishing locations.
22 | Series of ICES Survey Protocols SISP - IBTS VIII
Figure 2.5. Construction of the 36/47 GOV Trawl.
Series of ICES Survey Protocols SISP - IBTS VIII | 23
Figure 2.6. "Exocet" Kite for the 36/47 GOV Trawl.
24 | Series of ICES Survey Protocols SISP - IBTS VIII
Figure 2.7. Rigging of the 36/47 GOV Trawl.
Series of ICES Survey Protocols SISP - IBTS VIII | 25
Figure 2.8. Standard groundrope for the 36/47 GOV trawl groundgear ‘A’.
Figure 2.9. Standard groundrope for the 36/47 GOV trawl groundgear ‘B’.
26 | Series of ICES Survey Protocols SISP - IBTS VIII
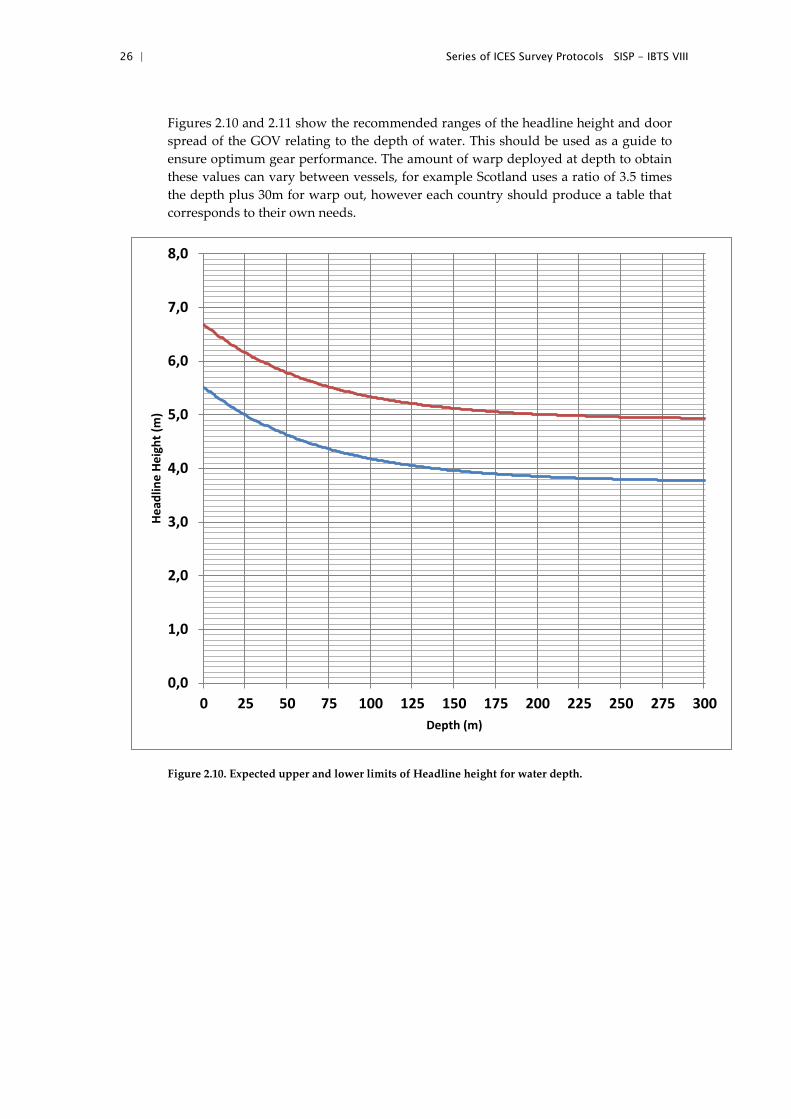
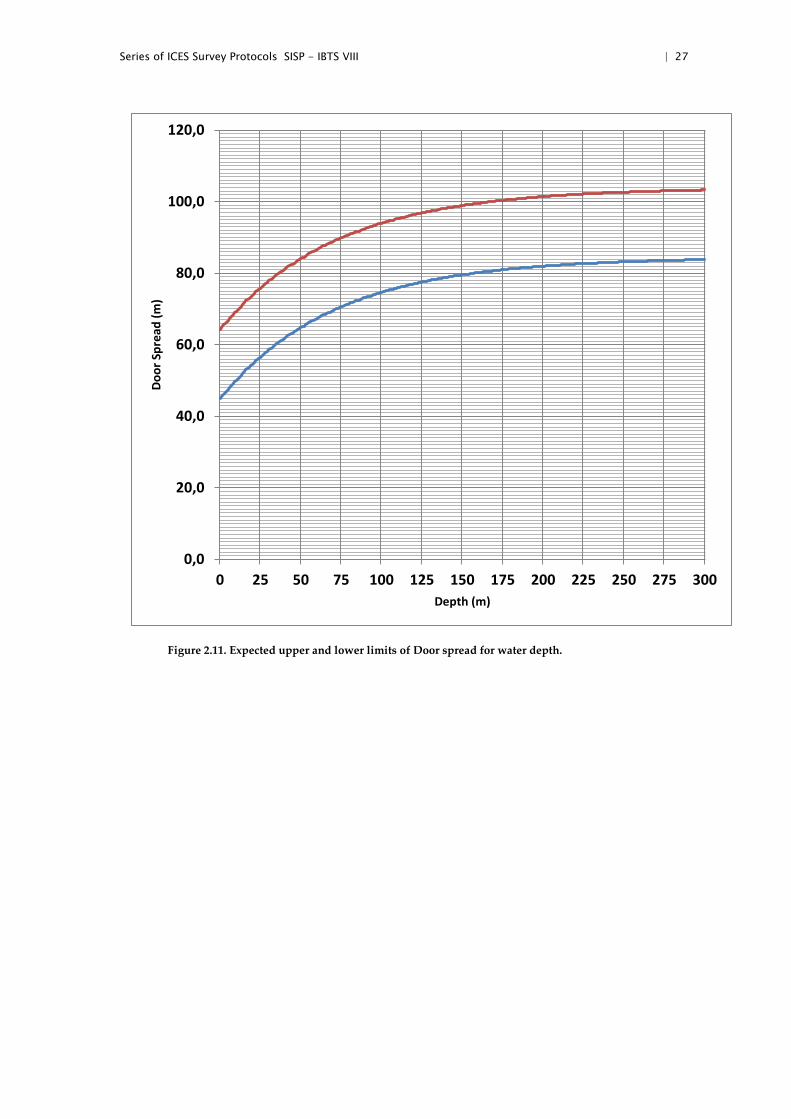
Figures 2.10 and 2.11 show the recommended ranges of the headline height and door spread of the GOV relating to the depth of water. This should be used as a guide to ensure optimum gear performance. The amount of warp deployed at depth to obtain these values can vary between vessels, for example Scotland uses a ratio of 3.5 times the depth plus 30m for warp out, however each country should produce a table that corresponds to their own needs.
Figure 2.10. Expected upper and lower limits of Headline height for water depth.
0,0
1,0
2,0
3,0
4,0
5,0
6,0
7,0
8,0
0 25 50 75 100 125 150 175 200 225 250 275 300
Head
line
Heig
ht (m
)
Depth (m)
Series of ICES Survey Protocols SISP - IBTS VIII | 27
Figure 2.11. Expected upper and lower limits of Door spread for water depth.
0,0
20,0
40,0
60,0
80,0
100,0
120,0
0 25 50 75 100 125 150 175 200 225 250 275 300
Door
Spr
ead
(m)
Depth (m)
28 | Series of ICES Survey Protocols SISP - IBTS VIII
3 Sampling of GOV-trawl catches
3.1 Catch sorting and sampling
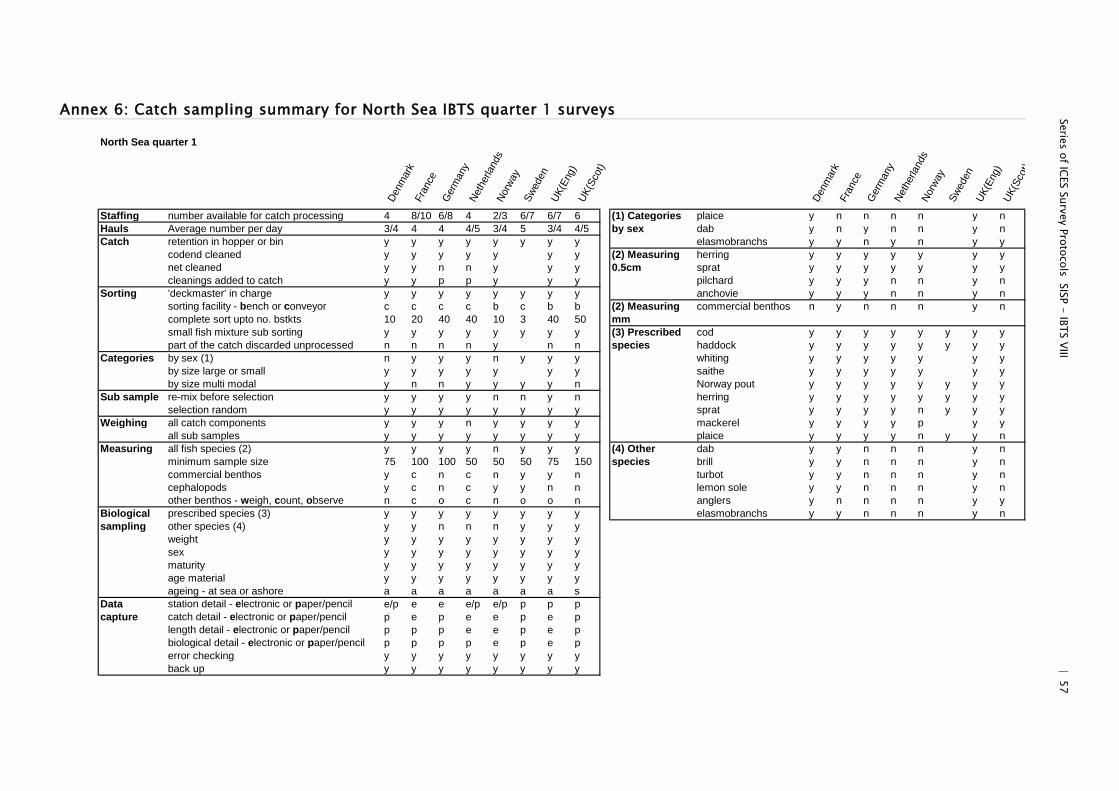
It is recommended that the catch from all valid hauls be sorted fully were practicable. Wherever possible, the entire catch is sorted, with fish and shellfish species identified to the lowest taxonomic level possible. For larger catches a selection of species/size categories of species may be identified as being sufficiently abundant that they can be subsampled, appropriately. If the entire catch cannot be sorted through then the data should be flagged accordingly when submitted to the DATRAS database. Appendices VI and VII show tables of catch processing procedures (updated from the Report of the International Bottom Trawl Survey Working Group, ICES, 2002).
Although standardized data collection for fish is well established in IBTS protocols, and these data are submitted to DATRAS, there is no standardized approach to the submission of data on the catches and size distribution of cephalopods and shellfish. Some national laboratories record other invertebrate species (“benthos”), though no agreed protocols for the collection and submission of data exist, as the levels of taxonomic expertise on board vessels can be variable. The GOV is not an effective gear for catching benthos for quantitative sampling it can be used for some crude distribution information, remembering the limitation of the gear, given the groundgear set up and the size of the meshes within the net make-up. These data can be collected as presence/absence or to more sophisticated means (weights/numbers). It is at the discretion of the institute collecting the data to decide what means is most appropriate. Hence, national laboratories collecting information on benthos should continue to do so, though such data should not be reported to DATRAS until rigorous quality assurance and reporting procedures are in place, so as to ensure that data are of high quality.
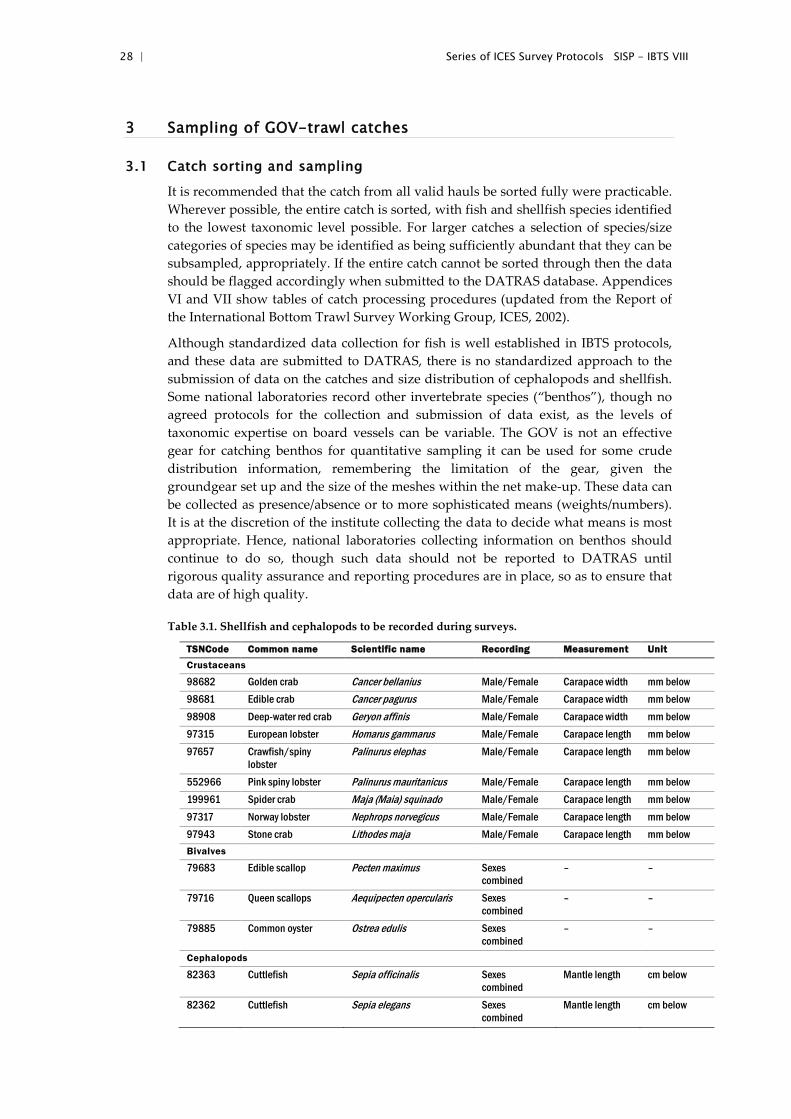
Table 3.1. Shellfish and cephalopods to be recorded during surveys.
TSNCode Common name Scientific name Recording Measurement Unit
Crustaceans
98682 Golden crab Cancer bellanius Male/Female Carapace width mm below 98681 Edible crab Cancer pagurus Male/Female Carapace width mm below 98908 Deep-water red crab Geryon affinis Male/Female Carapace width mm below 97315 European lobster Homarus gammarus Male/Female Carapace length mm below 97657 Crawfish/spiny
lobster Palinurus elephas Male/Female Carapace length mm below
552966 Pink spiny lobster Palinurus mauritanicus Male/Female Carapace length mm below 199961 Spider crab Maja (Maia) squinado Male/Female Carapace length mm below 97317 Norway lobster Nephrops norvegicus Male/Female Carapace length mm below 97943 Stone crab Lithodes maja Male/Female Carapace length mm below Bivalves
79683 Edible scallop Pecten maximus Sexes combined
– –
79716 Queen scallops Aequipecten opercularis Sexes combined
– –
79885 Common oyster Ostrea edulis Sexes combined
– –
Cephalopods
82363 Cuttlefish Sepia officinalis Sexes combined
Mantle length cm below
82362 Cuttlefish Sepia elegans Sexes combined
Mantle length cm below
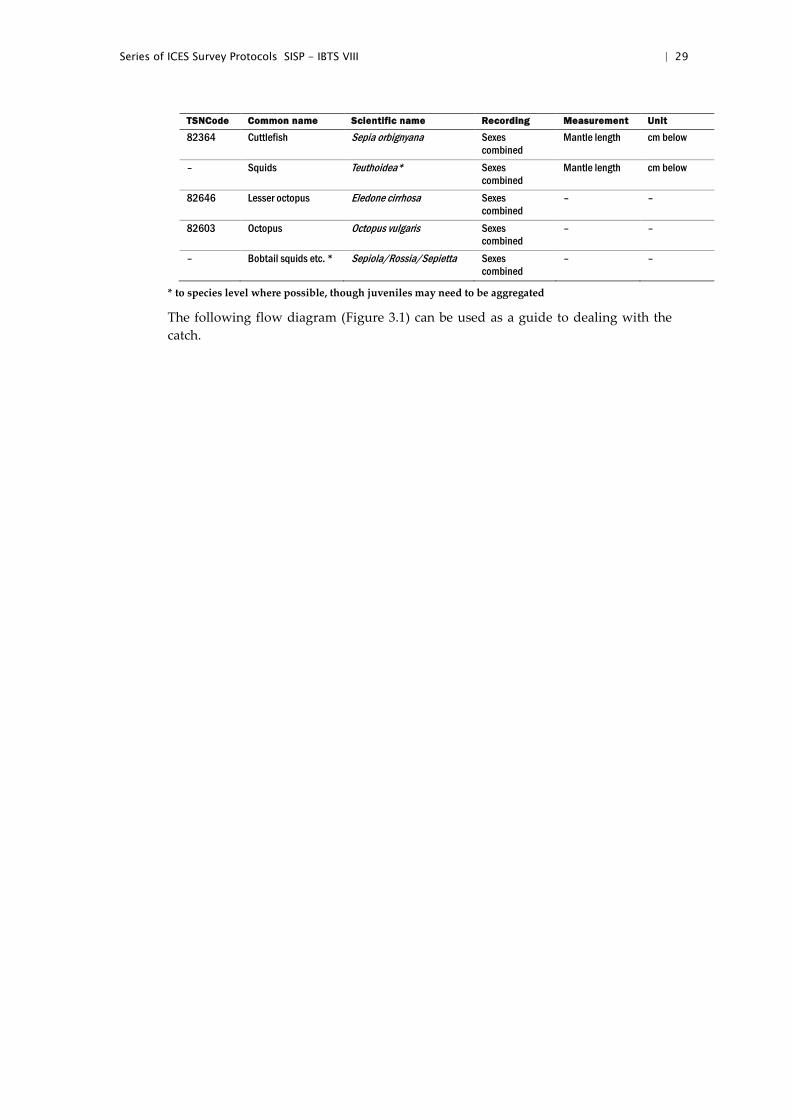
Series of ICES Survey Protocols SISP - IBTS VIII | 29
TSNCode Common name Scientific name Recording Measurement Unit
82364 Cuttlefish Sepia orbignyana Sexes combined
Mantle length cm below
– Squids Teuthoidea* Sexes combined
Mantle length cm below
82646 Lesser octopus Eledone cirrhosa Sexes combined
– –
82603 Octopus Octopus vulgaris Sexes combined
– –
– Bobtail squids etc. * Sepiola/Rossia/Sepietta Sexes combined
– –
* to species level where possible, though juveniles may need to be aggregated
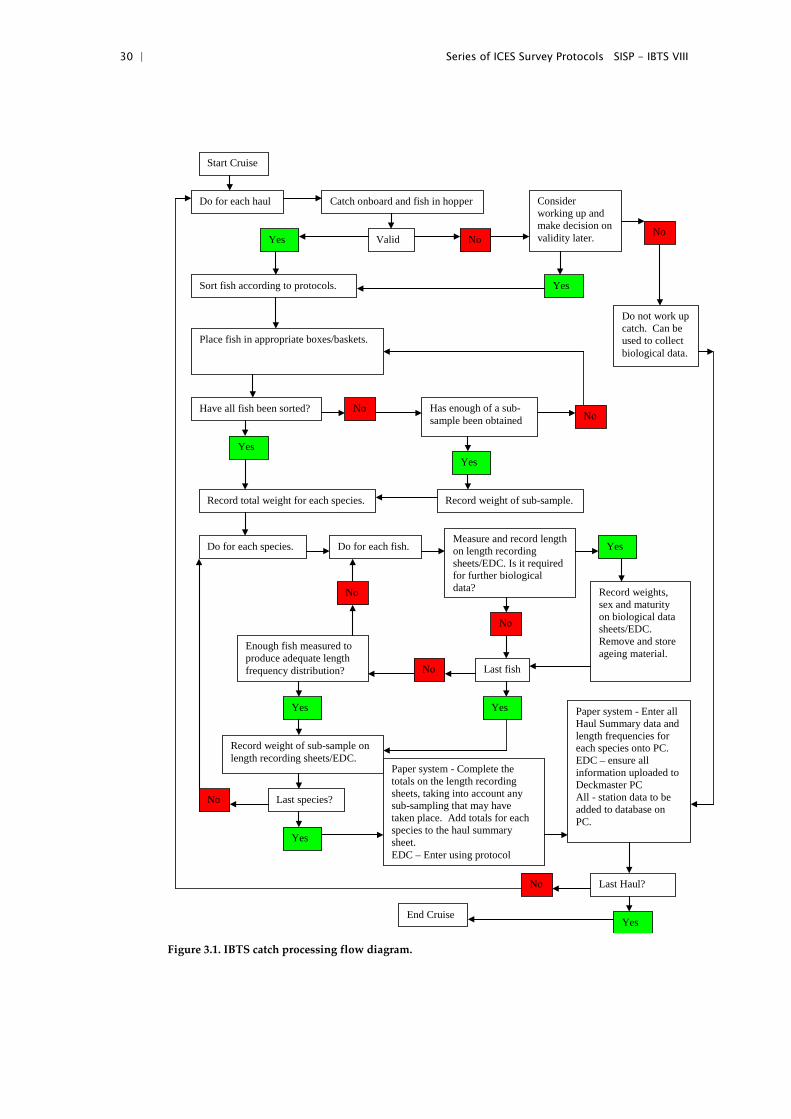
The following flow diagram (Figure 3.1) can be used as a guide to dealing with the catch.
30 | Series of ICES Survey Protocols SISP - IBTS VIII
Figure 3.1. IBTS catch processing flow diagram.
Start Cruise
Do for each haul Catch onboard and fish in hopper
Valid Yes No
Consider working up and make decision on validity later.
Sort fish according to protocols. Yes
No
Place fish in appropriate boxes/baskets.
Have all fish been sorted?
Yes
No Has enough of a sub-sample been obtained No
Yes
Record total weight for each species. Record weight of sub-sample.
Do not work up catch. Can be used to collect biological data.
Do for each species. Do for each fish. Measure and record length on length recording sheets/EDC. Is it required for further biological data?
Yes
No
Record weights, sex and maturity on biological data sheets/EDC. Remove and store ageing material.
No
Last fish
Yes
No
Enough fish measured to produce adequate length frequency distribution?
Yes
Record weight of sub-sample on length recording sheets/EDC.
Last species? No
Yes
Paper system - Complete the totals on the length recording sheets, taking into account any sub-sampling that may have taken place. Add totals for each species to the haul summary sheet. EDC – Enter using protocol
Paper system - Enter all Haul Summary data and length frequencies for each species onto PC. EDC – ensure all information uploaded to Deckmaster PC All - station data to be added to database on PC.
Last Haul?
Yes
No
End Cruise
Series of ICES Survey Protocols SISP - IBTS VIII | 31
3.2 Length composition
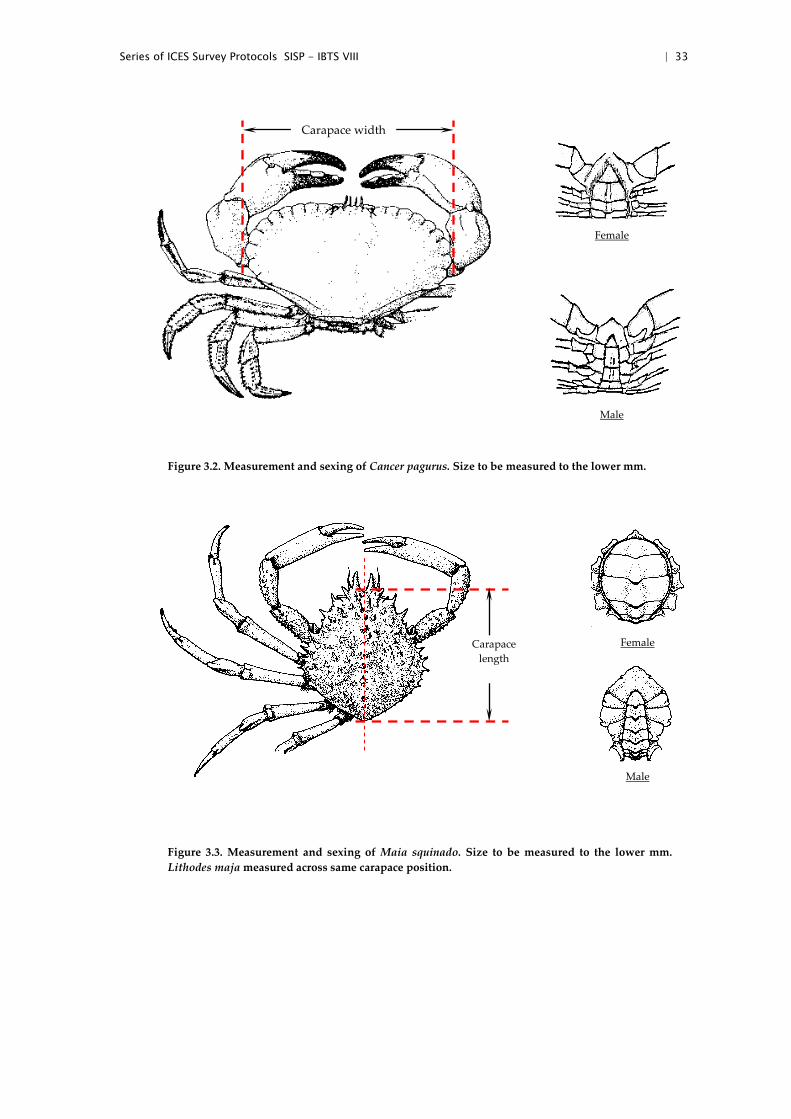
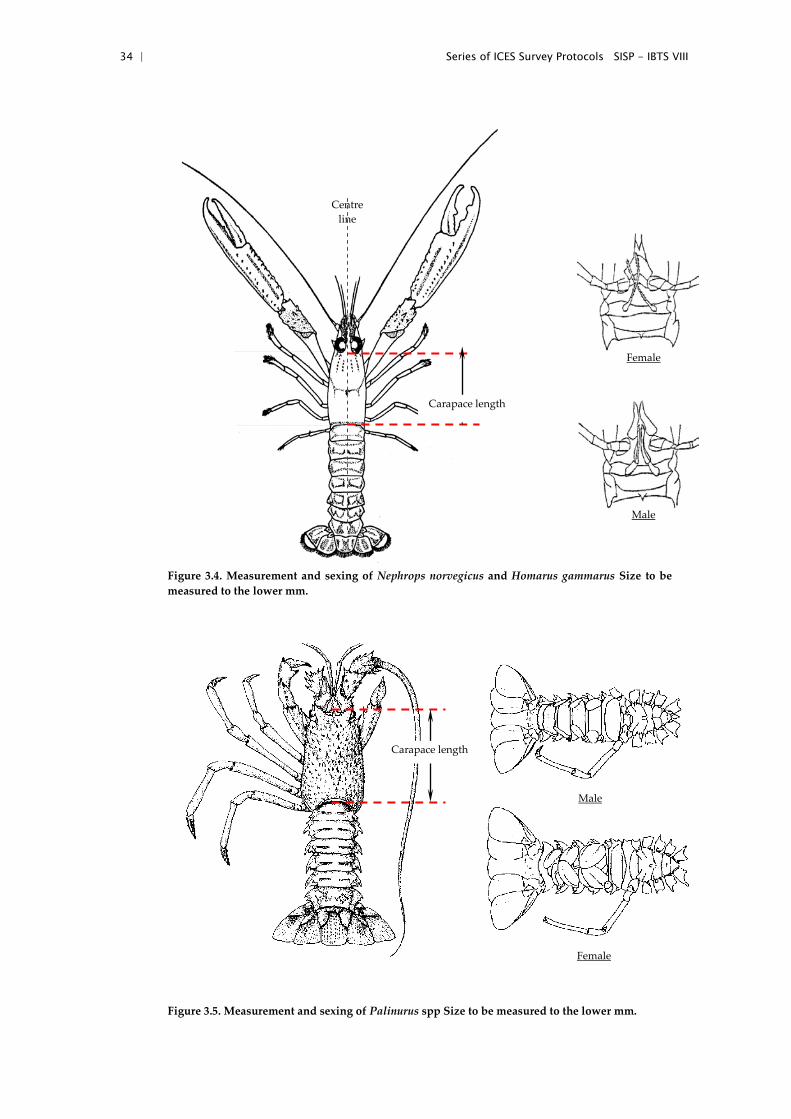
Length distributions are recorded for all fish species caught. Length is defined as total length, measured from tip of snout to tip of caudal fin, for all fish species other than those described in Section 3.4. Length is measured to 0.1cm below for shellfish, to 0.5 cm below for herring and sprat, and to 1 cm below for all other species. When measuring shellfish species, Figures 3.2 to 3.5 should be consulted to ensure the correct carapace measurement is taken. When measuring cephalopods the mantle length should be used, see Figure 3.6.
It is recommended that elasmobranchs and shellfish should be measured and weighed by sex.
After sorting the catch into species or species/sex, we need to obtain a length distribution for each catch category that accurately represents the length distribution. Where the numbers of individuals are too large for them all to be measured, a representative subsample is selected of at least 75 fish, although sampling a very limited length range could be adequately achieved with less. A proper representation of the given length distribution is key.
In the event that a truly representative subsample cannot be selected, it will be necessary to further sort the species into two or more size grades or categories. The following two examples are used to describe incidences when grading or categorization may be required but are by no means exhaustive.
Example 1. A catch element consists of 999 fish in the length range 18 - 26cm and one fish at 40cm. It is evident that a single subsample of 100 fish when raised up will give either 10 or zero fish at 40cm. The correct approach is to remove the one large fish and measure it separately, treating that sample as category 1, and take a subsample from the remaining 999 fish (category 2). When measured and raised this provides an accurate assessment of the numbers caught at each length for this element of the catch.
Example 2. A catch element consists of 994 fish in the length range 18-26cm and 3 fish in the length range 10–12cm and 3 fish in the length range 38-40cm. It is evident that a single raised subsample of 100 fish could give anything between zero and 10 fish in the length ranges 10-12cm and 38-40cm. The correct approach is to remove the small and large fish and measure them as category 1, and then take a subsample from the remaining 994 fish (category 2). When measured and raised this provides an accurate assessment of the numbers caught in each length group for this element of the catch.
In case of large catches (n > 1000) of any species, it is recommended that the minimum sample size given above should be doubled. This will help to ensure that any extremes of the length range are covered.
Fish should be identified to the species level. Only if this proves impossible may some be grouped by genus or larger taxonomic group (e.g. Pomatoschistus, Ammodytidae).
32 | Series of ICES Survey Protocols SISP - IBTS VIII
3.3 Sampling for age, sex and maturity
Otolith samples are to be collected within 10 specified sampling areas as illustrated in Figure 6.2. For all species the same areas are used but care should be taken not to extract otoliths from fish that exhibit length deformities.
For the target species the following minimum sampling levels should be maintained for each sampling area:
Species Minimum nimber of otoliths to be taken per Roundfish Area
herring 8 otoliths per 1/2 cm group sprat 16 otoliths per 1/2 cm group 8.0-11.0cm 12 otoliths per 1/2 cm group >11.0cm mackerel 8 otoliths per 1 cm group cod 8 otoliths per 1 cm group haddock 8 otoliths per 1 cm group whiting 8 otoliths per 1 cm group Norway pout 8 otoliths per 1 cm group saithe 8 otoliths per 1 cm group
For the smallest size groups, that presumably contain only one age group, the number of otoliths per length class may be reduced. Conversely, more otoliths per length group are required for the larger length classes.
Participants are encouraged to collect age samples also from other commercially important species such as plaice, IIIa sole, lemon sole and any other species deemed important to the EU Data Collection Framework (DCF), or specified by the IBTS working group.
Sex, maturity and weight data should be reported for all of the target species for which age data are collected. Maturity stages should be reported according to the maturity scales given in Annex 8 and 9, however this key is targeted at roundfish and for flatfish species scales the Report of the Workshop on Sexual Maturity Staging of sole, plaice, dab and flounder, ICES CM 2012/ACOM:50 should be consulted. When institutes are assigning biological targets for their surveys consideration should be taken to ensure that data are collected from the entire survey area.
3.4 Collection of marine litter from trawl
Marine litter is one of the MSFD descriptors. With this in mind from 2011, all North Sea IBTS surveys are to collect data on marine litter captured in the GOV trawl. Annex 15, gives the sheet and description of the categories that need to be collected at each station. Once collected these data can be sent to each institutes marine litter co-coordinator or to WKMAL.
Series of ICES Survey Protocols SISP - IBTS VIII | 33
Figure 3.2. Measurement and sexing of Cancer pagurus. Size to be measured to the lower mm.
Figure 3.3. Measurement and sexing of Maia squinado. Size to be measured to the lower mm. Lithodes maja measured across same carapace position.
Carapace width
Female
Male
Female
Male
Carapace length
34 | Series of ICES Survey Protocols SISP - IBTS VIII
Figure 3.4. Measurement and sexing of Nephrops norvegicus and Homarus gammarus Size to be measured to the lower mm.
Figure 3.5. Measurement and sexing of Palinurus spp Size to be measured to the lower mm.
Carapace length
Centre line
Female
Male
Male
Female
Carapace length
Series of ICES Survey Protocols SISP - IBTS VIII | 35
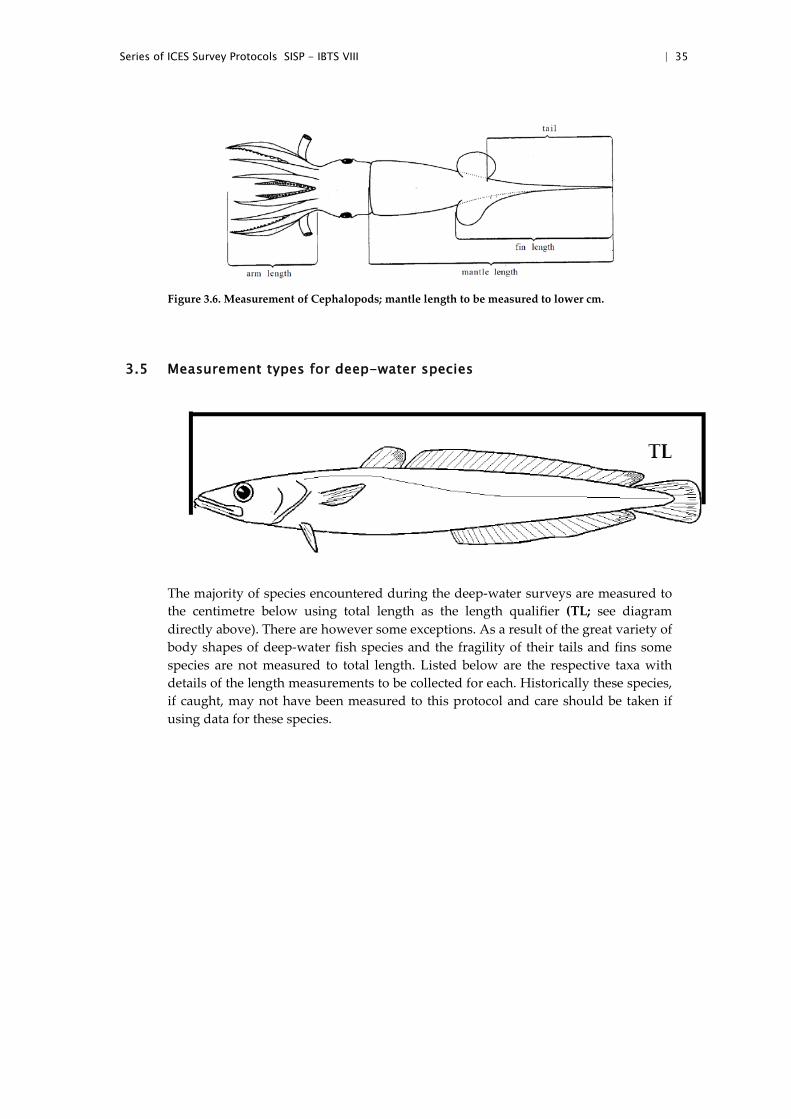
Figure 3.6. Measurement of Cephalopods; mantle length to be measured to lower cm.
3.5 Measurement types for deep-water species
The majority of species encountered during the deep-water surveys are measured to the centimetre below using total length as the length qualifier (TL; see diagram directly above). There are however some exceptions. As a result of the great variety of body shapes of deep-water fish species and the fragility of their tails and fins some species are not measured to total length. Listed below are the respective taxa with details of the length measurements to be collected for each. Historically these species, if caught, may not have been measured to this protocol and care should be taken if using data for these species.
36 | Series of ICES Survey Protocols SISP - IBTS VIII
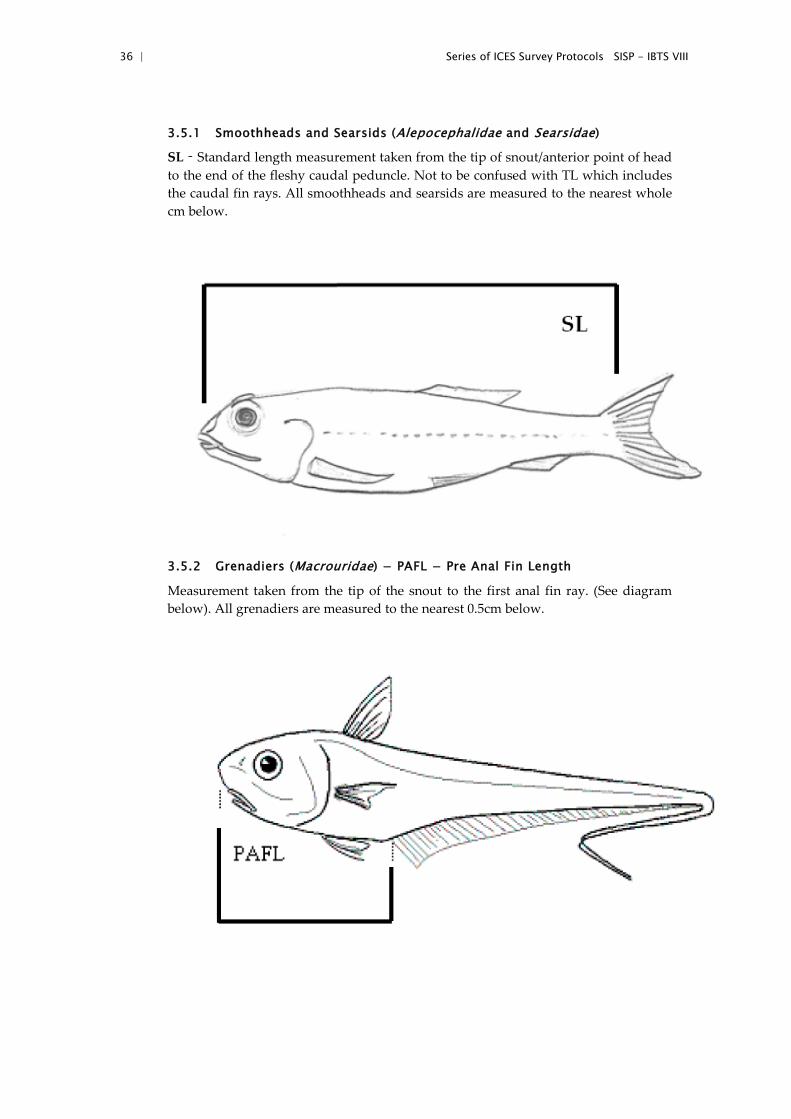
3.5.1 Smoothheads and Searsids (Alepocephalidae and Searsidae)
SL‐Standard length measurement taken from the tip of snout/anterior point of head to the end of the fleshy caudal peduncle. Not to be confused with TL which includes the caudal fin rays. All smoothheads and searsids are measured to the nearest whole cm below.
3.5.2 Grenadiers (Macrouridae) − PAFL − Pre Anal Fin Length
Measurement taken from the tip of the snout to the first anal fin ray. (See diagram below). All grenadiers are measured to the nearest 0.5cm below.
Series of ICES Survey Protocols SISP - IBTS VIII | 37
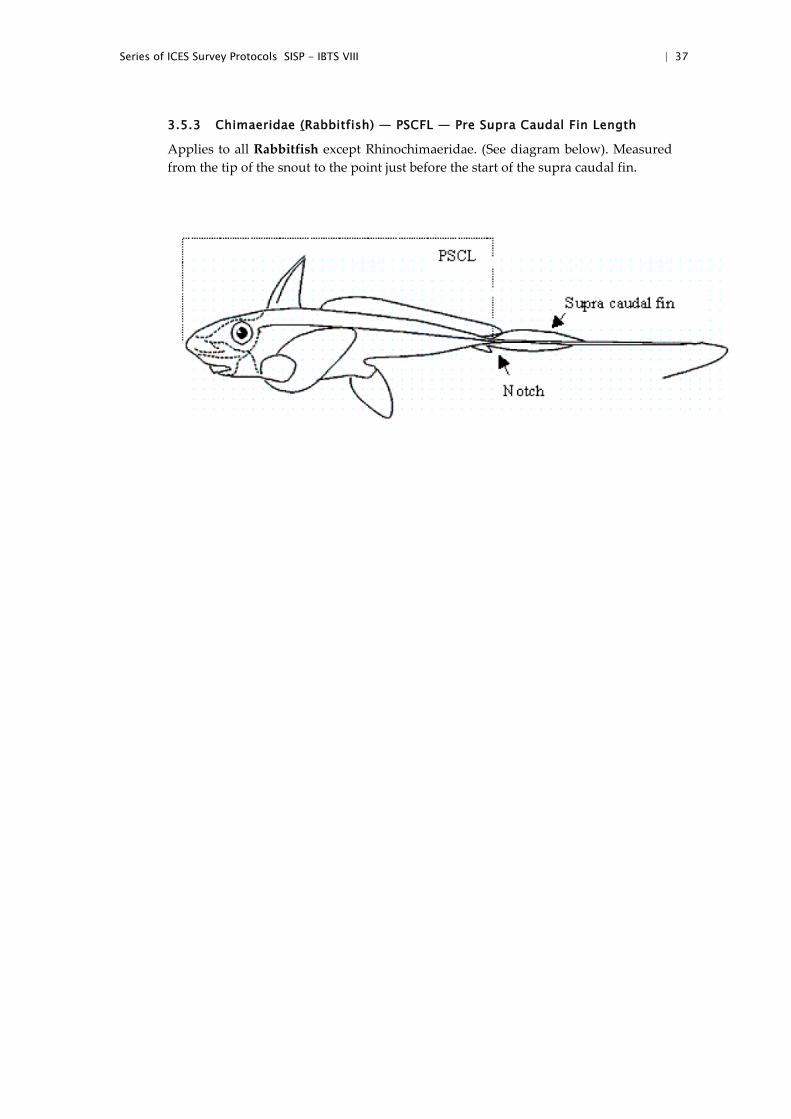
3.5.3 Chimaeridae (Rabbitfish) — PSCFL — Pre Supra Caudal Fin Length
Applies to all Rabbitfish except Rhinochimaeridae. (See diagram below). Measured from the tip of the snout to the point just before the start of the supra caudal fin.
38 | Series of ICES Survey Protocols SISP - IBTS VIII
4 MIK net
4.1 Q1 sampling
The MIK net is midwater ring trawl and is the standard gear for the sampling of fish larvae during the International Bottom Trawl Survey in the first quarter.
A separate manual on all procedures and protocols regarding the MIK sampling on quarter 1 IBTS surveys has been developed. This is available on the ICES webpage.
5 Environmental data
Either before or after each haul with the GOV trawl, the following minimum hydro-graphical data are collected:
• surface temperature • bottom temperature • surface salinity • bottom salinity
When using a CTD-probe for measuring temperature and salinity, an appropriate calibration should be undertaken.
Participants are recommended to collect nutrient samples during the International Bottom Trawl Survey in the first quarter. For further specifications they should contact the ICES Data Centre.
Since 1992 the following additional environmental data are sought:
• surface current direction • surface current speed • bottom current direction • bottom current speed • wind direction • windspeed • swell direction • swell height
The above parameters should be reported in the ‘Haul Information file HH’ (Annex 9).
Series of ICES Survey Protocols SISP - IBTS VIII | 39
6 Exchange specifications for IBTS data
Three distinct types of computer records have been defined for standard storage of the IBTS data:
Type 1: HH – Record with detailed haul information (Annex 10)
Type 2: HL – Length frequency data (Annex 11)
Type 3: CA – Sex-maturity-age–length keys (SMALK; Annex 12)
The summaries of the formats of these record types are given in the appendices given above, and detailed descriptions can also be found at the ICES web page: http://www.ices.dk/datacentre/datsu/selrep.asp.
Provisional data obtained from the North Sea and Skagerrak/Kattegat should be submitted to the quarterly coordinator as soon as possible after completion of the cruise. Annex 13 lists the sampling areas and standard areas for the calculation of abundance indices (using Figures 6.1 to 6.5 for guidance) and Annex 14 lists the length splits for the various target species. Final data should only be submitted to the ICES Data Centre after the national institute has checked the data using official checking programs issued by ICES.
NB: Details of environmental data should be submitted to the ICES Data Centre according to established procedures. The national hydrographic station number must be reported in Record Type 1 to allow the link to be made between haul data and environmental data.
40 | Series of ICES Survey Protocols SISP - IBTS VIII
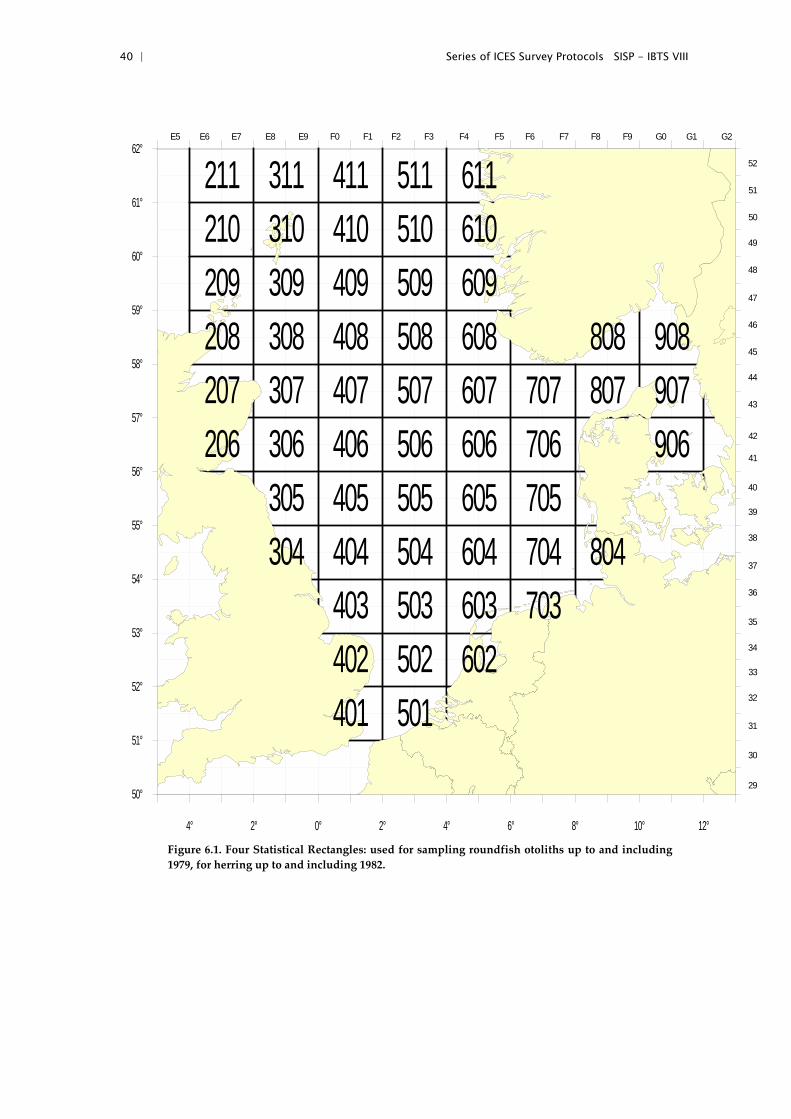
Figure 6.1. Four Statistical Rectangles: used for sampling roundfish otoliths up to and including 1979, for herring up to and including 1982.
4° 2° 0° 2° 4° 6° 8° 10° 12°
50°
51°
52°
53°
54°
55°
56°
57°
58°
59°
60°
61°
62°
211210209208207206
311310309308307306305304
411410409408407406405404403402401
511510509508507506505504503502501
611610609608607606605604603602
707706705704703
808807
804
908907906
29
30
31
32
33
34
35
36
37
38
39
40
41
42
43
44
45
46
47
48
49
50
51
52
E5 E6 E7 E8 E9 F0 F1 F2 F3 F4 F5 F6 F7 F8 F9 G0 G1 G2
Series of ICES Survey Protocols SISP - IBTS VIII | 41
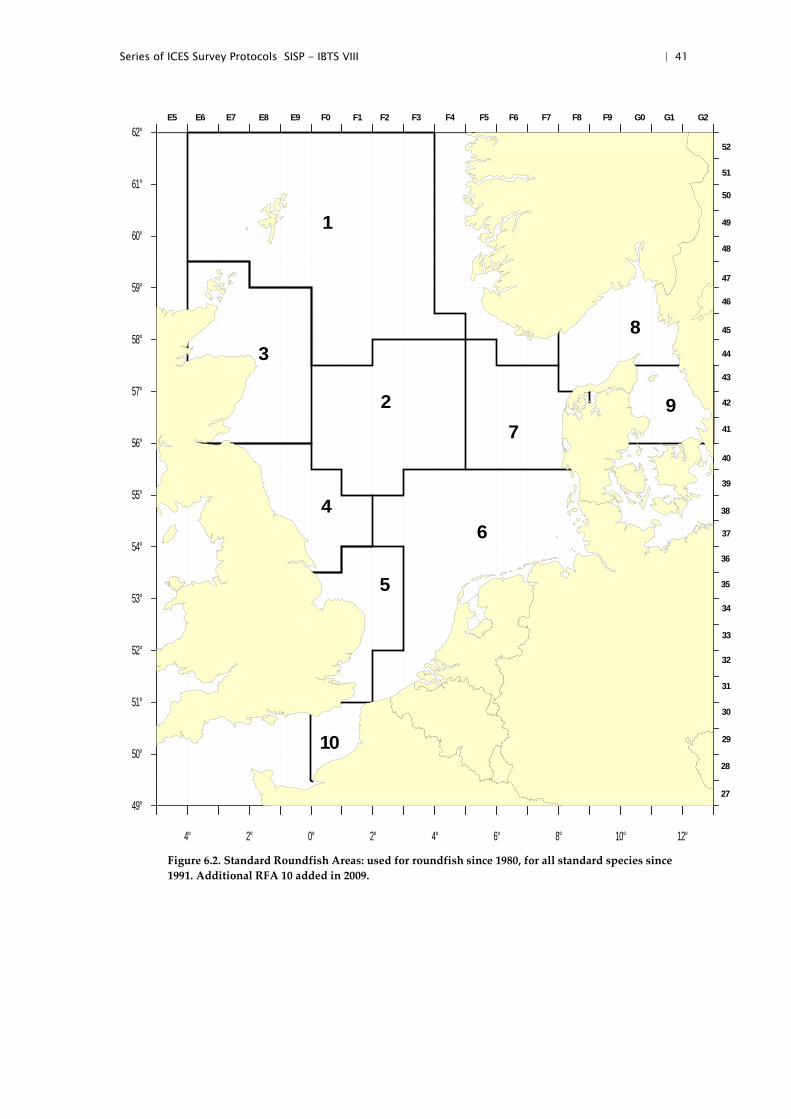
Figure 6.2. Standard Roundfish Areas: used for roundfish since 1980, for all standard species since 1991. Additional RFA 10 added in 2009.
4° 2° 0° 2° 4° 6° 8° 10° 12°
49°
50°
51°
52°
53°
54°
55°
56°
57°
58°
59°
60°
61°
62°
29
30
31
32
33
34
35
36
37
38
39
40
41
42
43
44
45
46
47
48
49
50
51
52
E5 E6 E7 E8 E9 F0 F1 F2 F3 F4 F5 F6 F7 F8 F9 G0 G1 G2
1
3
2
4
5
6
7
8
9
1028
27
42 | Series of ICES Survey Protocols SISP - IBTS VIII
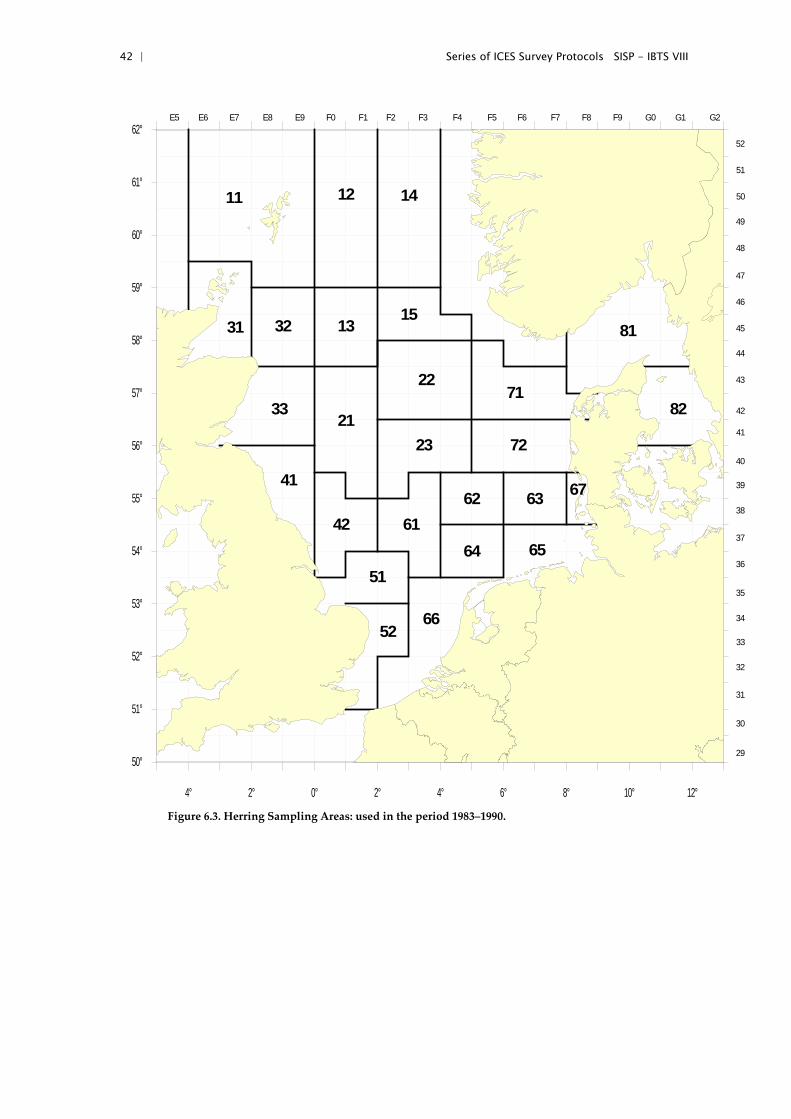
Figure 6.3. Herring Sampling Areas: used in the period 1983–1990.
4° 2° 0° 2° 4° 6° 8° 10° 12°
50°
51°
52°
53°
54°
55°
56°
57°
58°
59°
60°
61°
62°
29
30
31
32
33
34
35
36
37
38
39
40
41
42
43
44
45
46
47
48
49
50
51
52
E5 E6 E7 E8 E9 F0 F1 F2 F3 F4 F5 F6 F7 F8 F9 G0 G1 G2
11 12 14
31 32 1315
81
8271
22
2133
41
42 6162 63 67
656451
5266
23 72
Series of ICES Survey Protocols SISP - IBTS VIII | 43
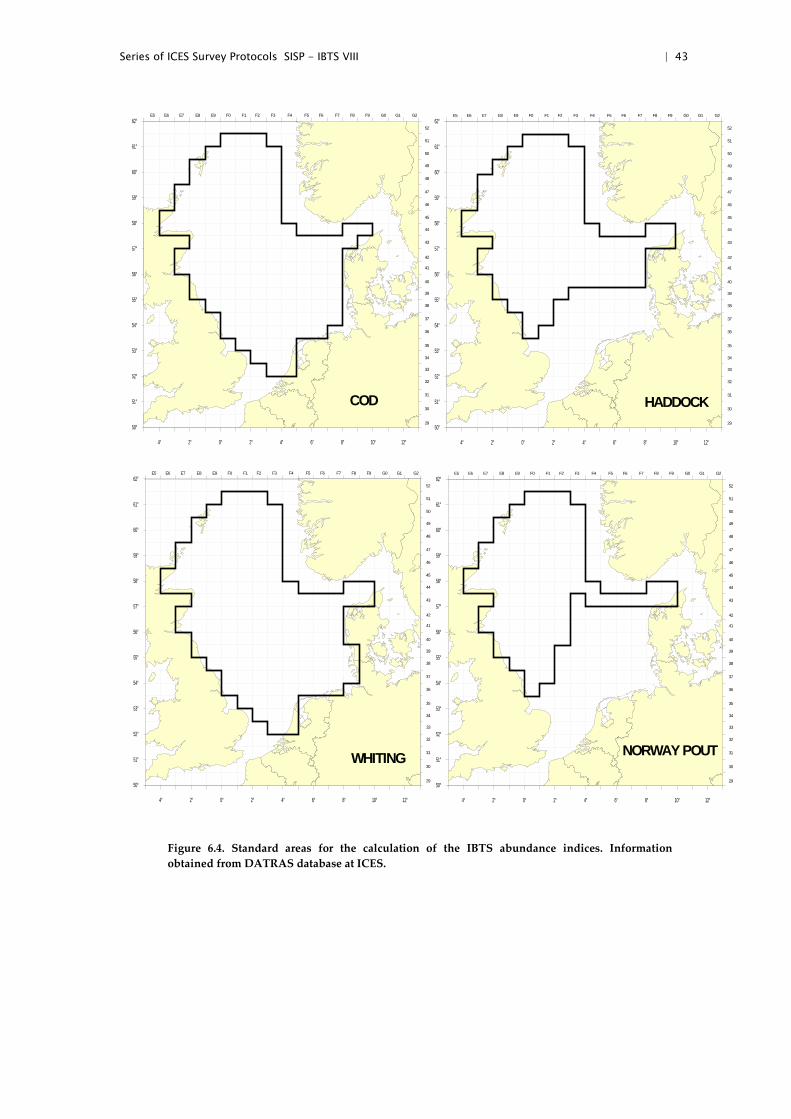
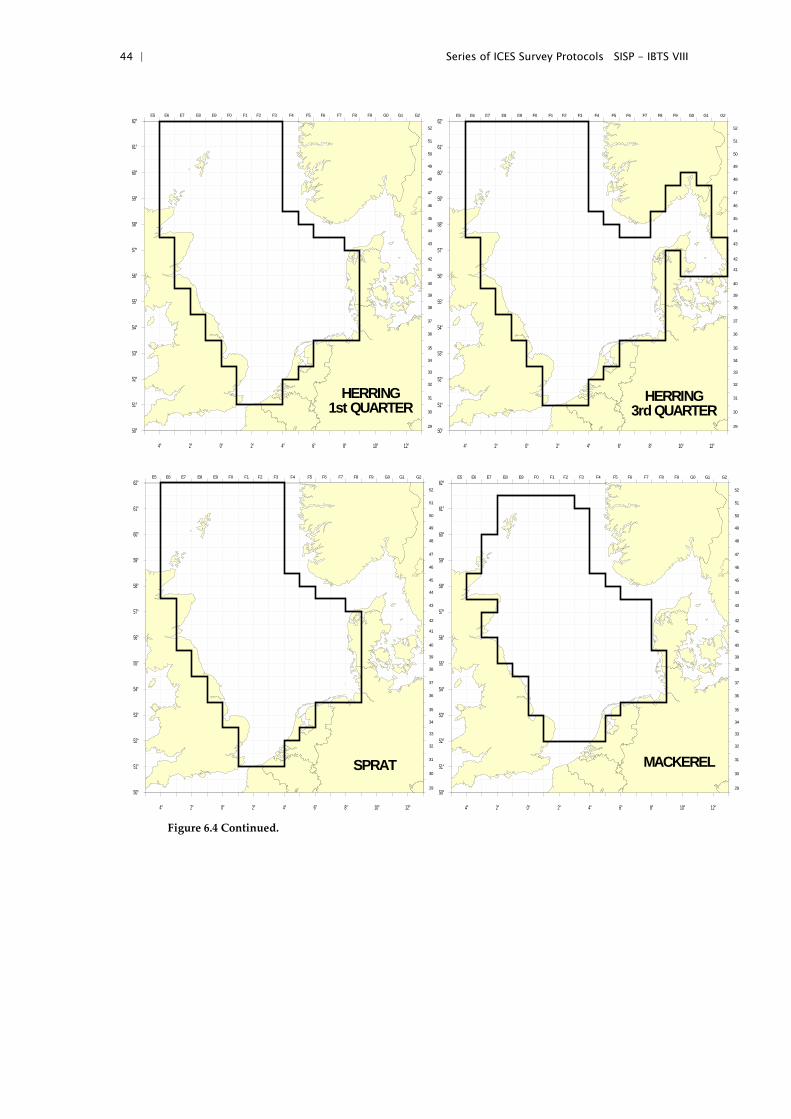
Figure 6.4. Standard areas for the calculation of the IBTS abundance indices. Information obtained from DATRAS database at ICES.
4° 2° 0° 2° 4° 6° 8° 10° 12°
50°
51°
52°
53°
54°
55°
56°
57°
58°
59°
60°
61°
62°
29
30
31
32
33
34
35
36
37
38
39
40
41
42
43
44
45
46
47
48
49
50
51
52
E5 E6 E7 E8 E9 F0 F1 F2 F3 F4 F5 F6 F7 F8 F9 G0 G1 G2
COD
4° 2° 0° 2° 4° 6° 8° 10° 12°
50°
51°
52°
53°
54°
55°
56°
57°
58°
59°
60°
61°
62°
29
30
31
32
33
34
35
36
37
38
39
40
41
42
43
44
45
46
47
48
49
50
51
52
E5 E6 E7 E8 E9 F0 F1 F2 F3 F4 F5 F6 F7 F8 F9 G0 G1 G2
HADDOCK
4° 2° 0° 2° 4° 6° 8° 10° 12°
50°
51°
52°
53°
54°
55°
56°
57°
58°
59°
60°
61°
62°
29
30
31
32
33
34
35
36
37
38
39
40
41
42
43
44
45
46
47
48
49
50
51
52
E5 E6 E7 E8 E9 F0 F1 F2 F3 F4 F5 F6 F7 F8 F9 G0 G1 G2
WHITING
4° 2° 0° 2° 4° 6° 8° 10° 12°
50°
51°
52°
53°
54°
55°
56°
57°
58°
59°
60°
61°
62°
29
30
31
32
33
34
35
36
37
38
39
40
41
42
43
44
45
46
47
48
49
50
51
52
E5 E6 E7 E8 E9 F0 F1 F2 F3 F4 F5 F6 F7 F8 F9 G0 G1 G2
NORWAY POUT
44 | Series of ICES Survey Protocols SISP - IBTS VIII
Figure 6.4 Continued.
4° 2° 0° 2° 4° 6° 8° 10° 12°
50°
51°
52°
53°
54°
55°
56°
57°
58°
59°
60°
61°
62°
29
30
31
32
33
34
35
36
37
38
39
40
41
42
43
44
45
46
47
48
49
50
51
52
E5 E6 E7 E8 E9 F0 F1 F2 F3 F4 F5 F6 F7 F8 F9 G0 G1 G2
HERRING1st QUARTER
4° 2° 0° 2° 4° 6° 8° 10° 12°
50°
51°
52°
53°
54°
55°
56°
57°
58°
59°
60°
61°
62°
29
30
31
32
33
34
35
36
37
38
39
40
41
42
43
44
45
46
47
48
49
50
51
52
E5 E6 E7 E8 E9 F0 F1 F2 F3 F4 F5 F6 F7 F8 F9 G0 G1 G2
HERRING3rd QUARTER
4° 2° 0° 2° 4° 6° 8° 10° 12°
50°
51°
52°
53°
54°
55°
56°
57°
58°
59°
60°
61°
62°
29
30
31
32
33
34
35
36
37
38
39
40
41
42
43
44
45
46
47
48
49
50
51
52
E5 E6 E7 E8 E9 F0 F1 F2 F3 F4 F5 F6 F7 F8 F9 G0 G1 G2
SPRAT
4° 2° 0° 2° 4° 6° 8° 10° 12°
50°
51°
52°
53°
54°
55°
56°
57°
58°
59°
60°
61°
62°
29
30
31
32
33
34
35
36
37
38
39
40
41
42
43
44
45
46
47
48
49
50
51
52
E5 E6 E7 E8 E9 F0 F1 F2 F3 F4 F5 F6 F7 F8 F9 G0 G1 G2
MACKEREL
Series of ICES Survey Protocols SISP - IBTS VIII | 45
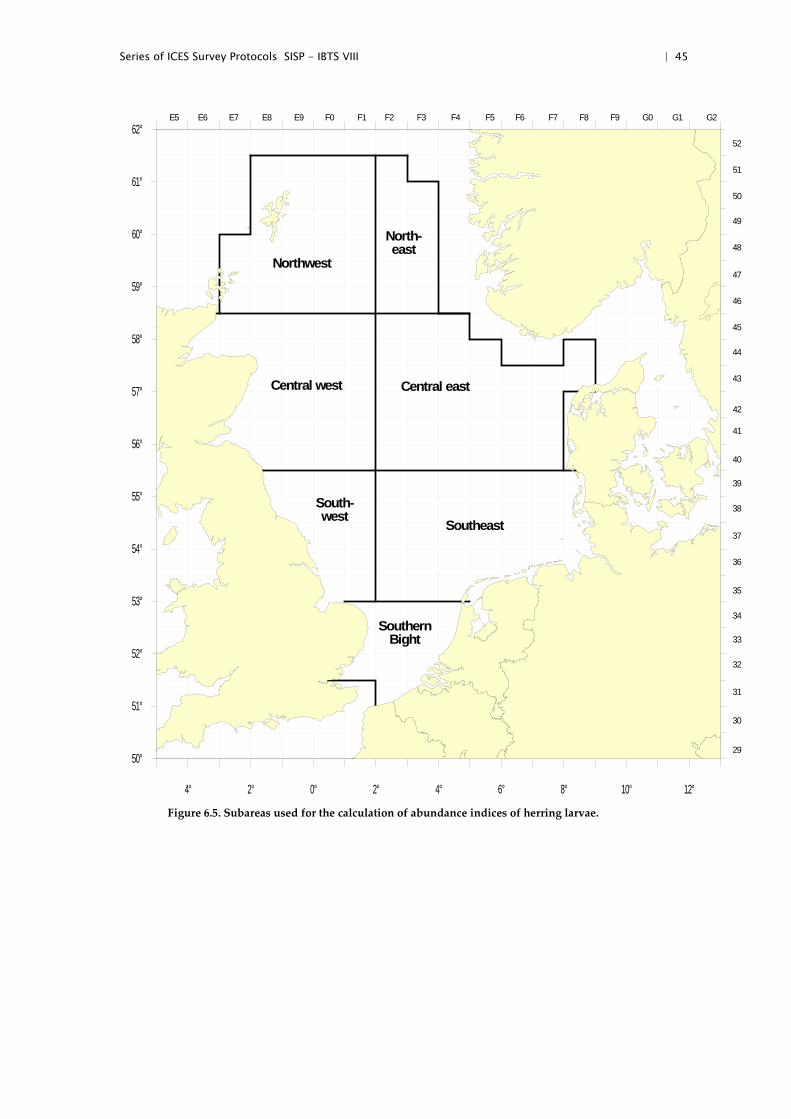
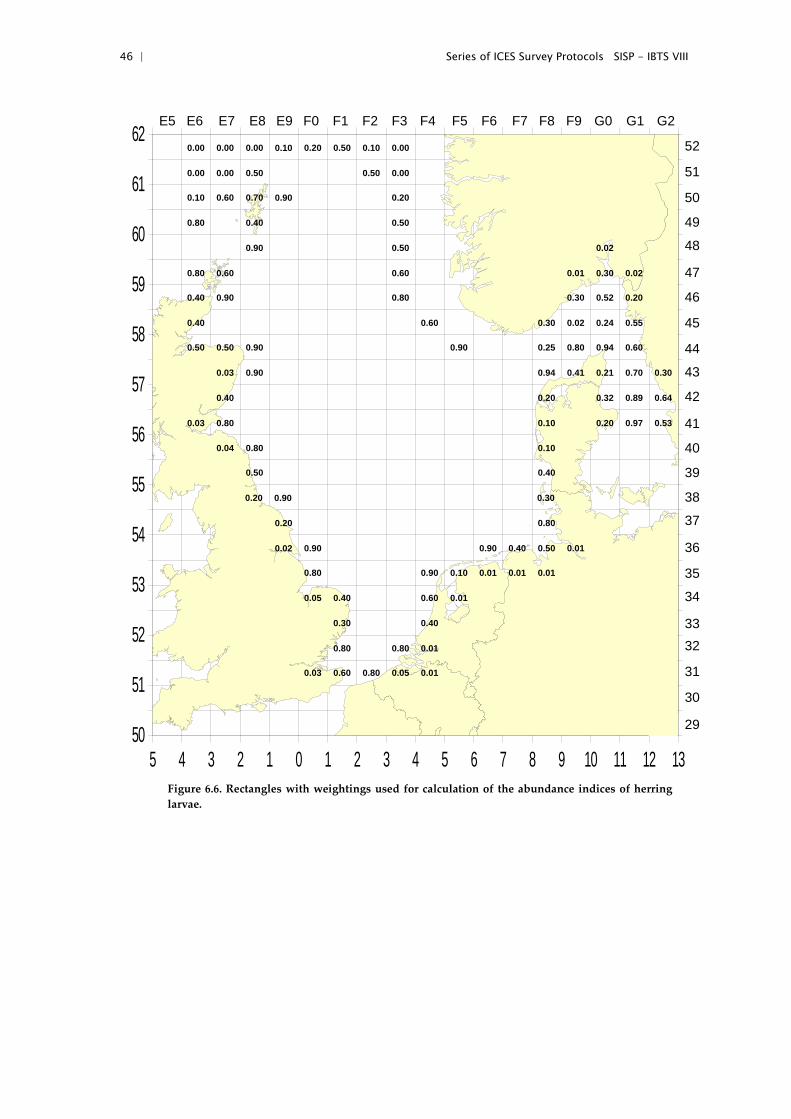
Figure 6.5. Subareas used for the calculation of abundance indices of herring larvae.
4° 2° 0° 2° 4° 6° 8° 10° 12°
50°
51°
52°
53°
54°
55°
56°
57°
58°
59°
60°
61°
62°
29
30
31
32
33
34
35
36
37
38
39
40
41
42
43
44
45
46
47
48
49
50
51
52
E5 E6 E7 E8 E9 F0 F1 F2 F3 F4 F5 F6 F7 F8 F9 G0 G1 G2
SouthernBight
SoutheastSouth-west
Central west Central east
North-east
Northwest
46 | Series of ICES Survey Protocols SISP - IBTS VIII
Figure 6.6. Rectangles with weightings used for calculation of the abundance indices of herring larvae.
5 4 3 2 1 0 1 2 3 4 5 6 7 8 9 10 11 12 1350
51
52
53
54
55
56
57
58
59
60
61
62
29
30
31
3233
34
35
36
37
38
39
40
41
42
43
44
45
46
47
48
49
50
51
52
E5 E6 E7 E8 E9 F0 F1 F2 F3 F4 F5 F6 F7 F8 F9 G0 G1 G2
0.03 0.60 0.80 0.05 0.01
0.80 0.80 0.01
0.30 0.40
0.05 0.40 0.60 0.01
0.80 0.90 0.10 0.01 0.01 0.01
0.02 0.90 0.90 0.40 0.50 0.01
0.20 0.80
0.40 0.60 0.30 0.02 0.24 0.55
0.900.40 0.80 0.30 0.52 0.20
0.600.80 0.60 0.01 0.30 0.02
0.90 0.50 0.02
0.400.80 0.50
0.900.700.600.10 0.20
0.500.000.00 0.50 0.00
0.10 0.200.000.000.00 0.50 0.10 0.00
0.900.20 0.30
0.50 0.40
0.800.04 0.10
0.800.03 0.10 0.20 0.97 0.53
0.40 0.20 0.32 0.89 0.64
0.900.03 0.94 0.41 0.21 0.70 0.30
0.900.500.50 0.90 0.25 0.80 0.94 0.60
Series of ICES Survey Protocols SISP - IBTS VIII | 47
7 References
Heessen, H., Dalskov, J., Cook, R. M. 1977. The International Bottom Trawl survey in the North Sea, the Skagerrak and Kattegat. ICES, Copenhagen (Denmark). ICES CM 1997/Y:31, 25 p.
ICES. 1963. International Young Herring Surveys. Report of Working Group meeting in IJmuiden, 26–27 March, 1963. ICES CM 1963/Herring Cttee: 101.
ICES. 1974. Report of the Working Group on North Sea Young Herring Surveys. ICES CM 1974/H:6.
ICES. 1977. Report of the Working Group on North Sea Young Herring Surveys. ICES CM 1977/H:11.
ICES. 1981. Report of the Joint meeting of the International Young Herring Survey. Working Group and the International Gadoid Survey Working Group. IJmuiden, 12–14 May, 1981. ICES CM 1981/H:10.
ICES. 1990. Report of the International North Sea, Skagerrak, and Kattegat Bottom Trawl Survey Working Group. ICES CM 1990/H:3.
ICES. 1992. Report of the International Bottom Trawl Survey Working Group. ICES CM 1992/H:3. 21 pp.
ICES. 1996. Report of the International Bottom Trawl Survey Working Group. ICES CM 1996/H:1.
ICES. 2002. Report of the International Bottom Trawl Survey Working Group. ICES CM 2002/D: 03.
ICES. 2012. Report of the Workshop on Sexual Maturity Staging of sole, plaice, dab and flounder, ICES CM 2012/ACOM:50.
48 | Series of ICES Survey Protocols SISP - IBTS VIII
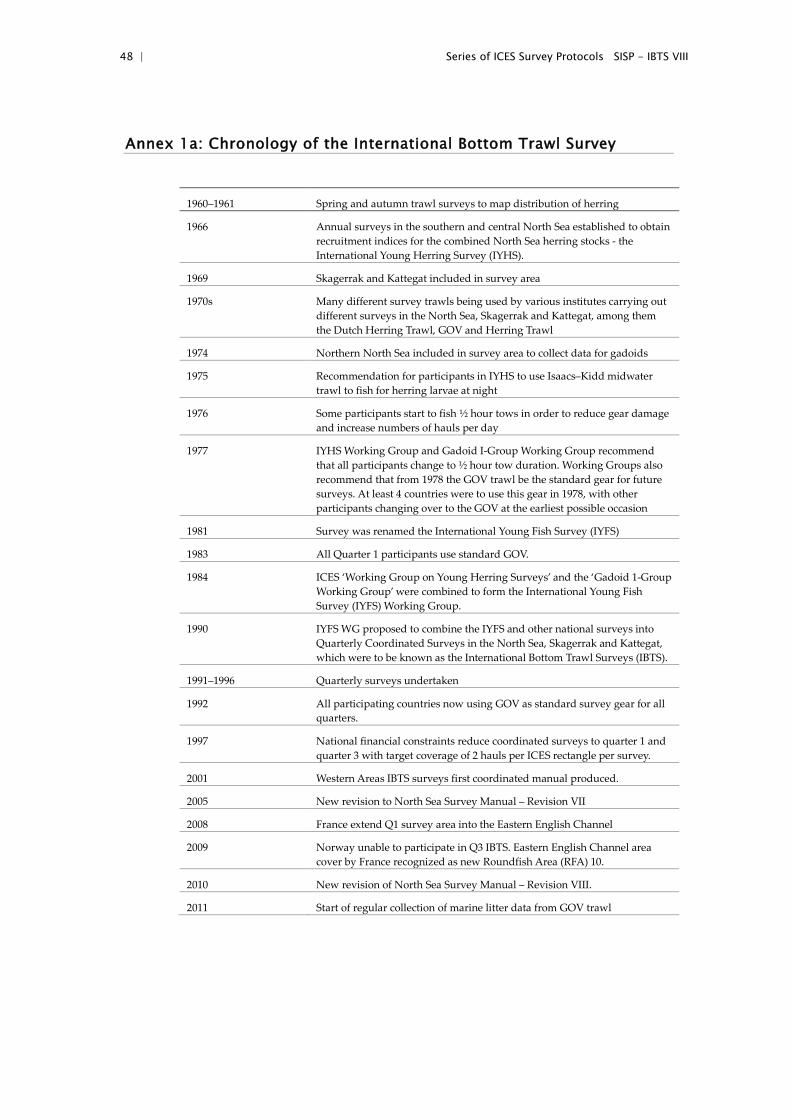
Annex 1a: Chronology of the International Bottom Trawl Survey
1960–1961 Spring and autumn trawl surveys to map distribution of herring
1966 Annual surveys in the southern and central North Sea established to obtain recruitment indices for the combined North Sea herring stocks - the International Young Herring Survey (IYHS).
1969 Skagerrak and Kattegat included in survey area
1970s Many different survey trawls being used by various institutes carrying out different surveys in the North Sea, Skagerrak and Kattegat, among them the Dutch Herring Trawl, GOV and Herring Trawl
1974 Northern North Sea included in survey area to collect data for gadoids
1975 Recommendation for participants in IYHS to use Isaacs–Kidd midwater trawl to fish for herring larvae at night
1976 Some participants start to fish ½ hour tows in order to reduce gear damage and increase numbers of hauls per day
1977 IYHS Working Group and Gadoid I-Group Working Group recommend that all participants change to ½ hour tow duration. Working Groups also recommend that from 1978 the GOV trawl be the standard gear for future surveys. At least 4 countries were to use this gear in 1978, with other participants changing over to the GOV at the earliest possible occasion
1981 Survey was renamed the International Young Fish Survey (IYFS)
1983 All Quarter 1 participants use standard GOV.
1984 ICES ‘Working Group on Young Herring Surveys’ and the ‘Gadoid 1-Group Working Group’ were combined to form the International Young Fish Survey (IYFS) Working Group.
1990 IYFS WG proposed to combine the IYFS and other national surveys into Quarterly Coordinated Surveys in the North Sea, Skagerrak and Kattegat, which were to be known as the International Bottom Trawl Surveys (IBTS).
1991–1996 Quarterly surveys undertaken
1992 All participating countries now using GOV as standard survey gear for all quarters.
1997 National financial constraints reduce coordinated surveys to quarter 1 and quarter 3 with target coverage of 2 hauls per ICES rectangle per survey.
2001 Western Areas IBTS surveys first coordinated manual produced.
2005 New revision to North Sea Survey Manual – Revision VII
2008 France extend Q1 survey area into the Eastern English Channel
2009 Norway unable to participate in Q3 IBTS. Eastern English Channel area cover by France recognized as new Roundfish Area (RFA) 10.
2010 New revision of North Sea Survey Manual – Revision VIII.
2011 Start of regular collection of marine litter data from GOV trawl
Series of ICES Survey Protocols SISP - IBTS VIII | 49
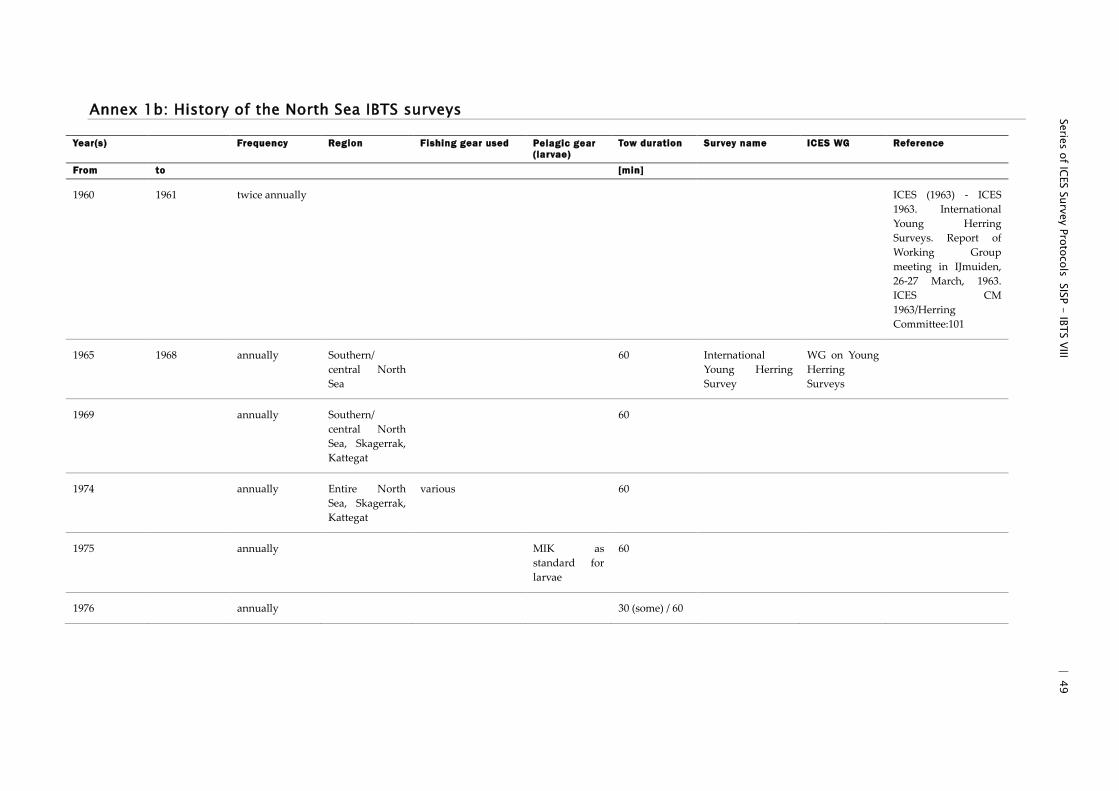
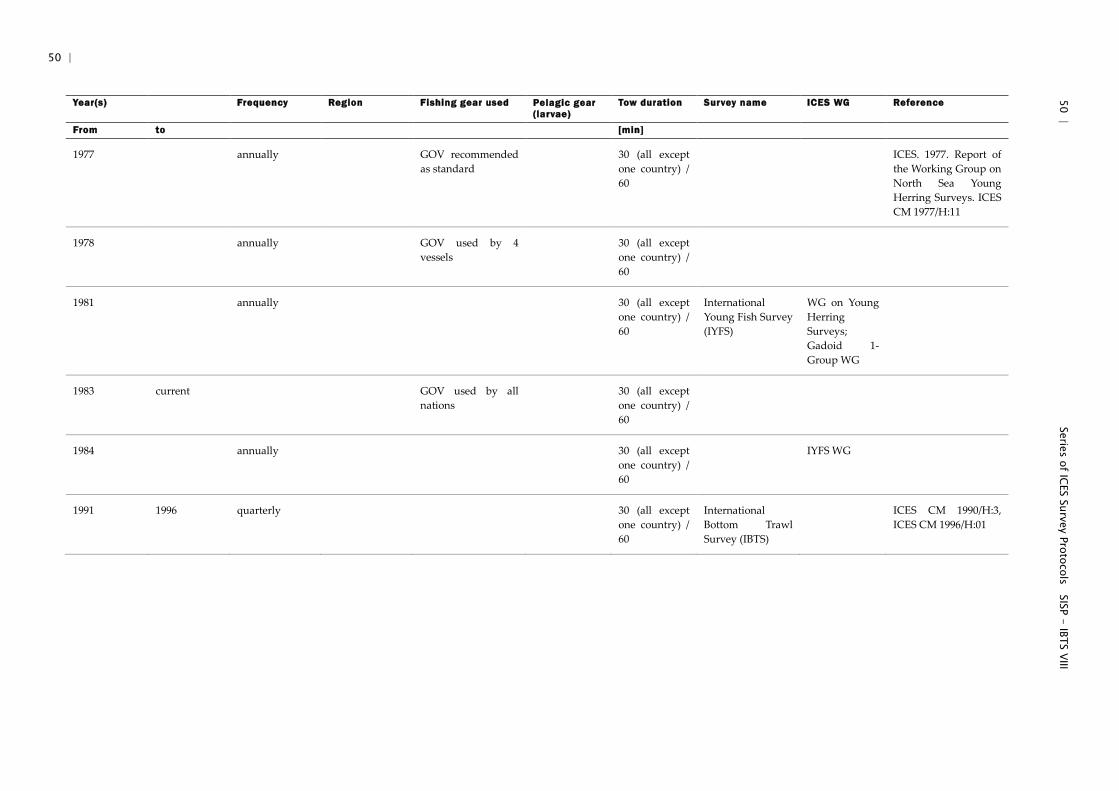
Annex 1b: History of the North Sea IBTS surveys
Year(s) Frequency Region Fishing gear used Pelagic gear (larvae)
Tow duration Survey name ICES WG Reference
From to [min]
1960 1961 twice annually ICES (1963) - ICES 1963. International Young Herring Surveys. Report of Working Group meeting in IJmuiden, 26-27 March, 1963. ICES CM 1963/Herring Committee:101
1965 1968 annually Southern/ central North Sea
60 International Young Herring Survey
WG on Young Herring Surveys
1969 annually Southern/ central North Sea, Skagerrak, Kattegat
60
1974 annually Entire North Sea, Skagerrak, Kattegat
various 60
1975 annually MIK as standard for larvae
60
1976 annually 30 (some) / 60
50 |
50 | Series of ICES Survey Protocols SISP - IBTS VIII
Year(s) Frequency Region Fishing gear used Pelagic gear (larvae)
Tow duration Survey name ICES WG Reference
From to [min]
1977 annually GOV recommended as standard
30 (all except one country) / 60
ICES. 1977. Report of the Working Group on North Sea Young Herring Surveys. ICES CM 1977/H:11
1978 annually GOV used by 4 vessels
30 (all except one country) / 60
1981 annually 30 (all except one country) / 60
International Young Fish Survey (IYFS)
WG on Young Herring Surveys; Gadoid 1-Group WG
1983 current GOV used by all nations
30 (all except one country) / 60
1984 annually 30 (all except one country) / 60
IYFS WG
1991 1996 quarterly 30 (all except one country) / 60
International Bottom Trawl Survey (IBTS)
ICES CM 1990/H:3, ICES CM 1996/H:01
Series of ICES Survey Protocols SISP - IBTS VIII | 51
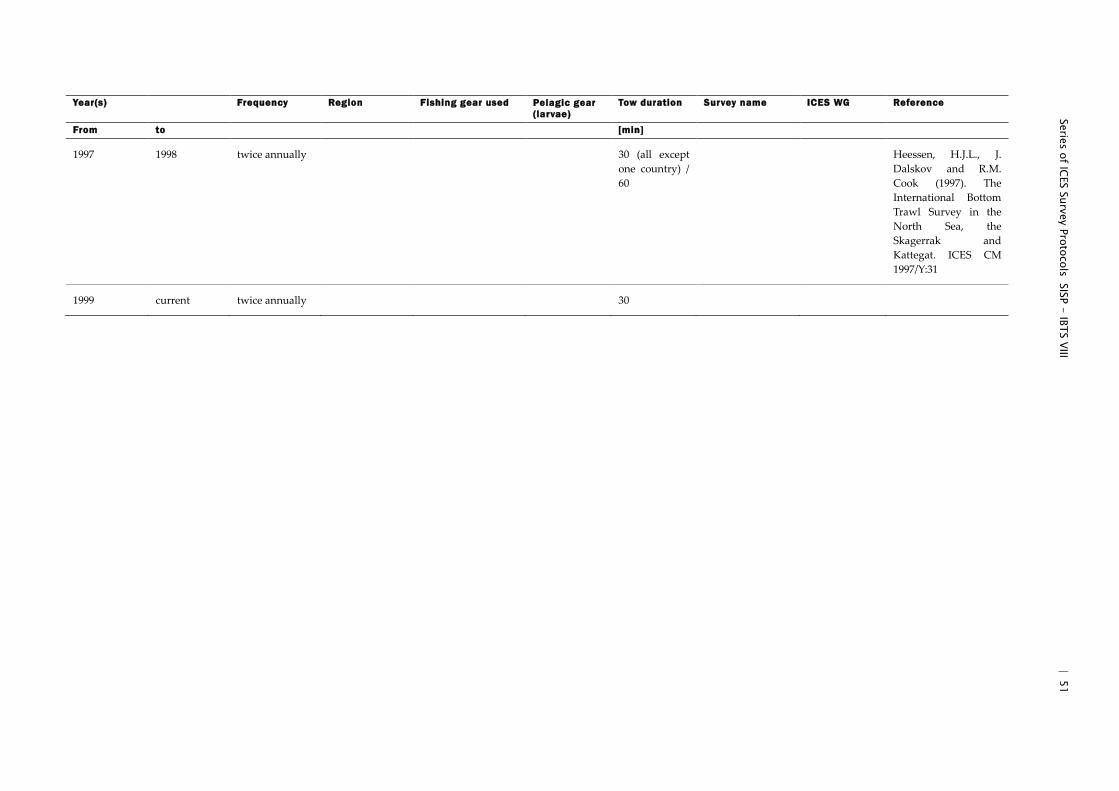
Year(s) Frequency Region Fishing gear used Pelagic gear (larvae)
Tow duration Survey name ICES WG Reference
From to [min]
1997 1998 twice annually 30 (all except one country) / 60
Heessen, H.J.L., J. Dalskov and R.M. Cook (1997). The International Bottom Trawl Survey in the North Sea, the Skagerrak and Kattegat. ICES CM 1997/Y:31
1999 current twice annually 30
52 | Series of ICES Survey Protocols SISP - IBTS VIII
Annex 2: IBTS standard gear check sheet 1
Series of ICES Survey Protocols SISP - IBTS VIII | 53
Annex 3: IBTS standard gear check sheet 2
54 | Series of ICES Survey Protocols SISP - IBTS VIII
Annex 4: IBTS standard gear check sheet 3
Series of ICES Survey Protocols SISP - IBTS VIII | 55
Annex 5a: IBTS standard gear check sheet 4 – Groundgear A
56 | Series of ICES Survey Protocols SISP - IBTS VIII
Annex 5b: IBTS standard gear check sheet 4 – Groundgear B
Series of ICES Survey Protocols SISP - IBTS VIII | 57
Annex 6: Catch sampling summary for North Sea IBTS quarter 1 surveys
North Sea quarter 1
Denm
ark
Fran
ceG
erm
any
Neth
erla
nds
Norw
aySw
eden
UK(E
ng)
UK(S
cot)
Denm
ark
Fran
ceG
erm
any
Neth
erla
nds
Norw
aySw
eden
UK(E
ng)
UK(S
cot)
Staffing number available for catch processing 4 8/10 6/8 4 2/3 6/7 6/7 6 (1) Categories plaice y n n n n y nHauls Average number per day 3/4 4 4 4/5 3/4 5 3/4 4/5 by sex dab y n y n n y nCatch retention in hopper or bin y y y y y y y y elasmobranchs y y n y n y y
codend cleaned y y y y y y y (2) Measuring herring y y y y y y ynet cleaned y y n n y y y 0.5cm sprat y y y y y y ycleanings added to catch y y p p y y y pilchard y y y n n y n
Sorting 'deckmaster' in charge y y y y y y y y anchovie y y y n n y nsorting facility - bench or conveyor c c c c b c b b (2) Measuring commercial benthos n y n n n y ncomplete sort upto no. bstkts 10 20 40 40 10 3 40 50 mmsmall fish mixture sub sorting y y y y y y y y (3) Prescribed cod y y y y y y y ypart of the catch discarded unprocessed n n n n y n n species haddock y y y y y y y y
Categories by sex (1) n y y y n y y y whiting y y y y y y yby size large or small y y y y y y y saithe y y y y y y yby size multi modal y n n y y y y n Norway pout y y y y y y y y
Sub sample re-mix before selection y y y y n n y n herring y y y y y y y yselection random y y y y y y y y sprat y y y y n y y y
Weighing all catch components y y y n y y y y mackerel y y y y p y yall sub samples y y y y y y y y plaice y y y y n y y n
Measuring all fish species (2) y y y y n y y y (4) Other dab y y n n n y nminimum sample size 75 100 100 50 50 50 75 150 species brill y y n n n y ncommercial benthos y c n c n y y n turbot y y n n n y ncephalopods y c n c y y n n lemon sole y y n n n y nother benthos - weigh, count, observe n c o c n o o n anglers y n n n n y y
Biological prescribed species (3) y y y y y y y y elasmobranchs y y n n n y nsampling other species (4) y y n n n y y y
weight y y y y y y y ysex y y y y y y y ymaturity y y y y y y y yage material y y y y y y y yageing - at sea or ashore a a a a a a a s
Data station detail - electronic or paper/pencil e/p e e e/p e/p p p pcapture catch detail - electronic or paper/pencil p e p e e p e p
length detail - electronic or paper/pencil p p p e e p e pbiological detail - electronic or paper/pencil p p p p e p e perror checking y y y y y y y yback up y y y y y y y y
58 | Series of ICES Survey Protocols SISP - IBTS VIII
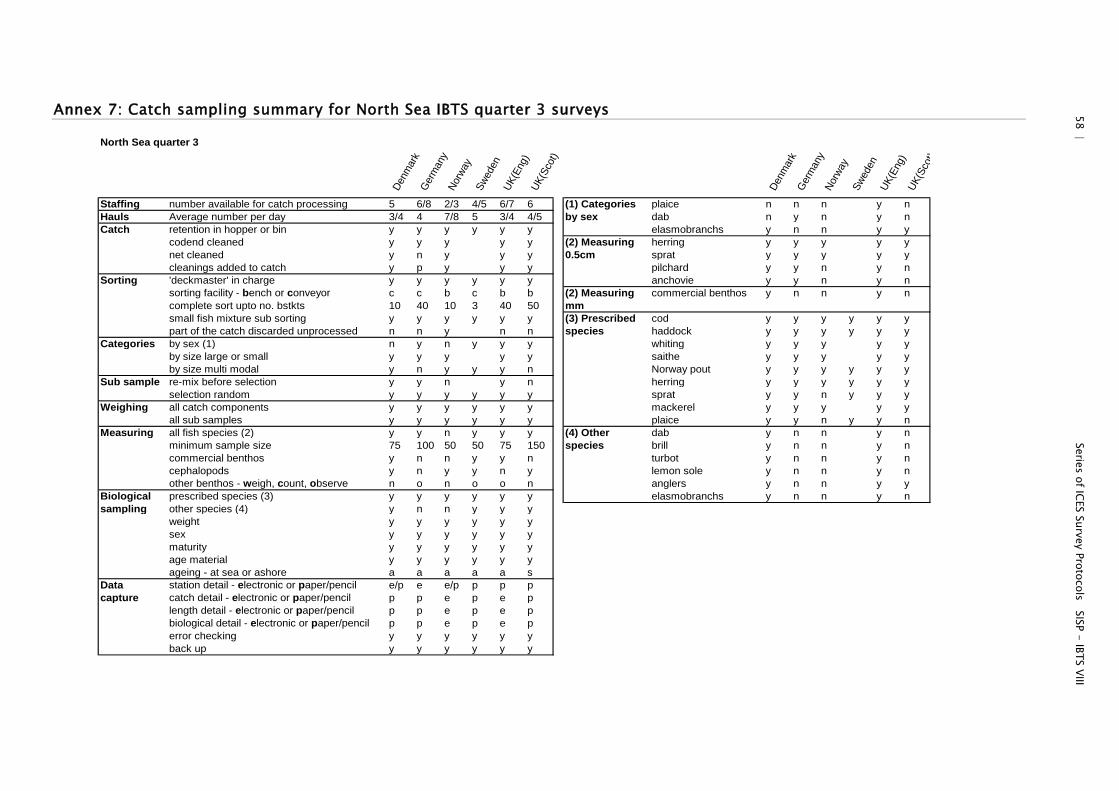
Annex 7: Catch sampling summary for North Sea IBTS quarter 3 surveys
North Sea quarter 3
Denm
ark
Germ
any
Norw
aySw
eden
UK(E
ng)
UK(S
cot)
Denm
ark
Germ
any
Norw
aySw
eden
UK(E
ng)
UK(S
cot)
Staffing number available for catch processing 5 6/8 2/3 4/5 6/7 6 (1) Categories plaice n n n y nHauls Average number per day 3/4 4 7/8 5 3/4 4/5 by sex dab n y n y nCatch retention in hopper or bin y y y y y y elasmobranchs y n n y y
codend cleaned y y y y y (2) Measuring herring y y y y ynet cleaned y n y y y 0.5cm sprat y y y y ycleanings added to catch y p y y y pilchard y y n y n
Sorting 'deckmaster' in charge y y y y y y anchovie y y n y nsorting facility - bench or conveyor c c b c b b (2) Measuring commercial benthos y n n y ncomplete sort upto no. bstkts 10 40 10 3 40 50 mmsmall fish mixture sub sorting y y y y y y (3) Prescribed cod y y y y y ypart of the catch discarded unprocessed n n y n n species haddock y y y y y y
Categories by sex (1) n y n y y y whiting y y y y yby size large or small y y y y y saithe y y y y yby size multi modal y n y y y n Norway pout y y y y y y
Sub sample re-mix before selection y y n y n herring y y y y y yselection random y y y y y y sprat y y n y y y
Weighing all catch components y y y y y y mackerel y y y y yall sub samples y y y y y y plaice y y n y y n
Measuring all fish species (2) y y n y y y (4) Other dab y n n y nminimum sample size 75 100 50 50 75 150 species brill y n n y ncommercial benthos y n n y y n turbot y n n y ncephalopods y n y y n y lemon sole y n n y nother benthos - weigh, count, observe n o n o o n anglers y n n y y
Biological prescribed species (3) y y y y y y elasmobranchs y n n y nsampling other species (4) y n n y y y
weight y y y y y ysex y y y y y ymaturity y y y y y yage material y y y y y yageing - at sea or ashore a a a a a s
Data station detail - electronic or paper/pencil e/p e e/p p p pcapture catch detail - electronic or paper/pencil p p e p e p
length detail - electronic or paper/pencil p p e p e pbiological detail - electronic or paper/pencil p p e p e perror checking y y y y y yback up y y y y y y
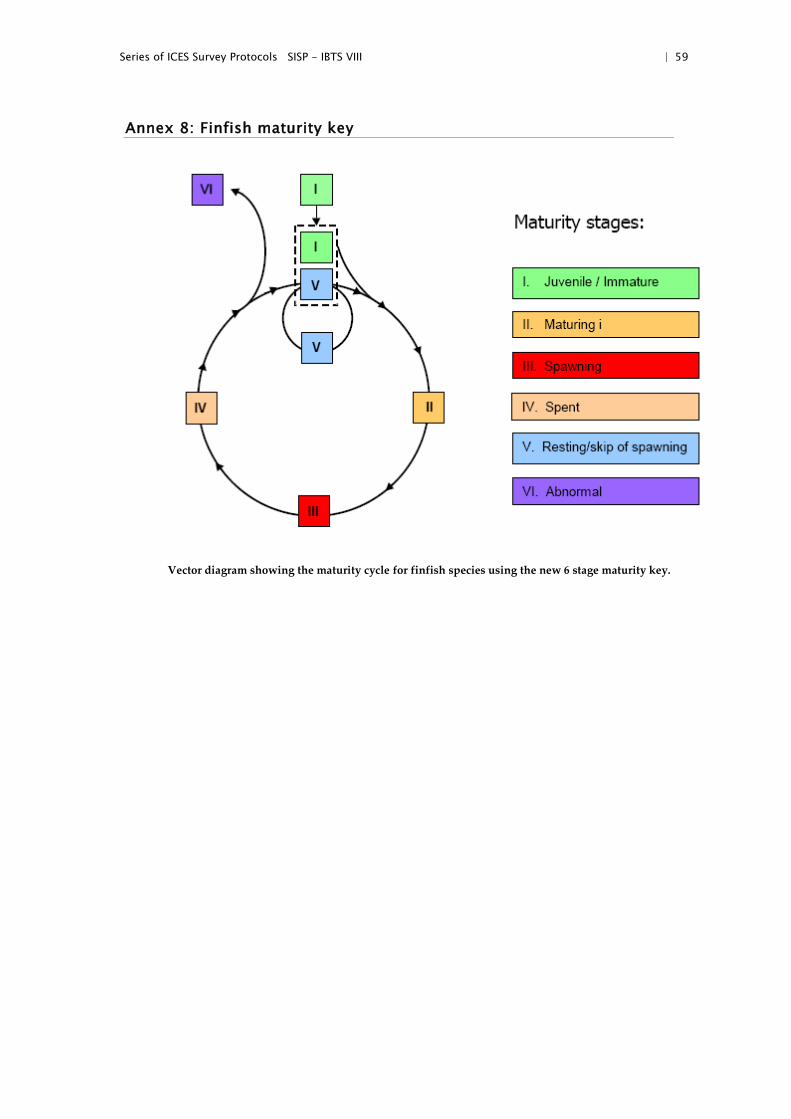
Series of ICES Survey Protocols SISP - IBTS VIII | 59
Annex 8: Finfish maturity key
Vector diagram showing the maturity cycle for finfish species using the new 6 stage maturity key.
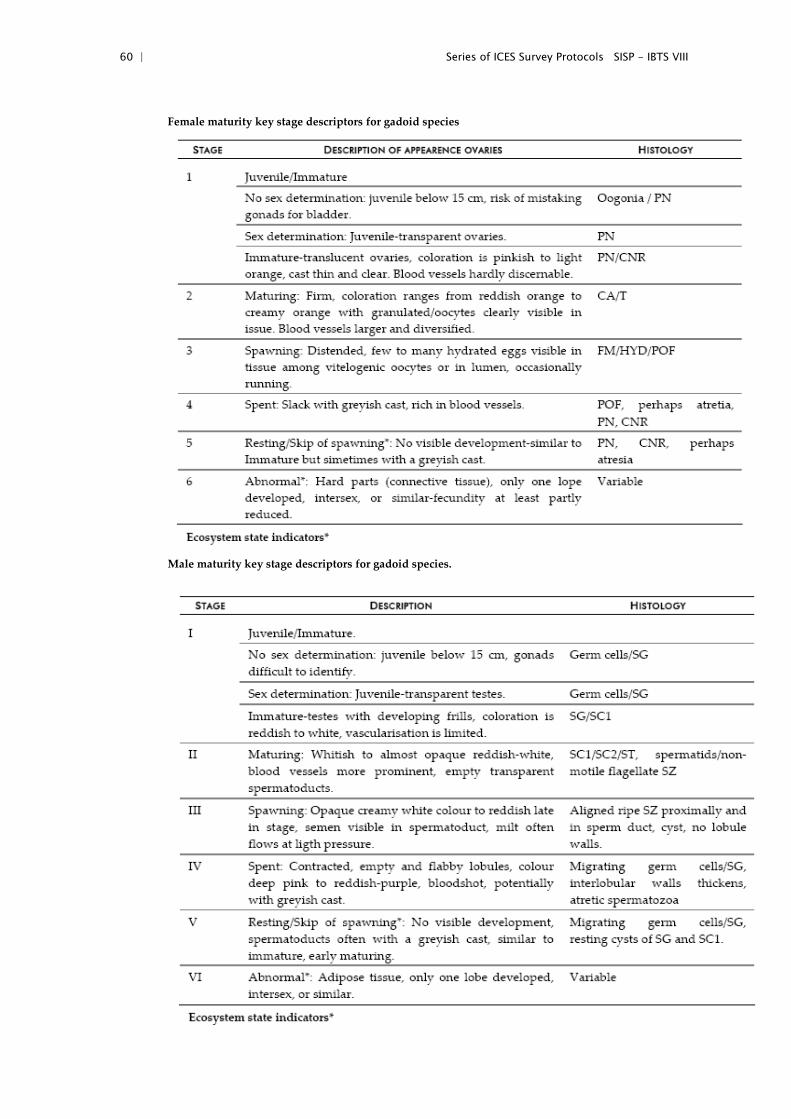
60 | Series of ICES Survey Protocols SISP - IBTS VIII
Female maturity key stage descriptors for gadoid species
Male maturity key stage descriptors for gadoid species.
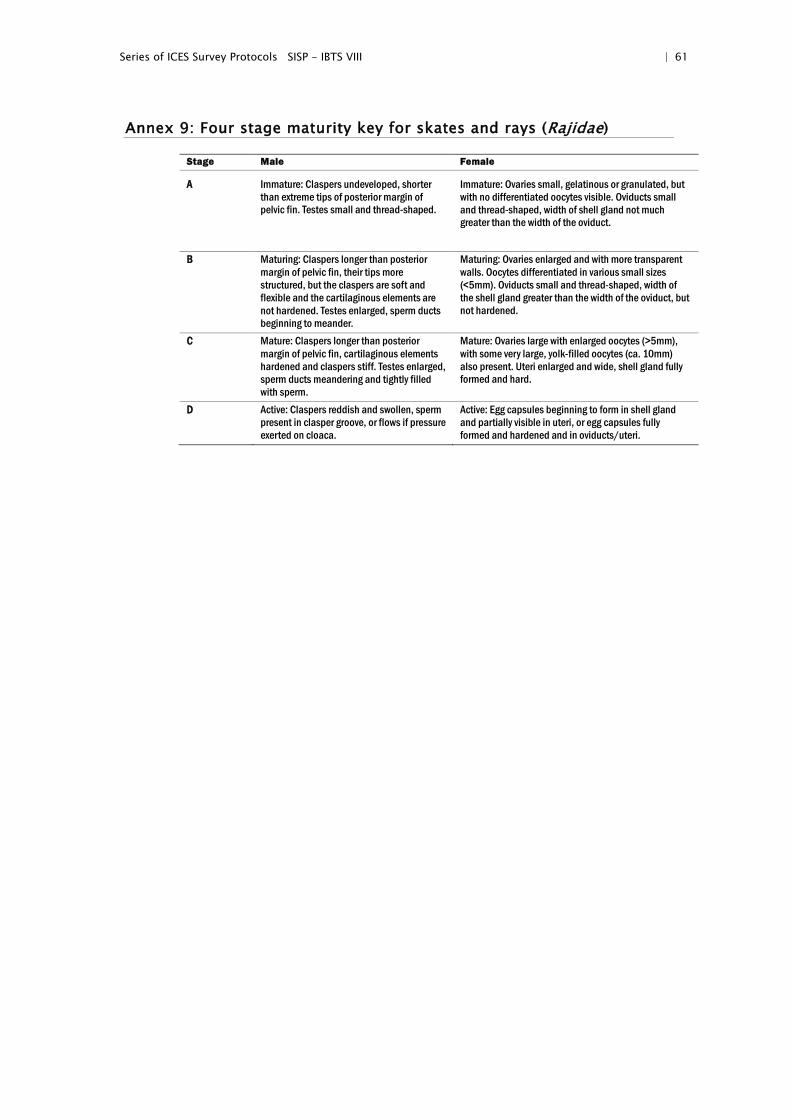
Series of ICES Survey Protocols SISP - IBTS VIII | 61
Annex 9: Four stage maturity key for skates and rays (Rajidae)
Stage Male Female
A Immature: Claspers undeveloped, shorter than extreme tips of posterior margin of pelvic fin. Testes small and thread-shaped.
Immature: Ovaries small, gelatinous or granulated, but with no differentiated oocytes visible. Oviducts small and thread-shaped, width of shell gland not much greater than the width of the oviduct.
B Maturing: Claspers longer than posterior margin of pelvic fin, their tips more structured, but the claspers are soft and flexible and the cartilaginous elements are not hardened. Testes enlarged, sperm ducts beginning to meander.
Maturing: Ovaries enlarged and with more transparent walls. Oocytes differentiated in various small sizes (<5mm). Oviducts small and thread-shaped, width of the shell gland greater than the width of the oviduct, but not hardened.
C Mature: Claspers longer than posterior margin of pelvic fin, cartilaginous elements hardened and claspers stiff. Testes enlarged, sperm ducts meandering and tightly filled with sperm.
Mature: Ovaries large with enlarged oocytes (>5mm), with some very large, yolk-filled oocytes (ca. 10mm) also present. Uteri enlarged and wide, shell gland fully formed and hard.
D Active: Claspers reddish and swollen, sperm present in clasper groove, or flows if pressure exerted on cloaca.
Active: Egg capsules beginning to form in shell gland and partially visible in uteri, or egg capsules fully formed and hardened and in oviducts/uteri.
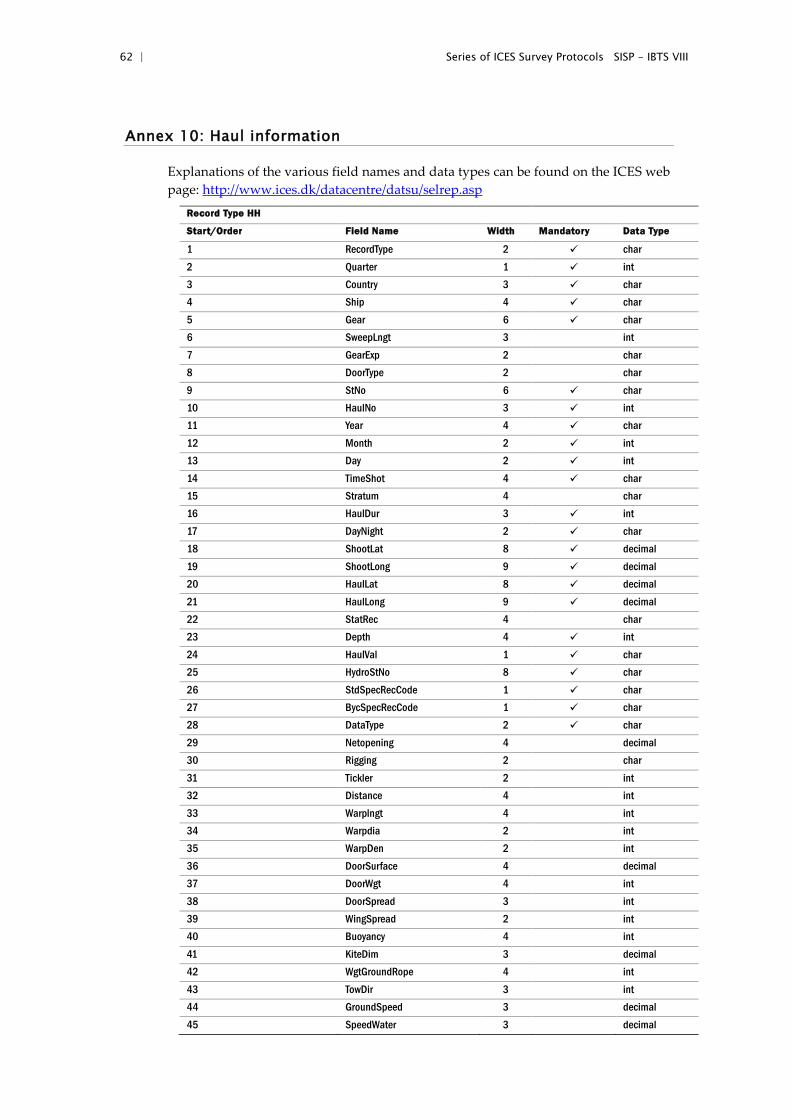
62 | Series of ICES Survey Protocols SISP - IBTS VIII
Annex 10: Haul information
Explanations of the various field names and data types can be found on the ICES web page: http://www.ices.dk/datacentre/datsu/selrep.asp
Record Type HH
Start/Order Field Name Width Mandatory Data Type
1 RecordType 2 char 2 Quarter 1 int 3 Country 3 char 4 Ship 4 char 5 Gear 6 char 6 SweepLngt 3 int 7 GearExp 2 char 8 DoorType 2 char 9 StNo 6 char 10 HaulNo 3 int 11 Year 4 char 12 Month 2 int 13 Day 2 int 14 TimeShot 4 char 15 Stratum 4 char 16 HaulDur 3 int 17 DayNight 2 char 18 ShootLat 8 decimal 19 ShootLong 9 decimal 20 HaulLat 8 decimal 21 HaulLong 9 decimal 22 StatRec 4 char 23 Depth 4 int 24 HaulVal 1 char 25 HydroStNo 8 char 26 StdSpecRecCode 1 char 27 BycSpecRecCode 1 char 28 DataType 2 char 29 Netopening 4 decimal 30 Rigging 2 char 31 Tickler 2 int 32 Distance 4 int 33 Warplngt 4 int 34 Warpdia 2 int 35 WarpDen 2 int 36 DoorSurface 4 decimal 37 DoorWgt 4 int 38 DoorSpread 3 int 39 WingSpread 2 int 40 Buoyancy 4 int 41 KiteDim 3 decimal 42 WgtGroundRope 4 int 43 TowDir 3 int 44 GroundSpeed 3 decimal 45 SpeedWater 3 decimal
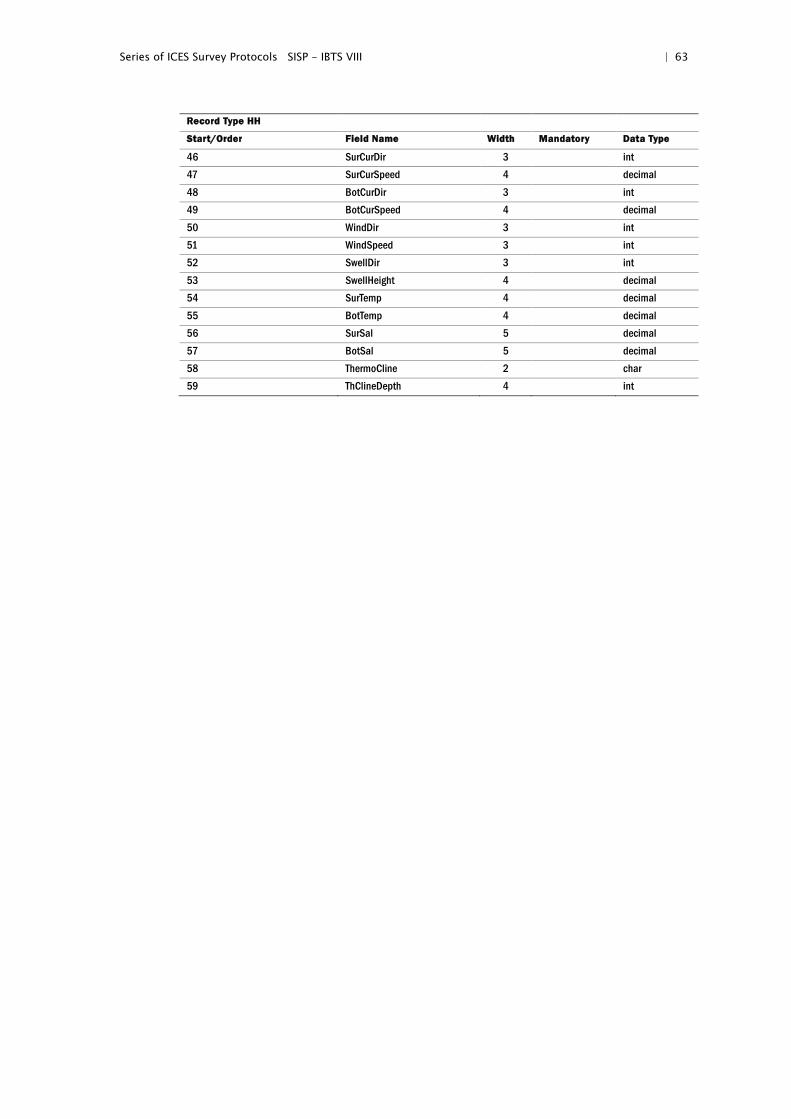
Series of ICES Survey Protocols SISP - IBTS VIII | 63
Record Type HH
Start/Order Field Name Width Mandatory Data Type
46 SurCurDir 3 int 47 SurCurSpeed 4 decimal 48 BotCurDir 3 int 49 BotCurSpeed 4 decimal 50 WindDir 3 int 51 WindSpeed 3 int 52 SwellDir 3 int 53 SwellHeight 4 decimal 54 SurTemp 4 decimal 55 BotTemp 4 decimal 56 SurSal 5 decimal 57 BotSal 5 decimal 58 ThermoCline 2 char 59 ThClineDepth 4 int
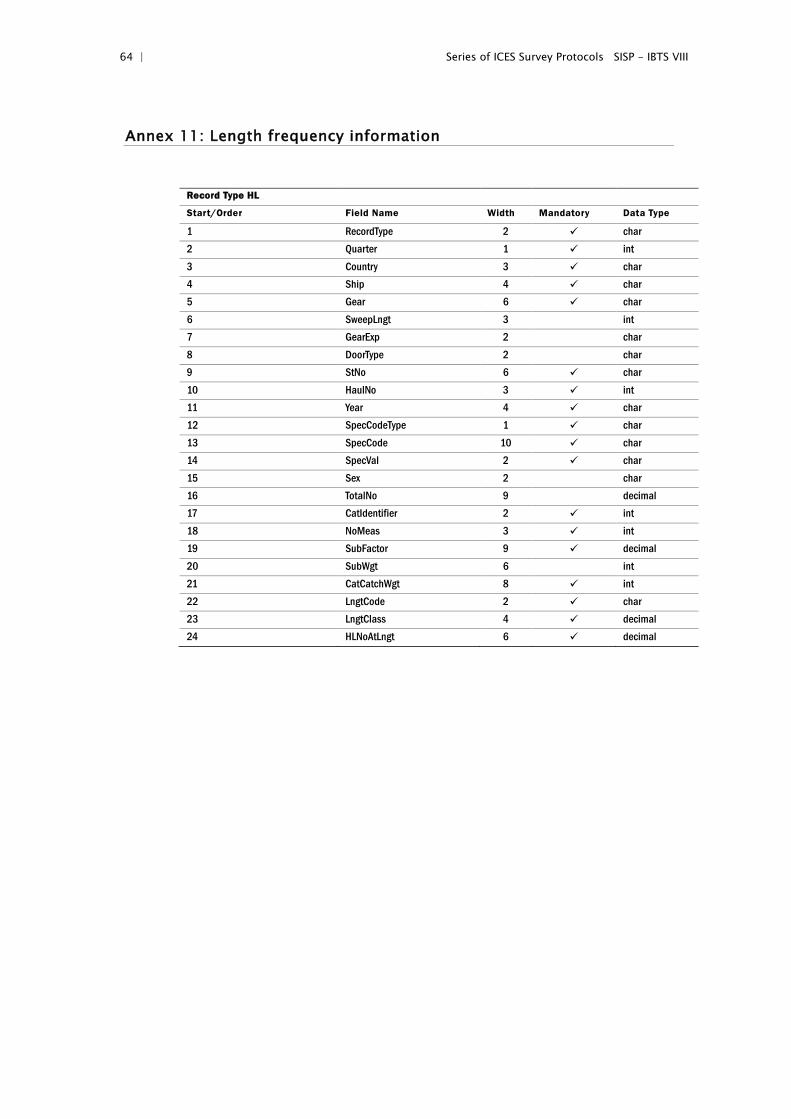
64 | Series of ICES Survey Protocols SISP - IBTS VIII
Annex 11: Length frequency information
Record Type HL
Start/Order Field Name Width Mandatory Data Type
1 RecordType 2 char 2 Quarter 1 int 3 Country 3 char 4 Ship 4 char 5 Gear 6 char 6 SweepLngt 3 int 7 GearExp 2 char 8 DoorType 2 char 9 StNo 6 char 10 HaulNo 3 int 11 Year 4 char 12 SpecCodeType 1 char 13 SpecCode 10 char 14 SpecVal 2 char 15 Sex 2 char 16 TotalNo 9 decimal 17 CatIdentifier 2 int 18 NoMeas 3 int 19 SubFactor 9 decimal 20 SubWgt 6 int 21 CatCatchWgt 8 int 22 LngtCode 2 char 23 LngtClass 4 decimal 24 HLNoAtLngt 6 decimal
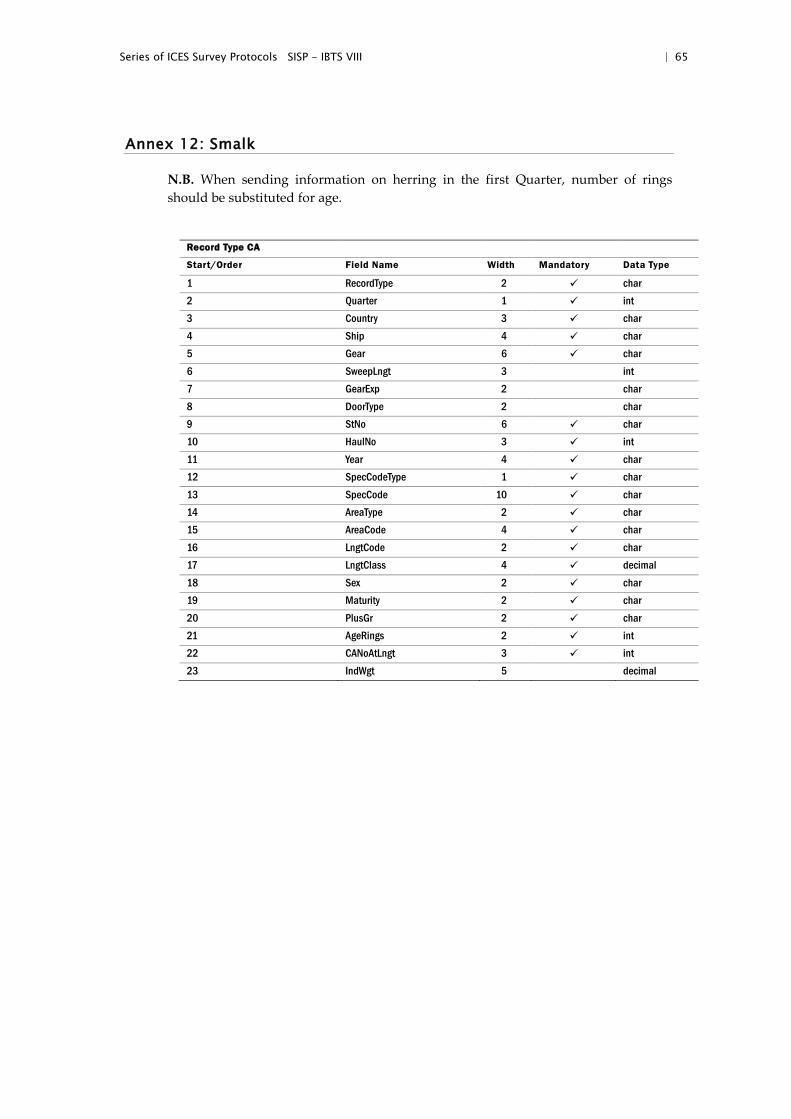
Series of ICES Survey Protocols SISP - IBTS VIII | 65
Annex 12: Smalk
N.B. When sending information on herring in the first Quarter, number of rings should be substituted for age.
Record Type CA
Start/Order Field Name Width Mandatory Data Type
1 RecordType 2 char 2 Quarter 1 int 3 Country 3 char 4 Ship 4 char 5 Gear 6 char 6 SweepLngt 3 int 7 GearExp 2 char 8 DoorType 2 char 9 StNo 6 char 10 HaulNo 3 int 11 Year 4 char 12 SpecCodeType 1 char 13 SpecCode 10 char 14 AreaType 2 char 15 AreaCode 4 char 16 LngtCode 2 char 17 LngtClass 4 decimal 18 Sex 2 char 19 Maturity 2 char 20 PlusGr 2 char 21 AgeRings 2 int 22 CANoAtLngt 3 int 23 IndWgt 5 decimal
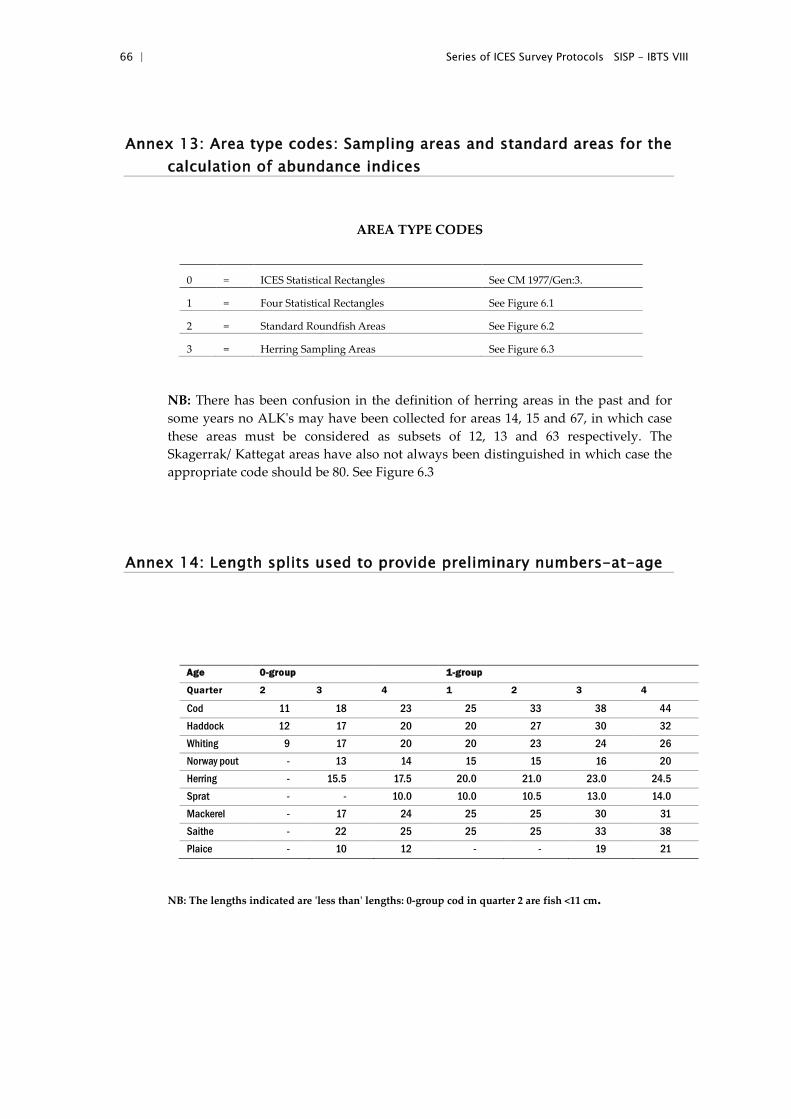
66 | Series of ICES Survey Protocols SISP - IBTS VIII
Annex 13: Area type codes: Sampling areas and standard areas for the calculation of abundance indices
AREA TYPE CODES
0 = ICES Statistical Rectangles See CM 1977/Gen:3.
1 = Four Statistical Rectangles See Figure 6.1
2 = Standard Roundfish Areas See Figure 6.2
3 = Herring Sampling Areas See Figure 6.3
NB: There has been confusion in the definition of herring areas in the past and for some years no ALK's may have been collected for areas 14, 15 and 67, in which case these areas must be considered as subsets of 12, 13 and 63 respectively. The Skagerrak/ Kattegat areas have also not always been distinguished in which case the appropriate code should be 80. See Figure 6.3
Annex 14: Length splits used to provide preliminary numbers-at-age
Age 0-group 1-group
Quarter 2 3 4 1 2 3 4
Cod 11 18 23 25 33 38 44 Haddock 12 17 20 20 27 30 32 Whiting 9 17 20 20 23 24 26 Norway pout - 13 14 15 15 16 20 Herring - 15.5 17.5 20.0 21.0 23.0 24.5 Sprat - - 10.0 10.0 10.5 13.0 14.0 Mackerel - 17 24 25 25 30 31 Saithe - 22 25 25 25 33 38 Plaice - 10 12 - - 19 21
NB: The lengths indicated are 'less than' lengths: 0-group cod in quarter 2 are fish <11 cm.
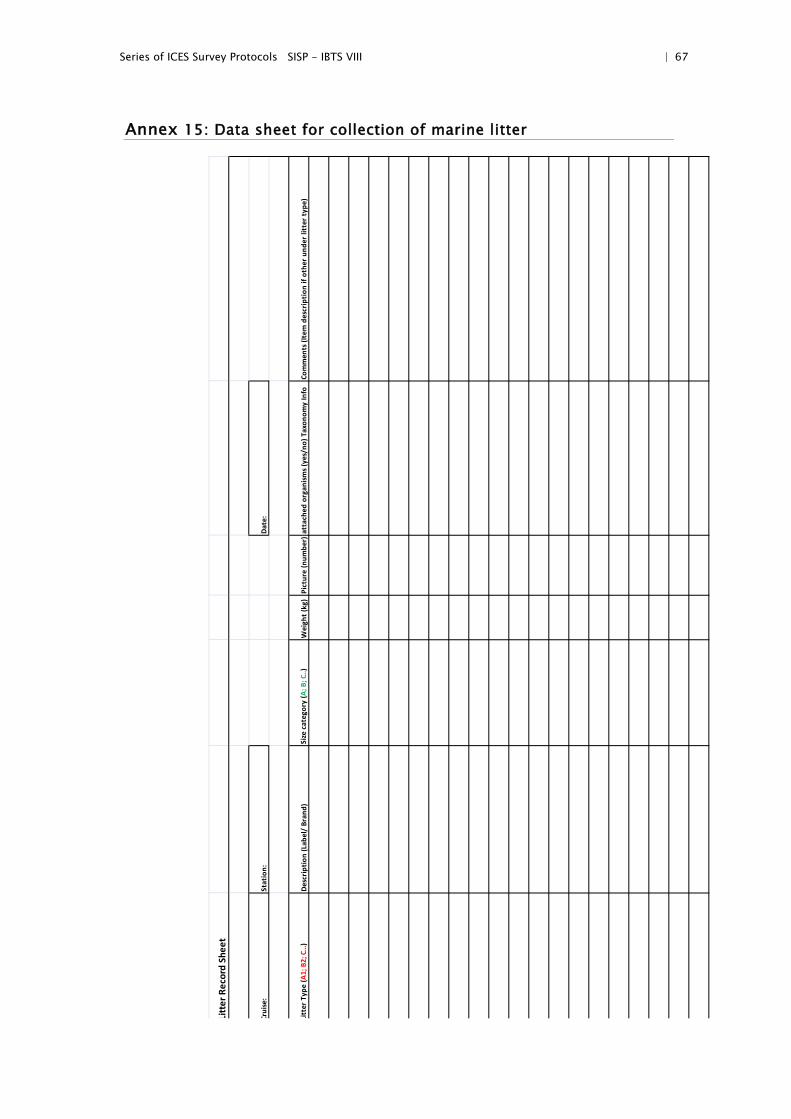
Series of ICES Survey Protocols SISP - IBTS VIII | 67
Annex 15: Data sheet for collection of marine litter
Litt
er R
ecor
d Sh
eet
Crui
se:
Stat
ion:
Da
te:
Litt
er T
ype
(A1;
B2;
C…
)De
scrip
tion
(Lab
el/
Bran
d)
Size
cat
egor
y (A
; B; C
..)W
eigh
t (kg
)Pi
ctur
e (n
umbe
r)at
tach
ed o
rgan
isms (
yes/
no) T
axon
omy
Info
Com
men
ts (I
tem
des
crip
tion
if ot
her u
nder
litt
er ty
pe)
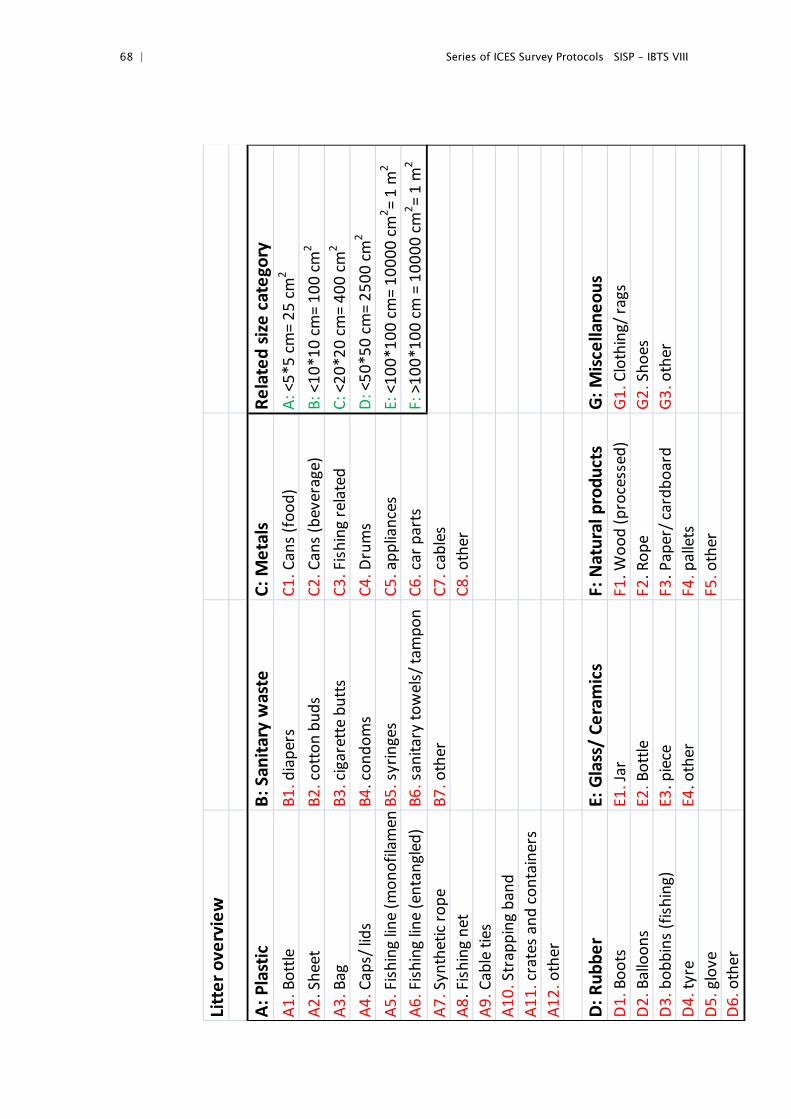
68 | Series of ICES Survey Protocols SISP - IBTS VIII
Litt
er o
verv
iew
A: P
last
ic
B: S
anita
ry w
aste
C: M
etal
sRe
late
d siz
e ca
tego
ryA1
. Bot
tleB1
. dia
pers
C1. C
ans (
food
)A:
<5*
5 cm
= 25
cm
2
A2. S
heet
B2. c
otto
n bu
dsC2
. Can
s (be
vera
ge)
B: <
10*1
0 cm
= 10
0 cm
2
A3. B
agB3
. cig
aret
te b
utts
C3. F
ishin
g re
late
dC:
<20
*20
cm=
400
cm2
A4. C
aps/
lids
B4. c
ondo
ms
C4. D
rum
sD
: <50
*50
cm=
2500
cm2
A5. F
ishin
g lin
e (m
onof
ilam
entB
5. sy
ringe
sC5
. app
lianc
esE:
<10
0*10
0 cm
= 10
000
cm2 =
1 m
2
A6. F
ishin
g lin
e (e
ntan
gled
)B6
. san
itary
tow
els/
tam
pon
C6. c
ar p
arts
F: >
100*
100
cm =
100
00 cm
2 = 1
m2
A7. S
ynth
etic
rope
B7. o
ther
C7. c
able
sA8
. Fish
ing
net
C8. o
ther
A9. C
able
ties
A10.
Str
appi
ng b
and
A11.
crat
es a
nd co
ntai
ners
A12.
oth
er
D: R
ubbe
rE:
Gla
ss/
Cera
mic
sF:
Nat
ural
pro
duct
sG:
Misc
ella
neou
sD
1. B
oots
E1. J
arF1
. Woo
d (p
roce
ssed
)G
1. C
loth
ing/
rags
D2.
Bal
loon
s E2
. Bot
tleF2
. Rop
eG
2. S
hoes
D
3. b
obbi
ns (f
ishi
ng)
E3. p
iece
F3. P
aper
/ car
dboa
rd
G3.
oth
erD
4. ty
reE4
. oth
erF4
. pal
lets
D5.
glo
veF5
. oth
erD
6. o
ther


