Mansi M. Kasliwal California Institute of...
23
Electromagnetic Counterparts to Gravitational Waves Mansi M. Kasliwal California Institute of Technology
Transcript of Mansi M. Kasliwal California Institute of...

Electromagnetic Counterparts to Gravitational WavesMansi M. Kasliwal
California Institute of Technology

Dawn of Gravitational Wave Astronomy
Mansi M. Kasliwal January 5, 2017

January 5, 2017
Sites of r-process nucleosynthesis?
e.g. Li & Paczynski 1998, Kulkarni 2005, Roberts et al. 2011, Nakar & Piran 2011, Barnes et al. 2013, Grossman et al. 2013, Metzger et al. 2014, Kasen et al. 2016
4 Metzger et al.
F igur e 1. Radioact ive heat ing rate per unit mass E in NS
merger ejecta due to the decay of r -process material, calculated
for the Ye = 0.1 ejecta t rajectory from Rosswog et al. (1999)
and Freiburghaus et al. (1999). T he total heat ing rate is shown
with a solid line and is divided into cont r ibut ions from β− decays
(dotted line) and fission (dashed line). For comparison we also
show the heat ing rate per unit mass produced by the decay chain56 Ni → 56Co → 56 Fe (dot-dashed line). Note that on the ∼ day
t imescales of interest for merger t ransients (t ∼ tp eak ; eq. [3])
fission and β− decays make similar cont r ibut ions to the total r -
process heat ing, and that the r -process and 56Ni heat ing rates
are similar.
weeks) is one of the defining characterist ics of kilonovae from
NS mergers.
Provided that t he radioact ive power can be approxi-
mated as a decreasing power-law in t ime Q ∝ t− α with
α < 2, the brightness of the event depends most sensit ively
on the amount of radioact ive heat ing that occurs around
the t imescale tp eak : Qp eak =t p eak
Qdt ≈ Q(tp eak )tp eak =
f M ej c2 , where f 1 is a dimensionless number (LP98).
Paramet rized thus, the peak bolomet ric luminosity is ap-
proximately
L p eakQp eak
td (Rp eak )
≈ 5 × 1041
ergs s− 1 f
10− 6
v
0.1c
1/ 2 M ej
10− 2M
1/ 2
,
(4)
and the effect ive temperature is given by
Tp eakL p eak
4πR2p eakσ
1/ 4
≈ 1.4 × 10⁴
Kf
10− 6
1/ 4 v
0.1c
− 1/ 8 M ej
10− 2M
− 1/ 8
(5)
Note that L p eak ∝ f , yet the value of f is left as a free
parameter in the LP98 model, with values up to f ∼ 10− 3
considered plausible a prior i . In §3.2 we present explicit cal-
culat ions of Q and show that the effect ive value of f is
∼ 3× 10− 6 . Thus, for M ej ∼ 10− 2 M we expect a t ransient
with peak luminosity ∼ 1042 ergs s− 1 (bolomet ric magni-
tude M b ol ≈ − 16) and a photospheric temperature∼ 104 K ,
F igur e 2. Final abundance dist ribut ion from the fiducial model
with Ye = 0.1 (Fig. 1), shown as the mass fract ion versus
mass number A. M easured solar system r -process abundances are
shown for comparison with black dots. T hey are arbit rar i ly nor-
malized to the computed abundances for A = 195.
corresponding to a spect ral peak at opt ical/ near-UV wave-
lengths.
3 R A D I OA CT I V E H EAT I N G
3.1 N et wor k Calculat ions
In this sect ion we present calculat ions of the radioact ive
heat ing of the ejecta. We use a dynamical r -process network
(Mart ınez-Pinedo 2008;Petermann et al. 2008) that includes
neut ron captures, photodissociat ions, β− decays, α− decays
and fission react ions. The lat ter includes cont ribut ions from
neut ron induced fission, β delayed fission, and spontaneous
fission. The neut ron capture rates for nuclei with Z 83 are
obtained from the work of Rauscher & Thielemann (2000)
and are based on two different nuclear mass models: the
Finite Range Droplet Model (Moller et al. 1995) and the
Quenched version of the Extended Thomas Fermi with
St rut insky Integral model (ETFSI-Q) (Pearson et al. 1996).
For nuclei with Z > 83 the neut ron capture rates and
neut ron-induced fission rates are obtained from Panov et al.
(2009). Beta-decay rates including emission of up to 3 neu-
t rons after beta decay are from Moller et al. (2003). Beta-
delayed fission and spontaneous fission rates are deter-
mined as explained by Mart ınez-Pinedo et al. (2007). Ex-
perimental rates for alpha and beta decay have been ob-
tained from the NUDAT database.1 Fission yields for all
fission processes are determined using the stat ist ical code
ABLA (Gaimard & Schmidt 1991; Benlliure et al. 1998). All
heat ing is self-consistent ly added to the ent ropy of the fluid
following the procedure of Freiburghaus et al. (1999). The
change of temperature during the init ial expansion is de-
termined using the T immes equat ion of state (T immes &
Arnet t 1999), which is valid below the density ρ ∼ 3 × 10¹¹
g cm− 3 at which our calculat ion begins.
As in the r -process calculat ions performed by
Freiburghaus et al. (1999), we use a Lagrangian density ρ(t )
1 ht t p: / / www. nndc. bnl . gov/ nudat 2/
c ???? RAS, M NRAS 000, 1–15
Figure from Metzger et al. 2010, 2014
AuPt
Mansi M. Kasliwal

Mansi M. Kasliwal
A Resurgence inTDA Discovery Engines
Evryscope, ASASSN, HATPI ZTF, CSS-II, PS, BG, ATLAS DECAM, HSC, LSST
Radio:LOFAR, MWA and LWA: meter and decameter-mapping Apertif, Meerkat and Askap: decimetric mapping
Optical:
Infrared: SPIRITS, Palomar Gattini-IR, Polar Gattini-IRUltra-Violet: CUTIE & ULTRASATX-rays and Gamma-rays: Swift, Fermi, MIRAX, Lobster-ISS
January 5, 2017

Mansi M. Kasliwal / GROWTH
Ab
bo
tt e
t al
. 20
16
–LV
C +
EM
Tea
ms
Join
t Pa
pe
r

Mansi M. Kasliwal
Ye>0.25DiskWind
FreeNeutronDecayUV+Optical (hours)
KilonovaInfrared(weeks)
Re lativ isticJe tγ/X-ray(seconds)
D iskW indEmiss ionUV(hours)+Optical(days)
ShockedISMRadio(monthstoyears)
BHYe<0.25DynamicalDebris
r-processradioactivity
January 5, 2017
Models

SPEED:Speed of ResponseSpeed of Software Speed of Follow-Up
January 5, 2017 Mansi M. Kasliwal

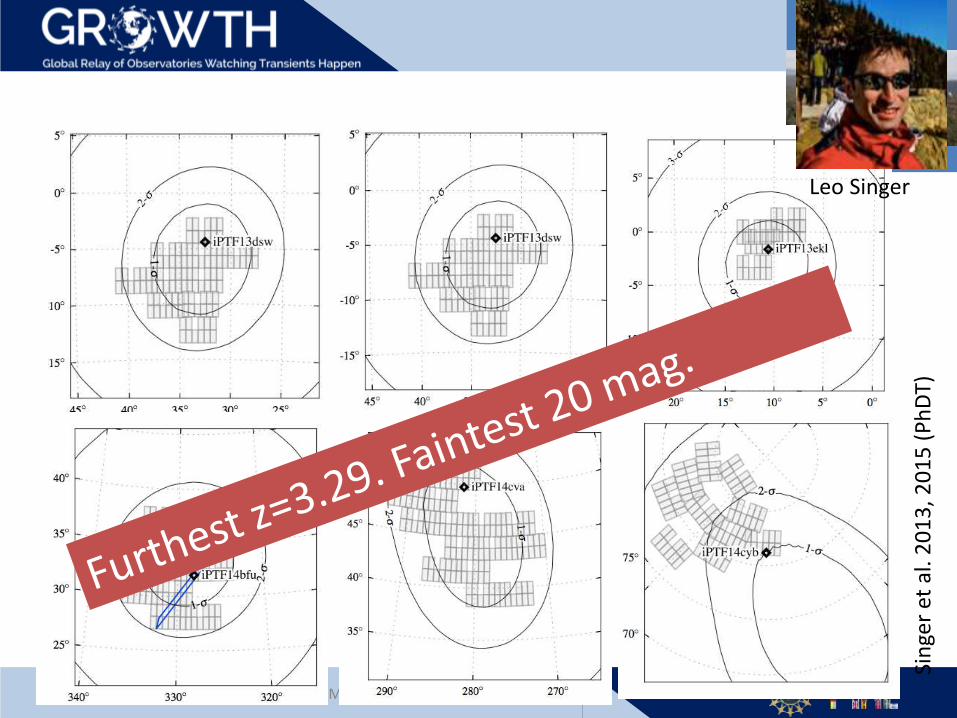
Coarse Gravitational Wave Localizations
e.g. Kasliwal & Nissanke 2014, Singer et al. 2014
January 5, 2017 Mansi M. Kasliwal

Mansi M. Kasliwal
Optical Hardware
Kas
liwal
& N
issa
nke
20
14
January 5, 2017

Software Speed
January 5, 2017 Mansi M. Kasliwal

Follow-Up is Key
January 5, 2017 Mansi M. Kasliwal

GW150914: All candidates classified in 2 hours!
Kas
liwal
et
al. 2
01
6
January 5, 2017 Mansi M. Kasliwal

Mansi M. Kasliwal
Needle in haystack
127676 candidates in subtraction images
78951 do NOT have a quiescent stellar source
15624 are detected twice and NOT asteroids
5803 pass our machine learning threshold
1007 are coincident with a nearby galaxy
13 were vetted by human scanners
8 were scheduled for follow-up spectroscopic observations
0 were associated with the gravitational wave
Kas
liwal
et
al. 2
01
6
January 5, 2017

Mansi M. Kasliwal
Census of the Local Universe(CLU Galaxy Catalog)
Dave Cook237.08
January 5, 2017

Mansi M. Kasliwal
BUT…
What if even 2% of the neutrons fail to escape?
What if the ejecta mass is small and dominated by lanthanides?
What if the lifetime of the hypermassiveneutron star is too short?
January 5, 2017

January 5, 2017 Mansi M. Kasliwal
Deep I & z-band Searches
Subaru HSC8.2m, 1.8 deg2
LSST6.7m, 9.6 deg2
CTIO-DECAM4m, 3 deg2

January 5, 2017 Mansi M. Kasliwal
BUT…
What if opacities push the emission entirely in the infrared beyond 1 micron?

January 5, 2017 Mansi M. Kasliwal
Infrared
VIRCAM on VISTA0.6 deg2 on 4.1m
WFCAM on UKIRT0.16 deg2 on 3.8m
Space
ETA (proposed)
Stay Tuned: 25 deg2 J-band imager at Palomar this summer!

Mansi M. Kasliwal
Caution is the better part of valor
It could be fast
It could be red
It could be temporally coincident
It could be next to a nearby galaxy
BUT unrelated!
January 5, 2017

Thank you
Mansi M. KasliwalJanuary 5, 2017
21
Jan 5, 2017 Mansi M. Kasliwal / GROWTH
Sin
ger
et a
l. 2
01
3, 2
01
5 (
Ph
DT)
Leo Singer

TDA in the LSST era
GROWTH builds a global community ready to contribute LSST time-domain science!

SPIRITS:SPitzer InfraRed Intensive Transients Survey
147 transients (35 SPRITEs)1948 strong variables
Cycles 10-131410 hours of Spitzer mid-IR190 Galaxies x 14 epochs(PI Kasliwal)
Every Year:110 nights of near-IR imaging66 nights of optical imaging33 nights of spectroscopy
Kasliwal et al. 2016b, ApJ, submitted
A New Infrared Discovery Engine?