ManpowerGroup Employment Outlook Survey Slovakia Q1 2018 fileManpowerGroup Employment Outlook Survey...
32
ManpowerGroup Employment Outlook Survey Slovakia Q 1 2018
Transcript of ManpowerGroup Employment Outlook Survey Slovakia Q1 2018 fileManpowerGroup Employment Outlook Survey...
ManpowerGroup Employment Outlook SurveySlovakia
Q1 2018
The ManpowerGroup
Employment Outlook Survey
for the first quarter 2018 was
conducted by interviewing
a representative sample
of 751 employers in Slovakia.
All survey participants were
asked, “How do you anticipate
total employment at your
location to change in the three
months to the end of March
2018 as compared
to the current quarter?”
Slo
va
kia
Em
plo
ym
en
tO
utl
oo
k
Contents Country Employment Outlook 1 Organisation-Size Comparisons Regional Comparisons
Sector Comparisons Global Employment Outlook 13 International Comparisons – Americas International Comparisons – Asia Pacific International Comparisons – EMEA About the Survey 28 About ManpowerGroupTM 29
ManpowerGroup Employment Outlook Survey 1
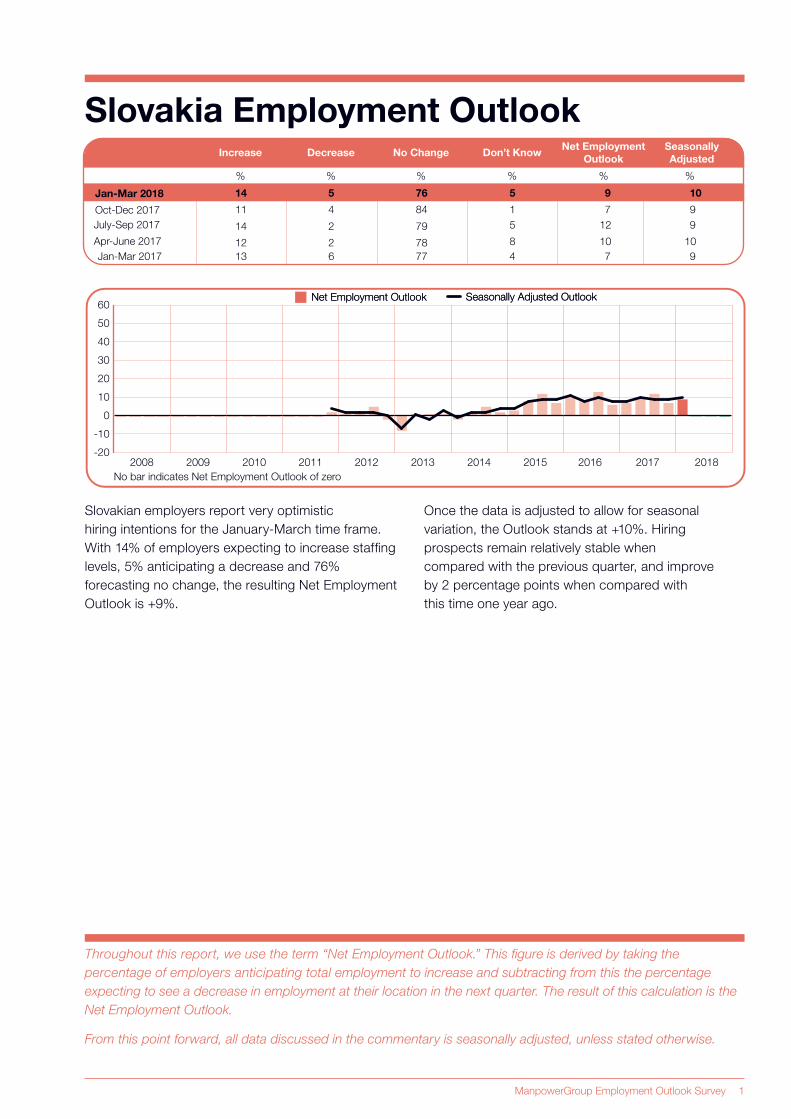
Slovakia Employment Outlook
Slovakian employers report very optimistic
hiring intentions for the January-March time frame.
With 14% of employers expecting to increase staffing
levels, 5% anticipating a decrease and 76%
forecasting no change, the resulting Net Employment
Outlook is +9%.
Once the data is adjusted to allow for seasonal
variation, the Outlook stands at +10%. Hiring
prospects remain relatively stable when
compared with the previous quarter, and improve
by 2 percentage points when compared with
this time one year ago.
Throughout this report, we use the term “Net Employment Outlook.” This figure is derived by taking the
percentage of employers anticipating total employment to increase and subtracting from this the percentage
expecting to see a decrease in employment at their location in the next quarter. The result of this calculation is the
Net Employment Outlook.
From this point forward, all data discussed in the commentary is seasonally adjusted, unless stated otherwise.
% % % % % %
Increase Decrease No Change Don’t KnowNet Employment
Outlook
Seasonally
Adjusted
13 6 77 4 7 9Jan-Mar 2017
12 2 78 8 10 10Apr-June 2017
14 2 79 5 12 9July-Sep 2017
11 4 84 1 7 9Oct-Dec 2017
14 5 76 5 9 10Jan-Mar 2018
Seasonally Adjusted OutlookSeasonally Adjusted OutlookNet Employment OutlookNet Employment Outlook
No bar indicates Net Employment Outlook of zero
2008 2009 2010 2011 2012 2013 2014 2015 2016 2017 2018-20
-10
0
10
20
30
40
50
60
2 ManpowerGroup Employment Outlook Survey
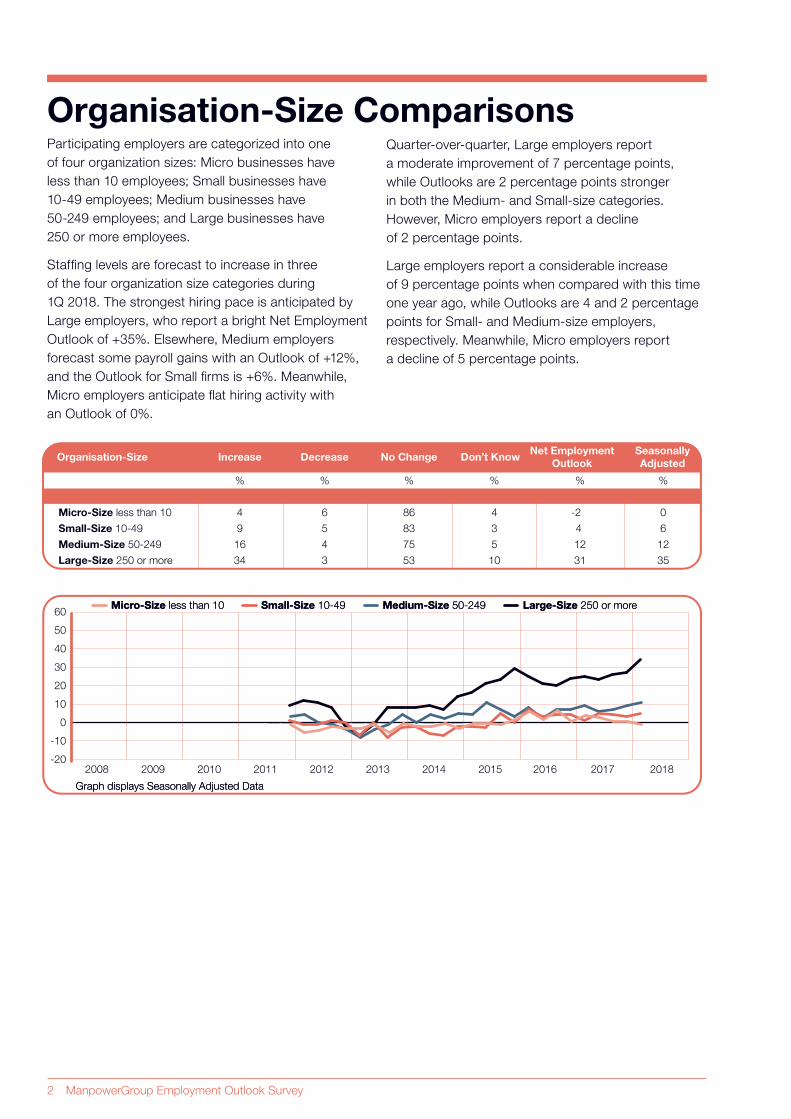
Participating employers are categorized into one
of four organization sizes: Micro businesses have
less than 10 employees; Small businesses have
10-49 employees; Medium businesses have
50-249 employees; and Large businesses have
250 or more employees.
Staffing levels are forecast to increase in three
of the four organization size categories during
1Q 2018. The strongest hiring pace is anticipated by
Large employers, who report a bright Net Employment
Outlook of +35%. Elsewhere, Medium employers
forecast some payroll gains with an Outlook of +12%,
and the Outlook for Small firms is +6%. Meanwhile,
Micro employers anticipate flat hiring activity with
an Outlook of 0%.
Organisation-Size ComparisonsQuarter-over-quarter, Large employers report
a moderate improvement of 7 percentage points,
while Outlooks are 2 percentage points stronger
in both the Medium- and Small-size categories.
However, Micro employers report a decline
of 2 percentage points.
Large employers report a considerable increase
of 9 percentage points when compared with this time
one year ago, while Outlooks are 4 and 2 percentage
points for Small- and Medium-size employers,
respectively. Meanwhile, Micro employers report
a decline of 5 percentage points.
% % % % %
34 3 53 10 31
16 4 75 5 12
9 5 83 3 4
4 6 86 4 -2
%
35
12
6
0
Large-Size 250 or more
Medium-Size 50-249
Small-Size 10-49
Micro-Size less than 10
IncreaseOrganisation-Size Decrease No Change Don’t KnowNet Employment
Outlook
Seasonally
Adjusted
2008 2009 2010 2011 2012 2013 2014 2015 2016 2017 2018-20
-10
0
10
20
30
40
50
60Micro-Size less than 10Micro-Size less than 10
Graph displays Seasonally Adjusted DataGraph displays Seasonally Adjusted Data
Small-Size 10-49Small-Size 10-49 Medium-Size 50-249Medium-Size 50-249 Large-Size 250 or moreLarge-Size 250 or more
ManpowerGroup Employment Outlook Survey 3
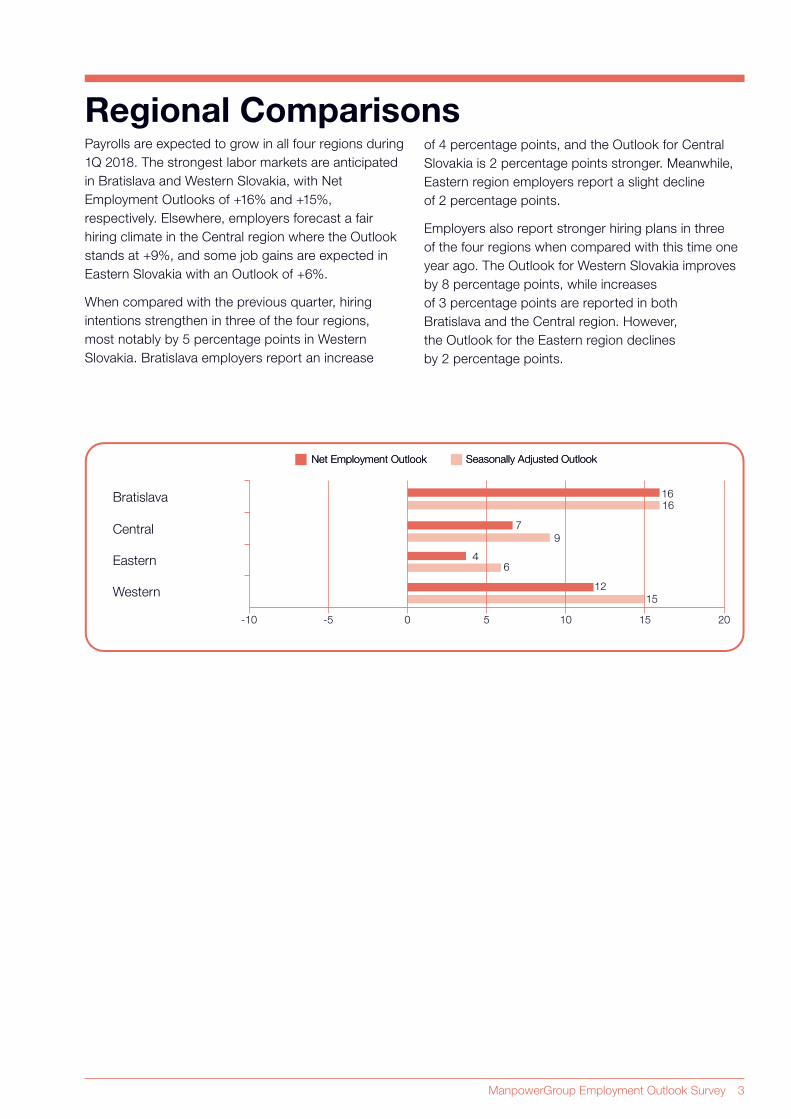
Payrolls are expected to grow in all four regions during
1Q 2018. The strongest labor markets are anticipated
in Bratislava and Western Slovakia, with Net
Employment Outlooks of +16% and +15%,
respectively. Elsewhere, employers forecast a fair
hiring climate in the Central region where the Outlook
stands at +9%, and some job gains are expected in
Eastern Slovakia with an Outlook of +6%.
When compared with the previous quarter, hiring
intentions strengthen in three of the four regions,
most notably by 5 percentage points in Western
Slovakia. Bratislava employers report an increase
Regional Comparisonsof 4 percentage points, and the Outlook for Central
Slovakia is 2 percentage points stronger. Meanwhile,
Eastern region employers report a slight decline
of 2 percentage points.
Employers also report stronger hiring plans in three
of the four regions when compared with this time one
year ago. The Outlook for Western Slovakia improves
by 8 percentage points, while increases
of 3 percentage points are reported in both
Bratislava and the Central region. However,
the Outlook for the Eastern region declines
by 2 percentage points.
-10 20
12
15
16
6
9
7
16
4
-5 0 5 10 15
Western
Eastern
Central
Bratislava
Seasonally Adjusted OutlookSeasonally Adjusted OutlookNet Employment OutlookNet Employment Outlook
4 ManpowerGroup Employment Outlook Survey
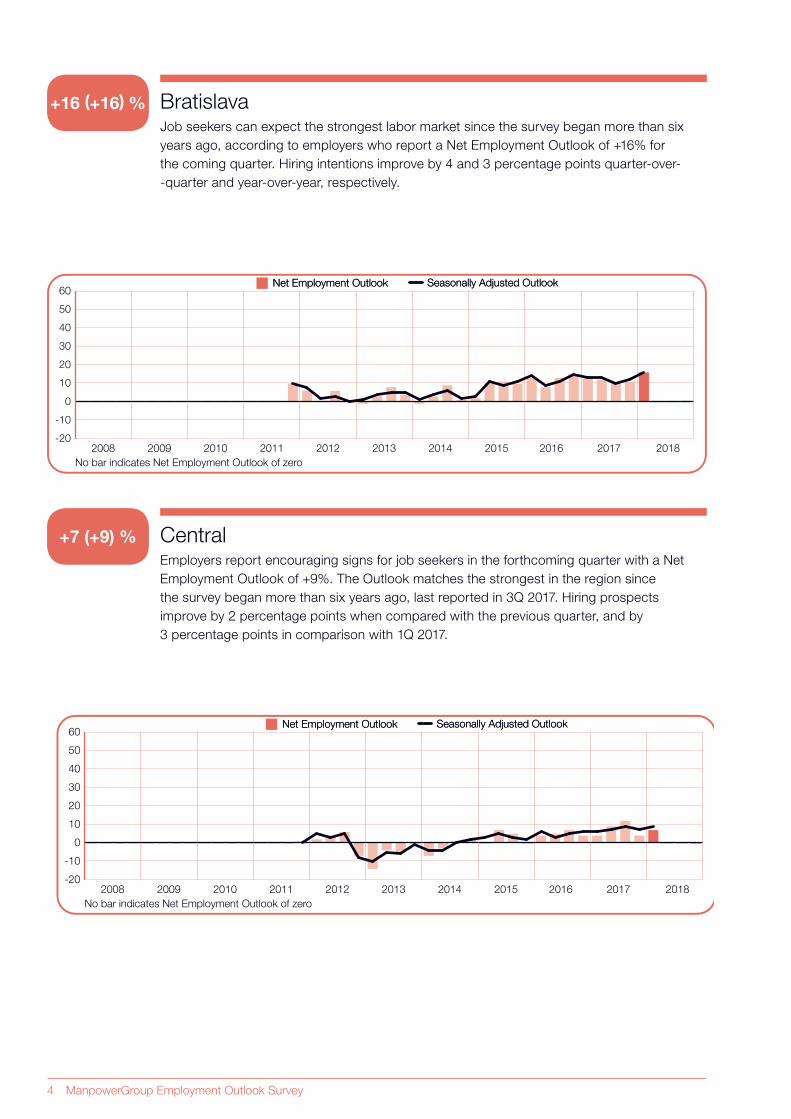
BratislavaJob seekers can expect the strongest labor market since the survey began more than six
years ago, according to employers who report a Net Employment Outlook of +16% for
the coming quarter. Hiring intentions improve by 4 and 3 percentage points quarter-over-
-quarter and year-over-year, respectively.
Central Employers report encouraging signs for job seekers in the forthcoming quarter with a Net
Employment Outlook of +9%. The Outlook matches the strongest in the region since
the survey began more than six years ago, last reported in 3Q 2017. Hiring prospects
improve by 2 percentage points when compared with the previous quarter, and by
3 percentage points in comparison with 1Q 2017.
+16 (+16) %
+7 (+9) %
Seasonally Adjusted OutlookSeasonally Adjusted OutlookNet Employment OutlookNet Employment Outlook
No bar indicates Net Employment Outlook of zero
2008 2009 2010 2011 2012 2013 2014 2015 2016 2017 2018-20
-10
0
10
20
30
40
50
60
Seasonally Adjusted OutlookSeasonally Adjusted OutlookNet Employment OutlookNet Employment Outlook
No bar indicates Net Employment Outlook of zero
2008 2009 2010 2011 2012 2013 2014 2015 2016 2017 2018-20
-10
0
10
20
30
40
50
60
ManpowerGroup Employment Outlook Survey 5
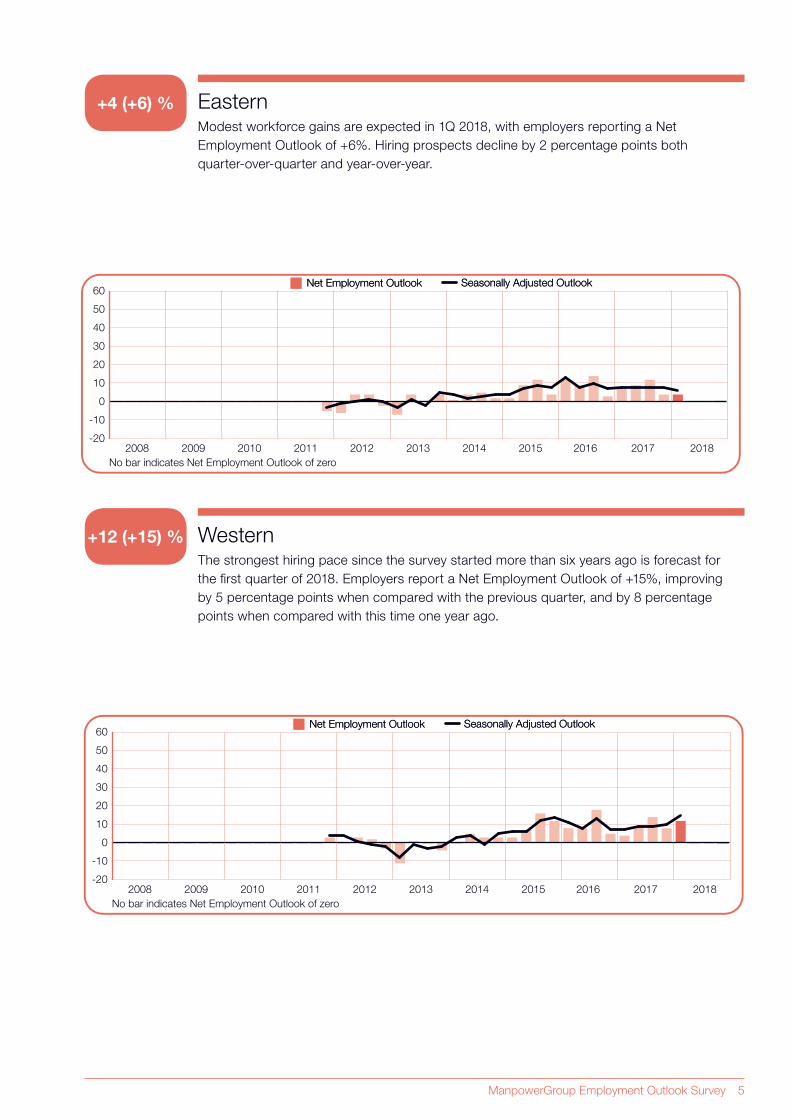
WesternThe strongest hiring pace since the survey started more than six years ago is forecast for
the first quarter of 2018. Employers report a Net Employment Outlook of +15%, improving
by 5 percentage points when compared with the previous quarter, and by 8 percentage
points when compared with this time one year ago.
EasternModest workforce gains are expected in 1Q 2018, with employers reporting a Net
Employment Outlook of +6%. Hiring prospects decline by 2 percentage points both
quarter-over-quarter and year-over-year.
+4 (+6) %
+12 (+15) %
Seasonally Adjusted OutlookSeasonally Adjusted OutlookNet Employment OutlookNet Employment Outlook
No bar indicates Net Employment Outlook of zero
2008 2009 2010 2011 2012 2013 2014 2015 2016 2017 2018-20
-10
0
10
20
30
40
50
60
Seasonally Adjusted OutlookSeasonally Adjusted OutlookNet Employment OutlookNet Employment Outlook
No bar indicates Net Employment Outlook of zero
2008 2009 2010 2011 2012 2013 2014 2015 2016 2017 2018-20
-10
0
10
20
30
40
50
60
6 ManpowerGroup Employment Outlook Survey
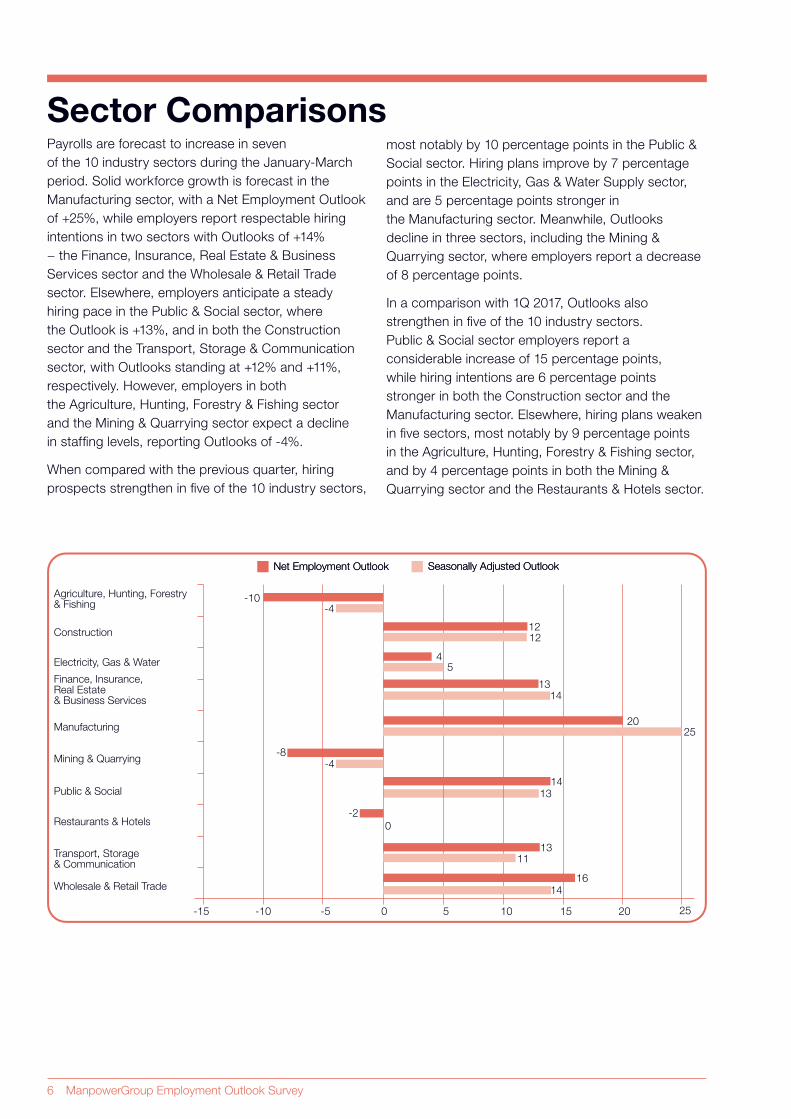
Payrolls are forecast to increase in seven
of the 10 industry sectors during the January-March
period. Solid workforce growth is forecast in the
Manufacturing sector, with a Net Employment Outlook
of +25%, while employers report respectable hiring
intentions in two sectors with Outlooks of +14%
− the Finance, Insurance, Real Estate & Business
Services sector and the Wholesale & Retail Trade
sector. Elsewhere, employers anticipate a steady
hiring pace in the Public & Social sector, where
the Outlook is +13%, and in both the Construction
sector and the Transport, Storage & Communication
sector, with Outlooks standing at +12% and +11%,
respectively. However, employers in both
the Agriculture, Hunting, Forestry & Fishing sector
and the Mining & Quarrying sector expect a decline
in staffing levels, reporting Outlooks of -4%.
When compared with the previous quarter, hiring
prospects strengthen in five of the 10 industry sectors,
-10-15
Public & Social
Transport, Storage & Communication
5
15 20-5 0 5 10
Finance, Insurance, Real Estate & Business Services
14
Construction1212
Wholesale & Retail Trade 14
13
16
Electricity, Gas & Water
Manufacturing
25
2025
Agriculture, Hunting, Forestry & Fishing
-10-4
Mining & Quarrying -8
0
1314
5
13
4
-4
Restaurants & Hotels -2
11
Seasonally Adjusted OutlookSeasonally Adjusted OutlookNet Employment OutlookNet Employment Outlook
Sector Comparisonsmost notably by 10 percentage points in the Public &
Social sector. Hiring plans improve by 7 percentage
points in the Electricity, Gas & Water Supply sector,
and are 5 percentage points stronger in
the Manufacturing sector. Meanwhile, Outlooks
decline in three sectors, including the Mining &
Quarrying sector, where employers report a decrease
of 8 percentage points.
In a comparison with 1Q 2017, Outlooks also
strengthen in five of the 10 industry sectors.
Public & Social sector employers report a
considerable increase of 15 percentage points,
while hiring intentions are 6 percentage points
stronger in both the Construction sector and the
Manufacturing sector. Elsewhere, hiring plans weaken
in five sectors, most notably by 9 percentage points
in the Agriculture, Hunting, Forestry & Fishing sector,
and by 4 percentage points in both the Mining &
Quarrying sector and the Restaurants & Hotels sector.
ManpowerGroup Employment Outlook Survey 7
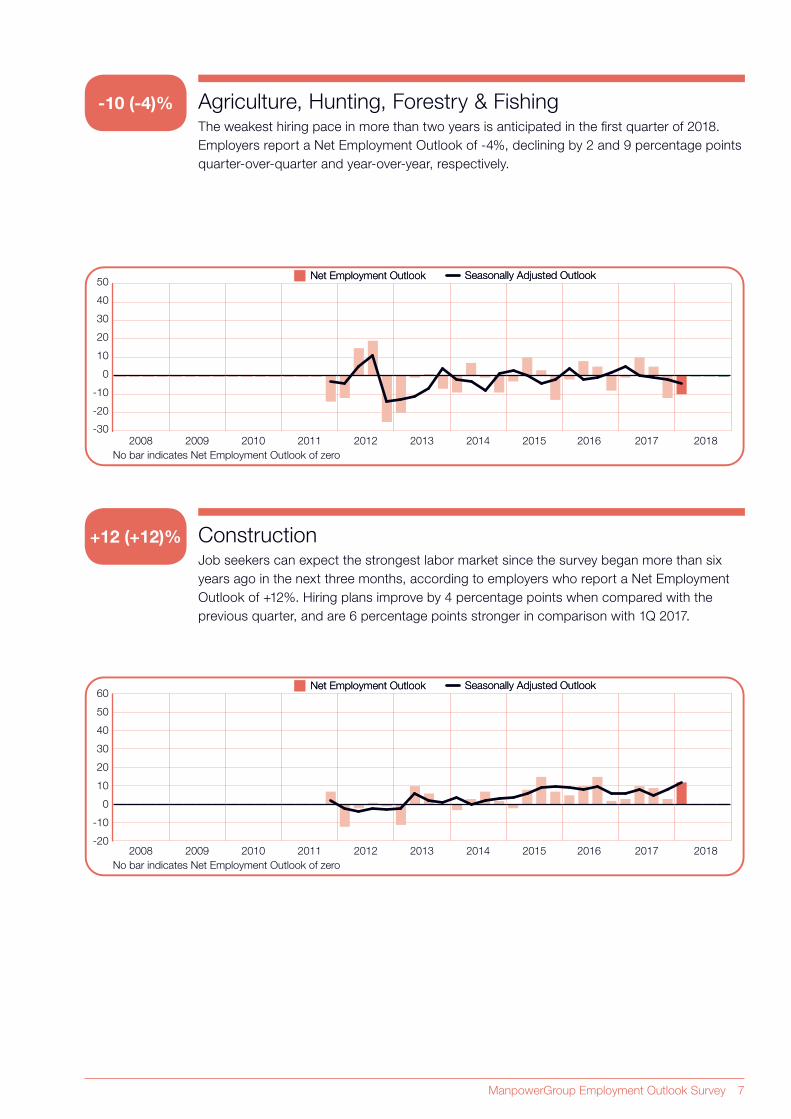
Agriculture, Hunting, Forestry & Fishing The weakest hiring pace in more than two years is anticipated in the first quarter of 2018.
Employers report a Net Employment Outlook of -4%, declining by 2 and 9 percentage points
quarter-over-quarter and year-over-year, respectively.
ConstructionJob seekers can expect the strongest labor market since the survey began more than six
years ago in the next three months, according to employers who report a Net Employment
Outlook of +12%. Hiring plans improve by 4 percentage points when compared with the
previous quarter, and are 6 percentage points stronger in comparison with 1Q 2017.
Seasonally Adjusted OutlookSeasonally Adjusted OutlookNet Employment OutlookNet Employment Outlook
No bar indicates Net Employment Outlook of zero
2008 2009 2010 2011 2012 2013 2014 2015 2016 2017 2018
-20
-10
0
10
20
30
40
50
-30
Seasonally Adjusted OutlookSeasonally Adjusted OutlookNet Employment OutlookNet Employment Outlook
No bar indicates Net Employment Outlook of zero
2008 2009 2010 2011 2012 2013 2014 2015 2016 2017 2018-20
-10
0
10
20
30
40
50
60
+12 (+12)%
-10 (-4)%
8 ManpowerGroup Employment Outlook Survey
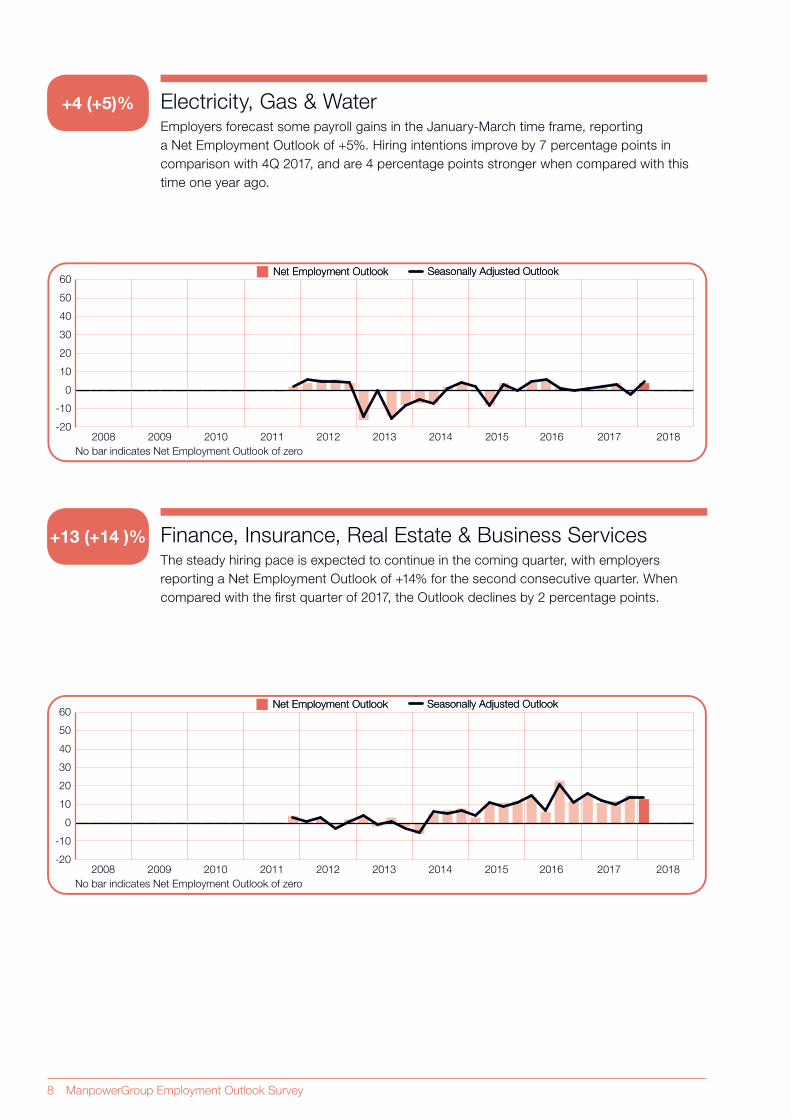
Electricity, Gas & Water Employers forecast some payroll gains in the January-March time frame, reporting
a Net Employment Outlook of +5%. Hiring intentions improve by 7 percentage points in
comparison with 4Q 2017, and are 4 percentage points stronger when compared with this
time one year ago.
Finance, Insurance, Real Estate & Business ServicesThe steady hiring pace is expected to continue in the coming quarter, with employers
reporting a Net Employment Outlook of +14% for the second consecutive quarter. When
compared with the first quarter of 2017, the Outlook declines by 2 percentage points.
Seasonally Adjusted OutlookSeasonally Adjusted OutlookNet Employment OutlookNet Employment Outlook
No bar indicates Net Employment Outlook of zero
2008 2009 2010 2011 2012 2013 2014 2015 2016 2017 2018-20
-10
0
10
20
30
40
50
60
Seasonally Adjusted OutlookSeasonally Adjusted OutlookNet Employment OutlookNet Employment Outlook
No bar indicates Net Employment Outlook of zero
2008 2009 2010 2011 2012 2013 2014 2015 2016 2017 2018-20
-10
0
10
20
30
40
50
60
+4 (+5)%
+13 (+14 )%
ManpowerGroup Employment Outlook Survey 9
Seasonally Adjusted OutlookSeasonally Adjusted OutlookNet Employment OutlookNet Employment Outlook
No bar indicates Net Employment Outlook of zero
2008 2009 2010 2011 2012 2013 2014 2015 2016 2017 2018-20
-10
0
10
20
30
40
50
60
Seasonally Adjusted OutlookSeasonally Adjusted OutlookNet Employment OutlookNet Employment Outlook
No bar indicates Net Employment Outlook of zero
2008 2009 2010 2011 2012 2013 2014 2015 2016 2017 2018-20
-10
0
10
20
30
40
50
60
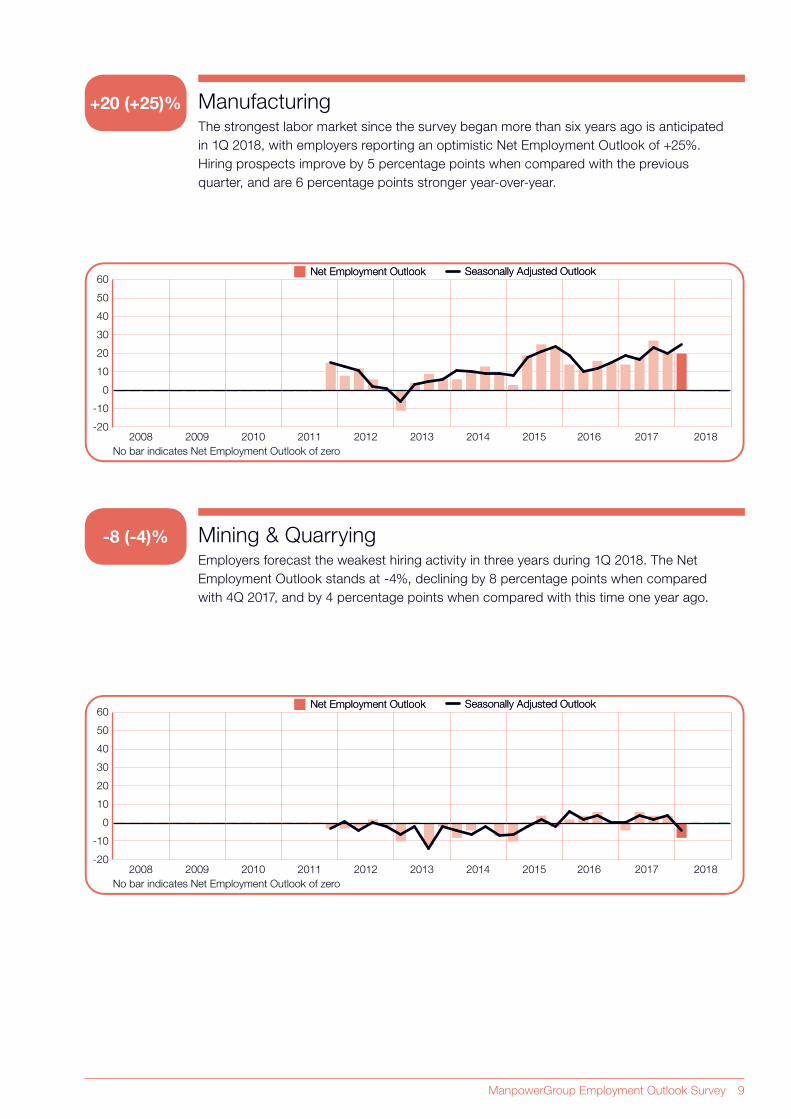
ManufacturingThe strongest labor market since the survey began more than six years ago is anticipated
in 1Q 2018, with employers reporting an optimistic Net Employment Outlook of +25%.
Hiring prospects improve by 5 percentage points when compared with the previous
quarter, and are 6 percentage points stronger year-over-year.
Mining & Quarrying Employers forecast the weakest hiring activity in three years during 1Q 2018. The Net
Employment Outlook stands at -4%, declining by 8 percentage points when compared
with 4Q 2017, and by 4 percentage points when compared with this time one year ago.
+20 (+25)%
-8 (-4)%
10 ManpowerGroup Employment Outlook Survey
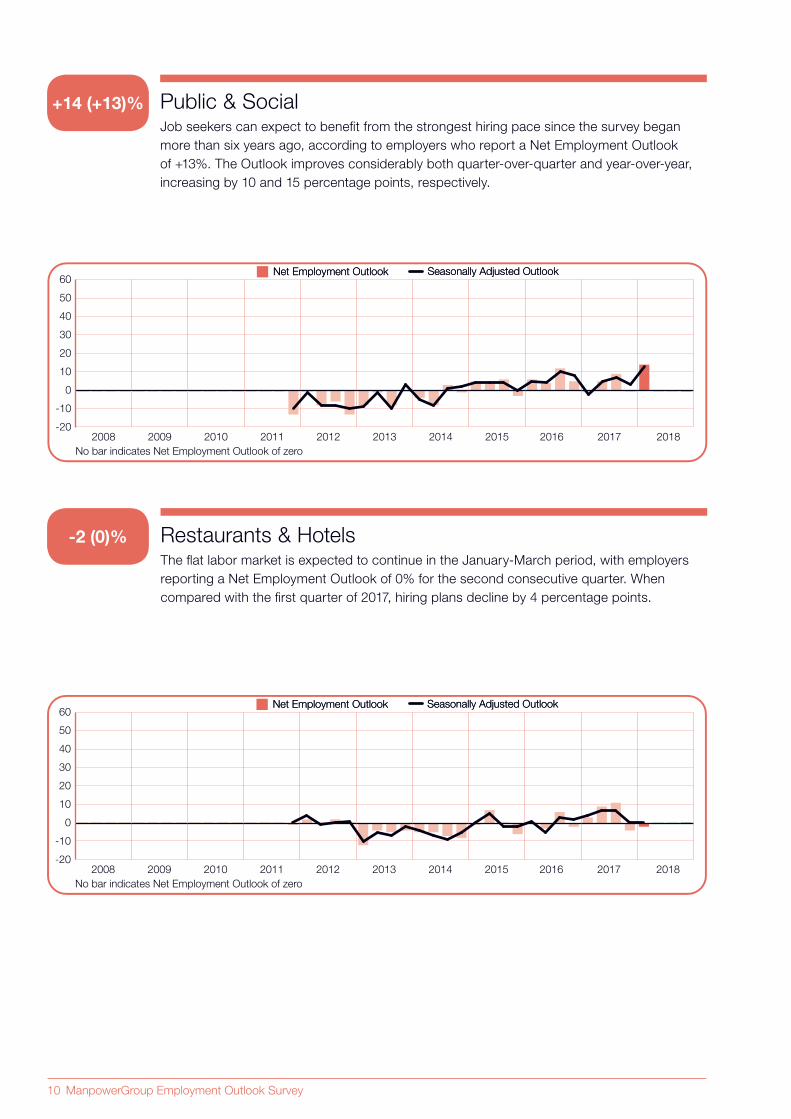
Public & SocialJob seekers can expect to benefit from the strongest hiring pace since the survey began
more than six years ago, according to employers who report a Net Employment Outlook
of +13%. The Outlook improves considerably both quarter-over-quarter and year-over-year,
increasing by 10 and 15 percentage points, respectively.
+14 (+13)%
Restaurants & Hotels The flat labor market is expected to continue in the January-March period, with employers
reporting a Net Employment Outlook of 0% for the second consecutive quarter. When
compared with the first quarter of 2017, hiring plans decline by 4 percentage points.
-2 (0)%
Seasonally Adjusted OutlookSeasonally Adjusted OutlookNet Employment OutlookNet Employment Outlook
No bar indicates Net Employment Outlook of zero
2008 2009 2010 2011 2012 2013 2014 2015 2016 2017 2018-20
-10
0
10
20
30
40
50
60
Seasonally Adjusted OutlookSeasonally Adjusted OutlookNet Employment OutlookNet Employment Outlook
No bar indicates Net Employment Outlook of zero
2008 2009 2010 2011 2012 2013 2014 2015 2016 2017 2018-20
-10
0
10
20
30
40
50
60
ManpowerGroup Employment Outlook Survey 11
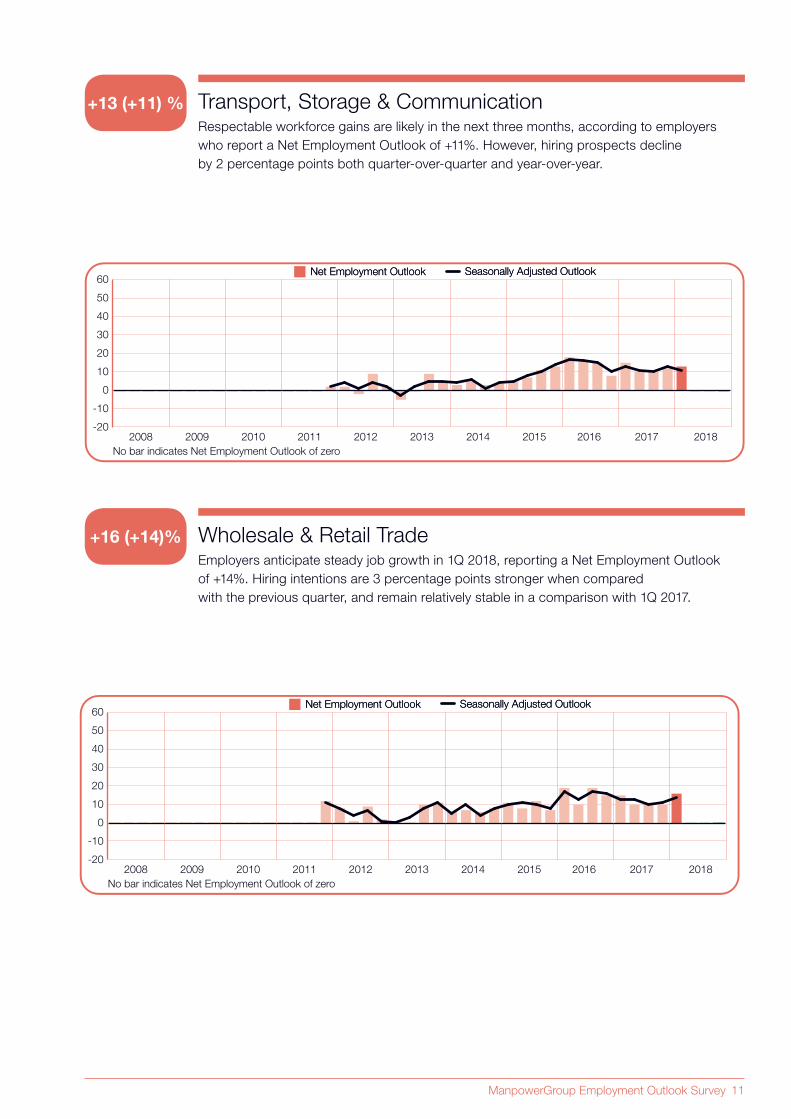
Transport, Storage & Communication Respectable workforce gains are likely in the next three months, according to employers
who report a Net Employment Outlook of +11%. However, hiring prospects decline
by 2 percentage points both quarter-over-quarter and year-over-year.
Wholesale & Retail Trade Employers anticipate steady job growth in 1Q 2018, reporting a Net Employment Outlook
of +14%. Hiring intentions are 3 percentage points stronger when compared
with the previous quarter, and remain relatively stable in a comparison with 1Q 2017.
+13 (+11) %
+16 (+14)%
Seasonally Adjusted OutlookSeasonally Adjusted OutlookNet Employment OutlookNet Employment Outlook
No bar indicates Net Employment Outlook of zero
2008 2009 2010 2011 2012 2013 2014 2015 2016 2017 2018-20
-10
0
10
20
30
40
50
60
Seasonally Adjusted OutlookSeasonally Adjusted OutlookNet Employment OutlookNet Employment Outlook
No bar indicates Net Employment Outlook of zero
2008 2009 2010 2011 2012 2013 2014 2015 2016 2017 2018-20
-10
0
10
20
30
40
50
60
12 ManpowerGroup Employment Outlook Survey
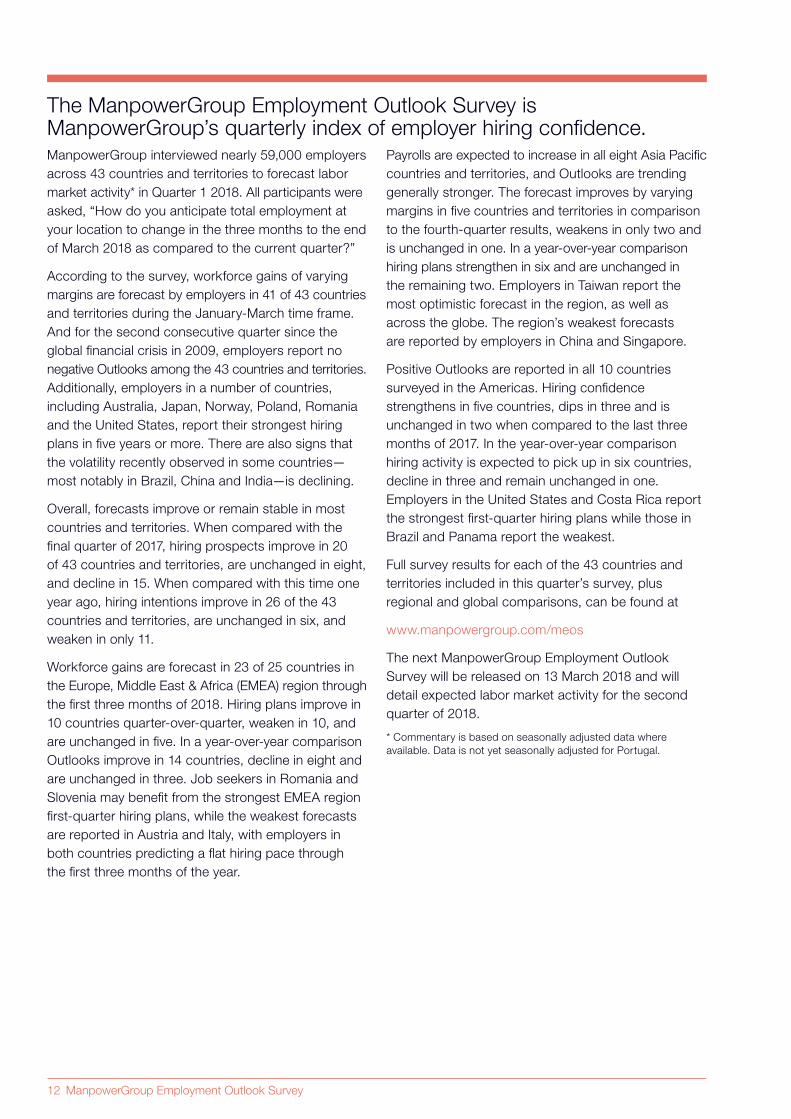
ManpowerGroup interviewed nearly 59,000 employers
across 43 countries and territories to forecast labor
market activity* in Quarter 1 2018. All participants were
asked, “How do you anticipate total employment at
your location to change in the three months to the end
of March 2018 as compared to the current quarter?”
According to the survey, workforce gains of varying
margins are forecast by employers in 41 of 43 countries
and territories during the January-March time frame.
And for the second consecutive quarter since the
global financial crisis in 2009, employers report no
negative Outlooks among the 43 countries and territories.
Additionally, employers in a number of countries,
including Australia, Japan, Norway, Poland, Romania
and the United States, report their strongest hiring
plans in five years or more. There are also signs that
the volatility recently observed in some countries—
most notably in Brazil, China and India—is declining.
Overall, forecasts improve or remain stable in most
countries and territories. When compared with the
final quarter of 2017, hiring prospects improve in 20
of 43 countries and territories, are unchanged in eight,
and decline in 15. When compared with this time one
year ago, hiring intentions improve in 26 of the 43
countries and territories, are unchanged in six, and
weaken in only 11.
Workforce gains are forecast in 23 of 25 countries in
the Europe, Middle East & Africa (EMEA) region through
the first three months of 2018. Hiring plans improve in
10 countries quarter-over-quarter, weaken in 10, and
are unchanged in five. In a year-over-year comparison
Outlooks improve in 14 countries, decline in eight and
are unchanged in three. Job seekers in Romania and
Slovenia may benefit from the strongest EMEA region
first-quarter hiring plans, while the weakest forecasts
are reported in Austria and Italy, with employers in
both countries predicting a flat hiring pace through
the first three months of the year.
Payrolls are expected to increase in all eight Asia Pacific
countries and territories, and Outlooks are trending
generally stronger. The forecast improves by varying
margins in five countries and territories in comparison
to the fourth-quarter results, weakens in only two and
is unchanged in one. In a year-over-year comparison
hiring plans strengthen in six and are unchanged in
the remaining two. Employers in Taiwan report the
most optimistic forecast in the region, as well as
across the globe. The region’s weakest forecasts
are reported by employers in China and Singapore.
Positive Outlooks are reported in all 10 countries
surveyed in the Americas. Hiring confidence
strengthens in five countries, dips in three and is
unchanged in two when compared to the last three
months of 2017. In the year-over-year comparison
hiring activity is expected to pick up in six countries,
decline in three and remain unchanged in one.
Employers in the United States and Costa Rica report
the strongest first-quarter hiring plans while those in
Brazil and Panama report the weakest.
Full survey results for each of the 43 countries and
territories included in this quarter’s survey, plus
regional and global comparisons, can be found at
www.manpowergroup.com/meos
The next ManpowerGroup Employment Outlook
Survey will be released on 13 March 2018 and will
detail expected labor market activity for the second
quarter of 2018.
* Commentary is based on seasonally adjusted data where
available. Data is not yet seasonally adjusted for Portugal.
The ManpowerGroup Employment Outlook Survey is ManpowerGroup’s quarterly index of employer hiring confidence.
ManpowerGroup Employment Outlook Survey 13
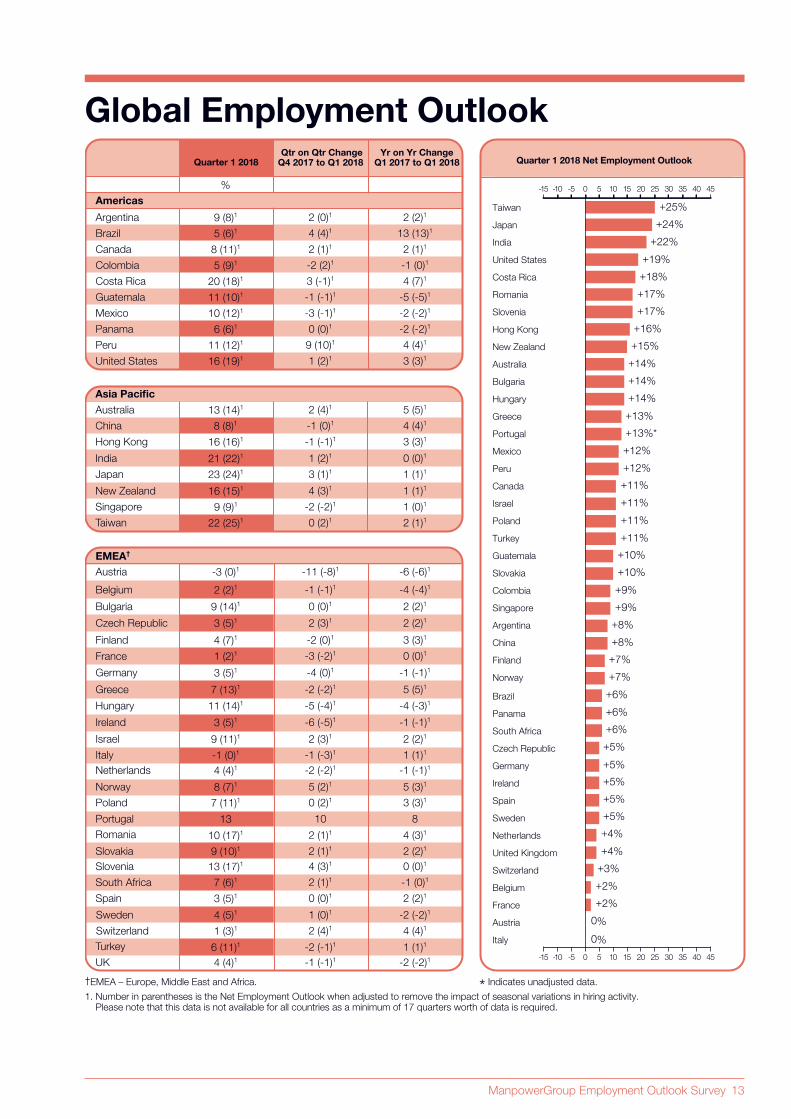
%
†EMEA – Europe, Middle East and Africa.
1. Number in parentheses is the Net Employment Outlook when adjusted to remove the impact of seasonal variations in hiring activity. Please note that this data is not available for all countries as a minimum of 17 quarters worth of data is required.
* Indicates unadjusted data.
Quarter 1 2018 Net Employment Outlook
-15 -10 -5 0 5 10 15 20 25 30 35 40 45
-15 -10 -5 0 5 10 15 20 25 30 35 40 45
Taiwan
Japan
India
United States
Costa Rica
Romania
Slovenia
Hong Kong
New Zealand
Australia
Bulgaria
Hungary
Greece
Portugal
Mexico
Peru
Canada
Israel
Poland
Turkey
Guatemala
Slovakia
Colombia
Singapore
Argentina
China
Finland
Norway
Brazil
Panama
South Africa
Czech Republic
Germany
Ireland
Spain
Sweden
Netherlands
United Kingdom
Switzerland
Belgium
France
Austria
Italy
Quarter 1 2018Qtr on Qtr Change
Q4 2017 to Q1 2018 Yr on Yr Change
Q1 2017 to Q1 2018
Americas
Asia Pacific
Australia
China
Hong Kong
Japan
India
New Zealand
Singapore
Taiwan
EMEA†
Austria
Belgium
Bulgaria
Costa Rica
Colombia
United States
Czech Republic
Greece
Hungary
South Africa
Slovenia
Slovakia
Poland
Portugal
Romania
Canada
Mexico
Peru
Brazil
Argentina
Guatemala
Panama
France
Germany
Finland
Ireland
Netherlands
Norway
Spain
Turkey
Italy
Switzerland
Sweden
Israel
UK
8 (8)1
-3 (0)1
2 (2)1
13 (14)1
23 (24)1
16 (15)1
16 (16)1
21 (22)1
9 (9)1
22 (25)1
8 (11)1
10 (12)1
11 (12)1
1 (2)1
3 (5)1
4 (4)1
1 (3)1
3 (5)1
8 (7)1
3 (5)1
4 (5)1
6 (11)1
-1 (0)1
-1 (0)1
-11 (-8)1
-1 (-1)1
2 (4)1
3 (1)1
4 (3)1
-1 (-1)1
1 (2)1
-2 (-2)1
0 (2)1
4 (4)1
-6 (-6)1
-4 (-4)1
5 (5)1
1 (1)1
1 (1)1
3 (3)1
0 (0)1
1 (0)1
2 (1)1
9 (14)1 0 (0)1 2 (2)1
20 (18)1 3 (-1)1 4 (7)15 (9)1 -2 (2)1 -1 (0)1
16 (19)1 1 (2)1 3 (3)1
3 (5)1 2 (3)1 2 (2)1
7 (13)1 -2 (-2)1 5 (5)1
11 (14)1 -5 (-4)1 -4 (-3)1
7 (6)1 2 (1)1 -1 (0)113 (17)1 4 (3)1 0 (0)19 (10)1 2 (1)1 2 (2)1
7 (11)1 0 (2)1 3 (3)1
13 10 8
10 (17)1 2 (1)1 4 (3)1
2 (1)1
-3 (-1)1
9 (10)1
2 (1)15 (6)1 4 (4)1 13 (13)19 (8)1 2 (0)1 2 (2)1
-2 (-2)111 (10)1 -1 (-1)1 -5 (-5)1
4 (4)16 (6)1 0 (0)1 -2 (-2)1
-3 (-2)1
-4 (0)1
0 (0)14 (7)1 -2 (0)1 3 (3)1
-1 (-1)1
-2 (-2)1
2 (4)1
-6 (-5)1
5 (2)1
0 (0)1
1 (0)1
-2 (-1)1
-1 (-3)1
-1 (-1)1
4 (4)1
-1 (-1)1
9 (11)1 2 (3)1 2 (2)1
5 (3)1
2 (2)1
-2 (-2)1
1 (1)1
4 (4)1 -1 (-1)1 -2 (-2)1
1 (1)1
+25%
+24%
+22%
+19%
+18%
+17%
+17%
+16%
+15%
+14%
+14%
+14%
+13%
+13%*
+12%
+12%
+11%
+11%
+11%
+11%
+10%
+10%
+9%
+9%
+8%
+8%
+7%
+7%
+6%
+6%
+6%
+5%
+5%
+5%
+5%
+5%
+4%
+4%
+3%
+2%
+2%
0%
0%
Global Employment Outlook
14 ManpowerGroup Employment Outlook Survey
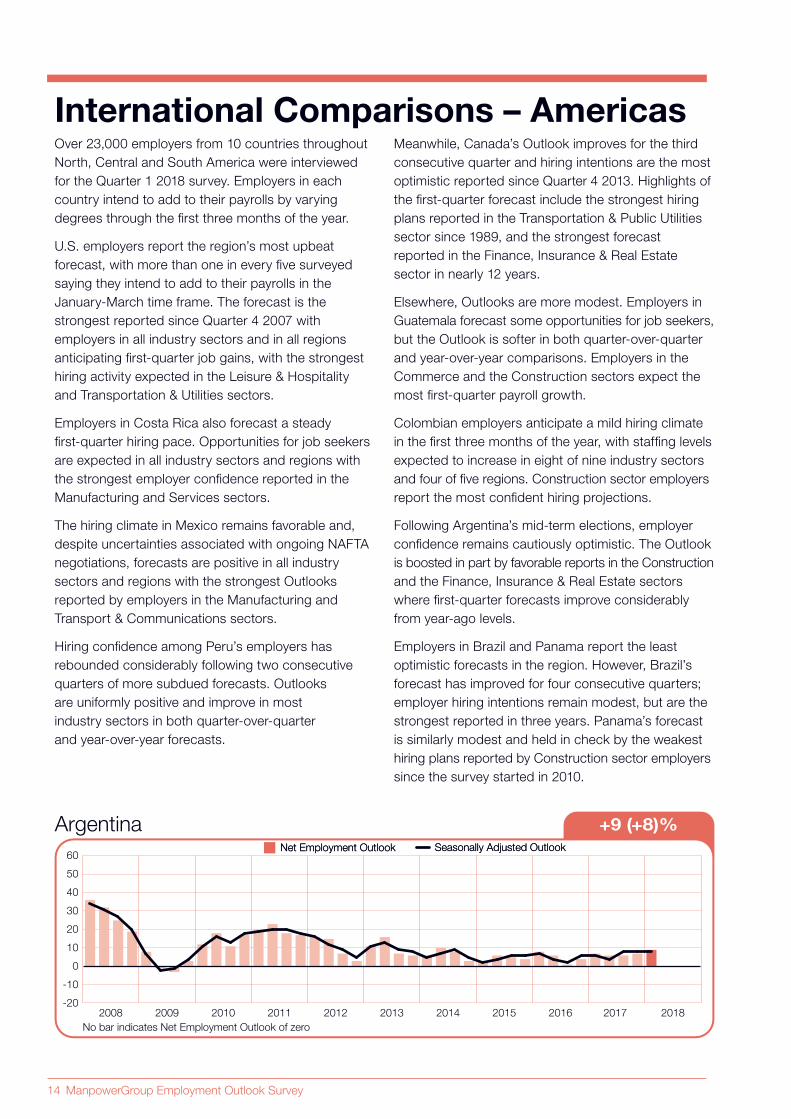
Over 23,000 employers from 10 countries throughout
North, Central and South America were interviewed
for the Quarter 1 2018 survey. Employers in each
country intend to add to their payrolls by varying
degrees through the first three months of the year.
U.S. employers report the region’s most upbeat
forecast, with more than one in every five surveyed
saying they intend to add to their payrolls in the
January-March time frame. The forecast is the
strongest reported since Quarter 4 2007 with
employers in all industry sectors and in all regions
anticipating first-quarter job gains, with the strongest
hiring activity expected in the Leisure & Hospitality
and Transportation & Utilities sectors.
Employers in Costa Rica also forecast a steady
first-quarter hiring pace. Opportunities for job seekers
are expected in all industry sectors and regions with
the strongest employer confidence reported in the
Manufacturing and Services sectors.
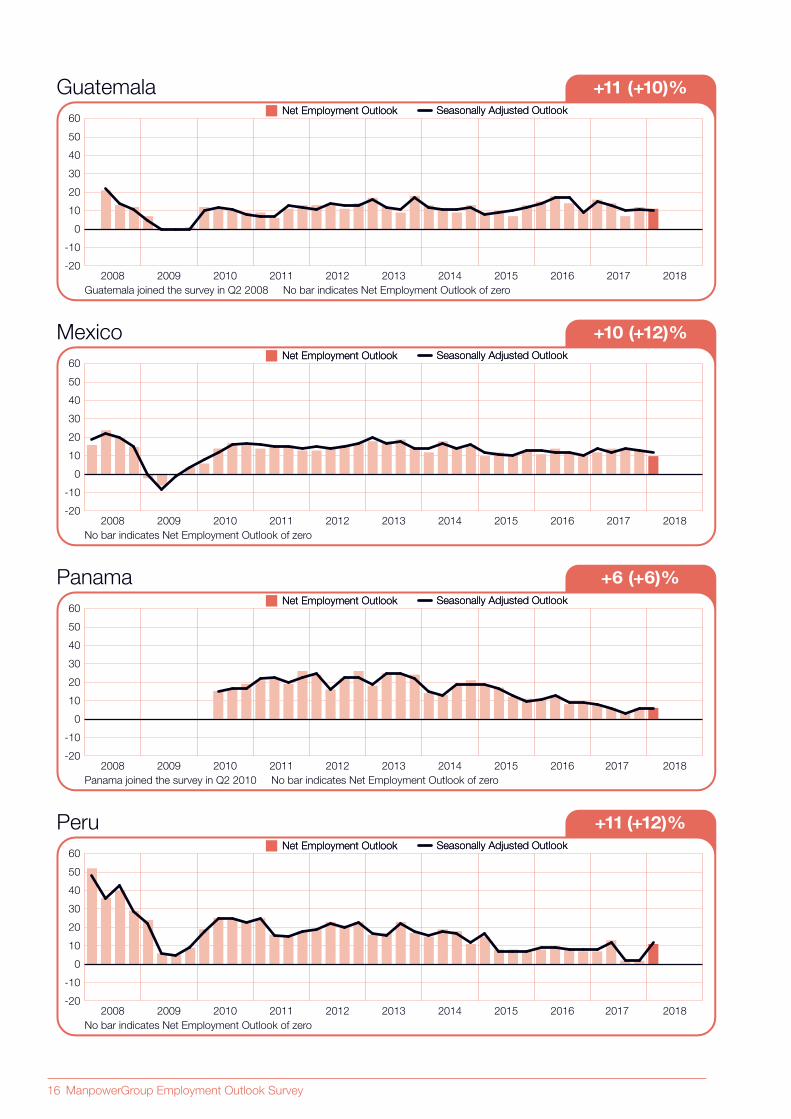
The hiring climate in Mexico remains favorable and,
despite uncertainties associated with ongoing NAFTA
negotiations, forecasts are positive in all industry
sectors and regions with the strongest Outlooks
reported by employers in the Manufacturing and
Transport & Communications sectors.
Hiring confidence among Peru’s employers has
rebounded considerably following two consecutive
quarters of more subdued forecasts. Outlooks
are uniformly positive and improve in most
industry sectors in both quarter-over-quarter
and year-over-year forecasts.
International Comparisons – AmericasMeanwhile, Canada’s Outlook improves for the third
consecutive quarter and hiring intentions are the most
optimistic reported since Quarter 4 2013. Highlights of
the first-quarter forecast include the strongest hiring
plans reported in the Transportation & Public Utilities
sector since 1989, and the strongest forecast
reported in the Finance, Insurance & Real Estate
sector in nearly 12 years.
Elsewhere, Outlooks are more modest. Employers in
Guatemala forecast some opportunities for job seekers,
but the Outlook is softer in both quarter-over-quarter
and year-over-year comparisons. Employers in the
Commerce and the Construction sectors expect the
most first-quarter payroll growth.
Colombian employers anticipate a mild hiring climate
in the first three months of the year, with staffing levels
expected to increase in eight of nine industry sectors
and four of five regions. Construction sector employers
report the most confident hiring projections.
Following Argentina’s mid-term elections, employer
confidence remains cautiously optimistic. The Outlook
is boosted in part by favorable reports in the Construction
and the Finance, Insurance & Real Estate sectors
where first-quarter forecasts improve considerably
from year-ago levels.
Employers in Brazil and Panama report the least
optimistic forecasts in the region. However, Brazil’s
forecast has improved for four consecutive quarters;
employer hiring intentions remain modest, but are the
strongest reported in three years. Panama’s forecast
is similarly modest and held in check by the weakest
hiring plans reported by Construction sector employers
since the survey started in 2010.
Argentina +9 (+8)%
Seasonally Adjusted OutlookSeasonally Adjusted OutlookNet Employment OutlookNet Employment Outlook
No bar indicates Net Employment Outlook of zero
20092008 2010 2011 2012 2013 2014 2015 2016 2017 2018-20
-10
0
10
20
30
40
50
60

ManpowerGroup Employment Outlook Survey 15
Brazil +5 (+6)%
Seasonally Adjusted OutlookSeasonally Adjusted OutlookNet Employment OutlookNet Employment Outlook
Brazil joined the survey in Q4 2009 No bar indicates Net Employment Outlook of zero
20092008 2010 2011 2012 2013 2014 2015 2016 2017 2018-20
-10
0
10
20
30
40
50
60
Canada +8 (+11)%
Seasonally Adjusted OutlookNet Employment Outlook
No bar indicates Net Employment Outlook of zero
20092008 2010 2011 2012 2013 2014 2015 2016 2017 2018-20
-10
0
10
20
30
40
50
60
Colombia +5 (+9)%
Seasonally Adjusted OutlookSeasonally Adjusted OutlookNet Employment OutlookNet Employment Outlook
Colombia joined the survey in Q4 2008 No bar indicates Net Employment Outlook of zero
20092008 2010 2011 2012 2013 2014 2015 2016 2017 2018-20
-10
0
10
20
30
40
50
60
Costa Rica +20 (+18)%
Seasonally Adjusted OutlookSeasonally Adjusted OutlookNet Employment OutlookNet Employment Outlook
No bar indicates Net Employment Outlook of zero
20092008 2010 2011 2012 2013 2014 2015 2016 2017 2018-20
-10
0
10
20
30
40
50
60
16 ManpowerGroup Employment Outlook Survey
Guatemala +11 (+10)%
Seasonally Adjusted OutlookSeasonally Adjusted OutlookNet Employment OutlookNet Employment Outlook
Guatemala joined the survey in Q2 2008 No bar indicates Net Employment Outlook of zero
20092008 2010 2011 2012 2013 2014 2015 2016 2017 2018-20
-10
0
10
20
30
40
50
60
Mexico +10 (+12)%
Seasonally Adjusted OutlookSeasonally Adjusted OutlookNet Employment OutlookNet Employment Outlook
No bar indicates Net Employment Outlook of zero
20092008 2010 2011 2012 2013 2014 2015 2016 2017 2018-20
-10
0
10
20
30
40
50
60
Panama +6 (+6)%
Seasonally Adjusted OutlookSeasonally Adjusted OutlookNet Employment OutlookNet Employment Outlook
Panama joined the survey in Q2 2010 No bar indicates Net Employment Outlook of zero
20092008 2010 2011 2012 2013 2014 2015 2016 2017 2018-20
-10
0
10
20
30
40
50
60
Peru +11 (+12)%
Seasonally Adjusted OutlookSeasonally Adjusted OutlookNet Employment OutlookNet Employment Outlook
No bar indicates Net Employment Outlook of zero
20092008 2010 2011 2012 2013 2014 2015 2016 2017 2018-20
-10
0
10
20
30
40
50
60

ManpowerGroup Employment Outlook Survey 17
+16 (+19)%United States of AmericaSeasonally Adjusted OutlookSeasonally Adjusted OutlookNet Employment OutlookNet Employment Outlook
No bar indicates Net Employment Outlook of zero
20092008 2010 2011 2012 2013 2014 2015 2016 2017 2018-20
-10
0
10
20
30
40
50
60
18 ManpowerGroup Employment Outlook Survey
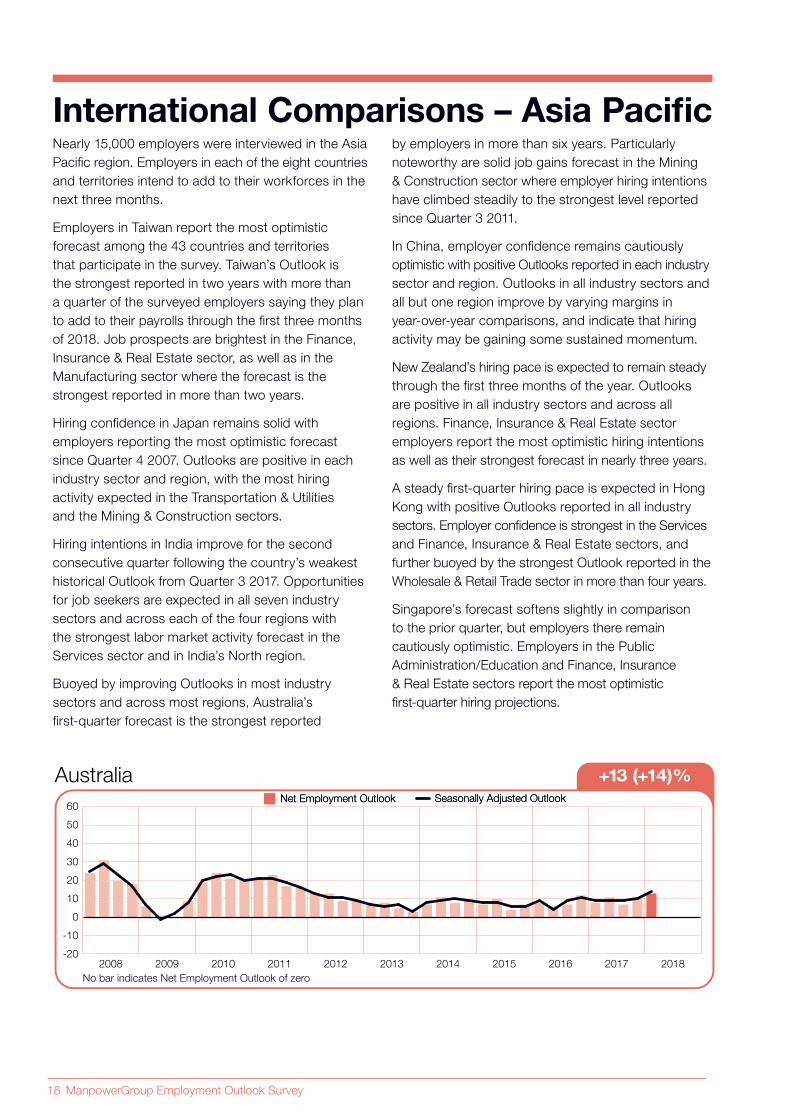
Nearly 15,000 employers were interviewed in the Asia
Pacific region. Employers in each of the eight countries
and territories intend to add to their workforces in the
next three months.
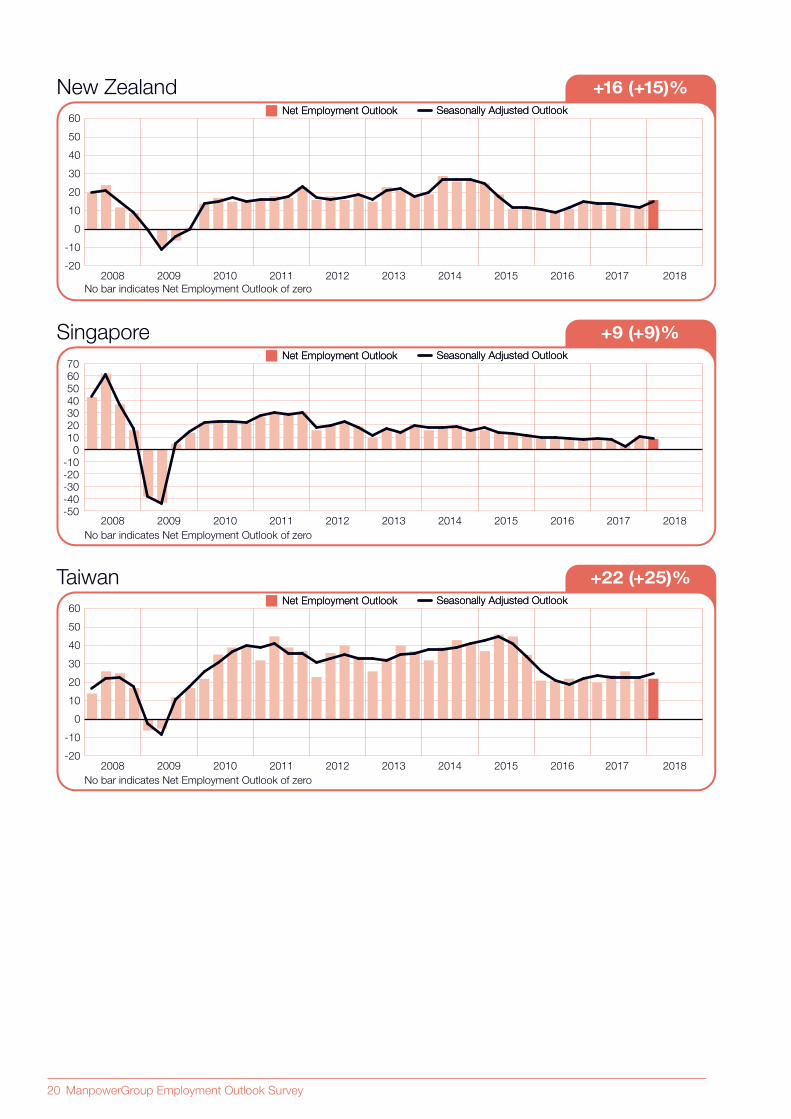
Employers in Taiwan report the most optimistic
forecast among the 43 countries and territories
that participate in the survey. Taiwan’s Outlook is
the strongest reported in two years with more than
a quarter of the surveyed employers saying they plan
to add to their payrolls through the first three months
of 2018. Job prospects are brightest in the Finance,
Insurance & Real Estate sector, as well as in the
Manufacturing sector where the forecast is the
strongest reported in more than two years.
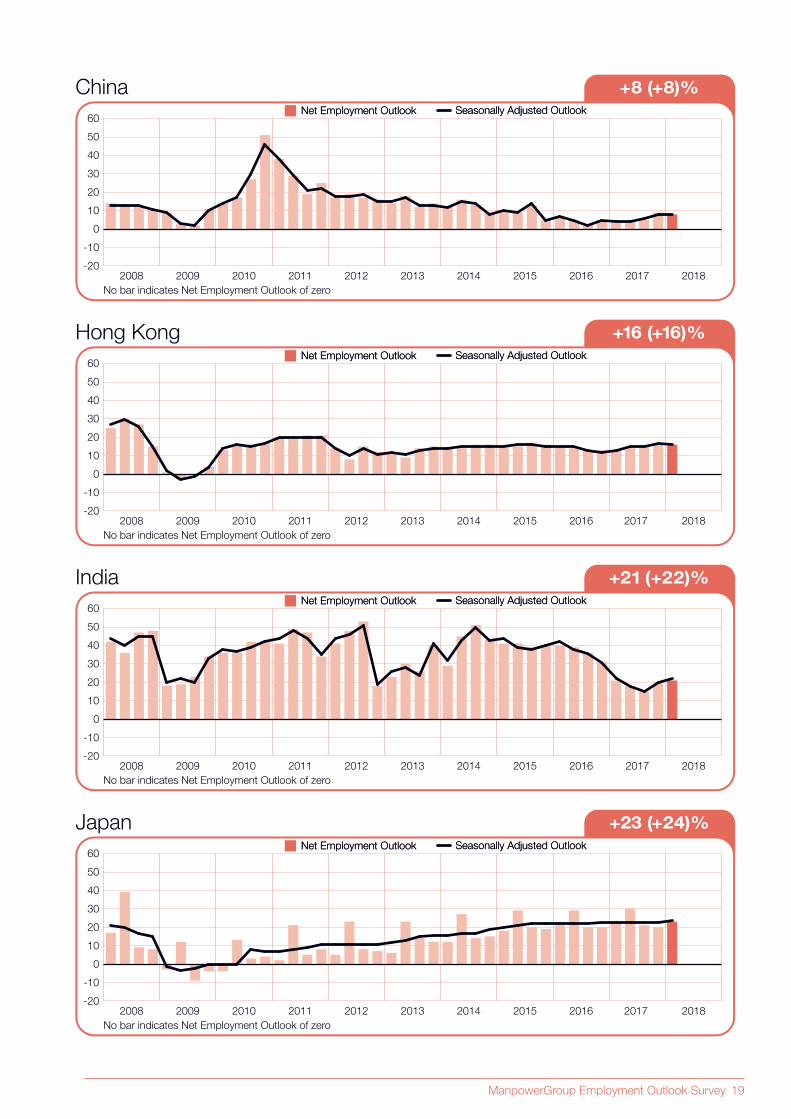
Hiring confidence in Japan remains solid with
employers reporting the most optimistic forecast
since Quarter 4 2007. Outlooks are positive in each
industry sector and region, with the most hiring
activity expected in the Transportation & Utilities
and the Mining & Construction sectors.
Hiring intentions in India improve for the second
consecutive quarter following the country’s weakest
historical Outlook from Quarter 3 2017. Opportunities
for job seekers are expected in all seven industry
sectors and across each of the four regions with
the strongest labor market activity forecast in the
Services sector and in India’s North region.
Buoyed by improving Outlooks in most industry
sectors and across most regions, Australia’s
first-quarter forecast is the strongest reported
International Comparisons – Asia Pacificby employers in more than six years. Particularly
noteworthy are solid job gains forecast in the Mining
& Construction sector where employer hiring intentions
have climbed steadily to the strongest level reported
since Quarter 3 2011.
In China, employer confidence remains cautiously
optimistic with positive Outlooks reported in each industry
sector and region. Outlooks in all industry sectors and
all but one region improve by varying margins in
year-over-year comparisons, and indicate that hiring
activity may be gaining some sustained momentum.
New Zealand’s hiring pace is expected to remain steady
through the first three months of the year. Outlooks
are positive in all industry sectors and across all
regions. Finance, Insurance & Real Estate sector
employers report the most optimistic hiring intentions
as well as their strongest forecast in nearly three years.
A steady first-quarter hiring pace is expected in Hong
Kong with positive Outlooks reported in all industry
sectors. Employer confidence is strongest in the Services
and Finance, Insurance & Real Estate sectors, and
further buoyed by the strongest Outlook reported in the
Wholesale & Retail Trade sector in more than four years.
Singapore’s forecast softens slightly in comparison
to the prior quarter, but employers there remain
cautiously optimistic. Employers in the Public
Administration/Education and Finance, Insurance
& Real Estate sectors report the most optimistic
first-quarter hiring projections.
Australia +13 (+14)%
Seasonally Adjusted OutlookSeasonally Adjusted OutlookNet Employment OutlookNet Employment Outlook
No bar indicates Net Employment Outlook of zero
20092008 2010 2011 2012 2013 2014 2015 2016 2017 2018-20
-10
0
10
20
30
40
50
60
ManpowerGroup Employment Outlook Survey 19
+8 (+8)%China Seasonally Adjusted OutlookSeasonally Adjusted OutlookNet Employment OutlookNet Employment Outlook
No bar indicates Net Employment Outlook of zero
20092008 2010 2011 2012 2013 2014 2015 2016 2017 2018-20
-10
0
10
20
30
40
50
60
Hong Kong +16 (+16)%
Seasonally Adjusted OutlookSeasonally Adjusted OutlookNet Employment OutlookNet Employment Outlook
No bar indicates Net Employment Outlook of zero
20092008 2010 2011 2012 2013 2014 2015 2016 2017 2018-20
-10
0
10
20
30
40
50
60
+21 (+22)%India Seasonally Adjusted OutlookSeasonally Adjusted OutlookNet Employment OutlookNet Employment Outlook
No bar indicates Net Employment Outlook of zero
20092008 2010 2011 2012 2013 2014 2015 2016 2017 2018-20
-10
0
10
20
30
40
50
60
Japan +23 (+24)%
Seasonally Adjusted OutlookSeasonally Adjusted OutlookNet Employment OutlookNet Employment Outlook
No bar indicates Net Employment Outlook of zero
20092008 2010 2011 2012 2013 2014 2015 2016 2017 2018
40
-20
-10
0
10
20
30
50
60
20 ManpowerGroup Employment Outlook Survey
New Zealand +16 (+15)%
Seasonally Adjusted OutlookSeasonally Adjusted OutlookNet Employment OutlookNet Employment Outlook
No bar indicates Net Employment Outlook of zero
20092008 2010 2011 2012 2013 2014 2015 2016 2017 2018-20
-10
0
10
20
30
40
50
60
Singapore +9 (+9)%
Seasonally Adjusted OutlookSeasonally Adjusted OutlookNet Employment OutlookNet Employment Outlook
No bar indicates Net Employment Outlook of zero
20092008 2010 2011 2012 2013 2014 2015 2016 2017 2018-50
-40
-30
-20
-10
0
10
20
30
40
50
60
70
Taiwan +22 (+25)%
Seasonally Adjusted OutlookSeasonally Adjusted OutlookNet Employment OutlookNet Employment Outlook
No bar indicates Net Employment Outlook of zero
20092008 2010 2011 2012 2013 2014 2015 2016 2017 2018-20
-10
0
10
20
30
40
50
60
ManpowerGroup Employment Outlook Survey 21
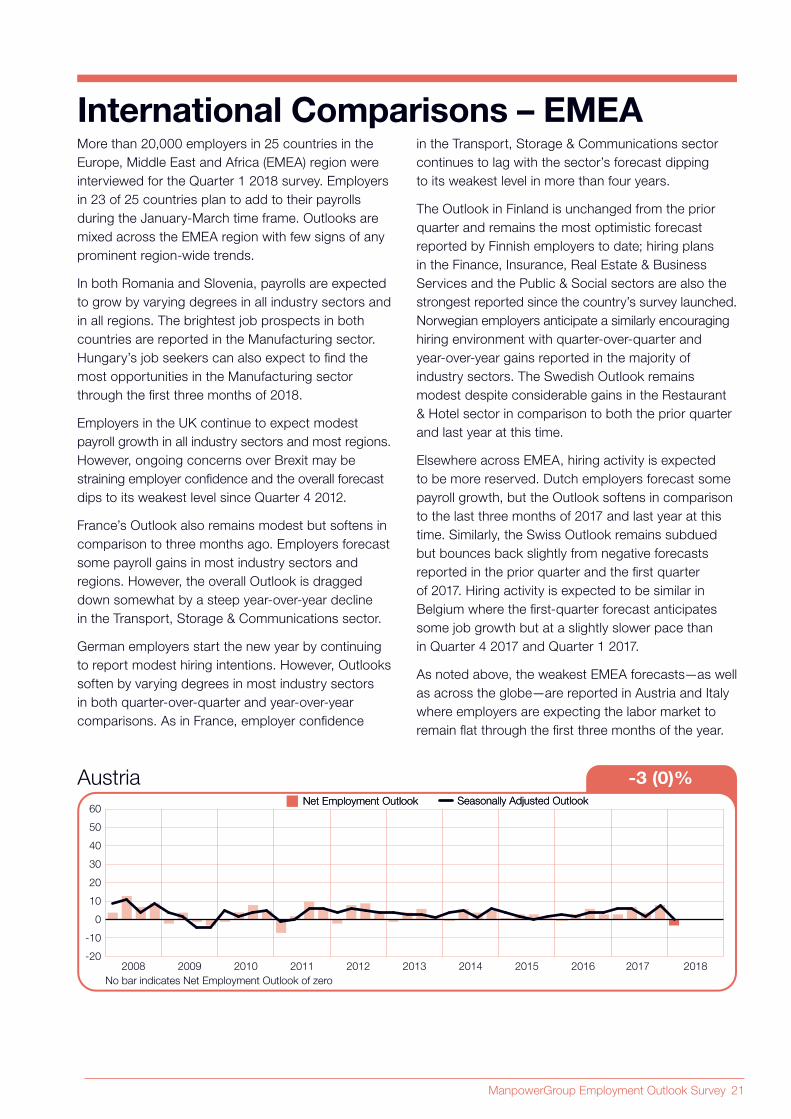
More than 20,000 employers in 25 countries in the
Europe, Middle East and Africa (EMEA) region were
interviewed for the Quarter 1 2018 survey. Employers
in 23 of 25 countries plan to add to their payrolls
during the January-March time frame. Outlooks are
mixed across the EMEA region with few signs of any
prominent region-wide trends.
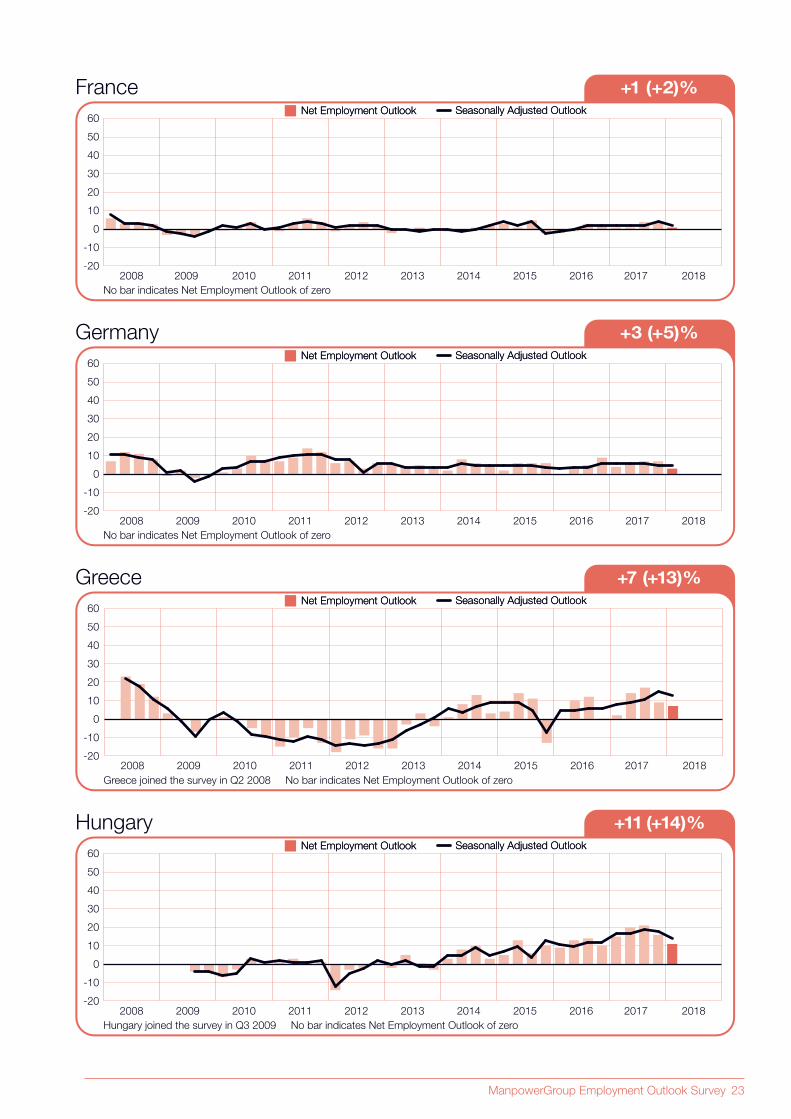
In both Romania and Slovenia, payrolls are expected
to grow by varying degrees in all industry sectors and
in all regions. The brightest job prospects in both
countries are reported in the Manufacturing sector.
Hungary’s job seekers can also expect to find the
most opportunities in the Manufacturing sector
through the first three months of 2018.
Employers in the UK continue to expect modest
payroll growth in all industry sectors and most regions.
However, ongoing concerns over Brexit may be
straining employer confidence and the overall forecast
dips to its weakest level since Quarter 4 2012.
France’s Outlook also remains modest but softens in
comparison to three months ago. Employers forecast
some payroll gains in most industry sectors and
regions. However, the overall Outlook is dragged
down somewhat by a steep year-over-year decline
in the Transport, Storage & Communications sector.
German employers start the new year by continuing
to report modest hiring intentions. However, Outlooks
soften by varying degrees in most industry sectors
in both quarter-over-quarter and year-over-year
comparisons. As in France, employer confidence
International Comparisons – EMEAin the Transport, Storage & Communications sector
continues to lag with the sector’s forecast dipping
to its weakest level in more than four years.
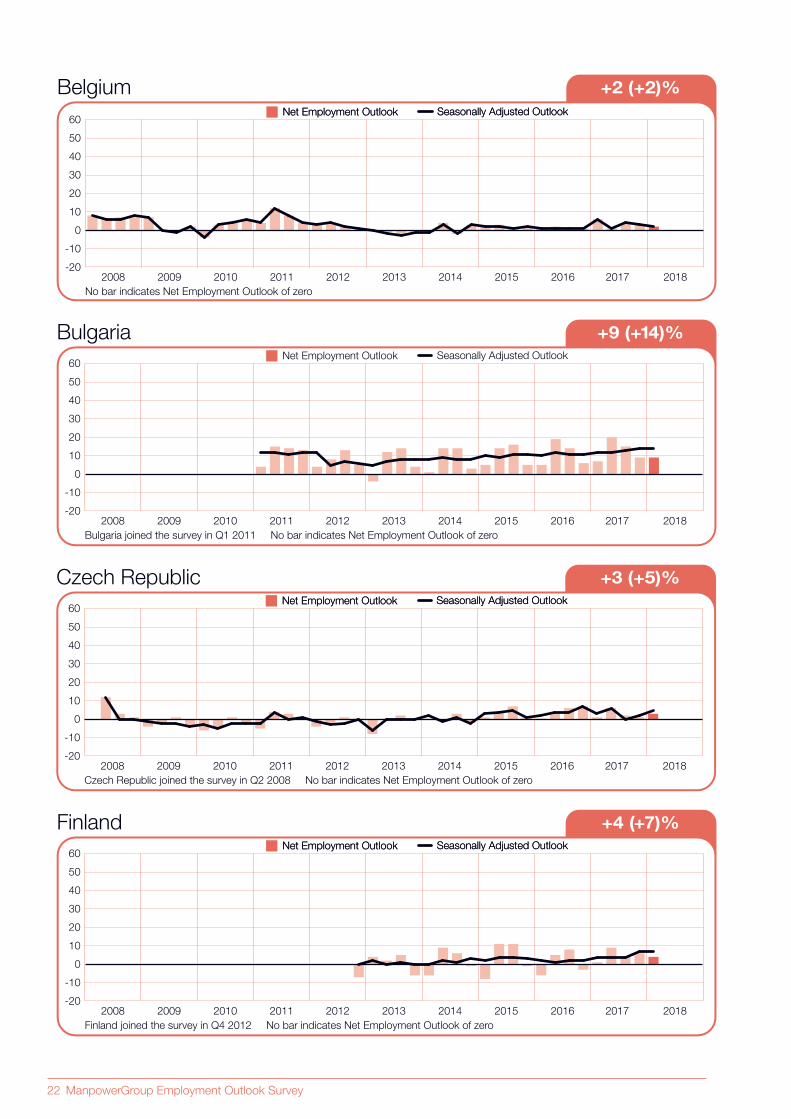
The Outlook in Finland is unchanged from the prior
quarter and remains the most optimistic forecast
reported by Finnish employers to date; hiring plans
in the Finance, Insurance, Real Estate & Business
Services and the Public & Social sectors are also the
strongest reported since the country’s survey launched.
Norwegian employers anticipate a similarly encouraging
hiring environment with quarter-over-quarter and
year-over-year gains reported in the majority of
industry sectors. The Swedish Outlook remains
modest despite considerable gains in the Restaurant
& Hotel sector in comparison to both the prior quarter
and last year at this time.
Elsewhere across EMEA, hiring activity is expected
to be more reserved. Dutch employers forecast some
payroll growth, but the Outlook softens in comparison
to the last three months of 2017 and last year at this
time. Similarly, the Swiss Outlook remains subdued
but bounces back slightly from negative forecasts
reported in the prior quarter and the first quarter
of 2017. Hiring activity is expected to be similar in
Belgium where the first-quarter forecast anticipates
some job growth but at a slightly slower pace than
in Quarter 4 2017 and Quarter 1 2017.
As noted above, the weakest EMEA forecasts—as well
as across the globe—are reported in Austria and Italy
where employers are expecting the labor market to
remain flat through the first three months of the year.
Austria -3 (0)%
Seasonally Adjusted OutlookSeasonally Adjusted OutlookNet Employment OutlookNet Employment Outlook
No bar indicates Net Employment Outlook of zero
20092008 2010 2011 2012 2013 2014 2015 2016 2017 2018-20
-10
0
10
20
30
40
50
60
22 ManpowerGroup Employment Outlook Survey
Belgium +2 (+2)%
Seasonally Adjusted OutlookSeasonally Adjusted OutlookNet Employment OutlookNet Employment Outlook
No bar indicates Net Employment Outlook of zero
20092008 2010 2011 2012 2013 2014 2015 2016 2017 2018-20
-10
0
10
20
30
40
50
60
Bulgaria +9 (+14)%
Bulgaria joined the survey in Q1 2011 No bar indicates Net Employment Outlook of zero
20092008 2010 2011 2012 2013 2014 2015 2016 2017 2018
Seasonally Adjusted OutlookNet Employment Outlook
-20
-10
0
10
20
30
40
50
60
Czech Republic +3 (+5)%
Seasonally Adjusted OutlookSeasonally Adjusted OutlookNet Employment OutlookNet Employment Outlook
Czech Republic joined the survey in Q2 2008 No bar indicates Net Employment Outlook of zero
20092008 2010 2011 2012 2013 2014 2015 2016 2017 2018-20
-10
0
10
20
30
40
50
60
Finland +4 (+7)%
Finland joined the survey in Q4 2012 No bar indicates Net Employment Outlook of zero
20092008 2010 2011 2012 2013 2014 2015 2016 2017 2018
Seasonally Adjusted OutlookSeasonally Adjusted OutlookNet Employment OutlookNet Employment Outlook
-20
-10
0
10
20
30
40
50
60
ManpowerGroup Employment Outlook Survey 23
France +1 (+2)%
Seasonally Adjusted OutlookSeasonally Adjusted OutlookNet Employment OutlookNet Employment Outlook
No bar indicates Net Employment Outlook of zero
2009 2008 2010 2011 2012 2013 2014 2015 2016 2017 2018-20
-10
0
10
20
30
40
50
60
Germany +3 (+5)%
Seasonally Adjusted OutlookSeasonally Adjusted OutlookNet Employment OutlookNet Employment Outlook
No bar indicates Net Employment Outlook of zero
20092008 2010 2011 2012 2013 2014 2015 2016 2017 2018-20
-10
0
10
20
30
40
50
60
Greece +7 (+13)%
20092008 2010 2011 2012 2013 2014 2015 2016 2017 2018
Seasonally Adjusted OutlookSeasonally Adjusted OutlookNet Employment OutlookNet Employment Outlook
Greece joined the survey in Q2 2008 No bar indicates Net Employment Outlook of zero
-20
-10
0
10
20
30
40
50
60
Hungary +11 (+14)%
Seasonally Adjusted OutlookSeasonally Adjusted OutlookNet Employment OutlookNet Employment Outlook
Hungary joined the survey in Q3 2009 No bar indicates Net Employment Outlook of zero
20092008 2010 2011 2012 2013 2014 2015 2016 2017 2018-20
-10
0
10
20
30
40
50
60
24 ManpowerGroup Employment Outlook Survey
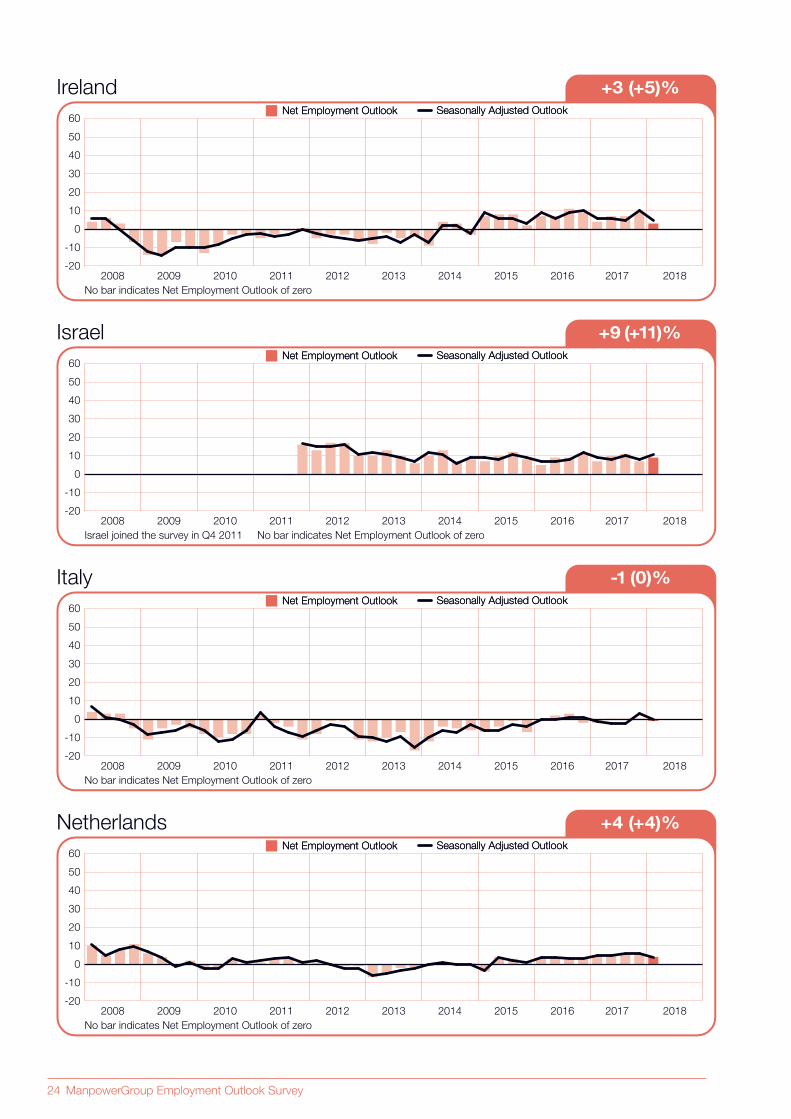
Ireland +3 (+5)%
Seasonally Adjusted OutlookSeasonally Adjusted OutlookNet Employment OutlookNet Employment Outlook
No bar indicates Net Employment Outlook of zero
20092008 2010 2011 2012 2013 2014 2015 2016 2017 2018-20
-10
0
10
20
30
40
50
60
Israel +9 (+11)%
Israel joined the survey in Q4 2011 No bar indicates Net Employment Outlook of zero
20092008 2010 2011 2012 2013 2014 2015 2016 2017 2018
Seasonally Adjusted OutlookSeasonally Adjusted OutlookNet Employment OutlookNet Employment Outlook
-20
-10
0
10
20
30
40
50
60
Italy -1 (0)%
Seasonally Adjusted OutlookSeasonally Adjusted OutlookNet Employment OutlookNet Employment Outlook
No bar indicates Net Employment Outlook of zero
20092008 2010 2011 2012 2013 2014 2015 2016 2017 2018
20
-20
-10
0
10
30
40
50
60
Netherlands +4 (+4)%
Seasonally Adjusted OutlookSeasonally Adjusted OutlookNet Employment OutlookNet Employment Outlook
No bar indicates Net Employment Outlook of zero
20092008 2010 2011 2012 2013 2014 2015 2016 2017 2018-20
-10
0
10
20
30
40
50
60
ManpowerGroup Employment Outlook Survey 25
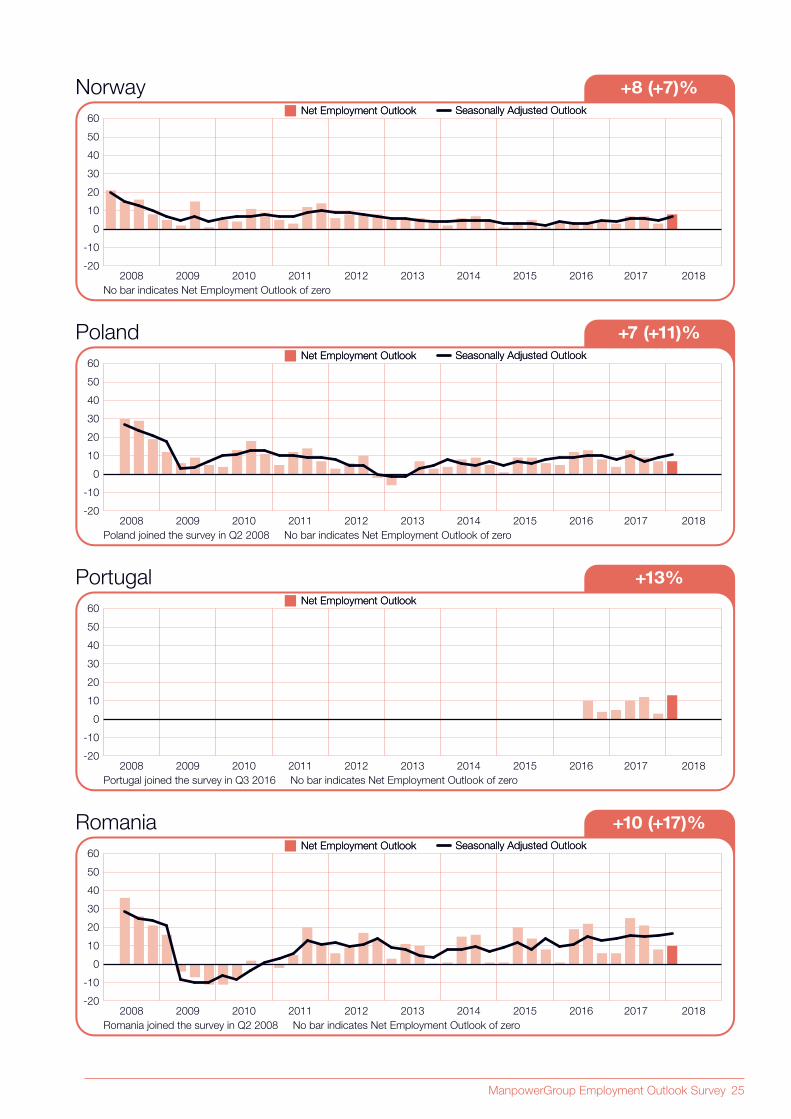
Norway +8 (+7)%
20092008 2010 2011 2012 2013 2014 2015 2016 2017 2018
Seasonally Adjusted OutlookSeasonally Adjusted OutlookNet Employment OutlookNet Employment Outlook
No bar indicates Net Employment Outlook of zero
-20
-10
0
10
20
30
40
50
60
Poland +7 (+11)%
Seasonally Adjusted OutlookSeasonally Adjusted OutlookNet Employment OutlookNet Employment Outlook
Poland joined the survey in Q2 2008 No bar indicates Net Employment Outlook of zero
20092008 2010 2011 2012 2013 2014 2015 2016 2017 2018-20
-10
0
10
20
30
40
50
60
Portugal +13%
Net Employment OutlookNet Employment Outlook
Portugal joined the survey in Q3 2016 No bar indicates Net Employment Outlook of zero
20092008 2010 2011 2012 2013 2014 2015 2016 2017 2018-20
-10
0
10
20
30
40
50
60
Romania +10 (+17)%
Seasonally Adjusted OutlookSeasonally Adjusted OutlookNet Employment OutlookNet Employment Outlook
Romania joined the survey in Q2 2008 No bar indicates Net Employment Outlook of zero
20092008 2010 2011 2012 2013 2014 2015 2016 2017 2018-20
-10
0
10
20
30
40
50
60
26 ManpowerGroup Employment Outlook Survey
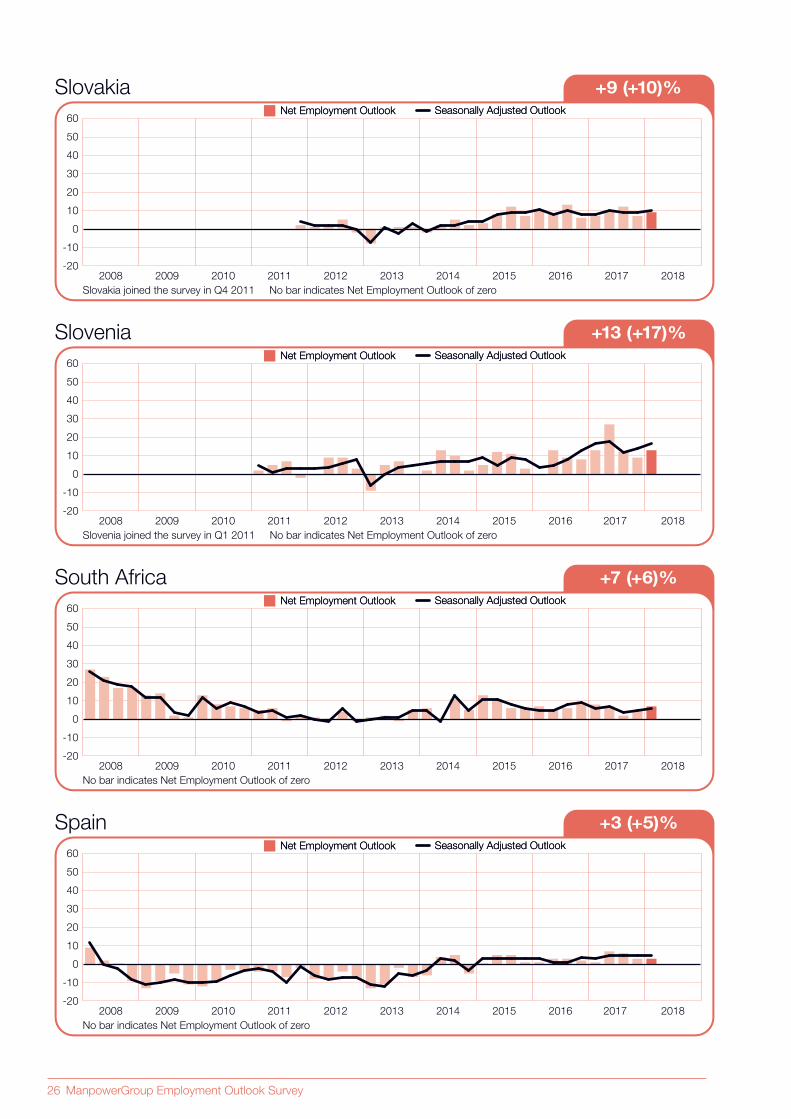
Slovenia +13 (+17)%
Slovenia joined the survey in Q1 2011 No bar indicates Net Employment Outlook of zero
20092008 2010 2011 2012 2013 2014 2015 2016 2017 2018
Seasonally Adjusted OutlookSeasonally Adjusted OutlookNet Employment OutlookNet Employment Outlook
-20
-10
0
10
20
30
40
50
60
South Africa +7 (+6)%
Seasonally Adjusted OutlookSeasonally Adjusted OutlookNet Employment OutlookNet Employment Outlook
No bar indicates Net Employment Outlook of zero
20092008 2010 2011 2012 2013 2014 2015 2016 2017 2018-20
-10
0
10
20
30
40
50
60
Spain +3 (+5)%
Seasonally Adjusted OutlookSeasonally Adjusted OutlookNet Employment OutlookNet Employment Outlook
No bar indicates Net Employment Outlook of zero
20092008 2010 2011 2012 2013 2014 2015 2016 2017 2018-20
-10
0
10
20
30
40
50
60
Slovakia +9 (+10)%
Net Employment OutlookNet Employment Outlook
Slovakia joined the survey in Q4 2011 No bar indicates Net Employment Outlook of zero
20092008 2010 2011 2012 2013 2014 2015 2016 2017 2018
Seasonally Adjusted OutlookSeasonally Adjusted Outlook
-20
-10
0
10
20
30
40
50
60
ManpowerGroup Employment Outlook Survey 27
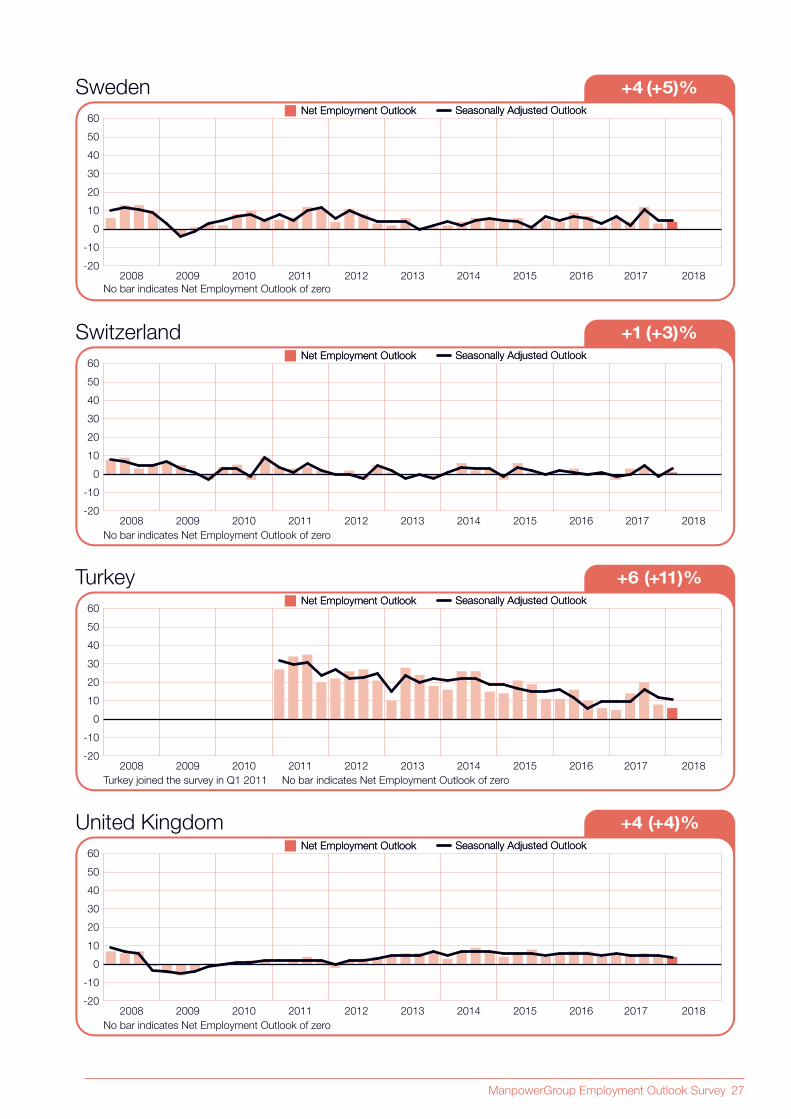
Switzerland +1 (+3)%
Seasonally Adjusted OutlookSeasonally Adjusted OutlookNet Employment OutlookNet Employment Outlook
No bar indicates Net Employment Outlook of zero
20092008 2010 2011 2012 2013 2014 2015 2016 2017 2018-20
-10
0
10
20
30
40
50
60
Turkey +6 (+11)%
Turkey joined the survey in Q1 2011 No bar indicates Net Employment Outlook of zero
20092008 2010 2011 2012 2013 2014 2015 2016 2017 2018
Seasonally Adjusted OutlookSeasonally Adjusted OutlookNet Employment OutlookNet Employment Outlook
-20
-10
0
10
20
30
40
50
60
United Kingdom +4 (+4)%
Seasonally Adjusted OutlookSeasonally Adjusted OutlookNet Employment OutlookNet Employment Outlook
No bar indicates Net Employment Outlook of zero
20092008 2010 2011 2012 2013 2014 2015 2016 2017 2018-20
-10
0
10
20
30
40
50
60
Sweden +4 (+5)%
Seasonally Adjusted OutlookSeasonally Adjusted OutlookNet Employment OutlookNet Employment Outlook
No bar indicates Net Employment Outlook of zero
20092008 2010 2011 2012 2013 2014 2015 2016 2017 2018-20
-10
0
10
20
30
40
50
60
28 ManpowerGroup Employment Outlook Survey
The ManpowerGroup Employment Outlook Survey is
conducted quarterly to measure employers’ intentions
to increase or decrease the number of employees
in their workforces during the next quarter.
ManpowerGroup’s comprehensive forecast of
employer hiring plans has been running for more
than 50 years and is one of the most trusted surveys
of employment activity in the world. Various factors
underpin the success of the ManpowerGroup
Employment Outlook Survey:
Unique: It is unparalleled in its size, scope, longevity
and area of focus.
Projective: The ManpowerGroup Employment
Outlook Survey is the most extensive, forward-looking
employment survey in the world, asking employers to
forecast employment over the next quarter. In contrast,
other surveys and studies focus on retrospective data
to report on what occurred in the past.
Independent: The survey is conducted with a
representative sample of employers from throughout
the countries and territories in which it is conducted.
The survey participants are not derived from
ManpowerGroup’s customer base.
Robust: The survey is based on interviews with
nearly 59,000 public and private employers across
43 countries and territories to measure anticipated
employment trends each quarter. This sample allows
for analysis to be performed across specific sectors
and regions to provide more detailed information.
Focused: For more than 55 years the survey has
derived all of its information from a single question:
For the Quarter 1 2018 research, all employers
participating in the survey worldwide are asked
the same question, “How do you anticipate total
employment at your location to change in the three
months to the end of March 2018 as compared
to the current quarter?”
About the ManpowerGroup Employment Outlook Survey
MethodologyThe ManpowerGroup Employment Outlook Survey
is conducted using a validated methodology, in
accordance with the highest standards in market
research. The survey has been structured to be
representative of each national economy. The margin
of error for all national, regional and global data is not
greater than +/- 3.9%.
Throughout this report, we use the term “Net
Employment Outlook.” This figure is derived by taking
the percentage of employers anticipating an increase
in hiring activity and subtracting from this the
percentage of employers expecting to see a decrease
in employment at their location in the next quarter.
The result of this calculation is the Net Employment
Outlook. Net Employment Outlooks for countries and
territories that have accumulated at least 17 quarters
of data are reported in a seasonally adjusted format
unless otherwise stated.
Seasonal adjustments have been applied to the
data for all participating countries except Portugal.
ManpowerGroup intends to add seasonal adjustments
to the Portuguese data in the future, as more historical
data is compiled. Note that in Quarter 2 2008,
ManpowerGroup adopted the TRAMO-SEATS method
of seasonal adjustment for data.

ManpowerGroup Employment Outlook Survey 29
ManpowerGroup (NYSE: MAN), the leading global
workforce solutions company, helps organizations
transform in a fast-changing world of work by
sourcing, assessing, developing and managing the
talent that enables them to win. We develop innovative
solutions for over 400,000 clients and connect 3+
million people to meaningful, sustainable work across
a wide range of industries and skills. Our expert family
of brands—Manpower®, Experis®, Right Management®
and ManpowerGroup® Solutions—creates substantially
more value for candidates and clients across 80 countries
and territories and has done so for nearly 70 years. In
2017, ManpowerGroup was named one of the World’s
Most Ethical Companies for the seventh consecutive
year and one of Fortune’s Most Admired Companies,
confirming our position as the most trusted and admired
brand in the industry. See how ManpowerGroup is
powering the future of work: www.manpowergroup.com.
About ManpowerGroup®

ManpowerGroup Slovensko, Lazaretská 8, 811 08 Bratislava, SlovakiaTel.: +421 2 5710 6900 Fax: +421 2 5710 6109www.manpowergroup.sk
©2017, ManpowerGroup Slovensko s.r.o. All rights reserved.