Manning up and womaning down: How husbands and wives ... · Misty Heggeness:...
18
1 Manning up and womaning down: How husbands and wives report their earnings when she earns more Marta Murray-Close and Misty L. Heggeness Social, Economic, and Housing Statistics Division United States Census Bureau ∗ SESHD Working Paper # 2018-20 June 6, 2018 Do gendered social norms influence survey reports of “objective” economic outcomes? This paper compares the earnings reported for husbands and wives in the Current Population Survey with their “true” earnings from administrative income-tax records. Estimates from OLS regressions show that survey respondents react to violations of the norm that husbands earn more than their wives by inflating their reports of husbands’ earnings and deflating their reports of wives’ earnings. On average, the gap between a husband’s survey and administrative earnings is 2.9 percentage points higher if his wife earns more than he does, and the gap between a wife’s survey and administrative earnings in 1.5 percentage points lower if she earns more than her husband does. These findings suggest that gendered social norms can influence survey reports of seemingly objective outcomes and that their impact may be heterogeneous not just between genders but also within gender. ∗ Marta Murray-Close: [email protected] . Misty Heggeness: [email protected]. Any opinions and conclusions expressed in this paper are those of the author(s) and do not necessarily represent the views of the U.S. Census Bureau or its staff. All results have been reviewed to ensure that no confidential information is disclosed.
Transcript of Manning up and womaning down: How husbands and wives ... · Misty Heggeness:...

1
Manning up and womaning down: How husbands and wives report their earnings when she earns more
Marta Murray-Close and Misty L. Heggeness
Social, Economic, and Housing Statistics Division United States Census Bureau∗
SESHD Working Paper # 2018-20
June 6, 2018
Do gendered social norms influence survey reports of “objective” economic outcomes? This paper compares the earnings reported for husbands and wives in the Current Population Survey with their “true” earnings from administrative income-tax records. Estimates from OLS regressions show that survey respondents react to violations of the norm that husbands earn more than their wives by inflating their reports of husbands’ earnings and deflating their reports of wives’ earnings. On average, the gap between a husband’s survey and administrative earnings is 2.9 percentage points higher if his wife earns more than he does, and the gap between a wife’s survey and administrative earnings in 1.5 percentage points lower if she earns more than her husband does. These findings suggest that gendered social norms can influence survey reports of seemingly objective outcomes and that their impact may be heterogeneous not just between genders but also within gender.
∗ Marta Murray-Close: [email protected]. Misty Heggeness: [email protected]. Any opinions and conclusions expressed in this paper are those of the author(s) and do not necessarily represent the views of the U.S. Census Bureau or its staff. All results have been reviewed to ensure that no confidential information is disclosed.
2
1 Introduction
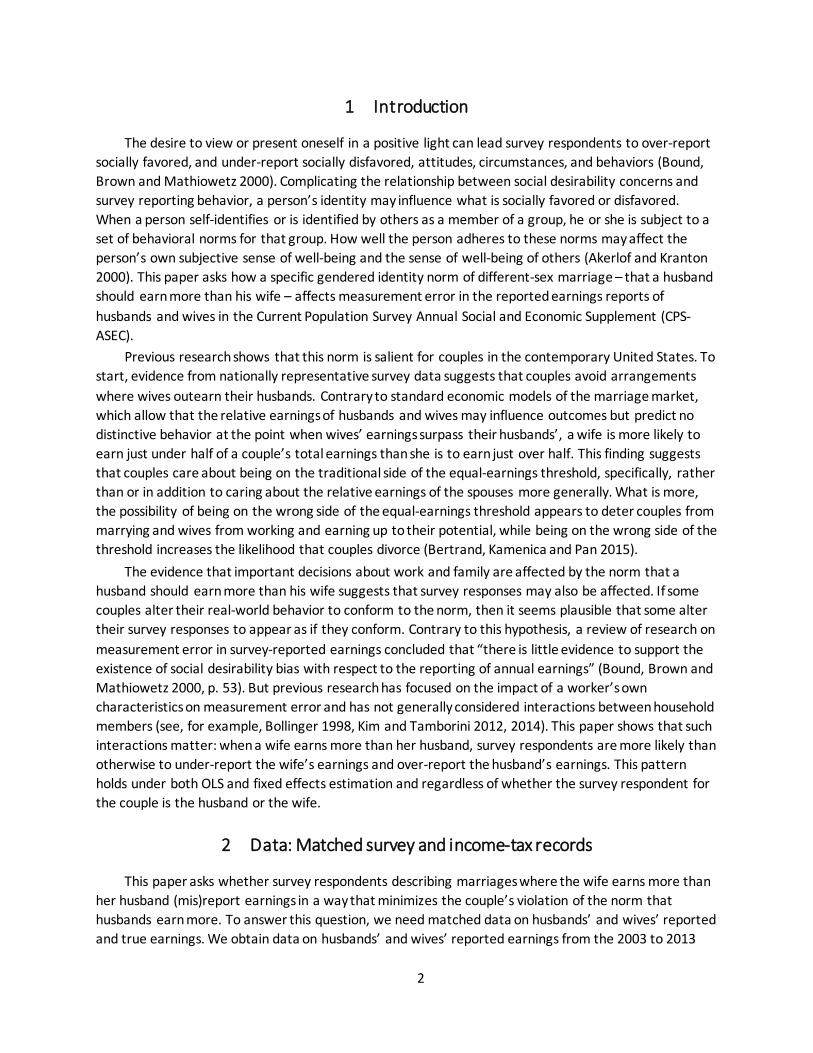
The desire to view or present oneself in a positive light can lead survey respondents to over-report socially favored, and under-report socially disfavored, attitudes, circumstances, and behaviors (Bound, Brown and Mathiowetz 2000). Complicating the relationship between social desirability concerns and survey reporting behavior, a person’s identity may influence what is socially favored or disfavored. When a person self-identifies or is identified by others as a member of a group, he or she is subject to a set of behavioral norms for that group. How well the person adheres to these norms may affect the person’s own subjective sense of well-being and the sense of well-being of others (Akerlof and Kranton 2000). This paper asks how a specific gendered identity norm of different-sex marriage – that a husband should earn more than his wife – affects measurement error in the reported earnings reports of husbands and wives in the Current Population Survey Annual Social and Economic Supplement (CPS-ASEC).
Previous research shows that this norm is salient for couples in the contemporary United States. To start, evidence from nationally representative survey data suggests that couples avoid arrangements where wives outearn their husbands. Contrary to standard economic models of the marriage market, which allow that the relative earnings of husbands and wives may influence outcomes but predict no distinctive behavior at the point when wives’ earnings surpass their husbands’, a wife is more likely to earn just under half of a couple’s total earnings than she is to earn just over half. This finding suggests that couples care about being on the traditional side of the equal-earnings threshold, specifically, rather than or in addition to caring about the relative earnings of the spouses more generally. What is more, the possibility of being on the wrong side of the equal-earnings threshold appears to deter couples from marrying and wives from working and earning up to their potential, while being on the wrong side of the threshold increases the likelihood that couples divorce (Bertrand, Kamenica and Pan 2015).
The evidence that important decisions about work and family are affected by the norm that a husband should earn more than his wife suggests that survey responses may also be affected. If some couples alter their real-world behavior to conform to the norm, then it seems plausible that some alter their survey responses to appear as if they conform. Contrary to this hypothesis, a review of research on measurement error in survey-reported earnings concluded that “there is little evidence to support the existence of social desirability bias with respect to the reporting of annual earnings” (Bound, Brown and Mathiowetz 2000, p. 53). But previous research has focused on the impact of a worker’s own characteristics on measurement error and has not generally considered interactions between household members (see, for example, Bollinger 1998, Kim and Tamborini 2012, 2014). This paper shows that such interactions matter: when a wife earns more than her husband, survey respondents are more likely than otherwise to under-report the wife’s earnings and over-report the husband’s earnings. This pattern holds under both OLS and fixed effects estimation and regardless of whether the survey respondent for the couple is the husband or the wife.
2 Data: Matched survey and income-tax records
This paper asks whether survey respondents describing marriages where the wife earns more than her husband (mis)report earnings in a way that minimizes the couple’s violation of the norm that husbands earn more. To answer this question, we need matched data on husbands’ and wives’ reported and true earnings. We obtain data on husbands’ and wives’ reported earnings from the 2003 to 2013
3
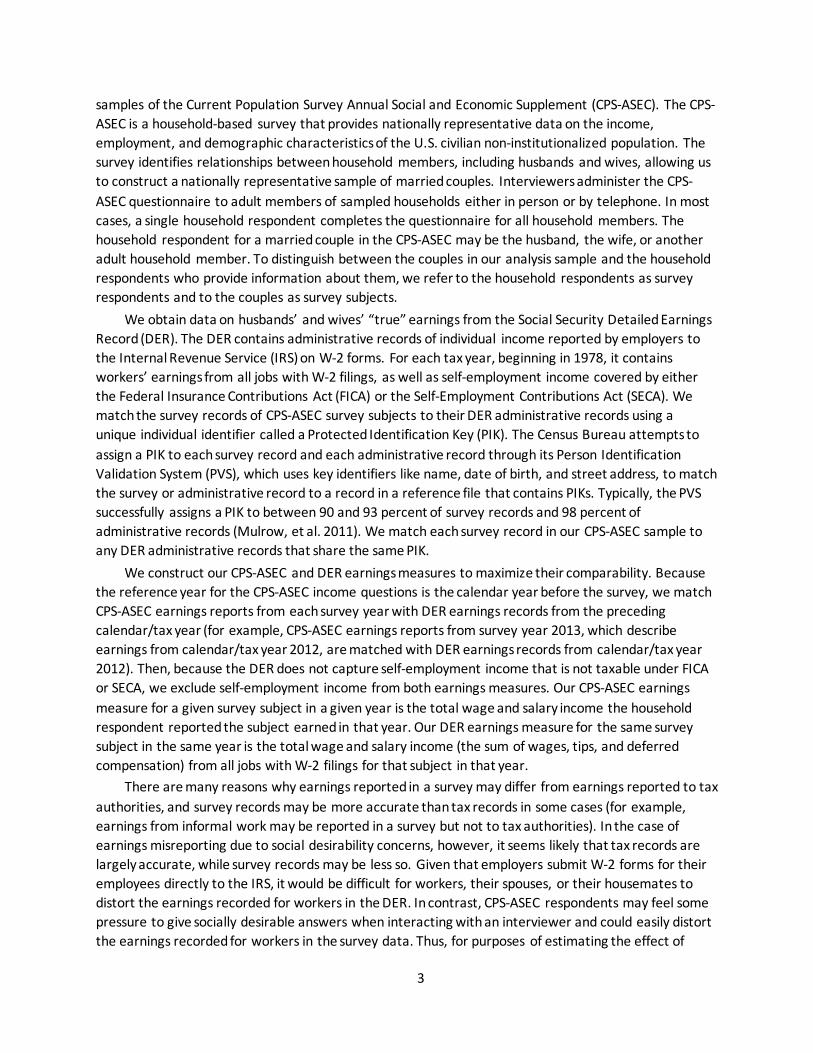
samples of the Current Population Survey Annual Social and Economic Supplement (CPS-ASEC). The CPS-ASEC is a household-based survey that provides nationally representative data on the income, employment, and demographic characteristics of the U.S. civilian non-institutionalized population. The survey identifies relationships between household members, including husbands and wives, allowing us to construct a nationally representative sample of married couples. Interviewers administer the CPS-ASEC questionnaire to adult members of sampled households either in person or by telephone. In most cases, a single household respondent completes the questionnaire for all household members. The household respondent for a married couple in the CPS-ASEC may be the husband, the wife, or another adult household member. To distinguish between the couples in our analysis sample and the household respondents who provide information about them, we refer to the household respondents as survey respondents and to the couples as survey subjects.
We obtain data on husbands’ and wives’ “true” earnings from the Social Security Detailed Earnings Record (DER). The DER contains administrative records of individual income reported by employers to the Internal Revenue Service (IRS) on W-2 forms. For each tax year, beginning in 1978, it contains workers’ earnings from all jobs with W-2 filings, as well as self-employment income covered by either the Federal Insurance Contributions Act (FICA) or the Self-Employment Contributions Act (SECA). We match the survey records of CPS-ASEC survey subjects to their DER administrative records using a unique individual identifier called a Protected Identification Key (PIK). The Census Bureau attempts to assign a PIK to each survey record and each administrative record through its Person Identification Validation System (PVS), which uses key identifiers like name, date of birth, and street address, to match the survey or administrative record to a record in a reference file that contains PIKs. Typically, the PVS successfully assigns a PIK to between 90 and 93 percent of survey records and 98 percent of administrative records (Mulrow, et al. 2011). We match each survey record in our CPS-ASEC sample to any DER administrative records that share the same PIK.
We construct our CPS-ASEC and DER earnings measures to maximize their comparability. Because the reference year for the CPS-ASEC income questions is the calendar year before the survey, we match CPS-ASEC earnings reports from each survey year with DER earnings records from the preceding calendar/tax year (for example, CPS-ASEC earnings reports from survey year 2013, which describe earnings from calendar/tax year 2012, are matched with DER earnings records from calendar/tax year 2012). Then, because the DER does not capture self-employment income that is not taxable under FICA or SECA, we exclude self-employment income from both earnings measures. Our CPS-ASEC earnings measure for a given survey subject in a given year is the total wage and salary income the household respondent reported the subject earned in that year. Our DER earnings measure for the same survey subject in the same year is the total wage and salary income (the sum of wages, tips, and deferred compensation) from all jobs with W-2 filings for that subject in that year.
There are many reasons why earnings reported in a survey may differ from earnings reported to tax authorities, and survey records may be more accurate than tax records in some cases (for example, earnings from informal work may be reported in a survey but not to tax authorities). In the case of earnings misreporting due to social desirability concerns, however, it seems likely that tax records are largely accurate, while survey records may be less so. Given that employers submit W-2 forms for their employees directly to the IRS, it would be difficult for workers, their spouses, or their housemates to distort the earnings recorded for workers in the DER. In contrast, CPS-ASEC respondents may feel some pressure to give socially desirable answers when interacting with an interviewer and could easily distort the earnings recorded for workers in the survey data. Thus, for purposes of estimating the effect of

4
marital gender norms on earnings reporting, it seems reasonable to treat our DER earnings measure as a measure of true earnings and to treat differences between our CPS-ASEC and DER earnings measures as survey misreporting.
A limitation of treating our DER earnings measure as a measure of true earnings is that people who earned nothing in a given year should not have a DER record for that year, so we cannot use the DER records alone to identify true non-earners. This limitation would not be a problem if we restricted our analysis sample to couples where the true earnings of both partners were positive, but we wish to study the reporting behavior of earners in both dual- and single-earner couples. Instead, we assume that a survey subject was a true non-earner in a given year if (1) the household respondent reported that the subject was not employed in that year, (2) the subject was assigned a PIK so that a link between the subject’s CPS-ASEC and DER records could be attempted, and (3) despite having a PIK, the subject lacked a linked DER record for the year (which, given the very high proportion of DER records with PIKs, suggests that the subject did not have any W-2 filings for the year).
We construct our analysis sample from the pooled 2003-13 CPS-ASEC samples. The CPS-ASEC is a short panel survey: sampled households are in the survey for four months, out for eight, and then in again for another four. Consequently, couples who remain at the same address may complete the survey in two adjacent years. Our analysis sample includes observations of different-sex married couples whose marriages meet the following criteria in the calendar year before their survey: First, both spouses must be between 25 and 54 years old. Second, at least one spouse must work for pay. Third, because our earnings measures exclude self-employment income, any spouse who works for pay must have their primary job (the job they held longest during the survey reference year) with a private-sector or government employer. This last requirement excludes couples where one or both spouses are primarily self-employed. We refer to the observations that meet these substantive sample-selection criteria as the baseline sample. The baseline sample contains approximately 250,000 observations of approximately 146,000 couples (throughout the paper, reported sample sizes are rounded according to the Census Bureau’s disclosure avoidance requirements).
We derive our analysis sample from the baseline sample by excluding observations with missing, imputed, or inconsistent earnings data. To start, we exclude observations of couples where a working spouse has imputed CPS-ASEC earnings. The Census Bureau imputes missing earnings in the CPS-ASEC using a hot-deck procedure that assigns to each person without reported earnings the earnings of a donor with similar characteristics. Including observations with hot-decked earnings in wage regressions has been shown to cause match bias, a form of attenuation bias, in the coefficients on variables not used to select donors (Bollinger and Hirsch 2006, Hirsch and Schumacher 2004). Since the earnings of a person’s spouse relative to the person’s own earnings are not used to select donors in the Census Bureau’s hot-deck procedure, including observations with imputed earnings in our analysis sample would increase the probability that we fail to detect an effect of higher-earning wives on earnings reporting, should such an effect exist. Observations excluded for imputed CPS-ASEC earnings comprise 28.7 percent of the baseline sample.
Next, we exclude observations of couples where one or both spouses lacks a PIK, since the CPS-ASEC records of survey subjects without PIKs cannot not be linked to their DER records. Observations excluded for missing PIKs comprise 9.8 percent of the baseline sample. We also exclude observations of couples where a working spouse has a PIK but lacks a linked DER record because we cannot determine the true earnings of these spouses. Observations excluded for missing DER records comprise 4.4 percent of the baseline sample. To focus on earnings misreporting that might plausibly be attributed to social

5
desirability concerns, we exclude observations of couples who exhibit extreme misreporting. Specifically, we exclude observations of couples where a working spouse has a gap of more than 100 percent between his or her CPS-ASEC earnings and his or her DER earnings. Observations excluded for extreme misreporting comprise 4.4 percent of the baseline sample. Finally, because the CPS sample design generally precludes couples from participating in the CPS-ASEC in more than two years or in non-consecutive years, we exclude observations of couples who appear, based on their PIKs, to have done so. Observations excluded for non-standard participation sequences comprise 0.3 percent of the baseline sample. After applying these additional sample-selection criteria, our analysis sample includes 52.5 percent of the observations in the baseline sample and contains approximately 131,000 observations of approximately 100,000 couples.
With the CPS-ASEC person-level sampling weights, which are identical for husband and wives, the baseline sample is approximately representative of single- and dual-earner married couples in the U.S. between 2003 and 2013 with both spouses between 25 and 54 years old and not primarily self-employed in the preceding calendar year. Our analysis sample, however, excludes 47.5 percent of the observations in the baseline sample. To improve the representativeness of our estimates, we adjust the CPS-ASEC sampling weights for the probability that an observation is in the analysis sample, conditional on being in the baseline sample. Specifically, we take couples as our unit of analysis and use the couple-year observations in the baseline sample to estimate a logit model predicting the probability that an observation in the baseline sample is also in the analysis sample. The predictor variables are demographic characteristics (age, race, citizenship status, and educational attainment) of the husband and the wife, whether each spouse worked in the last calendar year, the couple’s region of residence, whether they lived in a metropolitan area, and the year of their CPS-ASEC interview. We multiply the CPS-ASEC sampling weight for the husband- and wife-year observations that make up each couple-year observation by the inverse of the latter’s predicted probability of being in the analysis sample.
Some of the analyses in this paper exploit the panel structure of the CPS-ASEC, and we make several adjustments to our data to facilitate these analyses. First, because race is commonly conceptualized as a time-invariant variable and is time-invariant for all by a small number of people in our analysis sample, we create a time-invariant race variable that takes the value of the race reported for a person in the first year they appear in the sample. Second, because couples’ region of residence is empirically so close to time-invariant that it cannot be included in our fixed effects analysis, we also create a time-invariant region variable. Finally, because our fixed effects analysis requires that the sampling weights for husbands and wives be constant over time, we create time-invariant person-level sampling weights. For consistency, we use the time-invariant race and region variables and the time-invariant sampling weights in all of our analyses. Where couples are our unit of analysis, we use the sampling weights for wives (which, like the unadjusted CPS-ASEC person-level sampling weights, are identical to the sampling weights for their husbands) as the sampling weights for couples.
3 Variable means: How couples with higher-earnings wives are different
We divide the couples in our analysis sample into two groups based on their DER earnings: couples where the wife earns more than the husband and couples where she does not. We refer to the former as non-traditional couples and the latter as traditional couples. (As explained above, some couples in our analysis sample are observed twice, so the number of observations in the analysis sample is greater than the number of couples. In this section and subsections 5.1 and 5.3, we treat the data as a pooled cross-

6
section, and for ease of exposition, we refer to observations simply as couples rather than couple-years or observations of couples.) Consistent with the results of previous research (Winkler, McBride and Andrews 2005), 22.9 percent of the couples in our analysis sample are non-traditional. Our measure of earnings misreporting for employed husbands and wives is the “reporting gap,” defined as the difference between a husband’s or wife’s CPS-ASEC earnings and DER earnings, expressed as a proportion of DER earnings: reporting gap = (CPS earnings – DER earnings)/DER earnings.
Figure 1 shows the mean reporting gaps for employed husbands and wives in traditional and non-traditional couples. Because measurement error in survey earnings is a decreasing and possibly nonlinear function of administrative earnings (Bollinger 1998, Kim and Tamborini 2012, 2014), we compute the mean reporting gaps separately for workers in each decile of the overall DER earnings distribution. The results in Figure 1 suggest that household respondents for traditional couples behave similarly whether they are reporting the earnings of husbands or wives. The mean reporting gaps for traditional husbands are similar to those for traditional wives across most of the earnings distribution. In contrast, respondents for non-traditional couples inflate the survey earnings of husbands relative to those of wives. The mean reporting gaps for non-traditional husbands are higher (more positive or less negative) than those for non-traditional wives (p-value from Wald test for difference in means < 0.05 in each decile). This difference in the reporting behavior of household respondents by couple type reflects both higher reporting gaps for non-traditional husbands compared with traditional husbands and lower reporting gaps for non-traditional wives compared with traditional wives (p-value from Wald test for difference in means < 0.05 for each comparison in each decile but the first).
The patterns in Figure 1 are suggestive evidence that CPS-ASEC respondents react to violations of the norm that husbands outearn their wives by inflating their reports of lower-earning husbands’ earnings and deflating their reports of higher-earning wives’ earnings. The conclusions we can draw from these patterns are limited, however, because the estimates in the figure do not account for characteristics other than true earnings that may differ between traditional and non-traditional couples and may be correlated with earnings misreporting. Indeed, we find that non-traditional couples differ from traditional couples in several potentially important respects.
Figure 2 shows estimates of the mean values of selected income and demographic variables for traditional and non-traditional couples. Not surprisingly, given that non-traditional wives outearn their husbands – but crucially, given the known relationship between true earnings and earnings misreporting – the mean DER earnings of non-traditional wives are more than double those of (employed) traditional wives, while the mean DER earnings of (employed) non-traditional husbands are less than half those of traditional husbands. A similar pattern holds for educational attainment: non-traditional wives are around 30 percent more likely than traditional wives to have a college degree, while non-traditional husbands are around 20 percent less likely than traditional husbands to have one. Turning to race and ethnicity, non-traditional couples (both husbands and wives) are almost twice as likely as traditional couples to be black (comparisons for other racial-ethnic groups, omitted for brevity, showed only minor difference by couple type). Finally, non-traditional wives are slightly less likely, and non-traditional husbands slightly more likely, to be the CPS-ASEC respondent for their household (p-value from Wald test for difference in means < 0.05 for each comparison).
The estimates in Figure 2 also suggest that traditional and non-traditional couples are similar along some dimensions where we might expect them to differ. In particular, while we might expect non-traditional couples to be concentrated in socially and politically liberal areas, they are not meaningfully more likely than traditional couples to live in cities, which tend to be relatively liberal, or in the South,

7
which tends to be relatively conservative. And while we might expect non-traditional couples to be younger than traditional couples, they are in fact similar in age.
4 Regression results: Manning up and womaning down
4.1 OLS results: How earnings reporting differs between couples with traditional and non-traditional marital earnings
To determine whether earnings reporting for non-traditional couples in the CPS-ASEC differs from reporting for traditional couples net of observable differences between the groups, we compare the reporting behavior of respondents for non-traditional husbands and wives with the behavior of respondents for traditional husbands and wives, controlling for a host of husband, wife, and couple characteristics. Specifically, we estimate linear probability and ordinary least squares (OLS) regressions of the form
𝑌𝑌𝑖𝑖 = 𝛼𝛼 +𝛽𝛽𝛽𝛽𝛽𝛽𝛽𝛽𝑒𝑒𝑖𝑖 + 𝛾𝛾1𝑁𝑁𝑁𝑁𝑁𝑁𝑁𝑁𝑁𝑁𝛽𝛽𝑑𝑑𝑖𝑖 + 𝜁𝜁1𝑍𝑍𝑖𝑖 +𝛽𝛽𝛽𝛽𝛽𝛽𝑒𝑒𝑖𝑖 × (𝛾𝛾2𝑁𝑁𝑁𝑁𝑁𝑁𝑁𝑁𝑁𝑁𝛽𝛽𝑑𝑑𝑖𝑖 + 𝜁𝜁2𝑍𝑍𝑖𝑖) + 𝜖𝜖𝑖𝑖 . (1) In the linear probability regressions, the outcome variable, 𝑌𝑌𝑖𝑖, is an indicator variable that equals one if person 𝑖𝑖 has a positive reporting gap (that is if the earnings reported for person 𝑖𝑖 in the CPS-ASEC exceed the earnings recorded for person 𝑖𝑖 in the DER). In the OLS regressions, the outcome variable is the reporting gap between the person 𝑖𝑖’s CPS-ASEC and DER earnings, as defined above. Because these outcome variables are not defined for people without earnings, we restrict our estimation sample for equation (1) to the employed husbands and wives in our analysis sample.
𝛽𝛽𝛽𝛽𝛽𝛽𝑒𝑒𝑖𝑖 is an indicator variable that equals one if person 𝑖𝑖 is a husband. 𝑁𝑁𝑁𝑁𝑁𝑁𝑁𝑁𝑁𝑁𝛽𝛽𝑑𝑑𝑖𝑖 is an indicator variable that equals one if person 𝑖𝑖 has non-traditional marital earnings (that is, if person 𝑖𝑖 outearns her husband or is outearned by his wife). 𝑍𝑍𝑖𝑖 is a vector of characteristics of person 𝑖𝑖, his or her spouse, and their marriage. For both person 𝑖𝑖 and his or her spouse, 𝑍𝑍𝑖𝑖 contains age in five-year bins, race (white, black, Hispanic, Asian, or another race), educational attainment (less than high school, high school degree, some college, college degree, or more than college), and a cubic polynomial in the natural log of DER earnings. Following Bertrand, Kamenica, and Pan (2015), we set the natural log of the spouse’s DER earnings to zero if the spouse is not employed and add to 𝑍𝑍𝑖𝑖 an indicator variable that equals one if the spouse is not employed. For the couple, 𝑍𝑍𝑖𝑖 contains their standard Census geography region (Northeast, Midwest, South, or West), whether they live in a metropolitan area, the natural log of their total DER earnings, and whether their CPS-ASEC respondent was the husband, the wife, or another adult responding for the household. Because we are interested in the specific effect of a wife outearning her husband rather than the general effect of a wife having high relative earnings, 𝑍𝑍𝑖𝑖 also includes the wife’s share of the couple’s total earnings.
We interact 𝛽𝛽𝛽𝛽𝛽𝛽𝑒𝑒𝑖𝑖 with each of the other regressors to allow the effects of own, spouse, and couple characteristics on earnings reporting to differ by survey-subject gender. As a result, estimated differences in earnings reporting between husbands and wives may depend on these characteristics. To determine whether survey-subject gender affects earnings reporting for traditional (or non-traditional) couples, we estimate the average marginal effect of being male on a subject’s reporting gap when all subjects are treated as traditional (or non-traditional). Consistent with the descriptive results in Figure 1, the average marginal effect of survey-subject gender on earnings reporting in the CPS-ASEC is substantively negligible and statistically non-significant for members of traditional couples. In contrast, and also consistent with the descriptive results, the effect is both substantively and statistically

8
significant for members of non-traditional couples: on average, the estimates in Figure 3 suggest that treating a CPS-ASEC subject like non-traditional husband versus a non-traditional wife increases the probability that the subject has a positive reporting gap by 12.3 percentage points and increases the value of the subject’s reporting gap by 4.8 percentage points.
To determine whether the gender gap in earnings reporting for non-traditional couples is due to household respondents inflating the earnings of non-traditional husbands, deflating the earnings of non-traditional wives, or both, we estimate four additional parameters. First, for each of the two outcome variables, we estimate the marginal effect of being non-traditional on the reporting gap for wives. This effect is given by 𝛾𝛾1 in equation (1). Second, we estimate the marginal effect of being non-traditional on the reporting gap for husbands. This effect is given by 𝛾𝛾1 + 𝛾𝛾2. Figure 4 shows these estimates. Consistent with the descriptive results in Figure 1, household respondents report lower earnings for wives who outearn their husbands and higher earnings for husbands whose wives outearn them than they report for comparable wives and husbands with traditional marital earnings. On average, earning more than her husband decreases the probability that a wife has a positive reporting gap by 6 percentage points and decreases the value of her reporting gap by 1.5 percentage points. Earning less than his wife increases the probability that a husband has a positive reporting gap by 6.9 percentage points and increases the value of his reporting gap by 2.9 percentage points.
4.2 Fixed effects results: How earnings reporting changes when couples switch between traditional and non-traditional marital earnings
The OLS estimates presented above indicate that, controlling for observed differences between traditional and non-traditional couples, and taking the reporting gaps of traditional couples as a baseline, CPS-ASEC respondents over-report the earnings of non-traditional husbands and under-report the earnings of non-traditional wives. These patterns may reflect efforts (either conscious or unconscious) by respondents to portray couples in a socially desirable manner. But the patterns may also be spurious: the apparent (and apparently gendered) effect of non-traditional marital earnings on earnings reporting may be driven by unobserved differences between traditional and non-traditional couples. As a partial solution to this problem, we turn to fixed effects estimation, which allows us to control for stable unobserved differences between couples.
An earlier study of couples with non-traditional marital earnings found that a sizable fraction transitioned into or out of this classification over a two-year period (Winkler, McBride and Andrews 2005). Consistent with this finding, 7 percent of the couples who appear twice in our analysis sample, and 26.9 percent of the couples who appear twice and are classified as non-traditional at least once, change classifications between the first and second years we observe them. We use this within-couple variation in the classification of marital earnings to compare earnings reporting for husbands and wives when they are classified as non-traditional with earnings reporting for the same husbands and wives when they are classified as traditional. First, we identify the husbands and wives in our analysis sample who change classifications between the first and second years we observe them and who are employed in both years (so we can observe their reporting gaps under both classifications). Then, we estimate sex-specific fixed effects regressions of the form
𝑌𝑌𝑖𝑖𝑖𝑖 = 𝛼𝛼+ 𝛾𝛾𝑁𝑁𝑁𝑁𝑁𝑁𝑁𝑁𝑁𝑁𝛽𝛽𝑑𝑑𝑖𝑖𝑖𝑖 + 𝜁𝜁𝑍𝑍𝑖𝑖𝑖𝑖 + 𝑢𝑢𝑖𝑖 + 𝜖𝜖𝑖𝑖𝑖𝑖. (2) The fixed effect 𝑢𝑢𝑖𝑖 in equation (2) captures (observed and unobserved) time-invariant characteristics of person 𝑖𝑖, his or her spouse, and their marriage. The other variables are defined as in equation (1), except

9
that our measures of race, region, and metropolitan residence, which are time-invariant, drop out of the vector 𝑍𝑍𝑖𝑖𝑖𝑖.
The parameter of central interest is 𝛾𝛾, which gives the marginal effect of non-traditional marital earnings on the reporting gap of husbands or wives. Figure 5 shows estimates of 𝛾𝛾 for both husbands and wives. Contrary to the concern that the gendered pattern in the OLS estimates was driven by unobserved heterogeneity, the same pattern appears in the fixed effects estimates. Indeed, the pattern is amplified rather than attenuated under fixed effects: the estimates Figure 5 are consistently larger in magnitude than the corresponding estimates in Figure 4. More specifically, the estimates in Figure 5 suggest that, among couples who change martial earnings classifications, controlling for both observed characteristics and stable unobserved characteristics, earning more than her husband decreases the probability that a wife has a positive reporting gap by 11.9 percentage points and decreases the value of her reporting gap by 4.5 percentage points. The estimates also suggest that earning less than his wife increases the probability that a husband has a positive reporting gap by 9.7. percentage points and increases the value of his reporting gap by 3.5 percentage points.
Why might the gendered effect of non-traditional marital earnings appear more pronounced under fixed effects than OLS? One possible explanation is that the social norm that husbands outearn their wives may be especially salient for couples who have recently switched from traditional (norm-conforming) to non-traditional (norm-violating) or vice versa. An alternative explanation is that couples who have recently switched from traditional to non-traditional may be more likely than other couples to have experienced an increase in the wife’s earnings or a decrease in the husband’s earnings. If survey respondents err in the direction of survey subjects’ past earnings when reporting their current earnings, then changes of this kind could lead respondents to over-report the earnings of newly non-traditional wives and under-report the earnings newly-non-traditional husbands. The reverse would be true for couples who have recently switched from non-traditional to traditional. In any case, the fact that the fixed effects and OLS estimates show the same gendered pattern mitigates concerns that the pattern is due solely to unobserved heterogeneity or is solely an artifact of incomplete updating in survey-reported earnings.
4.3 The role of proxy reporting: Does it matter if the household respondent for a couple is the husband or the wife?
As explained above, the earnings of each couple in the CPS-ASEC are reported by a single household respondent. This respondent may be the husband, the wife, or another adult who lives with them. The estimates presented above controlled for the identity of the household respondent, but they assumed that husbands, wives, and other household respondents react the same way to non-traditional marital earnings. There are at least two reasons to think this assumption might be wrong.
First, men may be more invested than women in traditional gender roles. Pooled data from the 2002 to 2012 samples of the General Social Survey show that, among men and women between the ages of 25 and 54 during the period covered by our study, 26 percent of women but just 15 percent of men strongly disagreed that “It is much better for everyone involved if the man is the achiever outside the home and the woman takes care of the home and family” (authors’ calculations on weighted data , 𝑁𝑁 = 4,416, p-value from Wald test for difference in means < 0.001). Second, men and women may differ, on average, in their knowledge of each other’s earnings. Consistent with this idea (and also with first one), previous research with data from the Current Population Survey’s 1979-2009 Outgoing
10
Rotation Group files found that proxy-reported wages were lower than self-reported wages, on average, and that the difference was larger for men than for women (Reynolds and Jeffrey 2012). Taken together, these observations suggest that the gendered effect of non-traditional marital earnings on earnings reporting may be larger when the household respondent for a couple is the husband than when the household respondent is the wife.
To determine whether husband-respondents react differently than wife-respondents when a wife outearns her husband, we stratify the estimation sample from section 4.1 (the subsample of employed husbands and wives in our analysis sample) by the identity of the household respondent (husband, wife, or another household adult) and the identity of the survey subject (husband or wife). We drop observations where the household respondent for a couple is neither the husband nor the wife because there are too few of these observations to analyze separately. Then, for each combination of survey-respondent sex and survey-subject sex, we estimate an OLS regression of the form
𝑌𝑌𝑖𝑖 = 𝛼𝛼 + 𝛾𝛾𝑁𝑁𝑁𝑁𝑁𝑁𝑁𝑁𝑁𝑁𝛽𝛽𝑑𝑑𝑖𝑖 + 𝜁𝜁𝑍𝑍𝑖𝑖𝑖𝑖 + 𝜖𝜖𝑖𝑖 , (3) where all of the variables are defined as in equation (2).
As in equation (2), the parameter of central interest is 𝛾𝛾, which gives the marginal effect of non-traditional marital earnings on the reporting gap. Figure 6 shows estimates of 𝛾𝛾 when wives respond for wives, when wives respond for husbands, when husbands respond for wives, and when husbands respond for husbands. These estimates are not entirely consistent with the prediction that husband-respondents react more strongly than wife-respondents when a wife outearns her husband. Instead, the estimates in Figure 6 suggest a more nuanced pattern. Both husband-respondents and wife-respondents appear to contribute to the pattern revealed by our earlier analyses: both inflate the earnings of non-traditional husbands relative to traditional husbands, and both deflate the earnings of non-traditional wives relative to traditional wives. As expected, husband-respondents deflate the earnings of non-traditional wives more than wife-respondents do. But contrary to our expectations, husband-respondents inflate the earnings of non-traditional husbands less than wife-respondents do. (All differences between the survey-reporting behavior of husband-respondents and wife-respondents are statistically significant at the 5-percent level except the difference in the effect of non-traditional marital earnings on the value of the reporting gap, which is significant at the 10-percent level.)
We can only speculate about why husband-respondents and wife-respondents distort the earnings of their spouses more than their own earnings when their earnings are non-traditional. One possible reason is that social norms interact with knowledge. When a wife outearns her husband, both the husband and the wife may be uncomfortable – or believe that an interviewer will be uncomfortable – with their violation of the male-breadwinner norm. Accordingly, they may be tempted to inflate their reports of the husband’s earnings and deflate their reports of the wife’s earnings. At the same time, both the husband and the wife may wish to provide accurate responses to the survey. To the extent that the desires for norm-conformity and accurate reporting conflict, accurate reporting may win out more often when respondents are fairly certain of the answer to a survey question (as they are likely to be when reporting their own earnings) than whey less are less certain (as they may be when reporting their spouse’s earnings).
5 Conclusions
Annual earnings are essential measure of economic well-being. Our empirical results suggest that survey-reported wage and salary earnings in the CPS-ASEC may be biased by social desirability concerns.

11
When married couples in the CPS-ASEC violate the norm that husbands outearn their wives, the survey respondents reporting the couples’ earnings appear to minimize the violation by inflating the earnings of the lower-earning husbands and deflating the earnings of the higher-earning wives. This pattern persists when controlling for an array of demographic characteristics and the “true” (administrative) earnings of the spouses. It also persists when controlling for stable unobservable characteristics of the spouses and regardless of whether the survey respondent for the couple is the husband or the wife. One lesson from these findings is that survey reports of even seemingly objective, clearly measurable economic outcomes may suffer from measurement error due not just to gaps in respondents’ knowledge of the outcome but also to gaps between their beliefs or values and the circumstances they are asked to describe.
A more nuanced lesson from our findings is that the impact of gender on survey measurement error cannot be reduced to the gender of survey subjects alone. It is not the case, for example, that CPS-ASEC respondents exaggerate the earnings of husbands in general relative to those of wives. When respondents are asked to report the earnings of traditional couples (couples where the husband earns at least as much as the wife), the measurement error in their reports for husbands is statistically and substantively indistinguishable from the measurement error in their reports for comparable wives. It is only when respondents are asked to report the earnings of non-traditional couples (couples where the wife outearns the husband) that the patterns of measurement error in their reports for husbands and wives diverge.
A closely related point is that measurement error in survey responses about a given survey subject may depend not just on the characteristics of the subject him or herself but also on the characteristics of other household members. Our results suggest that CPS-ASEC respondents (consciously or unconsciously) compare the earnings of husbands with the earnings of their wives and that they report the earnings of both spouses differently when the comparison favors the wife. In this way, the reported earnings of husbands depend on their own earnings relative to the earnings of their wives, and vice versa. The tendency of survey respondents to compare the earnings (or other characteristics) of husband with those of their wives may be especially pronounced in the CPS-ASEC, where a single respondent answers survey questions about multiple household members in succession. The gendered pattern of measurement error described in this paper might be attenuated or absent in surveys like the Survey of Income and Program Participation that attempt to obtain responses from each survey subject directly.

12
References
Akerlof, George A., and Rachel E. Kranton. 2000. "Economics and Identity." Quarterly Journal of Economics 115 (3): 715-753.
Bertrand, Marianne, Emir Kamenica, and Jessica Pan. 2015. "Gender Identity and Relative Income Within Households." Quarterly Journal of Economics 130 (2): 571--614.
Bollinger, Christopher R., and Barry T. Hirsch. 2006. "Match Bias from Earnings Imputation in the Current Population Survey: The Case of Imperfect Matching." Journal of Labor Economics 24 (3): 483-519.
Bollinger, Christopher R. 1998. "Measurement Error in The Current Population Survey: A Nonparamteric Look." Journal of Labor Economics 16 (3): 576-594.
Bound, John, Charles Brown, and Nancy Mathiowetz. 2000. Measurement Error in Survey Data. Population Studies Center Report No. 00-450, Ann Arbor: University of Michigan.
Hirsch, Barry T., and Edward J. Schumacher. 2004. "Match Bias in Wage Gap Estimates Due to Earnings Imputation." Journal of Labor Economics 22 (3): 689-722.
Kim, ChangHwan, and Christopher R. Tamborini. 2012. "Do Survey Data Estimate Earnings Inequality Correctly? Measurement Errors Among Black and White Male Workers." Social Forces 90 (4): 1157–1181.
Kim, ChangHwan, and Christopher R. Tamborini. 2014. "Response Error in Earnings: An Analysis of the Survey of Income and Program Participation with Matched Administrative Data." Sociological Methods and Research 43 (1): 39-72.
Mulrow, Edward, Ali Mushtaq, Santanu Pramanik, and Angela Fontes. 2011. Assessment of the U.S. Census Bureau's Person Identification Validation System. NORC, University of Chicago.
Reynolds, Jeremy, and Wenger B. Jeffrey. 2012. "He Said, She Said: the Gender Wage Gap According to Self and Proxy Reports in the Current Population Survey." Social Science Research 41 (2): 392-411.
Winkler, Anne E., Timothy D. McBride, and Courtney Andrews. 2005. "Wives Who Outearn Their Husbands: a Transitory or Persistent Phenomenon for Couples?" Demography 42 (3): 523-535.

13
Figures
Figure 1 Mean reporting gap between survey and administrative earnings across the administrative
earnings distribution, by sex and marital earnings classification of survey subject
Source: Current Population Survey Annual Social and Economic Supplement (CPS-ASEC) from survey years 2003 to 2013 l inked to Social Security Detailed Earning Record (DER) from tax years 2002 to 2012. Notes: Reporting gap = (CPS-ASEC earnings – DER earnings)/DER earnings. Marital earnings are non-traditional if the wife’s DER earnings exceed the husband’s DER earnings and traditional otherwise. The estimation sample is observations of employed husbands and wives from the analysis sample described in section 3. It contains approximately 71,500 observations of traditional wives, 101,000 observations of traditional husbands, 30,000 observations of non-traditional wives, and 25,000 observations of non-traditional husbands. Reported observation counts are rounded according to the Census Bureau’s disclosure avoidance requirements.

14
Figure 2 Mean characteristics of traditional and non-traditional couples
Source: Current Population Survey Annual Social and Economic Supplement (CPS-ASEC) from survey years 2003 to 2013 l inked to Social Security Detailed Earning Record (DER) from tax years 2002 to 2012. Notes: Marital earnings are non-traditional if the wife’s DER earnings exceed the husband’s DER earnings and traditional otherwise. The estimation sample is the analysis sample described in section 3. It contains approximately 101,000 observations of traditional couples and 30,000 observations of non-traditional couples. Reported observation counts are rounded according to the Census Bureau’s disclosure avoidance requirements. The error bars represent 95-percent confidence intervals based on standard errors clustered by couple.

15
Figure 3 OLS regression results: Effect of being male on reporting gap between survey and
administrative earnings, by marital earnings classification of survey subject
Source: Current Population Survey Annual Social and Economic Supplement (CPS-ASEC) from survey years 2003 to 2013 l inked to Social Security Detailed Earning Record (DER) from tax years 2002 to 2012. Notes: Reporting gap = (CPS-ASEC earnings – DER earnings)/DER earnings. Marital earnings are non-traditional if the wife’s DER earnings exceed the husband’s DER earnings and traditional otherwise. The estimating equation is equation (1). The estimation sample is observations of employed husbands and wives from the analysis sample described in section 3. It contains approximately 71,500 observations of traditional wives, 101,000 observations of traditional husbands, 30,000 observations of non-traditional wives, and 25,000 observations of non-traditional husbands. Reported observation counts are rounded according to the Census Bureau’s disclosure avoidance requirements. The figure presents the average marginal effect of being male when all survey subjects are treated as traditional and when all are treated as non-traditional. The estimates control for the survey subject’s own and his or her spouse’s age, race, education, and DER earnings; the couple’s region of residence, metropolitan status, and total DER earnings; the wife’s share of the couple’s total DER earnings; and whether the survey respondent for the couple was the husband, the wife, or someone else. The error bars represent 95-percent confidence intervals based on standard errors clustered by couple.

16
Figure 4 OLS regression results: Effect of having non-traditional marital earnings on reporting gap
between survey and administrative earnings, by sex of survey subject
Source: Current Population Survey Annual Social and Economic Supplement (CPS-ASEC) from survey years 2003 to 2013 l inked to Social Security Detailed Earning Record (DER) from tax years 2002 to 2012. Notes: Reporting gap = (CPS-ASEC earnings – DER earnings)/DER earnings. Marital earnings are non-traditional if the wife’s DER earnings exceed the husband’s DER earnings and traditional otherwise. The estimating equation is equation (1). The estimation sample is observations of employed husbands and wives from the analysis sample described in section 3. It contains approximately 71,500 observations of traditional wives, 101,000 observations of traditional husbands, 30,000 observations of non-traditional wives, and 25,000 observations of non-traditional husbands. Reported observation counts are rounded according to the Census Bureau’s disclosure avoidance requirements. The figure presents the average marginal effect of being non-traditional when all survey subjects are treated as male and when all are treated as female. The estimates control for the survey subject’s own and his or her spouse’s age, race, education, and DER earnings; the couple’s region of residence, metropolitan status, and total DER earnings; the wife’s share of the couple’s total DER earnings; and whether the survey respondent for the couple was the husband, the wife, or someone else. The error bars represent 95-percent confidence intervals based on standard errors clustered by couple.

17
Figure 5 Fixed effects regression results: Effect of having non-traditional marital earnings on reporting
gap between survey and administrative earnings, by sex of survey subject
Source: Current Population Survey Annual Social and Economic Supplement (CPS-ASEC) from survey years 2003 to 2013 l inked to Social Security Detailed Earning Record (DER) from tax years 2002 to 2012. Notes: Reporting gap = (CPS-ASEC earnings – DER earnings)/DER earnings. Marital earnings are non-traditional if the wife’s DER earnings exceed the husband’s DER earnings and traditional otherwise. The estimation sample is observations of “switchers” from the analysis sample described in section 3: individuals in the analysis sample for whom we observe one reporting gap in a year when they have traditional marital earnings and one in a year when they have non-traditional marital earnings. This sample contains approximately 4,100 observations of husbands and 4,100 observations of wives. Reported observation counts are rounded according to the Census Bureau’s disclosure avoidance requirements. The figure presents marginal effects from equation (2), estimated separately for husbands and wives. The estimates control for the survey subject’s own and his or her spouse’s age, education, and DER earnings; the couple’s total DER earnings; the wife’s share of the couple’s total DER earnings; whether the survey respondent for the couple was the husband, the wife, or someone else; and person fixed effects that capture time-invariant characteristics of the person, his or her spouse, and their marriage. The error bars represent 95-percent confidence intervals based on standard errors clustered by couple.

18
Figure 6 OLS regression results: Effect of having non-traditional marital earnings on reporting gap
between survey and administrative earnings, by sex of survey subject and respondent
Source: Current Population Survey Annual Social and Economic Supplement (CPS-ASEC) from survey years 2003 to 2013 l inked to Social Security Detailed Earning Record (DER) from tax years 2002 to 2012. Notes: Reporting gap = (CPS-ASEC earnings – DER earnings)/DER earnings. Marital earnings are non-traditional if the wife’s DER earnings exceed the husband’s DER earnings and traditional otherwise. The estimation sample is observations of employed husbands and wives from the analysis sample described in section 3, excluding those whose survey responses were provided by someone other than the husband or the wife. It contains approximately 56,500 observations of wives reporting for wives, 42,500 observations of husbands reporting for wives, 72,000 observations of wives reporting for husbands, and 51,000 observations of husbands reporting for husbands. Reported observation counts are rounded in accordance with the Census Bureau’s disclosure avoidance requirements. The figure presents marginal effects from equation (3), estimated separately for each combination of subject and respondent sex. The estimates control for the survey subject’s own and his or her spouse’s age, race, education, and DER earnings; the couple’s region of residence, metropolitan status, and total DER earnings; and the wife’s share of the couple’s total DER earnings. The error bars represent 95-percent confidence intervals based on standard errors clustered by couple.