Manitoba HR Trends Report...page 4 Manitoba HR Trends Report Manitoba Two-thirds (69%) of Manitoba...
27
Transcript of Manitoba HR Trends Report...page 4 Manitoba HR Trends Report Manitoba Two-thirds (69%) of Manitoba...

Manitoba HR Trends Report
Manitoba
MANITOBA HR TRENDS REPORT SPRING 2019
INTRODUCTION ...................................................................................................................................... 1 METHODOLOGY ..................................................................................................................................... 1 LABOUR MARKET FORECAST ................................................................................................................. 2
HIRING CONFIDENCE INDEX 2 THE SIX MONTH OUTLOOK 3
LABOUR MARKET STATISTICS ................................................................................................................ 5 CURRENT TRENDS 5 TERMINATION CAUSES 7 TEMPORARY LAYOFFS 9 HR TEAM RATIO 9
EMPLOYEE DEVELOPMENT .................................................................................................................. 10 LEARNING AND DEVELOPMENT BUDGETS 10
EMPLOYEE TURNOVER ......................................................................................................................... 11 TURNOVER RATE 11 TURNOVER IMPACT 11 REDUCING TURNOVER 13
PERFORMANCE MANAGEMENT .......................................................................................................... 14 USE OF FORMAL PERFORMANCE REVIEWS 14 APPLICATION OF FORMAL PERFORMANCE REVIEW PROGRAM 15 ATTITUDES TOWARDS FORMAL PERFORMANCE REVIEW PROGRAM 16
TRUTH AND RECONCILIATION ............................................................................................................ 19 FAMILIARITY AND ACKNOWLEDGEMENT 19 INDIGENOUS STRATEGY 20
RESPONDENT PROFILE ......................................................................................................................... 23 ORGANIZATION SIZE 23 DEMOGRAPHICS 23
CONTACT INFORMATION .................................................................................................................... 25 ABOUT THE ORGANIZATION 25
page 1
Manitoba HR Trends Report
Manitoba
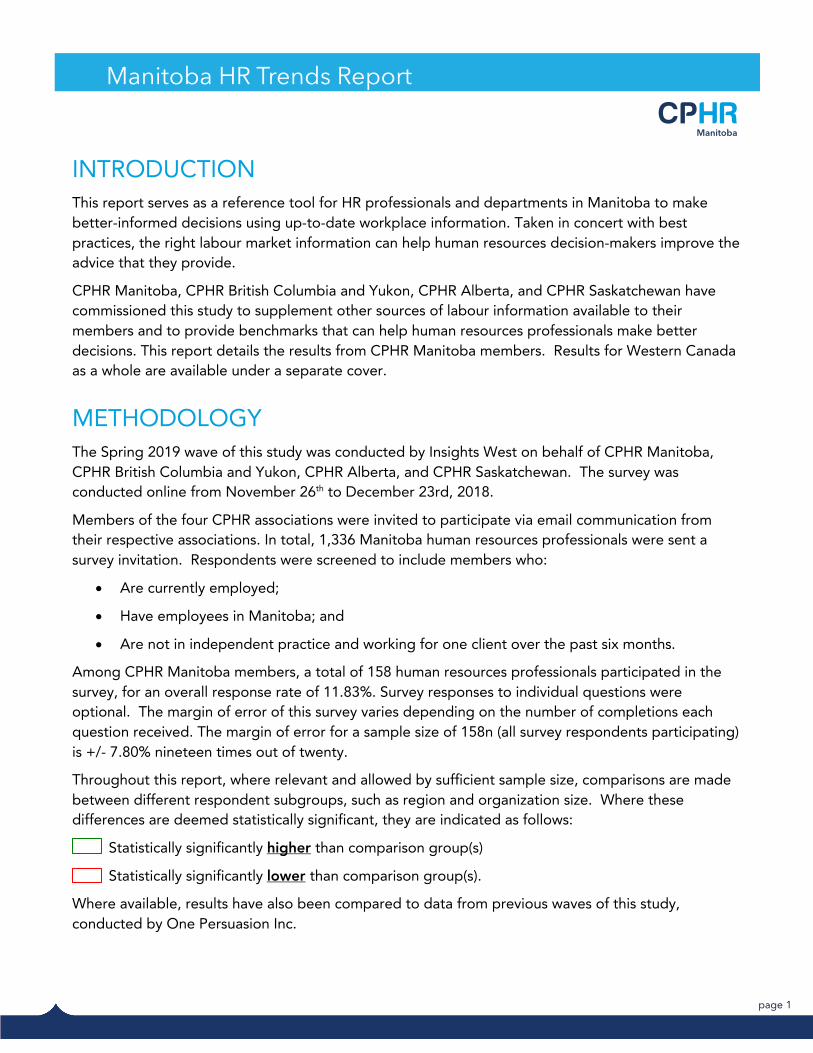
INTRODUCTION This report serves as a reference tool for HR professionals and departments in Manitoba to make better-informed decisions using up-to-date workplace information. Taken in concert with best practices, the right labour market information can help human resources decision-makers improve the advice that they provide.
CPHR Manitoba, CPHR British Columbia and Yukon, CPHR Alberta, and CPHR Saskatchewan have commissioned this study to supplement other sources of labour information available to their members and to provide benchmarks that can help human resources professionals make better decisions. This report details the results from CPHR Manitoba members. Results for Western Canada as a whole are available under a separate cover.
METHODOLOGY The Spring 2019 wave of this study was conducted by Insights West on behalf of CPHR Manitoba, CPHR British Columbia and Yukon, CPHR Alberta, and CPHR Saskatchewan. The survey was conducted online from November 26th to December 23rd, 2018.
Members of the four CPHR associations were invited to participate via email communication from their respective associations. In total, 1,336 Manitoba human resources professionals were sent a survey invitation. Respondents were screened to include members who:
• Are currently employed;
• Have employees in Manitoba; and
• Are not in independent practice and working for one client over the past six months.
Among CPHR Manitoba members, a total of 158 human resources professionals participated in the survey, for an overall response rate of 11.83%. Survey responses to individual questions were optional. The margin of error of this survey varies depending on the number of completions each question received. The margin of error for a sample size of 158n (all survey respondents participating) is +/- 7.80% nineteen times out of twenty.
Throughout this report, where relevant and allowed by sufficient sample size, comparisons are made between different respondent subgroups, such as region and organization size. Where these differences are deemed statistically significant, they are indicated as follows:
Statistically significantly higher than comparison group(s)
Statistically significantly lower than comparison group(s).
Where available, results have also been compared to data from previous waves of this study, conducted by One Persuasion Inc.
page 2
Manitoba HR Trends Report
Manitoba
LABOUR MARKET FORECAST
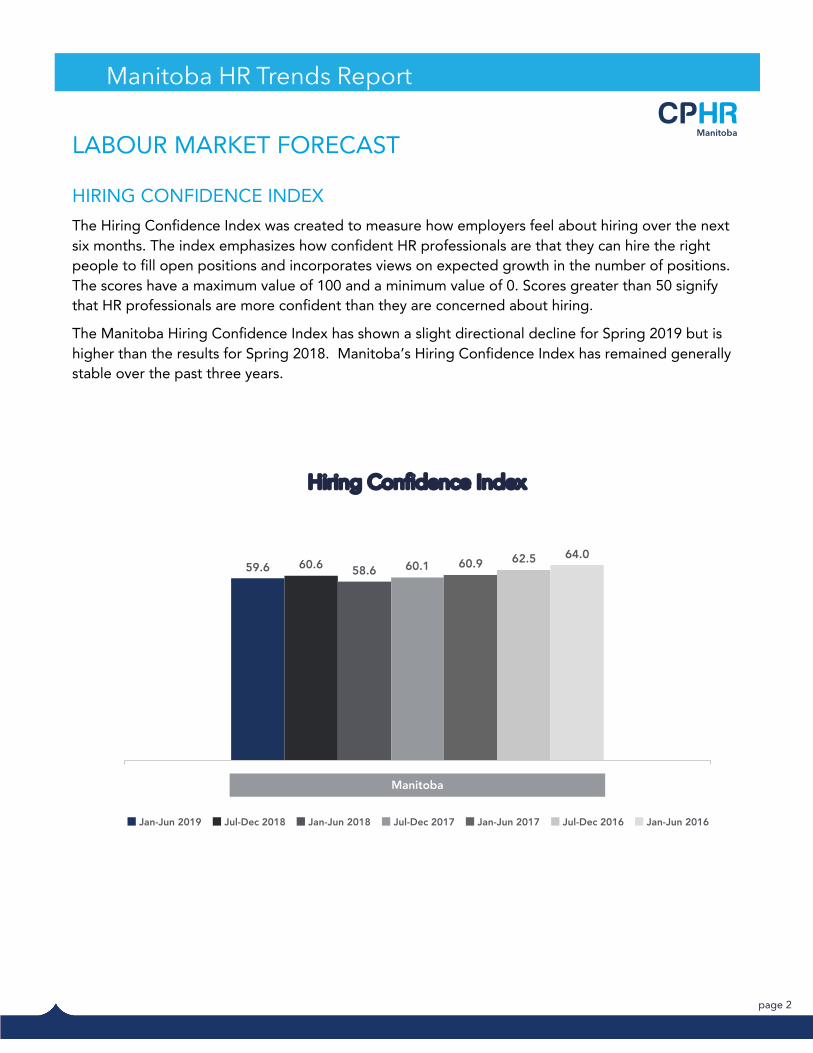
HIRING CONFIDENCE INDEX The Hiring Confidence Index was created to measure how employers feel about hiring over the next six months. The index emphasizes how confident HR professionals are that they can hire the right people to fill open positions and incorporates views on expected growth in the number of positions. The scores have a maximum value of 100 and a minimum value of 0. Scores greater than 50 signify that HR professionals are more confident than they are concerned about hiring.
The Manitoba Hiring Confidence Index has shown a slight directional decline for Spring 2019 but is higher than the results for Spring 2018. Manitoba’s Hiring Confidence Index has remained generally stable over the past three years.
Hiring Confidence Index
59.6 60.6 58.6 60.1 60.9 62.5 64.0
Manitoba
Jan-Jun 2019 Jul-Dec 2018 Jan-Jun 2018 Jul-Dec 2017 Jan-Jun 2017 Jul-Dec 2016 Jan-Jun 2016
page 3
Manitoba HR Trends Report
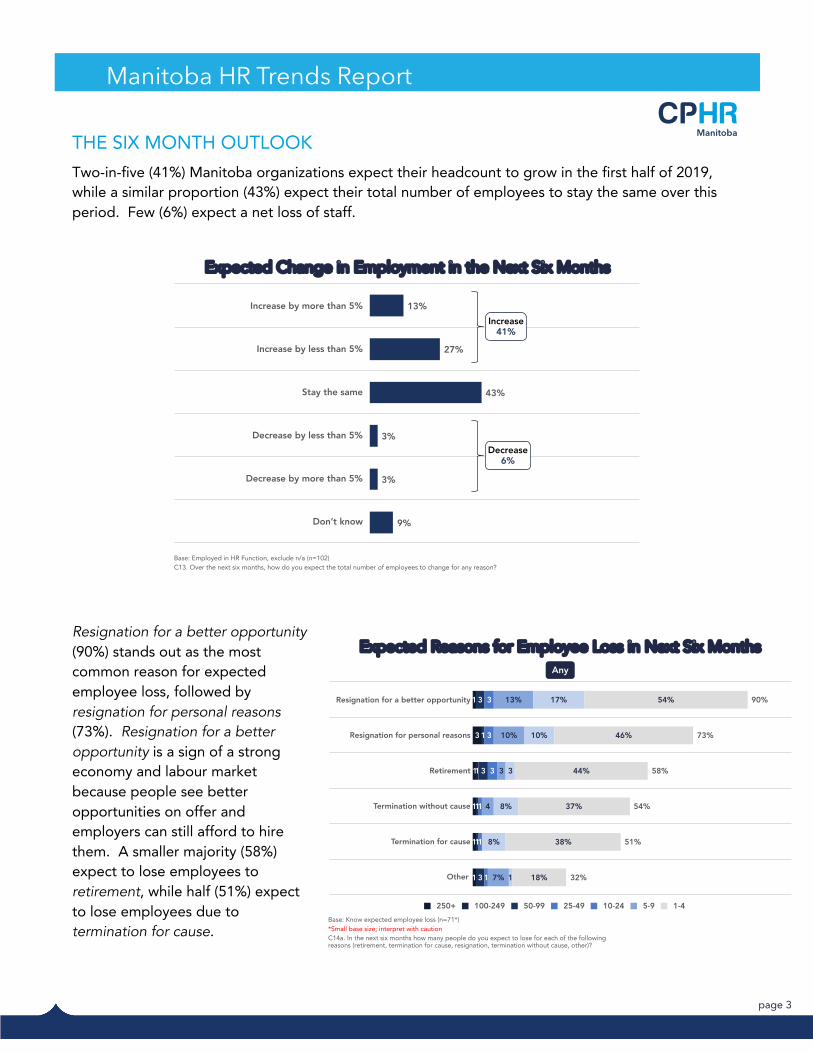
ManitobaTHE SIX MONTH OUTLOOK Two-in-five (41%) Manitoba organizations expect their headcount to grow in the first half of 2019, while a similar proportion (43%) expect their total number of employees to stay the same over this period. Few (6%) expect a net loss of staff.
Resignation for a better opportunity (90%) stands out as the most common reason for expected employee loss, followed by resignation for personal reasons (73%). Resignation for a better opportunity is a sign of a strong economy and labour market because people see better opportunities on offer and employers can still afford to hire them. A smaller majority (58%) expect to lose employees to retirement, while half (51%) expect to lose employees due to termination for cause.
Expected Reasons for Employee Loss in Next Six Months
Resignation for a better opportunity
Resignation for personal reasons
Retirement
Termination without cause
Termination for cause
Other
Base: Know expected employee loss (n=71*)*Small base size; interpret with cautionC14a. In the next six months how many people do you expect to lose for each of the following reasons (retirement, termination for cause, resignation, termination without cause, other)?
1
3
1
1
1
1
1
3
1
3
1
1
3
3
3
3
1
1
1
13%
10%
3
4
7%
17%
10%
3
8%
8%
1
54%
46%
44%
37%
38%
18%
90%
73%
58%
54%
51%
32%
250+ 100-249 50-99 10-24 1-425-49 5-9
Any
Increase by more than 5%
Increase by less than 5%
Stay the same
Decrease by less than 5%
Decrease by more than 5%
Don’t know
Expected Change in Employment in the Next Six Months
Base: Employed in HR Function, exclude n/a (n=102) C13. Over the next six months, how do you expect the total number of employees to change for any reason?
13%
27%
43%
3%
3%
9%
Increase41%
Decrease6%
page 4
Manitoba HR Trends Report
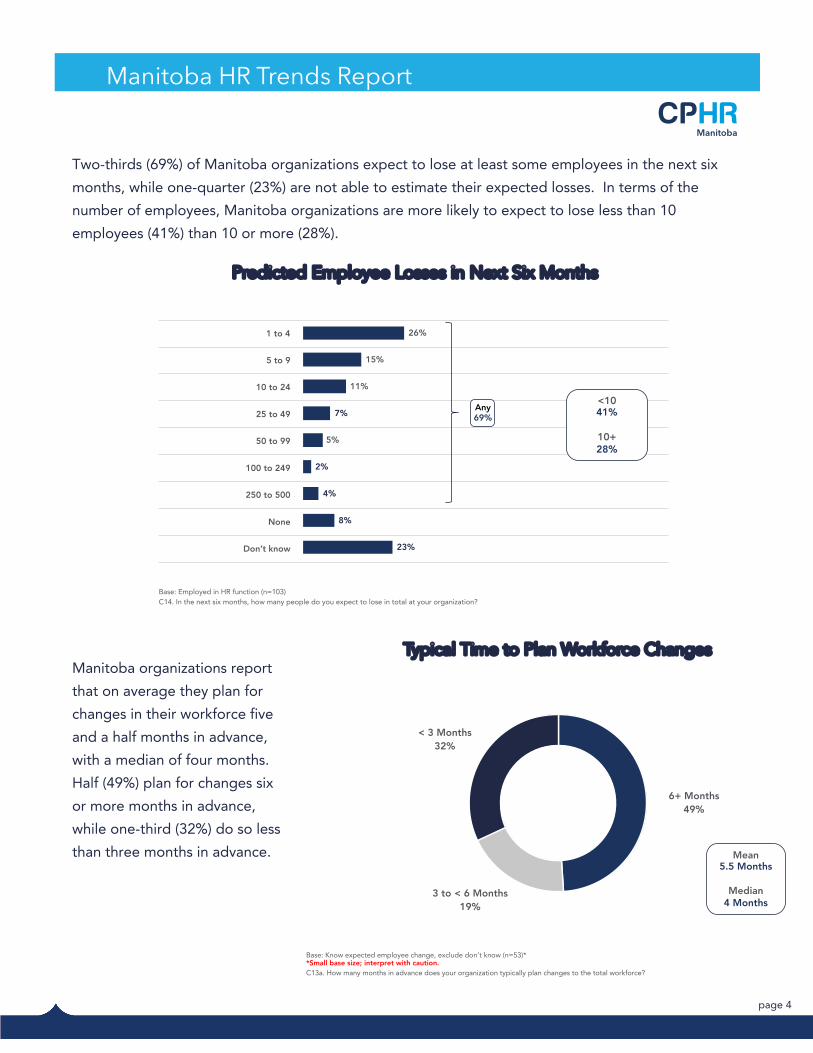
Manitoba Two-thirds (69%) of Manitoba organizations expect to lose at least some employees in the next six months, while one-quarter (23%) are not able to estimate their expected losses. In terms of the number of employees, Manitoba organizations are more likely to expect to lose less than 10 employees (41%) than 10 or more (28%). Manitoba organizations report that on average they plan for changes in their workforce five and a half months in advance, with a median of four months. Half (49%) plan for changes six or more months in advance, while one-third (32%) do so less than three months in advance.
Typical Time to Plan Workforce Changes
Base: Know expected employee change, exclude don’t know (n=53)* *Small base size; interpret with caution.C13a. How many months in advance does your organization typically plan changes to the total workforce?
6+ Months49%
3 to < 6 Months19%
< 3 Months32%
Mean5.5 Months
Median4 Months
1 to 4
5 to 9
10 to 24
25 to 49
50 to 99
100 to 249
250 to 500
None
Don’t know
Base: Employed in HR function (n=103)C14. In the next six months, how many people do you expect to lose in total at your organization?
Predicted Employee Losses in Next Six Months
26%
15%
11%
7%
5%
2%
4%
8%
23%
<1041%
10+28%
Any69%
page 5
Manitoba HR Trends Report
Manitoba
LABOUR MARKET STATISTICS
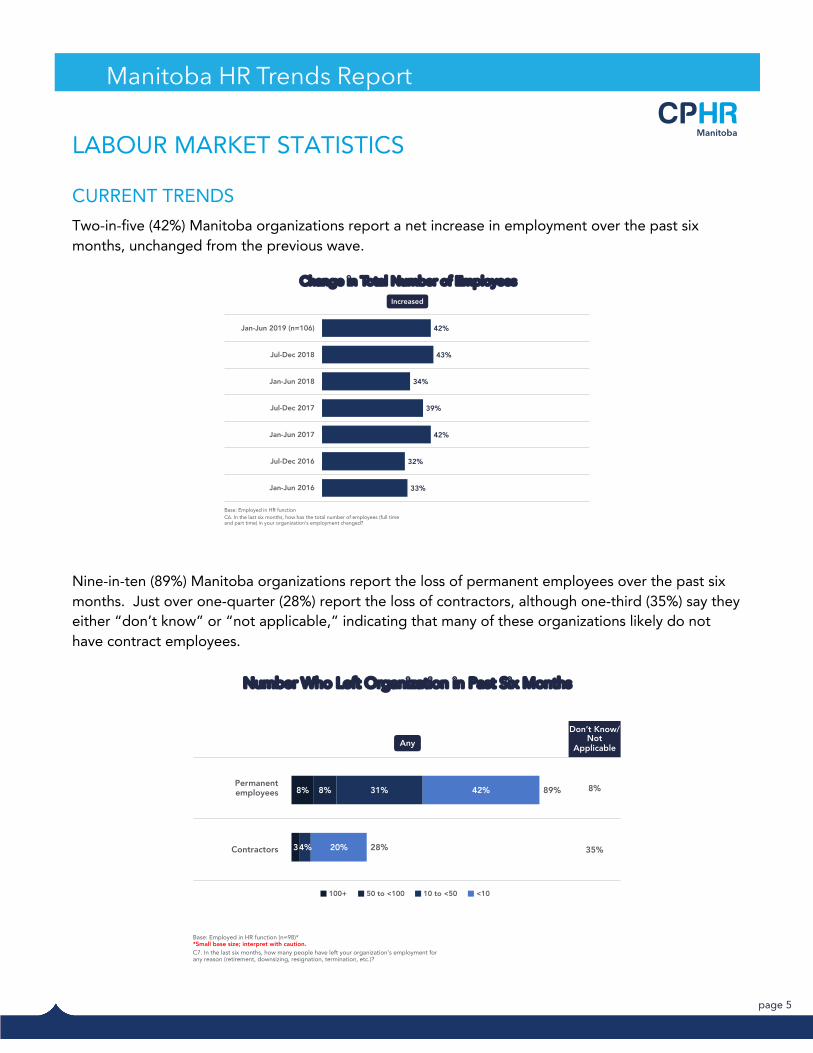
CURRENT TRENDS Two-in-five (42%) Manitoba organizations report a net increase in employment over the past six months, unchanged from the previous wave.
Nine-in-ten (89%) Manitoba organizations report the loss of permanent employees over the past six months. Just over one-quarter (28%) report the loss of contractors, although one-third (35%) say they either “don’t know” or “not applicable,” indicating that many of these organizations likely do not have contract employees.
Number Who Left Organization in Past Six Months
Base: Employed in HR function (n=98)**Small base size; interpret with caution.C7. In the last six months, how many people have left your organization’s employment for any reason (retirement, downsizing, resignation, termination, etc.)?
Don’t Know/Not
Applicable
Permanent employees 8%
Contractors 35%
8%
3
8% 31%
4%
42%
20%
89%
28%
100+ 50 to <100 10 to <50 <10
Any
Change in Total Number of Employees
Base: Employed in HR function C6. In the last six months, how has the total number of employees (full time and part time) in your organization’s employment changed?
Jan-Jun 2019 (n=106)
Jul-Dec 2018
Jan-Jun 2018
Jul-Dec 2017
Jan-Jun 2017
Jul-Dec 2016
Jan-Jun 2016
Increased
42%
43%
34%
39%
42%
32%
33%
page 6
Manitoba HR Trends Report
Manitoba
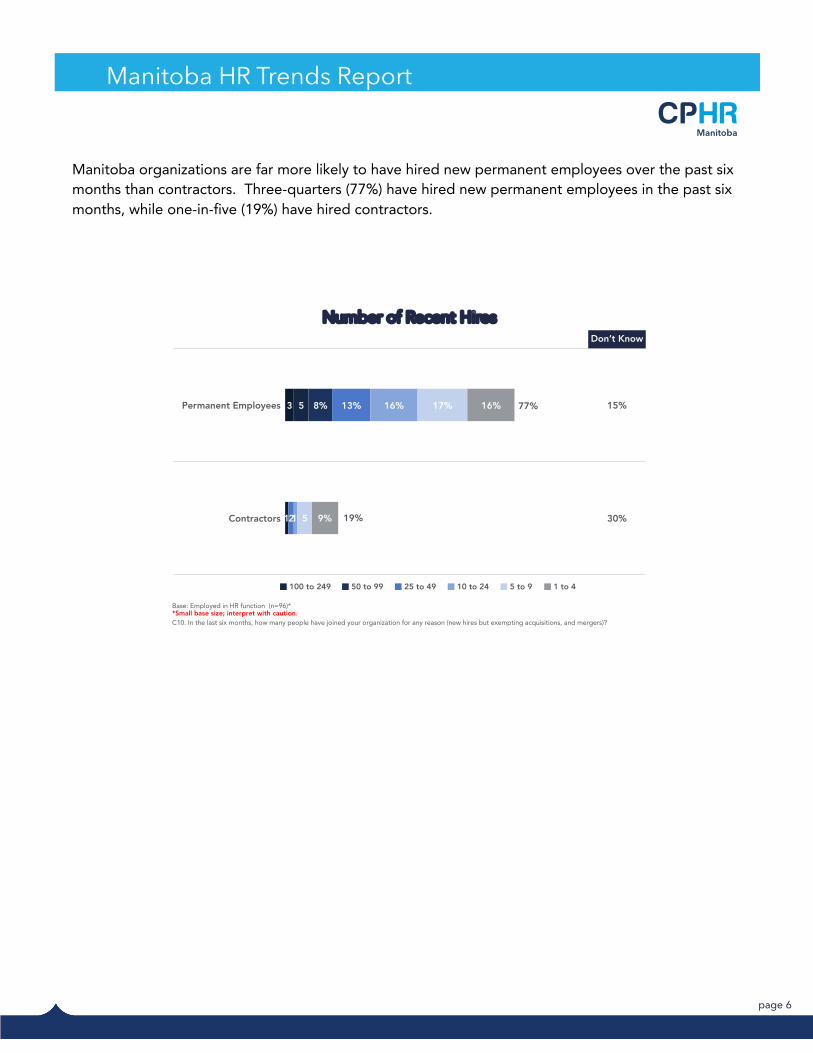
Manitoba organizations are far more likely to have hired new permanent employees over the past six months than contractors. Three-quarters (77%) have hired new permanent employees in the past six months, while one-in-five (19%) have hired contractors.
Number of Recent Hires
Base: Employed in HR function (n=96)**Small base size; interpret with caution.C10. In the last six months, how many people have joined your organization for any reason (new hires but exempting acquisitions, and mergers)?
Don’t Know
Permanent Employees 15%
Contractors 30%
3
1
5 8% 13%
1
16%
2
17%
5
16%
9%
100 to 249 50 to 99 25 to 49 10 to 24 5 to 9 1 to 4
77%
19%

page 7
Manitoba HR Trends Report
ManitobaTERMINATION CAUSES Resignation for a better opportunity (71%) is the most common reason employees left an organization over the past six months, followed by resignation for personal reasons (62%) and retirement (60%). Employees are equally likely to have left due to termination without cause (52%) and with cause (52%).
Termination for cause is the most common reason for executives, technical staff, administration/support staff, and other employees to have left Manitoba organizations in the second half of 2018. Managers are most likely to have retired, and tradespersons/journeypersons are most likely to have left because they were terminated
without cause. Resignation due to personal reasons or opportunity are the most common reasons for professionals to have left. Resignation for opportunity is also a common reason for technical staff.
Reasons for Leaving
Base: Employees left organization (n=87)**Small base size; interpret with caution.C8. In the last six months, how many people have left your organization’s employment for any reason (retirement, downsizing, resignation, termination, etc.)?
Don’t Know
Resignation for a better opportunity 14%
Resignation for personal reasons 15%
Retirement 13%
Termination without cause 16%
Termination for cause 17%
Other 24%
1
1
2
1
23%
14%
5%
8%
7%
6%
47%
47%
53%
43%
45%
14%
71%
62%
60%
52%
52%
20%
Any
100+ 50 to <100 10 to <50 <10
Average Number of People Who Left By Position
Base: Employees left organization (n=87*)*Small base size; interpret with caution C9a-e. In the last six months, how many people have left your organization’s employment for any reason (retirement, downsizing, resignation, termination, etc.)?
Employment Type
Executives Managers Professionals Technical Staff
Tradespersons/ Journeypersons
Administration/Support Staff Other
Retired 8.9 28.5 23.6 29.9 12.7 26.5 43.3
Terminated for cause 18.9 7.6 12.5 38.4 18.0 59.5 60.4
Resigned for personal reasons 1.2 17.4 37.8 31.7 26.8 28.1 40.8
Resigned for opportunity 1.1 23.2 39.4 36.9 26.1 45.2 43.2
Terminated without cause 12.7 16.9 26.6 31.0 32.4 37.0 46.4
page 8
Manitoba HR Trends Report
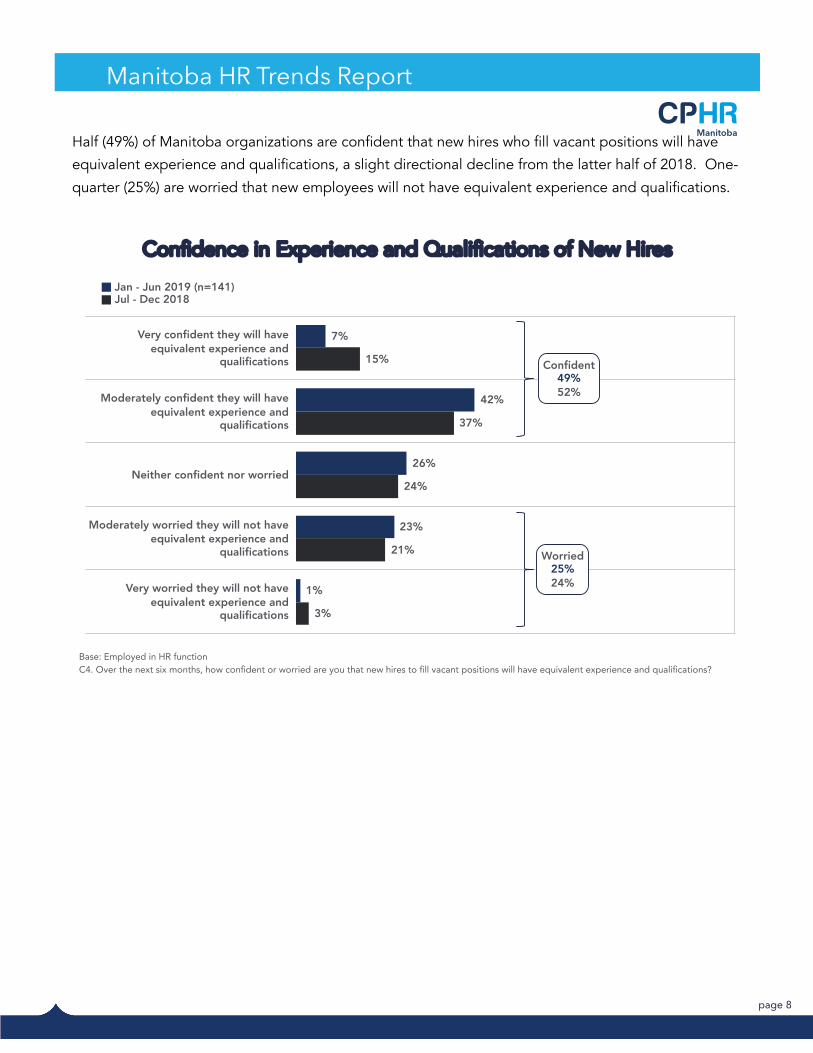
ManitobaHalf (49%) of Manitoba organizations are confident that new hires who fill vacant positions will have
equivalent experience and qualifications, a slight directional decline from the latter half of 2018. One-
quarter (25%) are worried that new employees will not have equivalent experience and qualifications.
Very confident they will have equivalent experience and
qualifications
Moderately confident they will have equivalent experience and
qualifications
Neither confident nor worried
Moderately worried they will not have equivalent experience and
qualifications
Very worried they will not have equivalent experience and
qualifications
Confidence in Experience and Qualifications of New Hires
Base: Employed in HR function C4. Over the next six months, how confident or worried are you that new hires to fill vacant positions will have equivalent experience and qualifications?
7%
42%
26%
23%
1%
15%
37%
24%
21%
3%
Jan - Jun 2019 (n=141)Jul - Dec 2018
Confident49%52%
Worried25%24%
page 9
Manitoba HR Trends Report
Manitoba
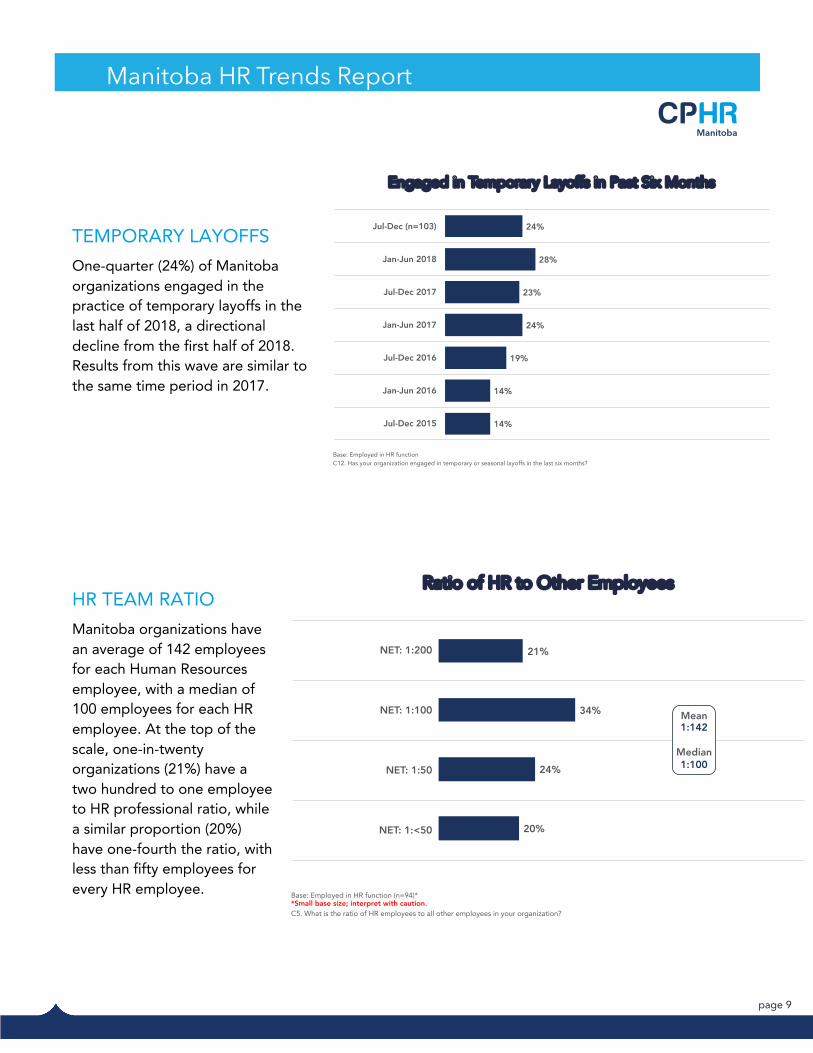
TEMPORARY LAYOFFS One-quarter (24%) of Manitoba organizations engaged in the practice of temporary layoffs in the last half of 2018, a directional decline from the first half of 2018. Results from this wave are similar to the same time period in 2017.
HR TEAM RATIO Manitoba organizations have an average of 142 employees for each Human Resources employee, with a median of 100 employees for each HR employee. At the top of the scale, one-in-twenty organizations (21%) have a two hundred to one employee to HR professional ratio, while a similar proportion (20%) have one-fourth the ratio, with less than fifty employees for every HR employee.
Ratio of HR to Other Employees
Base: Employed in HR function (n=94)**Small base size; interpret with caution.C5. What is the ratio of HR employees to all other employees in your organization?
NET: 1:200
NET: 1:100
NET: 1:50
NET: 1:<50
21%
34%
24%
20%
Mean1:142
Median1:100
Jul-Dec (n=103)
Jan-Jun 2018
Jul-Dec 2017
Jan-Jun 2017
Jul-Dec 2016
Jan-Jun 2016
Jul-Dec 2015
24%
28%
23%
24%
19%
14%
14%
Engaged in Temporary Layoffs in Past Six Months
Base: Employed in HR function C12. Has your organization engaged in temporary or seasonal layoffs in the last six months?
page 10
Manitoba HR Trends Report
Manitoba
EMPLOYEE DEVELOPMENT
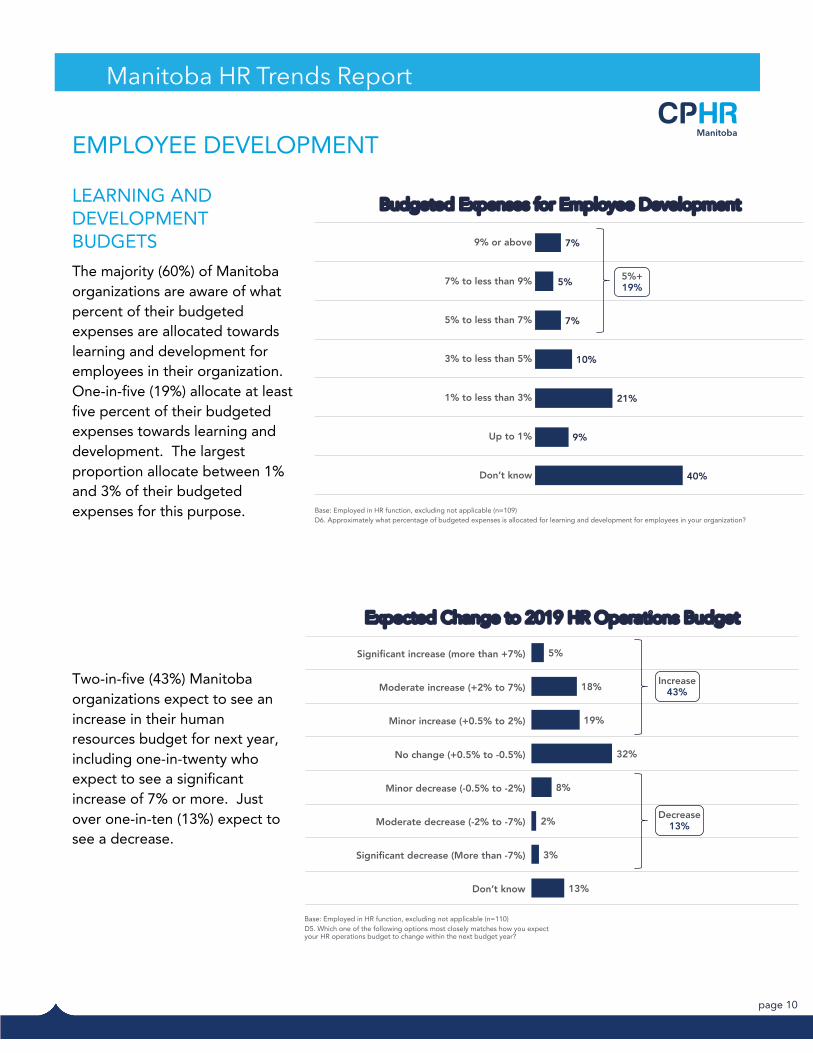
LEARNING AND DEVELOPMENT BUDGETS The majority (60%) of Manitoba organizations are aware of what percent of their budgeted expenses are allocated towards learning and development for employees in their organization. One-in-five (19%) allocate at least five percent of their budgeted expenses towards learning and development. The largest proportion allocate between 1% and 3% of their budgeted expenses for this purpose.
Two-in-five (43%) Manitoba organizations expect to see an increase in their human resources budget for next year, including one-in-twenty who expect to see a significant increase of 7% or more. Just over one-in-ten (13%) expect to see a decrease.
9% or above
7% to less than 9%
5% to less than 7%
3% to less than 5%
1% to less than 3%
Up to 1%
Don’t know
Budgeted Expenses for Employee Development
Base: Employed in HR function, excluding not applicable (n=109)D6. Approximately what percentage of budgeted expenses is allocated for learning and development for employees in your organization?
7%
5%
7%
10%
21%
9%
40%
5%+19%
Expected Change to 2019 HR Operations Budget
Base: Employed in HR function, excluding not applicable (n=110)D5. Which one of the following options most closely matches how you expect your HR operations budget to change within the next budget year?
Significant increase (more than +7%)
Moderate increase (+2% to 7%)
Minor increase (+0.5% to 2%)
No change (+0.5% to -0.5%)
Minor decrease (-0.5% to -2%)
Moderate decrease (-2% to -7%)
Significant decrease (More than -7%)
Don’t know
5%
18%
19%
32%
8%
2%
3%
13%
Increase43%
Decrease13%
page 11
Manitoba HR Trends Report
Manitoba
EMPLOYEE TURNOVER
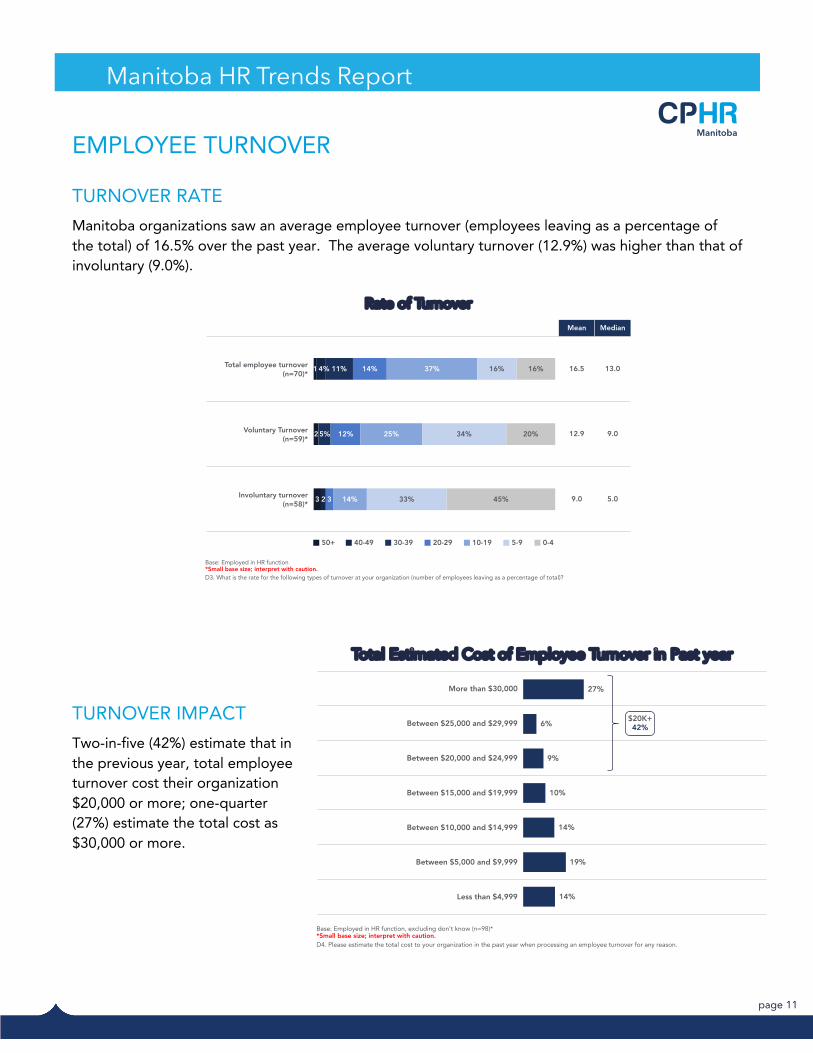
TURNOVER RATE Manitoba organizations saw an average employee turnover (employees leaving as a percentage of the total) of 16.5% over the past year. The average voluntary turnover (12.9%) was higher than that of involuntary (9.0%).
TURNOVER IMPACT Two-in-five (42%) estimate that in the previous year, total employee turnover cost their organization $20,000 or more; one-quarter (27%) estimate the total cost as $30,000 or more.
Mean Median
Total employee turnover (n=70)*
16.5 13.0
Voluntary Turnover (n=59)*
12.9 9.0
Involuntary turnover (n=58)*
9.0 5.0
Rate of Turnover
Base: Employed in HR function*Small base size; interpret with caution.D3. What is the rate for the following types of turnover at your organization (number of employees leaving as a percentage of total)?
1
2
3
4%
2
11%
5%
14%
12%
3
37%
25%
14%
16%
34%
33%
16%
20%
45%
50+ 40-49 30-39 20-29 10-19 5-9 0-4
More than $30,000
Between $25,000 and $29,999
Between $20,000 and $24,999
Between $15,000 and $19,999
Between $10,000 and $14,999
Between $5,000 and $9,999
Less than $4,999
Total Estimated Cost of Employee Turnover in Past year
Base: Employed in HR function, excluding don’t know (n=98)**Small base size; interpret with caution.D4. Please estimate the total cost to your organization in the past year when processing an employee turnover for any reason.
27%
6%
9%
10%
14%
19%
14%
$20K+42%

page 12
Manitoba HR Trends Report
Manitoba
In addition to direct monetary costs, just under three-quarters (72%) of Manitoba organizations report other effects of employee turnover, most commonly longer hours for remaining staff (47%), followed by a decline in employee engagement (36%). One-in-ten (8%) continue to believe that they have not hit revenue targets due to employee turnover.
Past Year Turnover Effects
Base: Employed in HR function, excluding not applicable (Jul-Dec 2018 n=119)D2. In the past year, how has employee turnover affected your organization?Note: “Employee engagement has declined” and “The organizational culture has declined” were added in the Jul-Dec 2018 wave.
47%
36%
26%
19%
12% 14%8%
18%
38%
10%15%
10% 8%
26%
42%
10% 12% 12% 10%
28%
39%
11%
18%14% 13%
32%
Longer hours for remaining staff
Employee engagement has
declined
The organizational
culture declined
We have not been able to grow as fast as planned
We have not been able to
take on certain projects
We have had to delay projects
for clients
We havenot hit
revenue targets
No impact
Jul-Dec 2018 Jul-Dec 2017 Jul-Dec 2016 Jul-Dec 2015
Had an Impact72%
page 13
Manitoba HR Trends Report
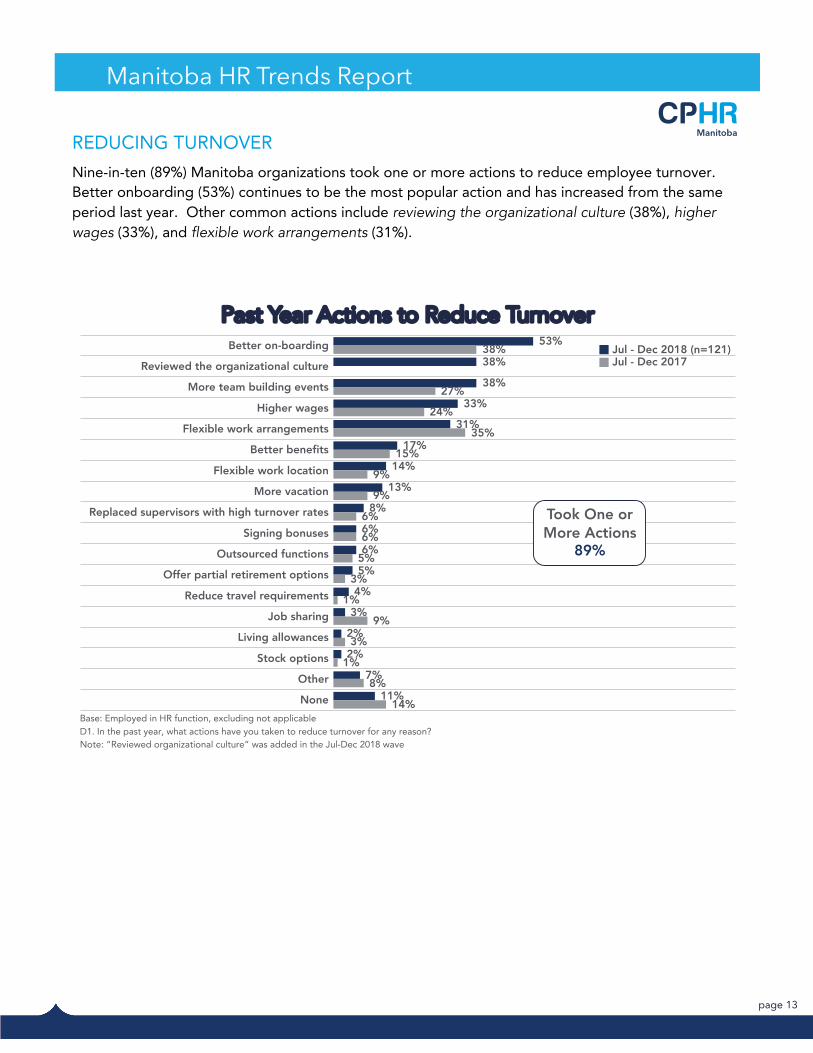
ManitobaREDUCING TURNOVER Nine-in-ten (89%) Manitoba organizations took one or more actions to reduce employee turnover. Better onboarding (53%) continues to be the most popular action and has increased from the same period last year. Other common actions include reviewing the organizational culture (38%), higher wages (33%), and flexible work arrangements (31%).
Past Year Actions to Reduce Turnover
Base: Employed in HR function, excluding not applicableD1. In the past year, what actions have you taken to reduce turnover for any reason?Note: “Reviewed organizational culture” was added in the Jul-Dec 2018 wave
Better on-boarding
Reviewed the organizational culture
More team building events
Higher wages
Flexible work arrangements
Better benefits
Flexible work location
More vacation
Replaced supervisors with high turnover rates
Signing bonuses
Outsourced functions
Offer partial retirement options
Reduce travel requirements
Job sharing
Living allowances
Stock options
Other
None
53%
38%
38%
33%
31%
17%
14%
13%
8%
6%
6%
5%
4%
3%
2%
2%
7%
11%
38%
27%
24%
35%
15%
9%
9%
6%
6%
5%
3%
1%
9%
3%
1%
8%
14%
Jul - Dec 2018 (n=121)Jul - Dec 2017
Took One orMore Actions
89%
page 14
Manitoba HR Trends Report
Manitoba
PERFORMANCE MANAGEMENT
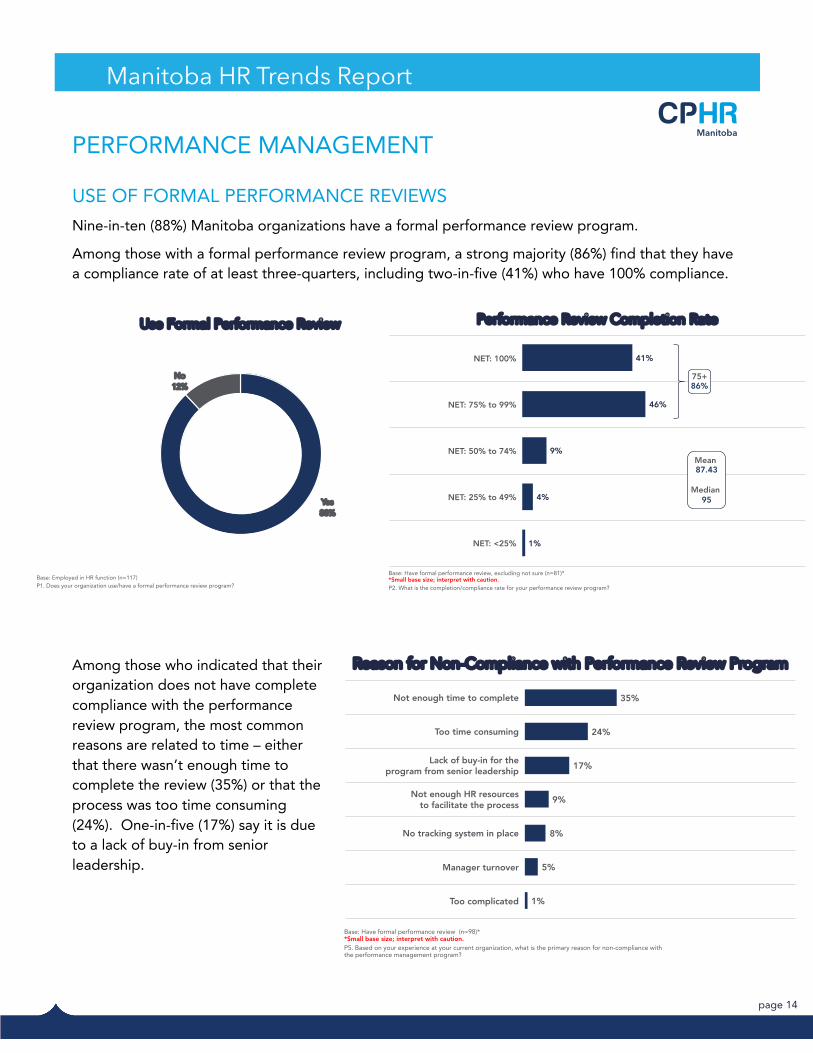
USE OF FORMAL PERFORMANCE REVIEWS Nine-in-ten (88%) Manitoba organizations have a formal performance review program.
Among those with a formal performance review program, a strong majority (86%) find that they have a compliance rate of at least three-quarters, including two-in-five (41%) who have 100% compliance.
Among those who indicated that their organization does not have complete compliance with the performance review program, the most common reasons are related to time – either that there wasn’t enough time to complete the review (35%) or that the process was too time consuming (24%). One-in-five (17%) say it is due to a lack of buy-in from senior leadership.
Use Formal Performance Review
Base: Employed in HR function (n=117)P1. Does your organization use/have a formal performance review program?
Yes 88%
No 12%
Performance Review Completion Rate
Base: Have formal performance review, excluding not sure (n=81)**Small base size; interpret with caution.P2. What is the completion/compliance rate for your performance review program?
NET: 100%
NET: 75% to 99%
NET: 50% to 74%
NET: 25% to 49%
NET: <25%
41%
46%
9%
4%
1%
75+86%
Mean 87.43
Median 95
Reason for Non-Compliance with Performance Review Program
Base: Have formal performance review (n=98)**Small base size; interpret with caution.P5. Based on your experience at your current organization, what is the primary reason for non-compliance with the performance management program?
Not enough time to complete
Too time consuming
Lack of buy-in for the program from senior leadership
Not enough HR resources to facilitate the process
No tracking system in place
Manager turnover
Too complicated
35%
24%
17%
9%
8%
5%
1%

page 15
Manitoba HR Trends Report
ManitobaAPPLICATION OF FORMAL PERFORMANCE REVIEW PROGRAM The majority (63%) of those with formal performance review programs conduct a review annually. Two-in-five (37%) conduct more frequent reviews, including just under one-in-ten (7%) who do so monthly.
The majority report that their performance review program includes both performance ratings/rankings (73%) and qualitative observations (64%). Less than half (41%) report having quantitative benchmarks.
Another three-quarters (75%) report having a self-assessment process as part of the performance management review.
Performance Review Frequency
Base: Have formal performance review (n=103)P1a. What is the frequency of the performance review process?
Annual performance reviews
Semi-annual performance reviews
Quarterly performance reviews
Monthly formal performance review meetings
63%
17%
13%
7%
More Than Once a Year37%
Performance Review Components
Base: Have formal performance review (n=102)P3. Does your performance review program include the following?
Performance ratings/rankings
Qualitative observations
Quantitative benchmarks
None of the above
73%
64%
41%
12%
Self-Assessment Process as Part of Performance Review
Base: Employed in HR function (n=110)P9. Does your performance management review process allow for self-assessment as part of the review?
Yes75%
No23%
Don't know3%
page 16
Manitoba HR Trends Report
Manitoba
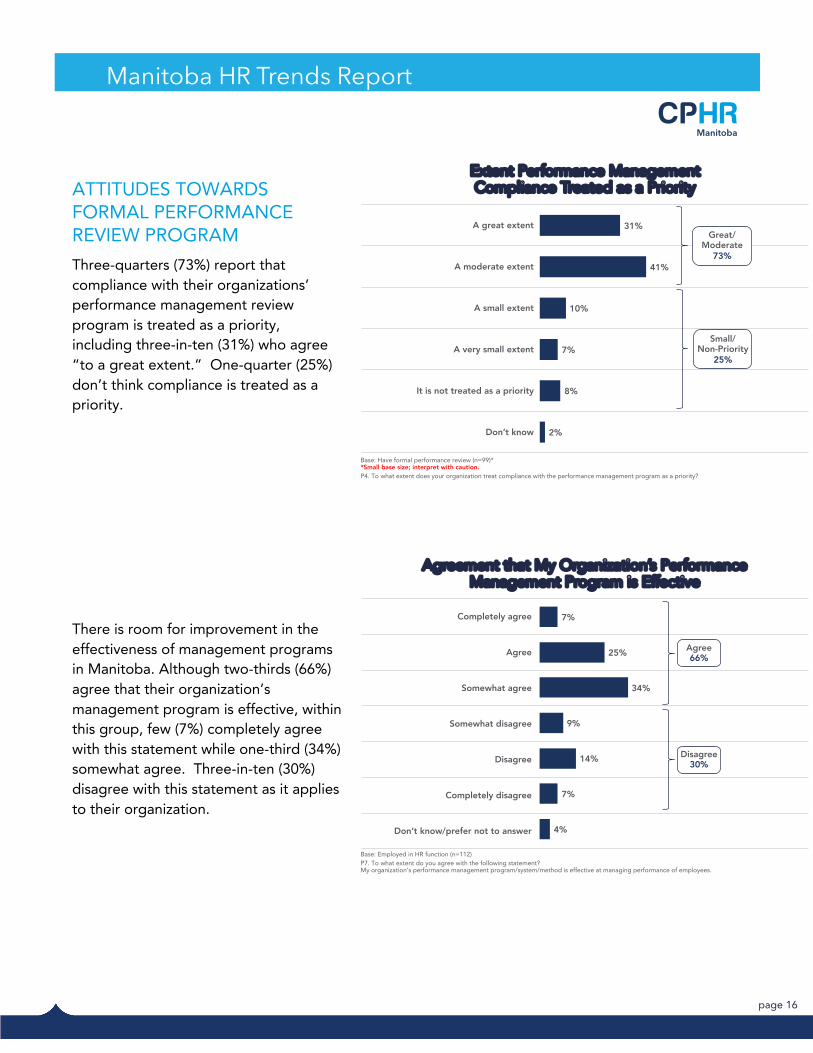
ATTITUDES TOWARDS FORMAL PERFORMANCE REVIEW PROGRAM Three-quarters (73%) report that compliance with their organizations’ performance management review program is treated as a priority, including three-in-ten (31%) who agree “to a great extent.” One-quarter (25%) don’t think compliance is treated as a priority.
There is room for improvement in the effectiveness of management programs in Manitoba. Although two-thirds (66%) agree that their organization’s management program is effective, within this group, few (7%) completely agree with this statement while one-third (34%) somewhat agree. Three-in-ten (30%) disagree with this statement as it applies to their organization.
Extent Performance Management Compliance Treated as a Priority
Base: Have formal performance review (n=99)**Small base size; interpret with caution.P4. To what extent does your organization treat compliance with the performance management program as a priority?
A great extent
A moderate extent
A small extent
A very small extent
It is not treated as a priority
Don’t know
31%
41%
10%
7%
8%
2%
Great/Moderate
73%
Small/Non-Priority
25%
Agreement that My Organization’s Performance Management Program is Effective
Base: Employed in HR function (n=112)P7. To what extent do you agree with the following statement? My organization’s performance management program/system/method is effective at managing performance of employees.
Completely agree
Agree
Somewhat agree
Somewhat disagree
Disagree
Completely disagree
Don’t know/prefer not to answer
7%
25%
34%
9%
14%
7%
4%
Agree66%
Disagree30%
page 17
Manitoba HR Trends Report
Manitoba
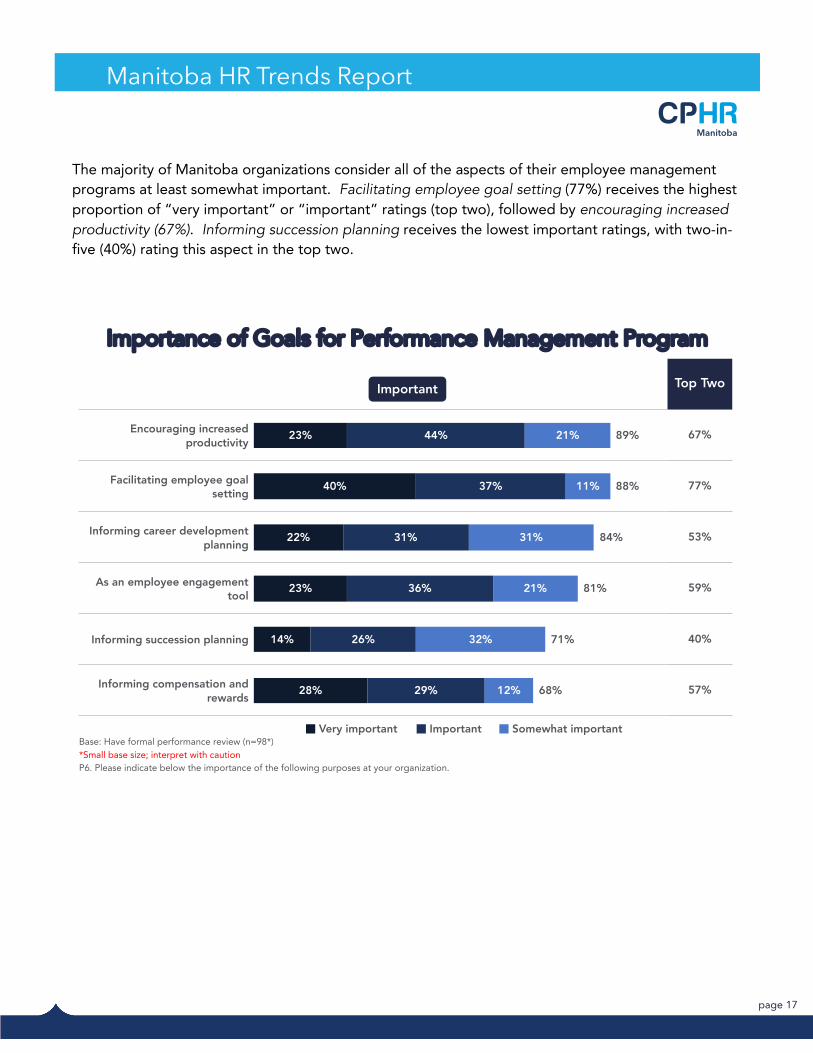
The majority of Manitoba organizations consider all of the aspects of their employee management programs at least somewhat important. Facilitating employee goal setting (77%) receives the highest proportion of “very important” or “important” ratings (top two), followed by encouraging increased productivity (67%). Informing succession planning receives the lowest important ratings, with two-in-five (40%) rating this aspect in the top two.
Top Two
Encouraging increased productivity
67%
Facilitating employee goal setting
77%
Informing career development planning
53%
As an employee engagement tool
59%
Informing succession planning 40%
Informing compensation and rewards
57%
Importance of Goals for Performance Management Program
Base: Have formal performance review (n=98*)*Small base size; interpret with cautionP6. Please indicate below the importance of the following purposes at your organization.
23%
40%
22%
23%
14%
28%
44%
37%
31%
36%
26%
29%
21%
11%
31%
21%
32%
12%
89%
88%
84%
81%
71%
68%
Important
Very important Important Somewhat important
page 18
Manitoba HR Trends Report
Manitoba
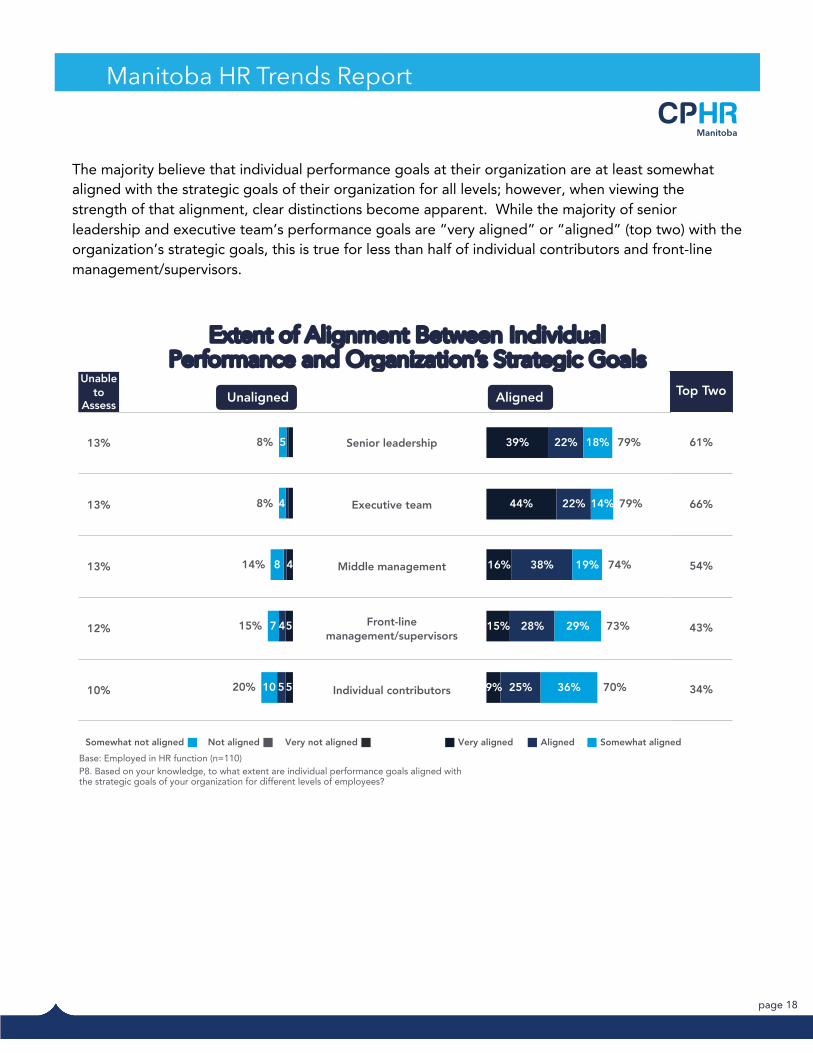
The majority believe that individual performance goals at their organization are at least somewhat aligned with the strategic goals of their organization for all levels; however, when viewing the strength of that alignment, clear distinctions become apparent. While the majority of senior leadership and executive team’s performance goals are “very aligned” or “aligned” (top two) with the organization’s strategic goals, this is true for less than half of individual contributors and front-line management/supervisors.
Extent of Alignment Between Individual Performance and Organization’s Strategic Goals
Base: Employed in HR function (n=110)P8. Based on your knowledge, to what extent are individual performance goals aligned with the strategic goals of your organization for different levels of employees?
Unable to
AssessTop Two
13% Senior leadership 61%
13% Executive team 66%
13% Middle management 54%
12% Front-line management/supervisors
43%
10% Individual contributors 34%
39%
44%
16%
15%
9%
22%
22%
38%
28%
25%
18%
14%
19%
29%
36%
79%
79%
74%
73%
70%
AlignedUnaligned
Very aligned Aligned Somewhat alignedVery not alignedNot alignedSomewhat not aligned
4
5
5
4
5
5
4
8
7
10
8%
8%
14%
15%
20%
page 19
Manitoba HR Trends Report
Manitoba
TRUTH AND RECONCILIATION
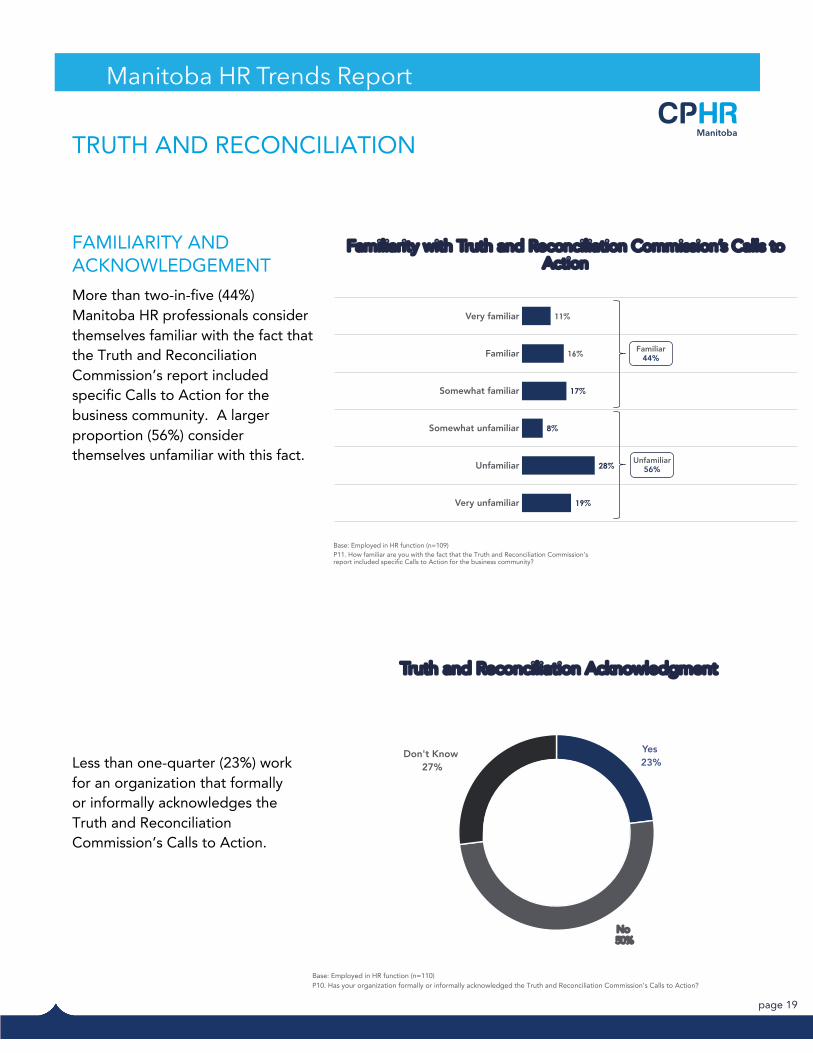
FAMILIARITY AND ACKNOWLEDGEMENT More than two-in-five (44%) Manitoba HR professionals consider themselves familiar with the fact that the Truth and Reconciliation Commission’s report included specific Calls to Action for the business community. A larger proportion (56%) consider themselves unfamiliar with this fact.
Less than one-quarter (23%) work for an organization that formally or informally acknowledges the Truth and Reconciliation Commission’s Calls to Action.
Truth and Reconciliation Acknowledgment
Base: Employed in HR function (n=110) P10. Has your organization formally or informally acknowledged the Truth and Reconciliation Commission’s Calls to Action?
Yes23%
Don't Know27%
No50%
Very familiar
Familiar
Somewhat familiar
Somewhat unfamiliar
Unfamiliar
Very unfamiliar
Familiarity with Truth and Reconciliation Commission’s Calls to Action
Base: Employed in HR function (n=109)P11. How familiar are you with the fact that the Truth and Reconciliation Commission’s report included specific Calls to Action for the business community?
11%
16%
17%
8%
28%
19%
Unfamiliar56%
Familiar44%
page 20
Manitoba HR Trends Report
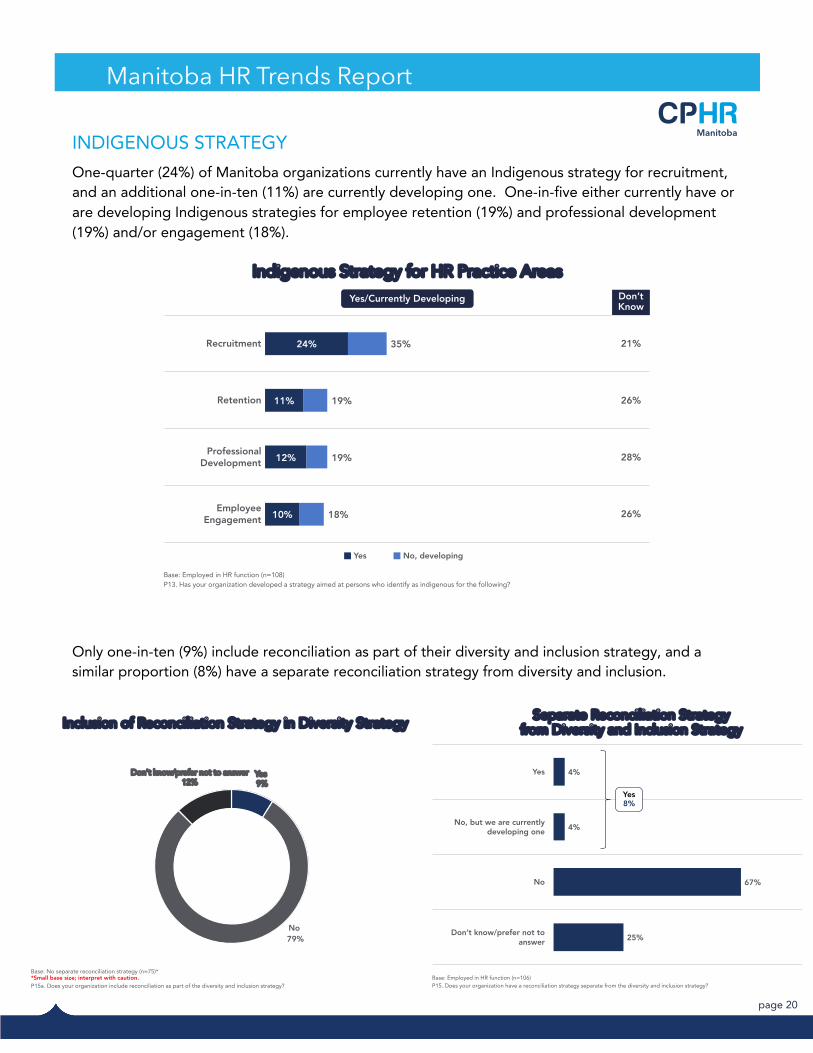
ManitobaINDIGENOUS STRATEGY One-quarter (24%) of Manitoba organizations currently have an Indigenous strategy for recruitment, and an additional one-in-ten (11%) are currently developing one. One-in-five either currently have or are developing Indigenous strategies for employee retention (19%) and professional development (19%) and/or engagement (18%).
Only one-in-ten (9%) include reconciliation as part of their diversity and inclusion strategy, and a similar proportion (8%) have a separate reconciliation strategy from diversity and inclusion.
Inclusion of Reconciliation Strategy in Diversity Strategy
Base: No separate reconciliation strategy (n=75)**Small base size; interpret with caution.P15a. Does your organization include reconciliation as part of the diversity and inclusion strategy?
No79%
Don't know/prefer not to answer12%
Yes9%
Yes
No, but we are currently developing one
No
Don’t know/prefer not to answer
Separate Reconciliation Strategy from Diversity and Inclusion Strategy
Base: Employed in HR function (n=106)P15. Does your organization have a reconciliation strategy separate from the diversity and inclusion strategy?
4%
4%
67%
25%
Yes8%
Don’tKnow
Recruitment 21%
Retention 26%
Professional Development 28%
Employee Engagement 26%
24%
11%
12%
10%
35%
19%
19%
18%
Indigenous Strategy for HR Practice Areas
Base: Employed in HR function (n=108)P13. Has your organization developed a strategy aimed at persons who identify as indigenous for the following?
Yes No, developing
Yes/Currently Developing
page 21
Manitoba HR Trends Report
Manitoba
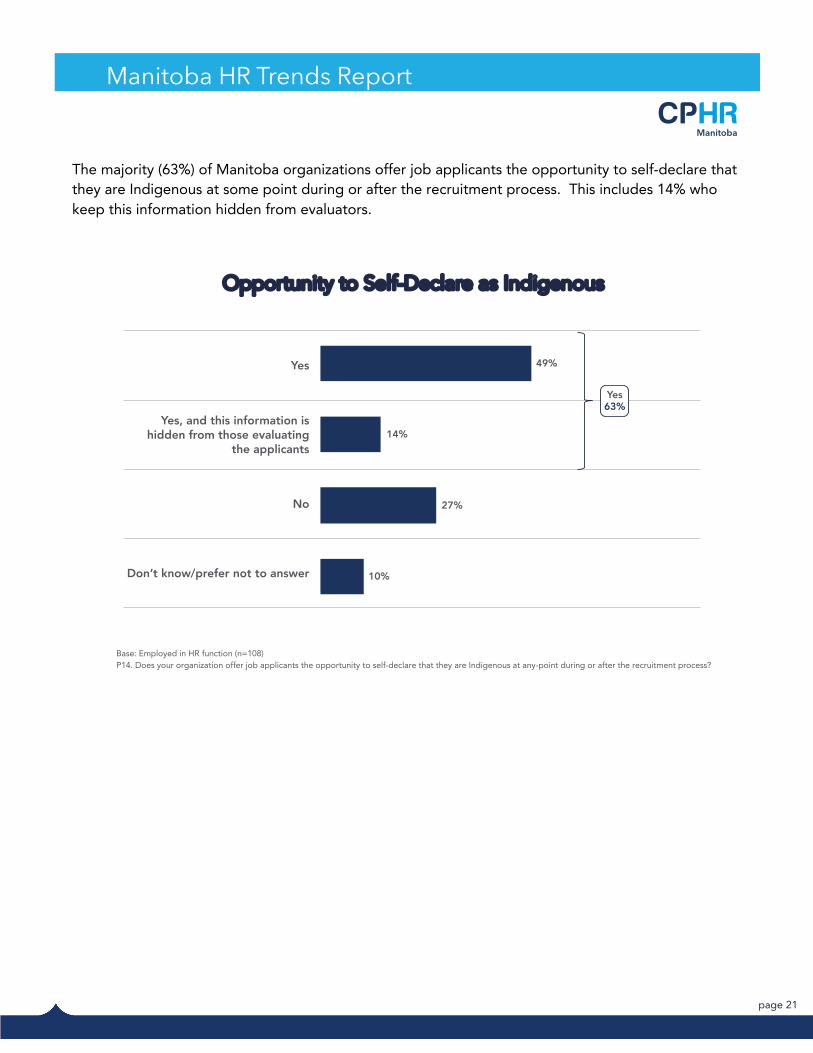
The majority (63%) of Manitoba organizations offer job applicants the opportunity to self-declare that they are Indigenous at some point during or after the recruitment process. This includes 14% who keep this information hidden from evaluators.
Yes
Yes, and this information is hidden from those evaluating
the applicants
No
Don’t know/prefer not to answer
Opportunity to Self-Declare as Indigenous
Base: Employed in HR function (n=108)P14. Does your organization offer job applicants the opportunity to self-declare that they are Indigenous at any-point during or after the recruitment process?
49%
14%
27%
10%
Yes63%
page 22
Manitoba HR Trends Report
Manitoba
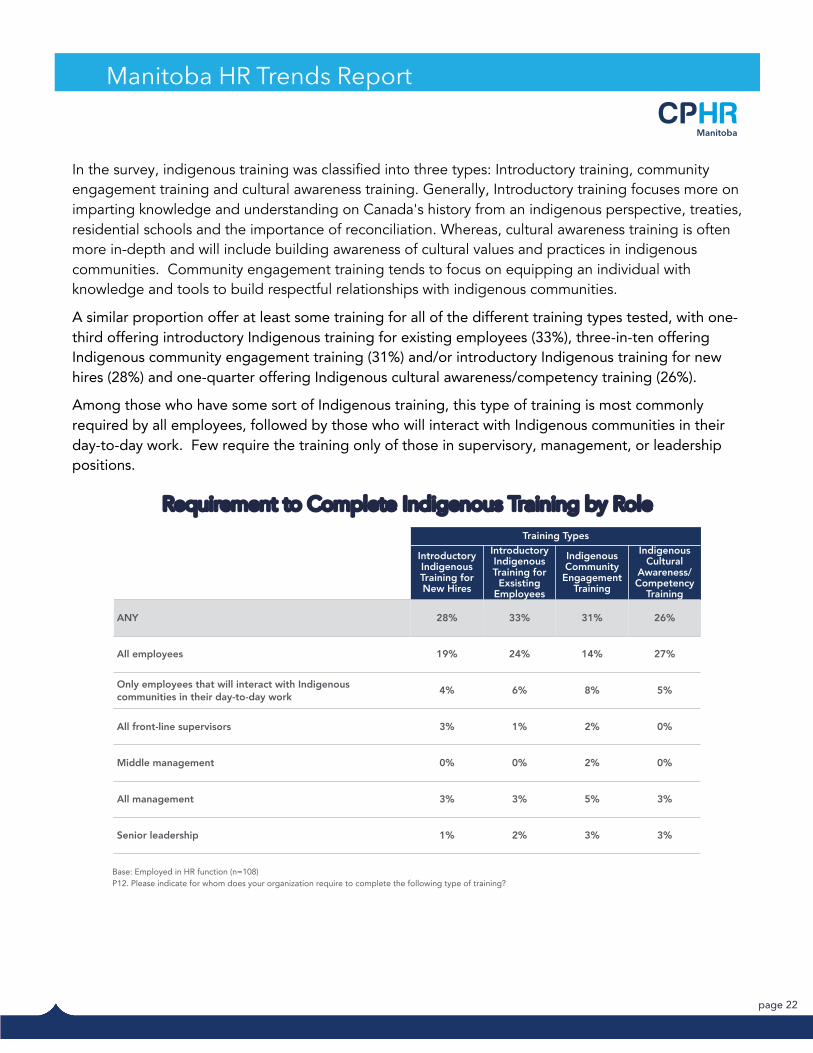
In the survey, indigenous training was classified into three types: Introductory training, community engagement training and cultural awareness training. Generally, Introductory training focuses more on imparting knowledge and understanding on Canada's history from an indigenous perspective, treaties, residential schools and the importance of reconciliation. Whereas, cultural awareness training is often more in-depth and will include building awareness of cultural values and practices in indigenous communities. Community engagement training tends to focus on equipping an individual with knowledge and tools to build respectful relationships with indigenous communities.
A similar proportion offer at least some training for all of the different training types tested, with one-third offering introductory Indigenous training for existing employees (33%), three-in-ten offering Indigenous community engagement training (31%) and/or introductory Indigenous training for new hires (28%) and one-quarter offering Indigenous cultural awareness/competency training (26%).
Among those who have some sort of Indigenous training, this type of training is most commonly required by all employees, followed by those who will interact with Indigenous communities in their day-to-day work. Few require the training only of those in supervisory, management, or leadership positions.
Requirement to Complete Indigenous Training by Role
Base: Employed in HR function (n=108)P12. Please indicate for whom does your organization require to complete the following type of training?
Training Types
Introductory Indigenous Training for New Hires
Introductory Indigenous Training for
Exsisting Employees
Indigenous Community
Engagement Training
Indigenous Cultural
Awareness/Competency
Training
ANY 28% 33% 31% 26%
All employees 19% 24% 14% 27%
Only employees that will interact with Indigenous communities in their day-to-day work 4% 6% 8% 5%
All front-line supervisors 3% 1% 2% 0%
Middle management 0% 0% 2% 0%
All management 3% 3% 5% 3%
Senior leadership 1% 2% 3% 3%
page 23
Manitoba HR Trends Report
Manitoba
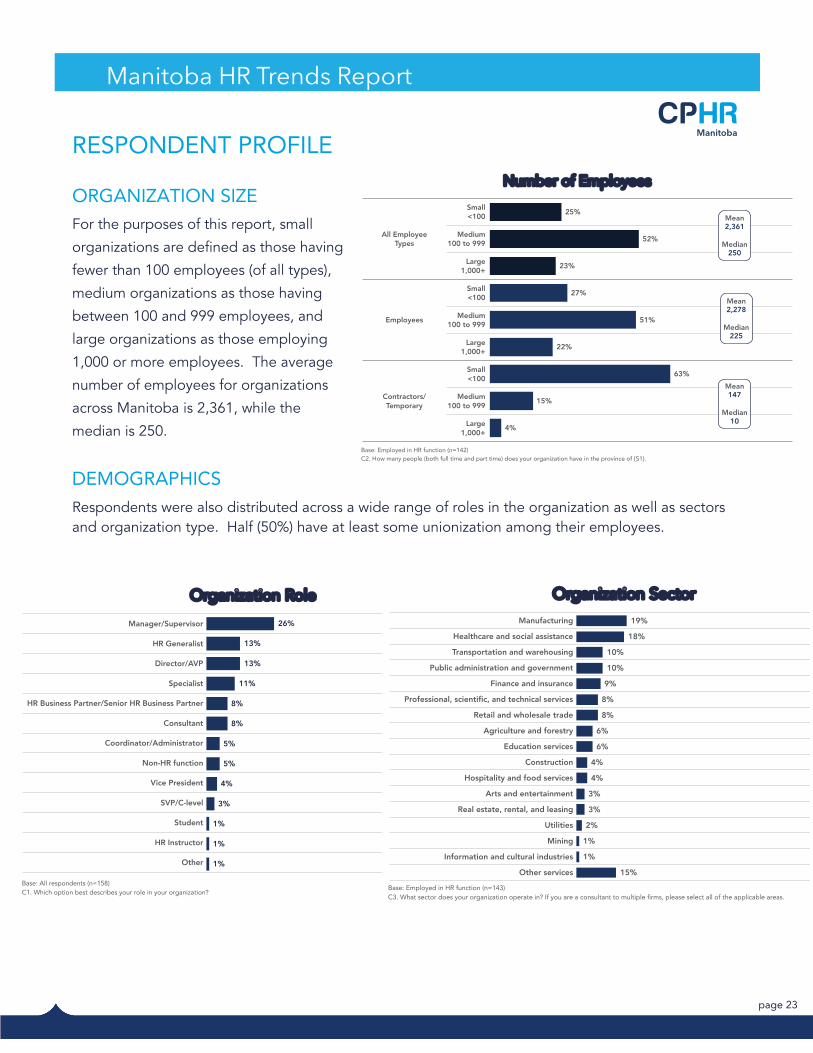
RESPONDENT PROFILE
ORGANIZATION SIZE For the purposes of this report, small
organizations are defined as those having
fewer than 100 employees (of all types),
medium organizations as those having
between 100 and 999 employees, and
large organizations as those employing
1,000 or more employees. The average
number of employees for organizations
across Manitoba is 2,361, while the
median is 250.
DEMOGRAPHICS Respondents were also distributed across a wide range of roles in the organization as well as sectors and organization type. Half (50%) have at least some unionization among their employees.
Number of Employees
Base: Employed in HR function (n=142)C2. How many people (both full time and part time) does your organization have in the province of {S1}.
All EmployeeTypes
Small<100
Medium100 to 999
Large1,000+
Employees
Small<100
Medium100 to 999
Large1,000+
Contractors/Temporary
Small<100
Medium100 to 999
Large1,000+
25%
52%
23%
27%
51%
22%
63%
15%
4%
Mean2,361
Median250
Mean2,278
Median225
Mean147
Median10
Organization Role
Base: All respondents (n=158)C1. Which option best describes your role in your organization?
Manager/Supervisor
HR Generalist
Director/AVP
Specialist
HR Business Partner/Senior HR Business Partner
Consultant
Coordinator/Administrator
Non-HR function
Vice President
SVP/C-level
Student
HR Instructor
Other
26%
13%
13%
11%
8%
8%
5%
5%
4%
3%
1%
1%
1%
Organization Sector
Base: Employed in HR function (n=143)C3. What sector does your organization operate in? If you are a consultant to multiple firms, please select all of the applicable areas.
Manufacturing
Healthcare and social assistance
Transportation and warehousing
Public administration and government
Finance and insurance
Professional, scientific, and technical services
Retail and wholesale trade
Agriculture and forestry
Education services
Construction
Hospitality and food services
Arts and entertainment
Real estate, rental, and leasing
Utilities
Mining
Information and cultural industries
Other services
19%
18%
10%
10%
9%
8%
8%
6%
6%
4%
4%
3%
3%
2%
1%
1%
15%
page 24
Manitoba HR Trends Report
Manitoba
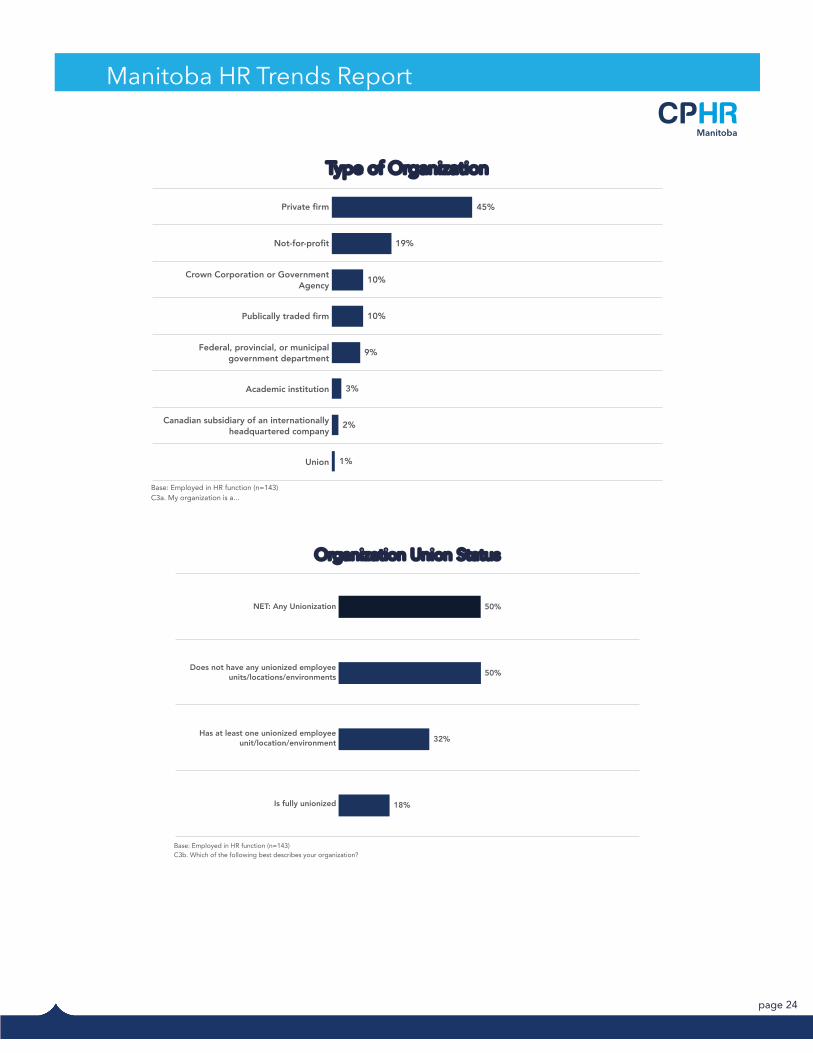
Type of Organization
Base: Employed in HR function (n=143) C3a. My organization is a...
Private firm
Not-for-profit
Crown Corporation or Government Agency
Publically traded firm
Federal, provincial, or municipal government department
Academic institution
Canadian subsidiary of an internationally headquartered company
Union
45%
19%
10%
10%
9%
3%
2%
1%
Organization Union Status
Base: Employed in HR function (n=143)C3b. Which of the following best describes your organization?
NET: Any Unionization
Does not have any unionized employee units/locations/environments
Has at least one unionized employee unit/location/environment
Is fully unionized
50%
50%
32%
18%
page 25
Manitoba HR Trends Report
Manitoba
CONTACT INFORMATION For media inquiries, contact: Megan Funnell Marketing & Communications Specialist CPHR Manitoba Phone: 204-954-8370 Email: [email protected] For inquiries regarding the survey and analysis, contact: Laura Haines-Morrissette Director of Marketing, Partnerships & Membership CPHR Manitoba Phone: 204-943-0882 Email: [email protected] For inquiries regarding the methodology and survey tool, contact: Daile MacDonald Research Director, Insights West Phone: 403-926-3192 Email: [email protected]
ABOUT THE ORGANIZATION Chartered Professionals in Human Resources of Manitoba CPHR Manitoba is the professional association dedicated to strengthening the human resources profession and upholding the highest standards of practice. We link members, businesses, and the general public to important HR issues and trends that are occurring provincially, nationally, and globally.
CPHR Manitoba is the exclusive certifying body in Manitoba for the nationally recognized Chartered Professional in Human Resources (CPHR) designation - the leading standard for HR professionals in Canada. The CPHR demonstrates HR expertise, experience and ethical management of today's human capital.