MANIPUR - IBEF · 5 MANIPUR For updated information, please visit MANIPUR - FACT FILE Source:...
42
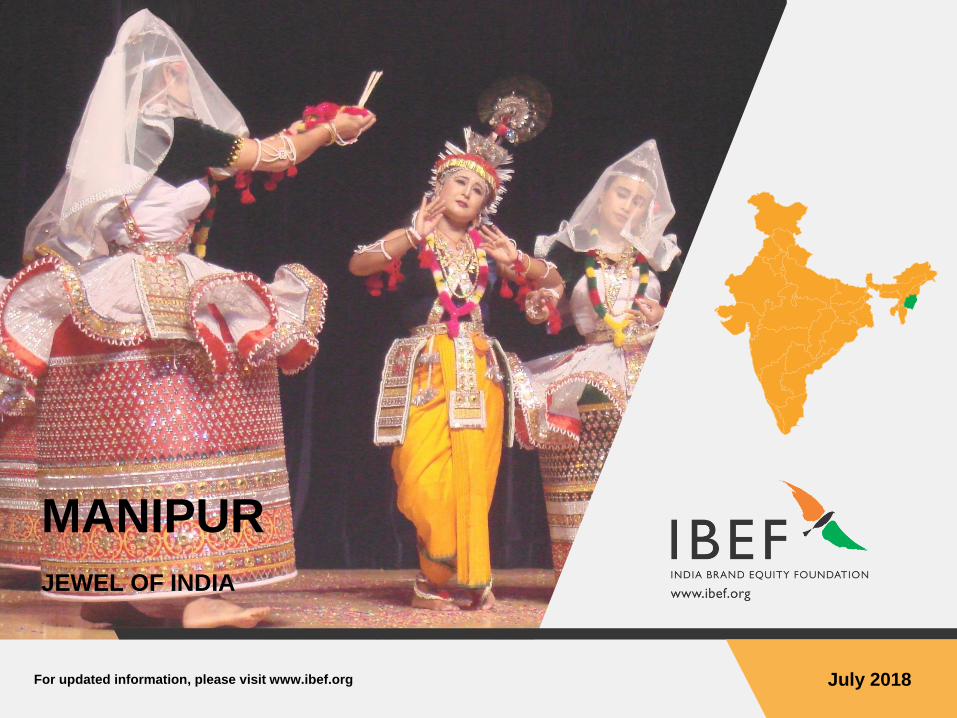
For updated information, please visit www.ibef.org July 2018 MANIPUR JEWEL OF INDIA
Transcript of MANIPUR - IBEF · 5 MANIPUR For updated information, please visit MANIPUR - FACT FILE Source:...
For updated information, please visit www.ibef.org July 2018
MANIPUR
JEWEL OF INDIA
Table of Content
Executive Summary .…………….…….…....3
Introduction ……..………………………...….4
Economic Snapshot ……………….….…….9
Physical Infrastructure ………..……...........14
Social Infrastructure ...................................21
Industrial Infrastructure ……..……….........25
Key Sectors ………….………………..…...27
Key Procedures & Policies………………...32
Annexure.………….……..….......................39

For updated information, please visit www.ibef.org MANIPUR 3
EXECUTIVE SUMMARY
Source: Ministry of Industries, Ministry of Tourism, Textile and Power, News articles, Lok Sabha
Manipur is one of India’s largest bamboo producing states and a major contributor to the country’s bamboo
industry. In 2017, the state accounted for 10,687 square km of bamboo bearing area.
Flourishing bamboo
processing industry
Manipur has the highest number of handicrafts units as well as the highest number of craft persons
comprising skilled and semi-skilled artisans in the entire north-eastern region.
Strong handicrafts
industry
Handlooms is the largest cottage industry in Manipur and the state ranks among the top five in terms of the
number of looms in the country.
Strong handlooms
industry
Manipur has the advantage of acting as India’s ‘Gateway to the East’ through Moreh town, which is the only
feasible land route for trade between India and Myanmar and other Southeast Asian countries.
Strong border trade
opportunities
The Ema Bazaar is one of India’s largest markets run by women. This market majorly sells handloom and
handicraft products such as earthen pots, knives, shawls and puppets; as well as all kinds of dried fish and
vegetables.
Largest women-run
market in the country
Due to its wealth of flora and fauna, Manipur is described as a ‘flower on lofty heights’, ‘a jewel of India’ and
‘Switzerland of the East’. Its breath-taking scenic beauty makes it a tourist’s paradise. A tourist’s paradise

MANIPUR
INTRODUCTION
For updated information, please visit www.ibef.org MANIPUR 5
MANIPUR - FACT FILE
Source: Ministry of Health & Family Welfare, Government of Manipur Census 2011
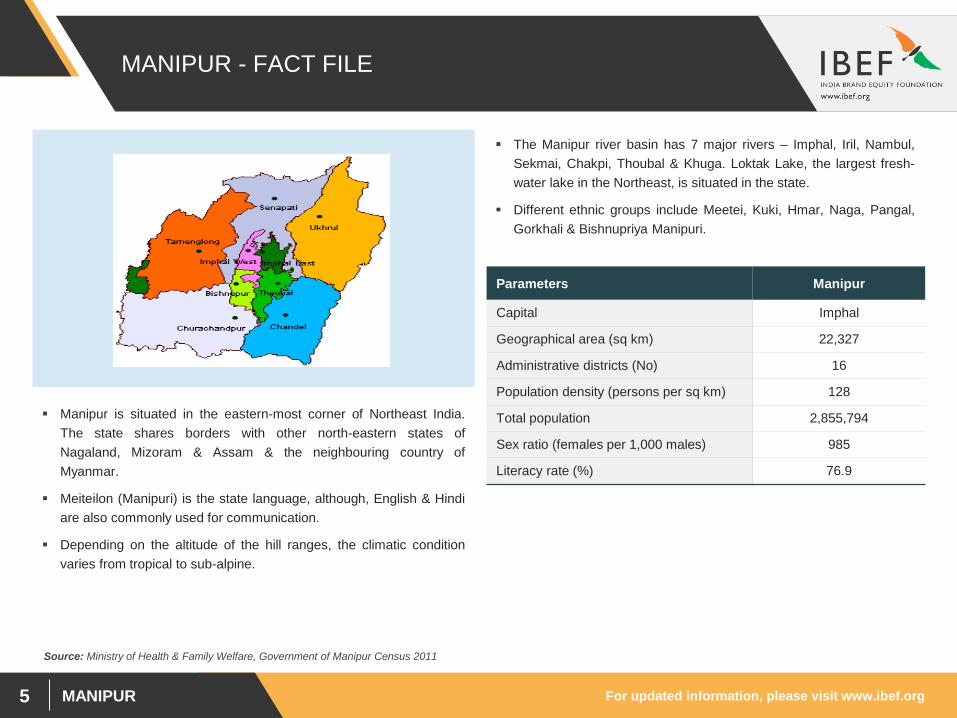
Manipur is situated in the eastern-most corner of Northeast India.
The state shares borders with other north-eastern states of
Nagaland, Mizoram & Assam & the neighbouring country of
Myanmar.
Meiteilon (Manipuri) is the state language, although, English & Hindi
are also commonly used for communication.
Depending on the altitude of the hill ranges, the climatic condition
varies from tropical to sub-alpine.
The Manipur river basin has 7 major rivers – Imphal, Iril, Nambul,
Sekmai, Chakpi, Thoubal & Khuga. Loktak Lake, the largest fresh-
water lake in the Northeast, is situated in the state.
Different ethnic groups include Meetei, Kuki, Hmar, Naga, Pangal,
Gorkhali & Bishnupriya Manipuri.
Parameters Manipur
Capital Imphal
Geographical area (sq km) 22,327
Administrative districts (No) 16
Population density (persons per sq km) 128
Total population 2,855,794
Sex ratio (females per 1,000 males) 985
Literacy rate (%) 76.9
For updated information, please visit www.ibef.org MANIPUR 6
ADVANTAGE: MANIPUR
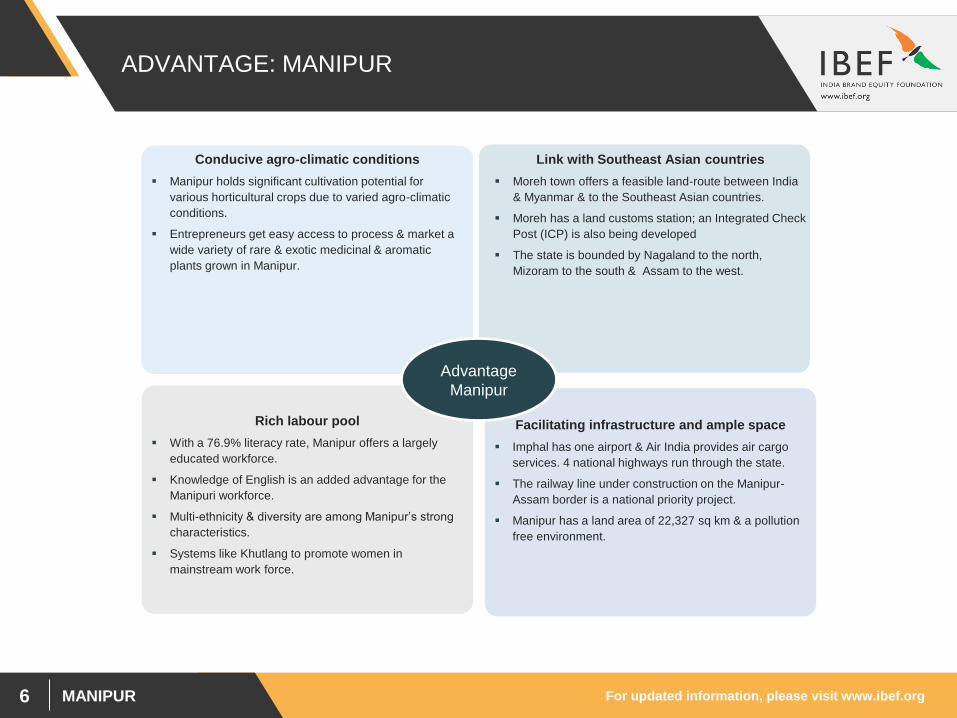
Conducive agro-climatic conditions
Manipur holds significant cultivation potential for
various horticultural crops due to varied agro-climatic
conditions.
Entrepreneurs get easy access to process & market a
wide variety of rare & exotic medicinal & aromatic
plants grown in Manipur.
Link with Southeast Asian countries
Moreh town offers a feasible land-route between India
& Myanmar & to the Southeast Asian countries.
Moreh has a land customs station; an Integrated Check
Post (ICP) is also being developed
The state is bounded by Nagaland to the north,
Mizoram to the south & Assam to the west.
Facilitating infrastructure and ample space
Imphal has one airport & Air India provides air cargo
services. 4 national highways run through the state.
The railway line under construction on the Manipur-
Assam border is a national priority project.
Manipur has a land area of 22,327 sq km & a pollution
free environment.
Rich labour pool
With a 76.9% literacy rate, Manipur offers a largely
educated workforce.
Knowledge of English is an added advantage for the
Manipuri workforce.
Multi-ethnicity & diversity are among Manipur’s strong
characteristics.
Systems like Khutlang to promote women in
mainstream work force.
Advantage
Manipur
For updated information, please visit www.ibef.org MANIPUR 7
STARE VISION
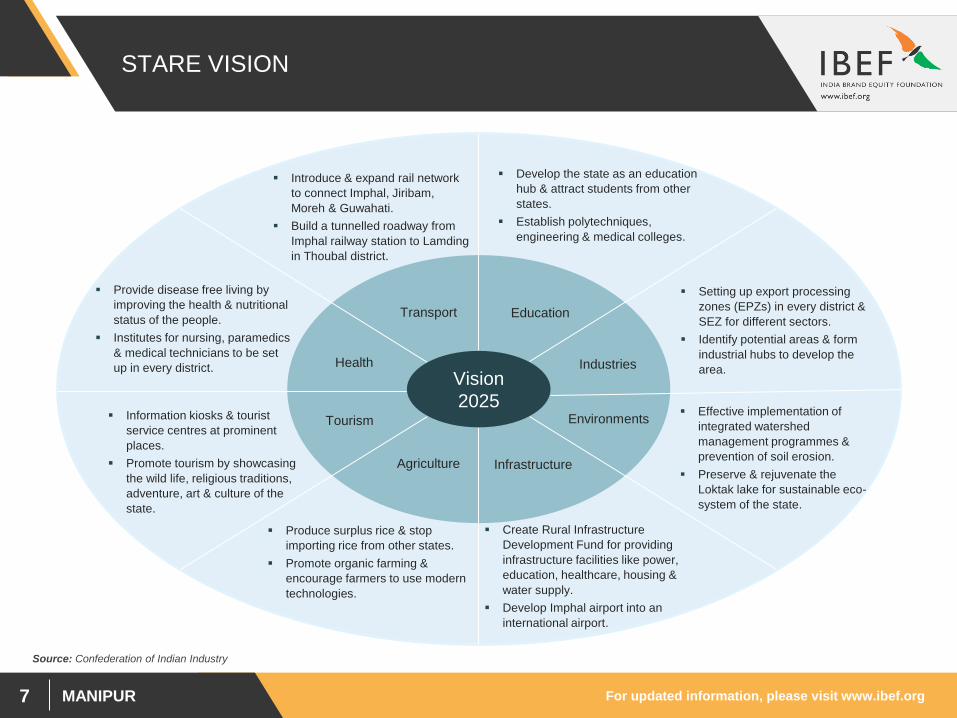
Industries
Setting up export processing
zones (EPZs) in every district &
SEZ for different sectors.
Identify potential areas & form
industrial hubs to develop the
area.
Agriculture
Produce surplus rice & stop
importing rice from other states.
Promote organic farming &
encourage farmers to use modern
technologies.
Transport
Introduce & expand rail network
to connect Imphal, Jiribam,
Moreh & Guwahati.
Build a tunnelled roadway from
Imphal railway station to Lamding
in Thoubal district.
Infrastructure
Education
Health
Develop the state as an education
hub & attract students from other
states.
Establish polytechniques,
engineering & medical colleges.
Provide disease free living by
improving the health & nutritional
status of the people.
Institutes for nursing, paramedics
& medical technicians to be set
up in every district.
Create Rural Infrastructure
Development Fund for providing
infrastructure facilities like power,
education, healthcare, housing &
water supply.
Develop Imphal airport into an
international airport.
Vision
2025
Source: Confederation of Indian Industry
Environments Tourism Effective implementation of
integrated watershed
management programmes &
prevention of soil erosion.
Preserve & rejuvenate the
Loktak lake for sustainable eco-
system of the state.
Information kiosks & tourist
service centres at prominent
places.
Promote tourism by showcasing
the wild life, religious traditions,
adventure, art & culture of the
state.
For updated information, please visit www.ibef.org MANIPUR 8
MANIPUR IN FIGURES
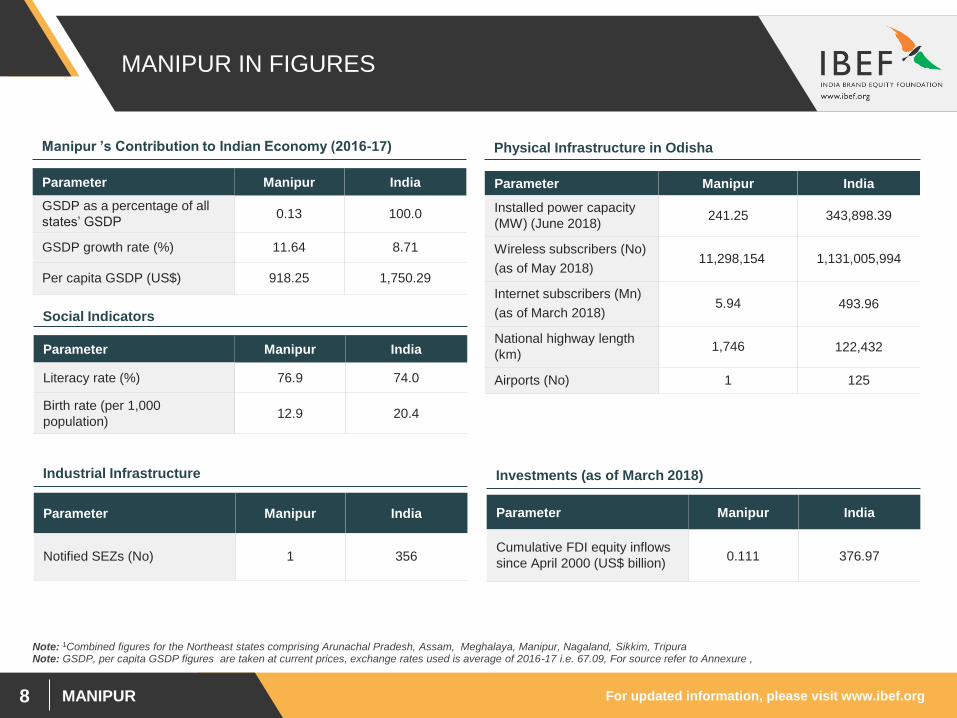
Parameter Manipur India
GSDP as a percentage of all
states’ GSDP 0.13 100.0
GSDP growth rate (%) 11.64 8.71
Per capita GSDP (US$) 918.25 1,750.29
Manipur ’s Contribution to Indian Economy (2016-17)
Parameter Manipur India
Installed power capacity
(MW) (June 2018) 241.25 343,898.39
Wireless subscribers (No)
(as of May 2018) 11,298,154 1,131,005,994
Internet subscribers (Mn)
(as of March 2018) 5.94 493.96
National highway length
(km) 1,746 122,432
Airports (No) 1 125
Physical Infrastructure in Odisha
Parameter Manipur India
Literacy rate (%) 76.9 74.0
Birth rate (per 1,000
population) 12.9 20.4
Social Indicators
Parameter Manipur India
Notified SEZs (No) 1 356
Industrial Infrastructure
Parameter Manipur India
Cumulative FDI equity inflows
since April 2000 (US$ billion) 0.111 376.97
Investments (as of March 2018)
Note: GSDP, per capita GSDP figures are taken at current prices, exchange rates used is average of 2016-17 i.e. 67.09, For source refer to Annexure , Note: 1Combined figures for the Northeast states comprising Arunachal Pradesh, Assam, Meghalaya, Manipur, Nagaland, Sikkim, Tripura
MANIPUR
ECONOMIC SNAPSHOT
For updated information, please visit www.ibef.org MANIPUR 10
ECONOMIC SNAPSHOT – GSDP
GSDP of Manipur at current prices Per capita GSDP
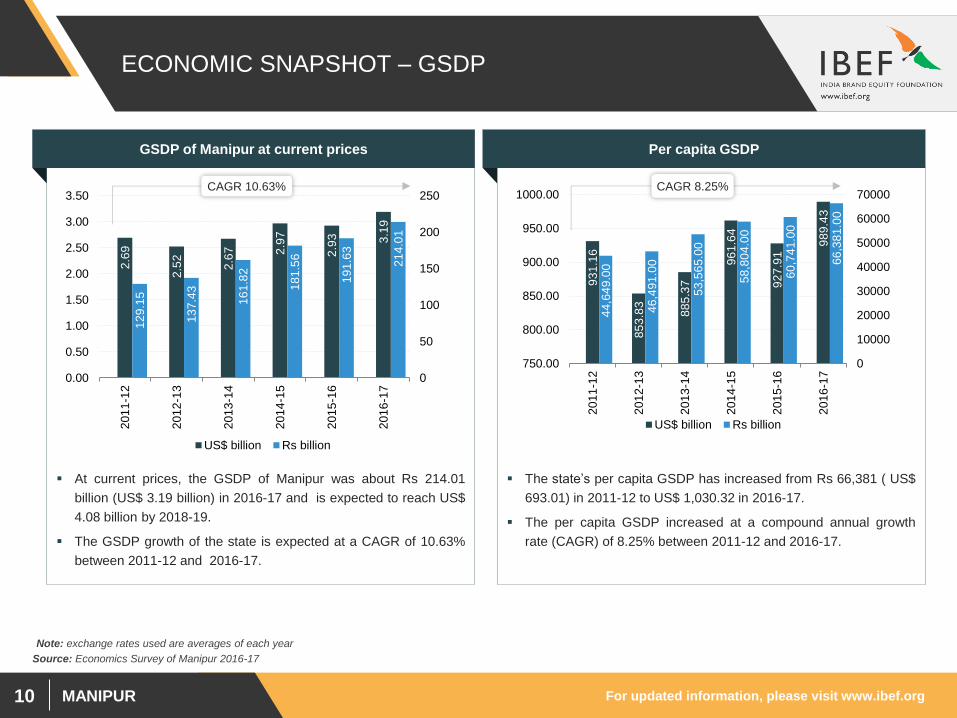
At current prices, the GSDP of Manipur was about Rs 214.01
billion (US$ 3.19 billion) in 2016-17 and is expected to reach US$
4.08 billion by 2018-19.
The GSDP growth of the state is expected at a CAGR of 10.63%
between 2011-12 and 2016-17.
The state’s per capita GSDP has increased from Rs 66,381 ( US$
693.01) in 2011-12 to US$ 1,030.32 in 2016-17.
The per capita GSDP increased at a compound annual growth
rate (CAGR) of 8.25% between 2011-12 and 2016-17.
Source: Economics Survey of Manipur 2016-17
2.6
9
2.5
2
2.6
7
2.9
7
2.9
3
3.1
9
12
9.1
5
13
7.4
3
16
1.8
2
18
1.5
6
19
1.6
3
21
4.0
1
0
50
100
150
200
250
0.00
0.50
1.00
1.50
2.00
2.50
3.00
3.50
201
1-1
2
201
2-1
3
201
3-1
4
201
4-1
5
201
5-1
6
201
6-1
7
US$ billion Rs billion
93
1.1
6
85
3.8
3
88
5.3
7
96
1.6
4
92
7.9
1 9
89
.43
44
,64
9.0
0
46
,49
1.0
0
53
,56
5.0
0
58
,80
4.0
0
60
,74
1.0
0
66
,38
1.0
0
0
10000
20000
30000
40000
50000
60000
70000
750.00
800.00
850.00
900.00
950.00
1000.00
201
1-1
2
201
2-1
3
201
3-1
4
201
4-1
5
201
5-1
6
201
6-1
7
US$ billion Rs billion
CAGR 10.63% CAGR 8.25%
Note: exchange rates used are averages of each year
For updated information, please visit www.ibef.org MANIPUR 11
ECONOMIC SNAPSHOT – NSDP
NSDP of Manipur at current prices Per capita NSDP of Manipur at current prices
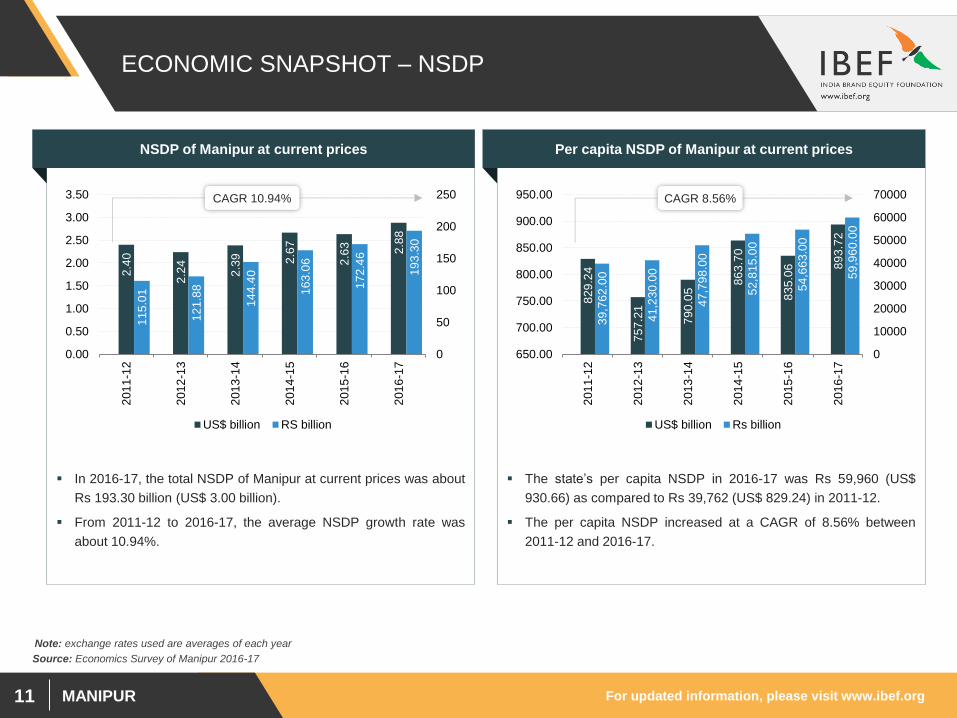
In 2016-17, the total NSDP of Manipur at current prices was about
Rs 193.30 billion (US$ 3.00 billion).
From 2011-12 to 2016-17, the average NSDP growth rate was
about 10.94%.
The state’s per capita NSDP in 2016-17 was Rs 59,960 (US$
930.66) as compared to Rs 39,762 (US$ 829.24) in 2011-12.
The per capita NSDP increased at a CAGR of 8.56% between
2011-12 and 2016-17.
Source: Economics Survey of Manipur 2016-17
2.4
0
2.2
4
2.3
9
2.6
7
2.6
3
2.8
8
11
5.0
1
12
1.8
8
14
4.4
0
16
3.0
6
17
2.4
6
19
3.3
0
0
50
100
150
200
250
0.00
0.50
1.00
1.50
2.00
2.50
3.00
3.50
201
1-1
2
201
2-1
3
201
3-1
4
201
4-1
5
201
5-1
6
201
6-1
7
US$ billion RS billion
82
9.2
4
75
7.2
1
79
0.0
5 8
63
.70
83
5.0
6
89
3.7
2
39
,76
2.0
0
41
,23
0.0
0
47
,79
8.0
0
52
,81
5.0
0
54
,66
3.0
0
59
,96
0.0
0
0
10000
20000
30000
40000
50000
60000
70000
650.00
700.00
750.00
800.00
850.00
900.00
950.00
201
1-1
2
201
2-1
3
201
3-1
4
201
4-1
5
201
5-1
6
201
6-1
7
US$ billion Rs billion
CAGR 10.94% CAGR 8.56%
Note: exchange rates used are averages of each year
For updated information, please visit www.ibef.org MANIPUR 12
ECONOMIC SNAPSHOT – PERCENTAGE
DISTRIBUTION OF GSVA
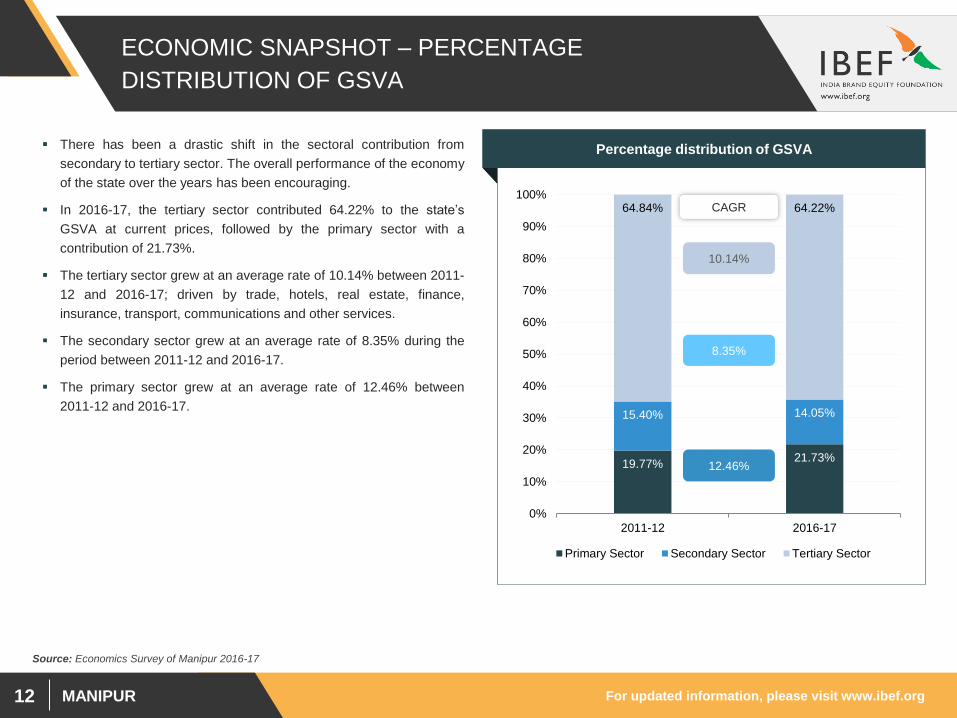
There has been a drastic shift in the sectoral contribution from
secondary to tertiary sector. The overall performance of the economy
of the state over the years has been encouraging.
In 2016-17, the tertiary sector contributed 64.22% to the state’s
GSVA at current prices, followed by the primary sector with a
contribution of 21.73%.
The tertiary sector grew at an average rate of 10.14% between 2011-
12 and 2016-17; driven by trade, hotels, real estate, finance,
insurance, transport, communications and other services.
The secondary sector grew at an average rate of 8.35% during the
period between 2011-12 and 2016-17.
The primary sector grew at an average rate of 12.46% between
2011-12 and 2016-17.
Visakhapatnam port traffic (million tonnes) Percentage distribution of GSVA
19.77% 21.73%
15.40% 14.05%
64.84% 64.22%
0%
10%
20%
30%
40%
50%
60%
70%
80%
90%
100%
2011-12 2016-17
Primary Sector Secondary Sector Tertiary Sector
12.46%
10.14%
8.35%
CAGR
Source: Economics Survey of Manipur 2016-17
For updated information, please visit www.ibef.org MANIPUR 13
ECONOMIC SNAPSHOT – FDI INFLOWS &
INVESTMENTS
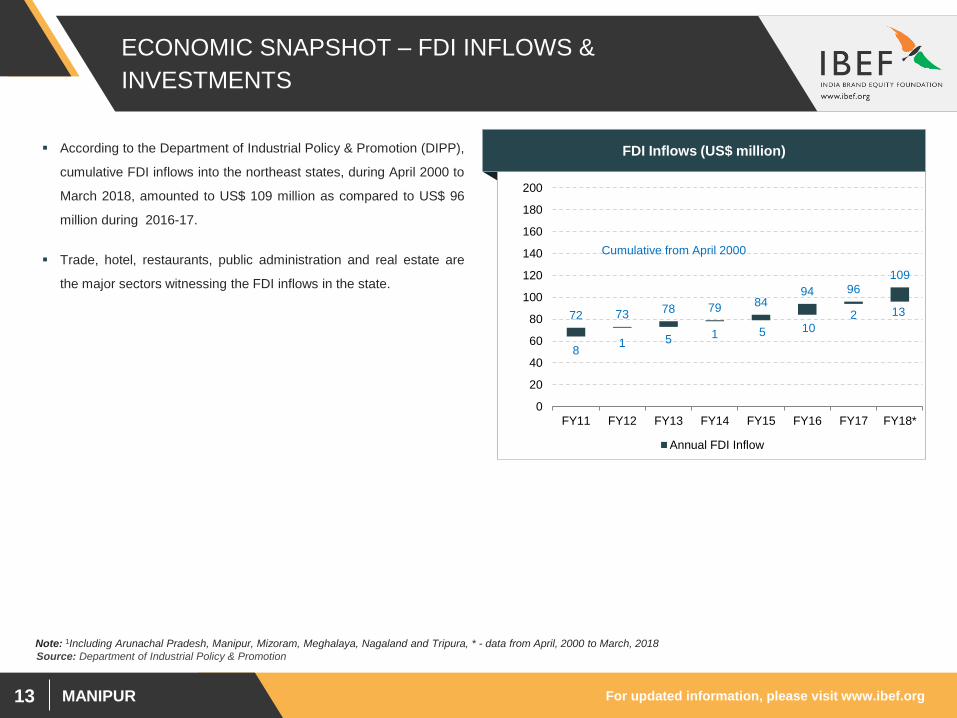
According to the Department of Industrial Policy & Promotion (DIPP),
cumulative FDI inflows into the northeast states, during April 2000 to
March 2018, amounted to US$ 109 million as compared to US$ 96
million during 2016-17.
Trade, hotel, restaurants, public administration and real estate are
the major sectors witnessing the FDI inflows in the state.
FDI Inflows (US$ million)
Source: Department of Industrial Policy & Promotion
Note: 1Including Arunachal Pradesh, Manipur, Mizoram, Meghalaya, Nagaland and Tripura, * - data from April, 2000 to March, 2018
8 1 5 1 5 10
2 13 72 73 78 79 84 94 96
109
0
20
40
60
80
100
120
140
160
180
200
FY11 FY12 FY13 FY14 FY15 FY16 FY17 FY18*
Annual FDI Inflow
Cumulative from April 2000
MANIPUR
PHYSICAL
INFRASTRUCTURE
For updated information, please visit www.ibef.org MANIPUR 15
Year Funds allocated Expenditure incurred
2015-16 5.96 5.96
2016-17 5.96 6.86
2017-18 8.94 0.89
PHYSICAL INFRASTRUCTURE – ROADS
Source: NHAI, Ministry of Defence, 1Up to December 2017
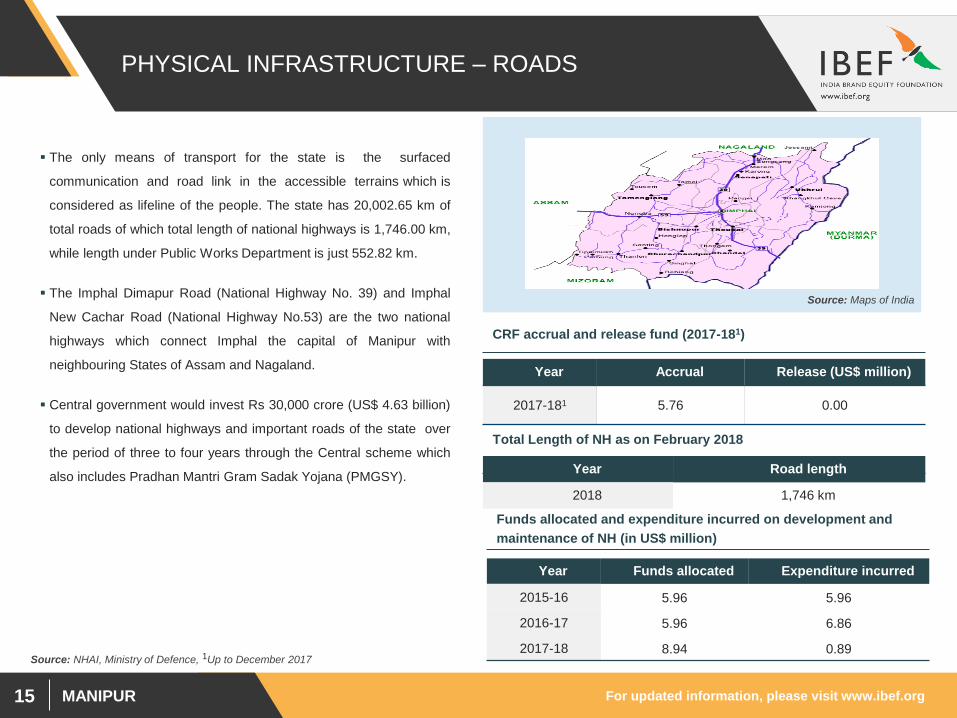
The only means of transport for the state is the surfaced
communication and road link in the accessible terrains which is
considered as lifeline of the people. The state has 20,002.65 km of
total roads of which total length of national highways is 1,746.00 km,
while length under Public Works Department is just 552.82 km.
The Imphal Dimapur Road (National Highway No. 39) and Imphal
New Cachar Road (National Highway No.53) are the two national
highways which connect Imphal the capital of Manipur with
neighbouring States of Assam and Nagaland.
Central government would invest Rs 30,000 crore (US$ 4.63 billion)
to develop national highways and important roads of the state over
the period of three to four years through the Central scheme which
also includes Pradhan Mantri Gram Sadak Yojana (PMGSY).
Source: Maps of India
CRF accrual and release fund (2017-181)
Total Length of NH as on February 2018
Year Accrual Release (US$ million)
2017-181 5.76 0.00
Year Road length
2018 1,746 km
Funds allocated and expenditure incurred on development and
maintenance of NH (in US$ million)
For updated information, please visit www.ibef.org MANIPUR 16
PHYSICAL INFRASTRUCTURE –RAILWAYS
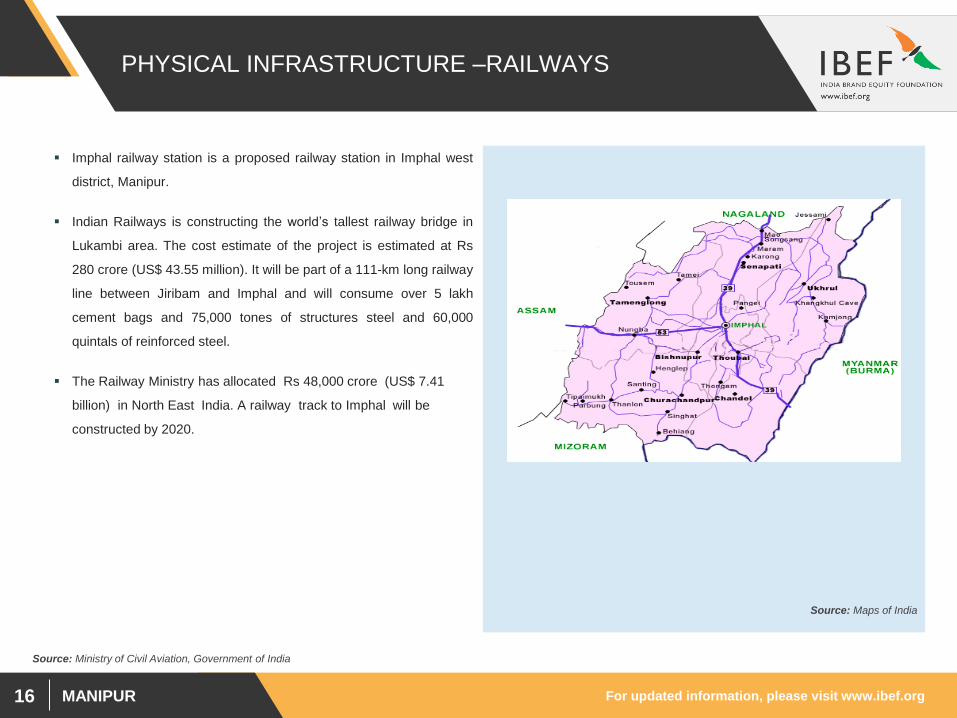
Imphal railway station is a proposed railway station in Imphal west
district, Manipur.
Indian Railways is constructing the world’s tallest railway bridge in
Lukambi area. The cost estimate of the project is estimated at Rs
280 crore (US$ 43.55 million). It will be part of a 111-km long railway
line between Jiribam and Imphal and will consume over 5 lakh
cement bags and 75,000 tones of structures steel and 60,000
quintals of reinforced steel.
The Railway Ministry has allocated Rs 48,000 crore (US$ 7.41
billion) in North East India. A railway track to Imphal will be
constructed by 2020.
Source: Maps of India
Source: Ministry of Civil Aviation, Government of India
For updated information, please visit www.ibef.org MANIPUR 17
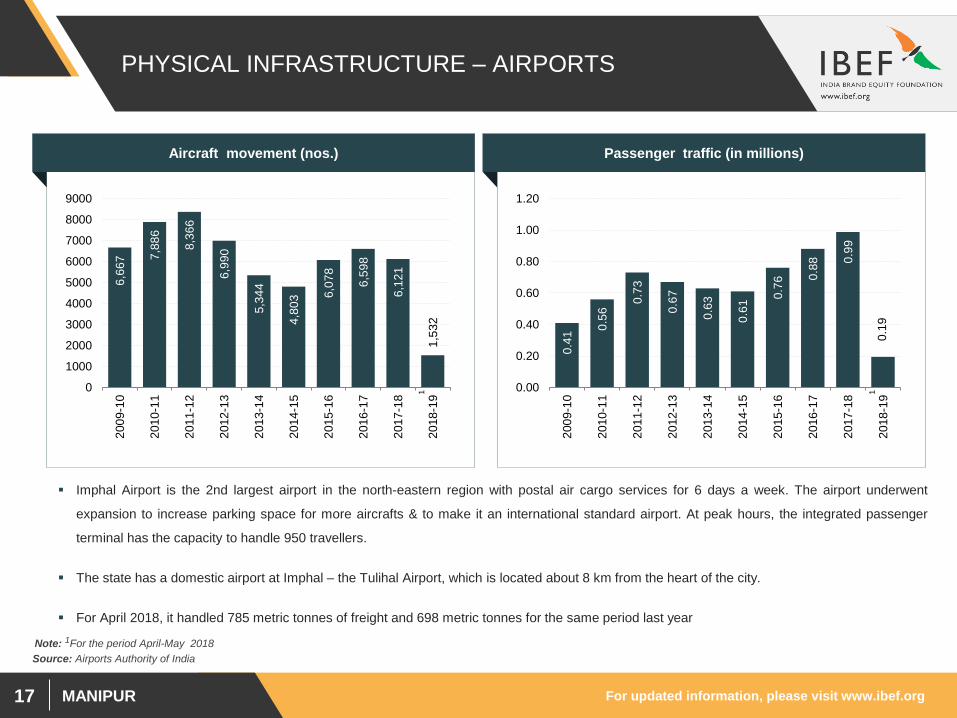
PHYSICAL INFRASTRUCTURE – AIRPORTS
Source: Airports Authority of India
Note: 1For the period April-May 2018
Aircraft movement (nos.) Passenger traffic (in millions)
6,6
67
7,8
86
8,3
66
6,9
90
5,3
44
4,8
03
6,0
78
6,5
98
6,1
21
1,5
32
0
1000
2000
3000
4000
5000
6000
7000
8000
9000
200
9-1
0
201
0-1
1
201
1-1
2
201
2-1
3
201
3-1
4
201
4-1
5
201
5-1
6
201
6-1
7
201
7-1
8
201
8-1
9
0.4
1 0
.56
0.7
3
0.6
7
0.6
3
0.6
1 0
.76
0.8
8
0.9
9
0.1
9
0.00
0.20
0.40
0.60
0.80
1.00
1.20
200
9-1
0
201
0-1
1
201
1-1
2
201
2-1
3
201
3-1
4
201
4-1
5
201
5-1
6
201
6-1
7
201
7-1
8
201
8-1
91
1
Imphal Airport is the 2nd largest airport in the north-eastern region with postal air cargo services for 6 days a week. The airport underwent
expansion to increase parking space for more aircrafts & to make it an international standard airport. At peak hours, the integrated passenger
terminal has the capacity to handle 950 travellers.
The state has a domestic airport at Imphal – the Tulihal Airport, which is located about 8 km from the heart of the city.
For April 2018, it handled 785 metric tonnes of freight and 698 metric tonnes for the same period last year
For updated information, please visit www.ibef.org MANIPUR 18
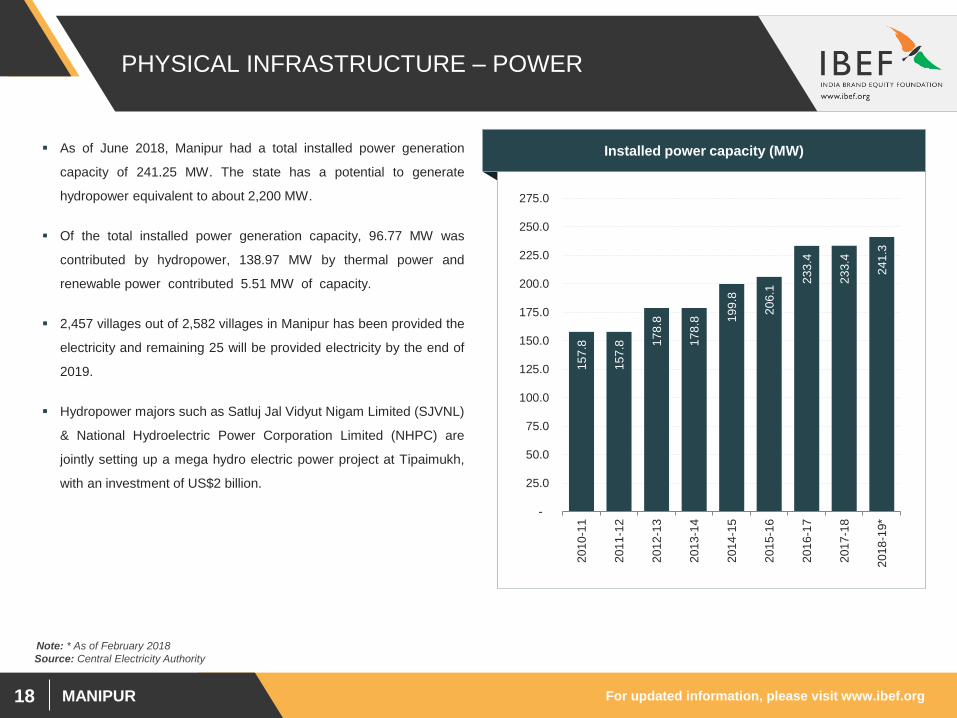
PHYSICAL INFRASTRUCTURE – POWER
As of June 2018, Manipur had a total installed power generation
capacity of 241.25 MW. The state has a potential to generate
hydropower equivalent to about 2,200 MW.
Of the total installed power generation capacity, 96.77 MW was
contributed by hydropower, 138.97 MW by thermal power and
renewable power contributed 5.51 MW of capacity.
2,457 villages out of 2,582 villages in Manipur has been provided the
electricity and remaining 25 will be provided electricity by the end of
2019.
Hydropower majors such as Satluj Jal Vidyut Nigam Limited (SJVNL)
& National Hydroelectric Power Corporation Limited (NHPC) are
jointly setting up a mega hydro electric power project at Tipaimukh,
with an investment of US$2 billion.
Installed power capacity (MW)
15
7.8
15
7.8
17
8.8
17
8.8
19
9.8
20
6.1
23
3.4
23
3.4
24
1.3
-
25.0
50.0
75.0
100.0
125.0
150.0
175.0
200.0
225.0
250.0
275.0
201
0-1
1
201
1-1
2
201
2-1
3
201
3-1
4
201
4-1
5
201
5-1
6
201
6-1
7
201
7-1
8
201
8-1
9*
Note: * As of February 2018
Source: Central Electricity Authority
For updated information, please visit www.ibef.org MANIPUR 19
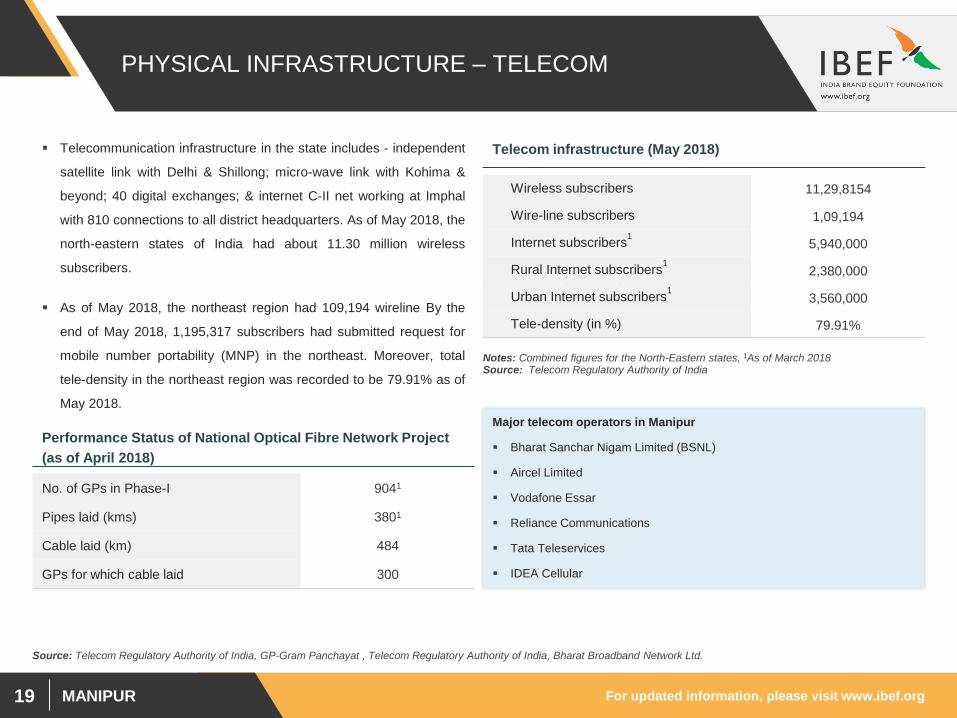
PHYSICAL INFRASTRUCTURE – TELECOM
Telecommunication infrastructure in the state includes - independent
satellite link with Delhi & Shillong; micro-wave link with Kohima &
beyond; 40 digital exchanges; & internet C-II net working at Imphal
with 810 connections to all district headquarters. As of May 2018, the
north-eastern states of India had about 11.30 million wireless
subscribers.
As of May 2018, the northeast region had 109,194 wireline By the
end of May 2018, 1,195,317 subscribers had submitted request for
mobile number portability (MNP) in the northeast. Moreover, total
tele-density in the northeast region was recorded to be 79.91% as of
May 2018.
Telecom infrastructure (May 2018)
Source: Economic Survey of Assam 2014-15
Performance Status of National Optical Fibre Network Project
(as of April 2018)
Source: Telecom Regulatory Authority of India, GP-Gram Panchayat , Telecom Regulatory Authority of India, Bharat Broadband Network Ltd.
Major telecom operators in Manipur
Bharat Sanchar Nigam Limited (BSNL)
Aircel Limited
Vodafone Essar
Reliance Communications
Tata Teleservices
IDEA Cellular
Wireless subscribers 11,29,8154
Wire-line subscribers 1,09,194
Internet subscribers1
5,940,000
Rural Internet subscribers1
2,380,000
Urban Internet subscribers1
3,560,000
Tele-density (in %) 79.91%
No. of GPs in Phase-I 9041
Pipes laid (kms) 3801
Cable laid (km) 484
GPs for which cable laid 300
Notes: Combined figures for the North-Eastern states, 1As of March 2018 Source: Telecom Regulatory Authority of India
For updated information, please visit www.ibef.org MANIPUR 20
PHYSICAL INFRASTRUCTURE – URBAN
INFRASTRUCTURE
Source: Ministry of Urban Development, Government of India Notes: UIG: Urban Infrastructure and Governance,UIDSSMT: Urban Infrastructure Development Scheme for Small and Medium Towns
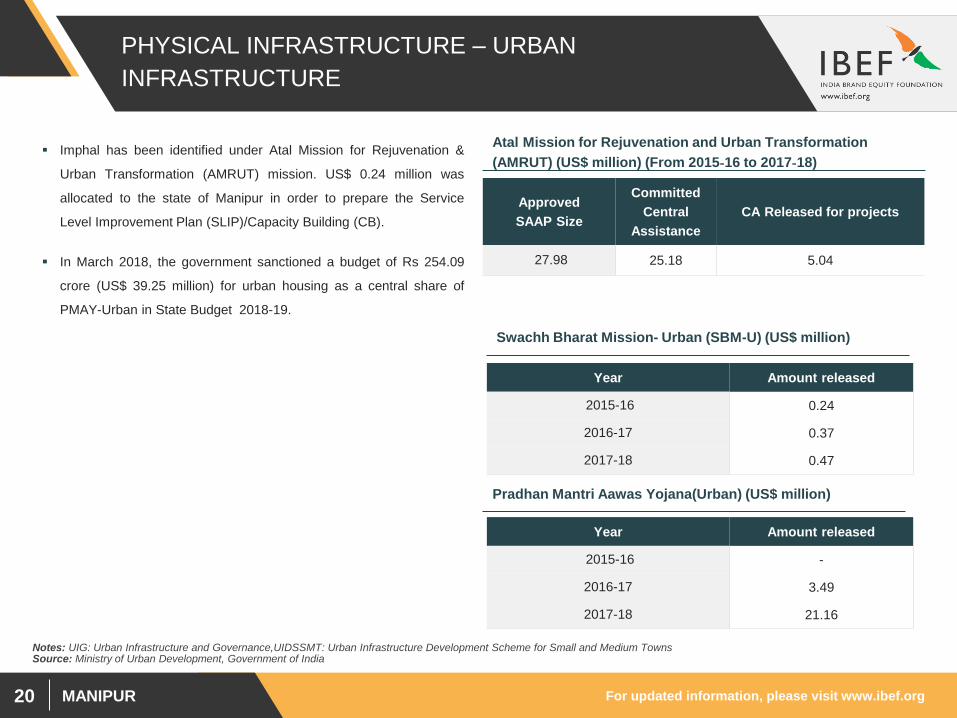
Imphal has been identified under Atal Mission for Rejuvenation &
Urban Transformation (AMRUT) mission. US$ 0.24 million was
allocated to the state of Manipur in order to prepare the Service
Level Improvement Plan (SLIP)/Capacity Building (CB).
In March 2018, the government sanctioned a budget of Rs 254.09
crore (US$ 39.25 million) for urban housing as a central share of
PMAY-Urban in State Budget 2018-19.
Approved
SAAP Size
Committed
Central
Assistance
CA Released for projects
27.98 25.18 5.04
Atal Mission for Rejuvenation and Urban Transformation
(AMRUT) (US$ million) (From 2015‐16 to 2017‐18)
Year Amount released
2015-16 0.24
2016-17 0.37
2017-18 0.47
Swachh Bharat Mission- Urban (SBM-U) (US$ million)
Year Amount released
2015-16 -
2016-17 3.49
2017-18 21.16
Pradhan Mantri Aawas Yojana(Urban) (US$ million)
MANIPUR
SOCIAL
INFRASTRUCTURE
For updated information, please visit www.ibef.org MANIPUR 22
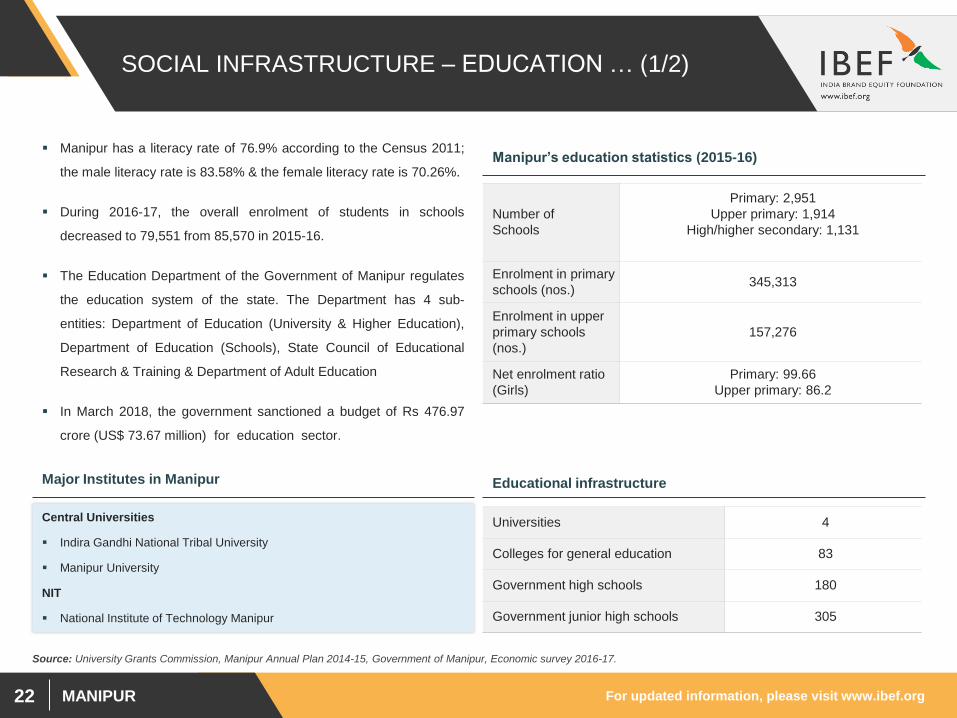
SOCIAL INFRASTRUCTURE – EDUCATION … (1/2)
Manipur has a literacy rate of 76.9% according to the Census 2011;
the male literacy rate is 83.58% & the female literacy rate is 70.26%.
During 2016-17, the overall enrolment of students in schools
decreased to 79,551 from 85,570 in 2015-16.
The Education Department of the Government of Manipur regulates
the education system of the state. The Department has 4 sub-
entities: Department of Education (University & Higher Education),
Department of Education (Schools), State Council of Educational
Research & Training & Department of Adult Education
In March 2018, the government sanctioned a budget of Rs 476.97
crore (US$ 73.67 million) for education sector.
Manipur’s education statistics (2015-16)
Number of
Schools
Primary: 2,951
Upper primary: 1,914
High/higher secondary: 1,131
Enrolment in primary
schools (nos.) 345,313
Enrolment in upper
primary schools
(nos.)
157,276
Net enrolment ratio
(Girls)
Primary: 99.66
Upper primary: 86.2
Major Institutes in Manipur
Central Universities
Indira Gandhi National Tribal University
Manipur University
NIT
National Institute of Technology Manipur
Educational infrastructure
Universities 4
Colleges for general education 83
Government high schools 180
Government junior high schools 305
Source: University Grants Commission, Manipur Annual Plan 2014-15, Government of Manipur, Economic survey 2016-17.
For updated information, please visit www.ibef.org MANIPUR 23
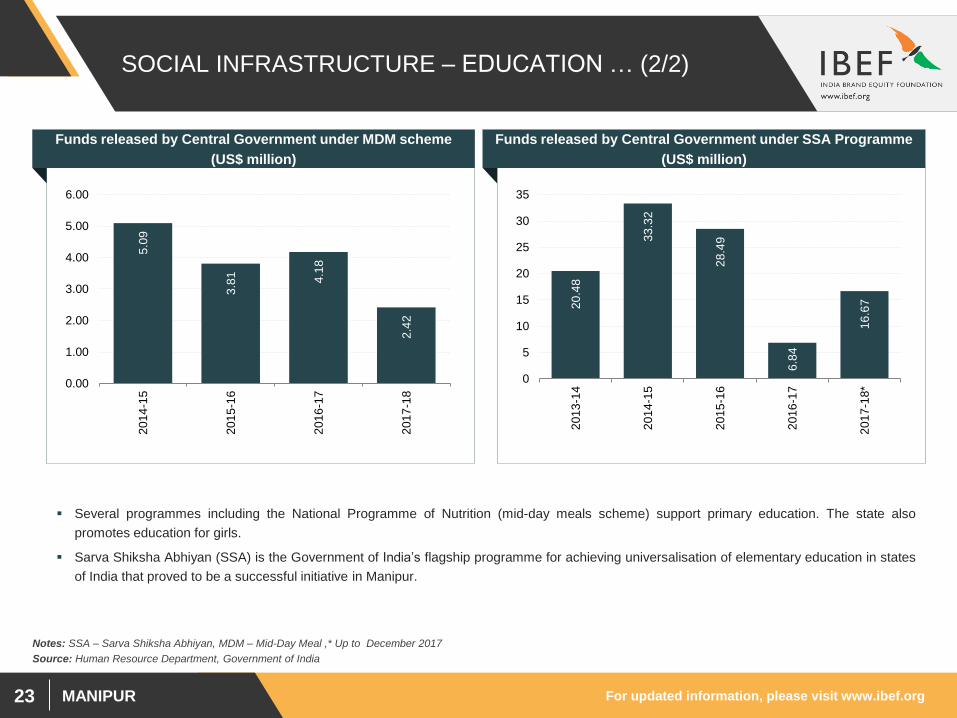
SOCIAL INFRASTRUCTURE – EDUCATION … (2/2)
Funds released by Central Government under MDM scheme
(US$ million)
Funds released by Central Government under SSA Programme
(US$ million)
Several programmes including the National Programme of Nutrition (mid-day meals scheme) support primary education. The state also
promotes education for girls.
Sarva Shiksha Abhiyan (SSA) is the Government of India’s flagship programme for achieving universalisation of elementary education in states
of India that proved to be a successful initiative in Manipur.
5.0
9
3.8
1
4.1
8
2.4
2
0.00
1.00
2.00
3.00
4.00
5.00
6.00
201
4-1
5
201
5-1
6
201
6-1
7
201
7-1
8
20
.48
33
.32
28
.49
6.8
4
16
.67
0
5
10
15
20
25
30
35
201
3-1
4
201
4-1
5
201
5-1
6
201
6-1
7
201
7-1
8*
Source: Human Resource Department, Government of India
Notes: SSA – Sarva Shiksha Abhiyan, MDM – Mid-Day Meal ,* Up to December 2017
For updated information, please visit www.ibef.org MANIPUR 24
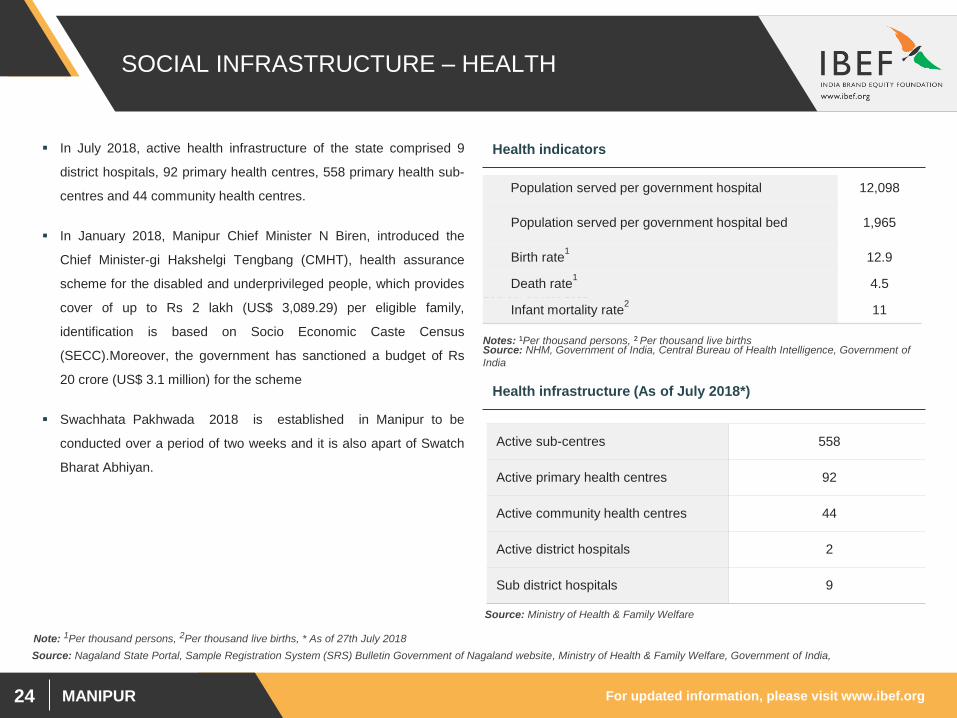
SOCIAL INFRASTRUCTURE – HEALTH
In July 2018, active health infrastructure of the state comprised 9
district hospitals, 92 primary health centres, 558 primary health sub-
centres and 44 community health centres.
In January 2018, Manipur Chief Minister N Biren, introduced the
Chief Minister-gi Hakshelgi Tengbang (CMHT), health assurance
scheme for the disabled and underprivileged people, which provides
cover of up to Rs 2 lakh (US$ 3,089.29) per eligible family,
identification is based on Socio Economic Caste Census
(SECC).Moreover, the government has sanctioned a budget of Rs
20 crore (US$ 3.1 million) for the scheme
Swachhata Pakhwada 2018 is established in Manipur to be
conducted over a period of two weeks and it is also apart of Swatch
Bharat Abhiyan.
Health indicators
Source: Census 2011
Health infrastructure (As of July 2018*)
Source: Ministry of Health & Family Welfare
Active sub-centres 558
Active primary health centres 92
Active community health centres 44
Active district hospitals 2
Sub district hospitals 9
Population served per government hospital 12,098
Population served per government hospital bed 1,965
Birth rate1
12.9
Death rate1
4.5
Infant mortality rate2
11
Source: NHM, Government of India, Central Bureau of Health Intelligence, Government of
India
Notes: 1Per thousand persons, 2 Per thousand live births
Source: Nagaland State Portal, Sample Registration System (SRS) Bulletin Government of Nagaland website, Ministry of Health & Family Welfare, Government of India,
Note: 1Per thousand persons, 2Per thousand live births, * As of 27th July 2018

MANIPUR
INDUSTRIAL
INFRASTRUCTURE
For updated information, please visit www.ibef.org MANIPUR 26
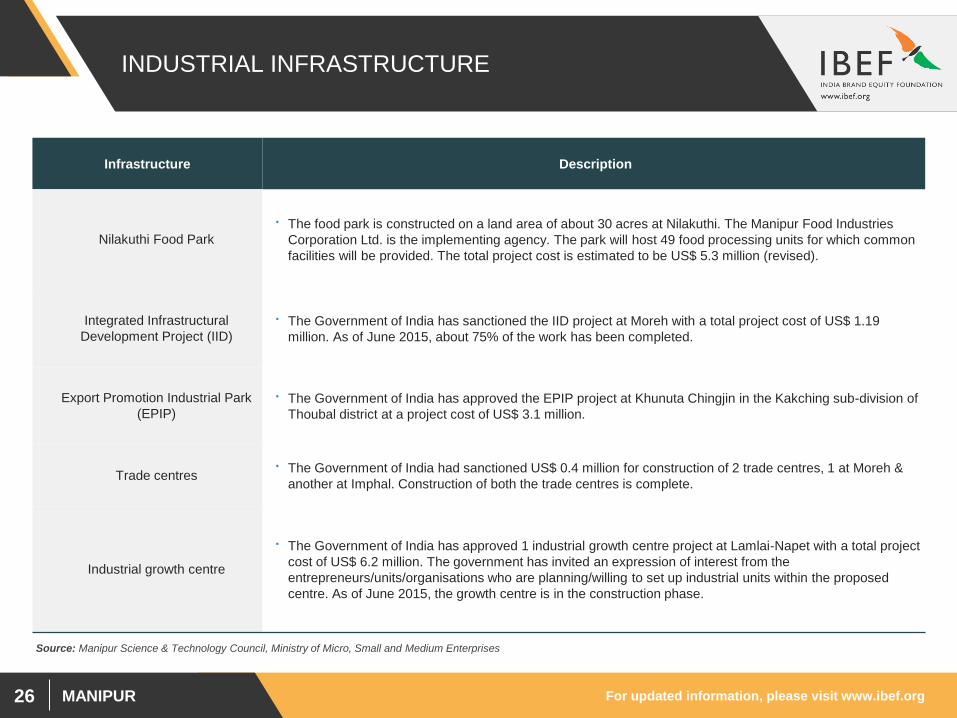
INDUSTRIAL INFRASTRUCTURE
Source: Manipur Science & Technology Council, Ministry of Micro, Small and Medium Enterprises
Infrastructure Description
Nilakuthi Food Park
• The food park is constructed on a land area of about 30 acres at Nilakuthi. The Manipur Food Industries
Corporation Ltd. is the implementing agency. The park will host 49 food processing units for which common
facilities will be provided. The total project cost is estimated to be US$ 5.3 million (revised).
Integrated Infrastructural
Development Project (IID)
• The Government of India has sanctioned the IID project at Moreh with a total project cost of US$ 1.19
million. As of June 2015, about 75% of the work has been completed.
Export Promotion Industrial Park
(EPIP)
• The Government of India has approved the EPIP project at Khunuta Chingjin in the Kakching sub-division of
Thoubal district at a project cost of US$ 3.1 million.
Trade centres • The Government of India had sanctioned US$ 0.4 million for construction of 2 trade centres, 1 at Moreh &
another at Imphal. Construction of both the trade centres is complete.
Industrial growth centre
• The Government of India has approved 1 industrial growth centre project at Lamlai-Napet with a total project
cost of US$ 6.2 million. The government has invited an expression of interest from the
entrepreneurs/units/organisations who are planning/willing to set up industrial units within the proposed
centre. As of June 2015, the growth centre is in the construction phase.
MANIPUR
KEY SECTORS
Handloom
Agriculture
Sericulture
Bamboo Processing
For updated information, please visit www.ibef.org MANIPUR 28
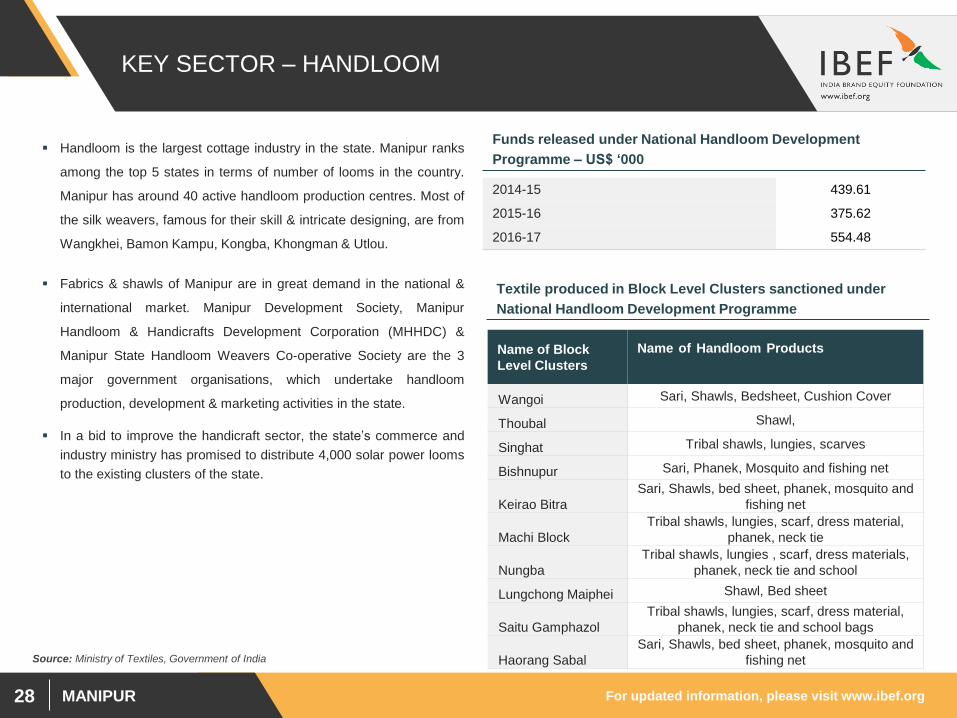
KEY SECTOR – HANDLOOM
Handloom is the largest cottage industry in the state. Manipur ranks
among the top 5 states in terms of number of looms in the country.
Manipur has around 40 active handloom production centres. Most of
the silk weavers, famous for their skill & intricate designing, are from
Wangkhei, Bamon Kampu, Kongba, Khongman & Utlou.
Fabrics & shawls of Manipur are in great demand in the national &
international market. Manipur Development Society, Manipur
Handloom & Handicrafts Development Corporation (MHHDC) &
Manipur State Handloom Weavers Co-operative Society are the 3
major government organisations, which undertake handloom
production, development & marketing activities in the state.
In a bid to improve the handicraft sector, the state’s commerce and
industry ministry has promised to distribute 4,000 solar power looms
to the existing clusters of the state.
Funds released under National Handloom Development
Programme – US$ ‘000
2014-15 439.61
2015-16 375.62
2016-17 554.48
Source: Ministry of Textiles, Government of India
Textile produced in Block Level Clusters sanctioned under
National Handloom Development Programme
Name of Block
Level Clusters
Name of Handloom Products
Wangoi Sari, Shawls, Bedsheet, Cushion Cover
Thoubal Shawl,
Singhat Tribal shawls, lungies, scarves
Bishnupur Sari, Phanek, Mosquito and fishing net
Keirao Bitra
Sari, Shawls, bed sheet, phanek, mosquito and
fishing net
Machi Block
Tribal shawls, lungies, scarf, dress material,
phanek, neck tie
Nungba
Tribal shawls, lungies , scarf, dress materials,
phanek, neck tie and school
Lungchong Maiphei Shawl, Bed sheet
Saitu Gamphazol
Tribal shawls, lungies, scarf, dress material,
phanek, neck tie and school bags
Haorang Sabal
Sari, Shawls, bed sheet, phanek, mosquito and
fishing net
For updated information, please visit www.ibef.org MANIPUR 29
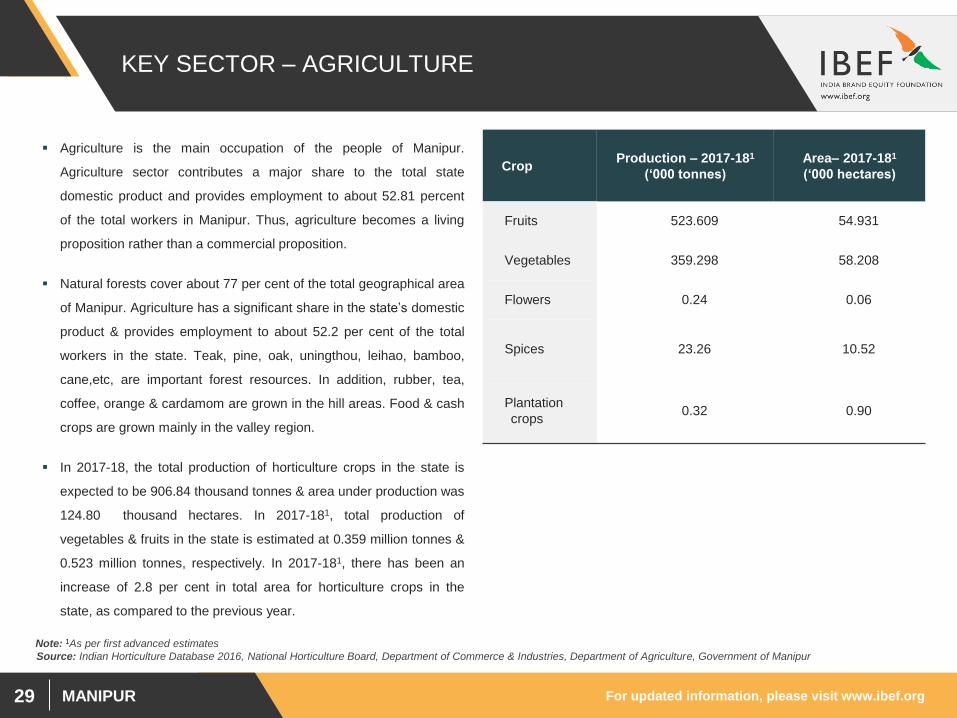
KEY SECTOR – AGRICULTURE
Agriculture is the main occupation of the people of Manipur.
Agriculture sector contributes a major share to the total state
domestic product and provides employment to about 52.81 percent
of the total workers in Manipur. Thus, agriculture becomes a living
proposition rather than a commercial proposition.
Natural forests cover about 77 per cent of the total geographical area
of Manipur. Agriculture has a significant share in the state’s domestic
product & provides employment to about 52.2 per cent of the total
workers in the state. Teak, pine, oak, uningthou, leihao, bamboo,
cane,etc, are important forest resources. In addition, rubber, tea,
coffee, orange & cardamom are grown in the hill areas. Food & cash
crops are grown mainly in the valley region.
In 2017-18, the total production of horticulture crops in the state is
expected to be 906.84 thousand tonnes & area under production was
124.80 thousand hectares. In 2017-181, total production of
vegetables & fruits in the state is estimated at 0.359 million tonnes &
0.523 million tonnes, respectively. In 2017-181, there has been an
increase of 2.8 per cent in total area for horticulture crops in the
state, as compared to the previous year.
Source: Indian Horticulture Database 2016, National Horticulture Board, Department of Commerce & Industries, Department of Agriculture, Government of Manipur
Note: 1As per first advanced estimates
Crop Production – 2017-181
(‘000 tonnes)
Area– 2017-181
(‘000 hectares)
Fruits 523.609 54.931
Vegetables 359.298 58.208
Flowers 0.24 0.06
Spices 23.26 10.52
Plantation
crops 0.32 0.90
For updated information, please visit www.ibef.org MANIPUR 30
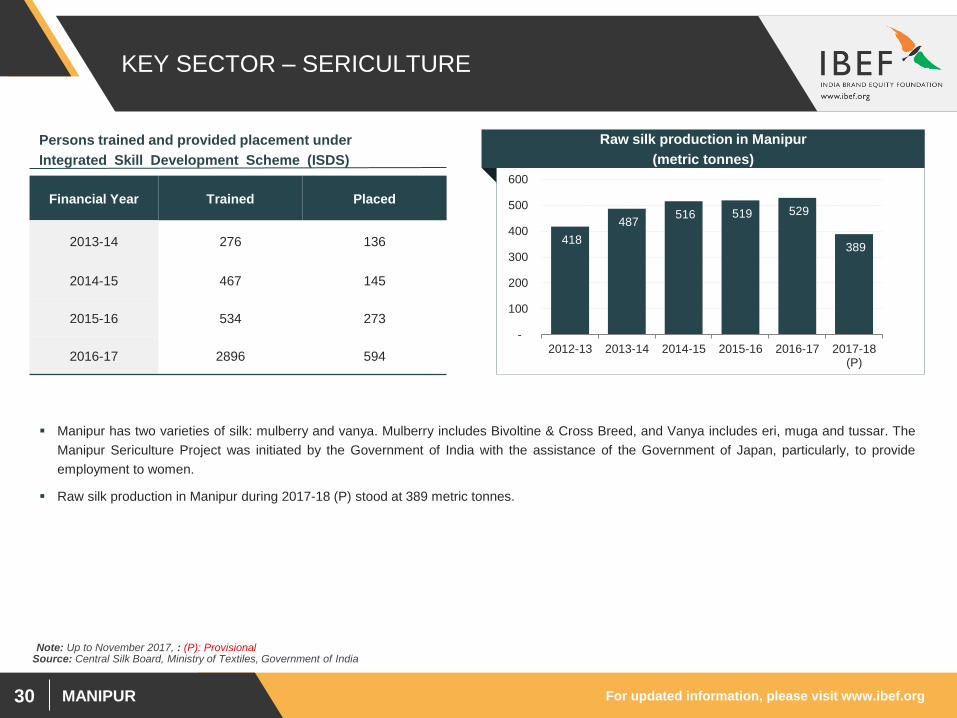
KEY SECTOR – SERICULTURE
418
487 516 519 529
389
-
100
200
300
400
500
600
2012-13 2013-14 2014-15 2015-16 2016-17 2017-18(P)
Source: Central Silk Board, Ministry of Textiles, Government of India
Manipur has two varieties of silk: mulberry and vanya. Mulberry includes Bivoltine & Cross Breed, and Vanya includes eri, muga and tussar. The
Manipur Sericulture Project was initiated by the Government of India with the assistance of the Government of Japan, particularly, to provide
employment to women.
Raw silk production in Manipur during 2017-18 (P) stood at 389 metric tonnes.
Raw silk production in Manipur
(metric tonnes)
Financial Year Trained Placed
2013-14 276 136
2014-15 467 145
2015-16 534 273
2016-17 2896 594
Persons trained and provided placement under
Integrated Skill Development Scheme (ISDS)
Note: Up to November 2017, : (P): Provisional
For updated information, please visit www.ibef.org MANIPUR 31
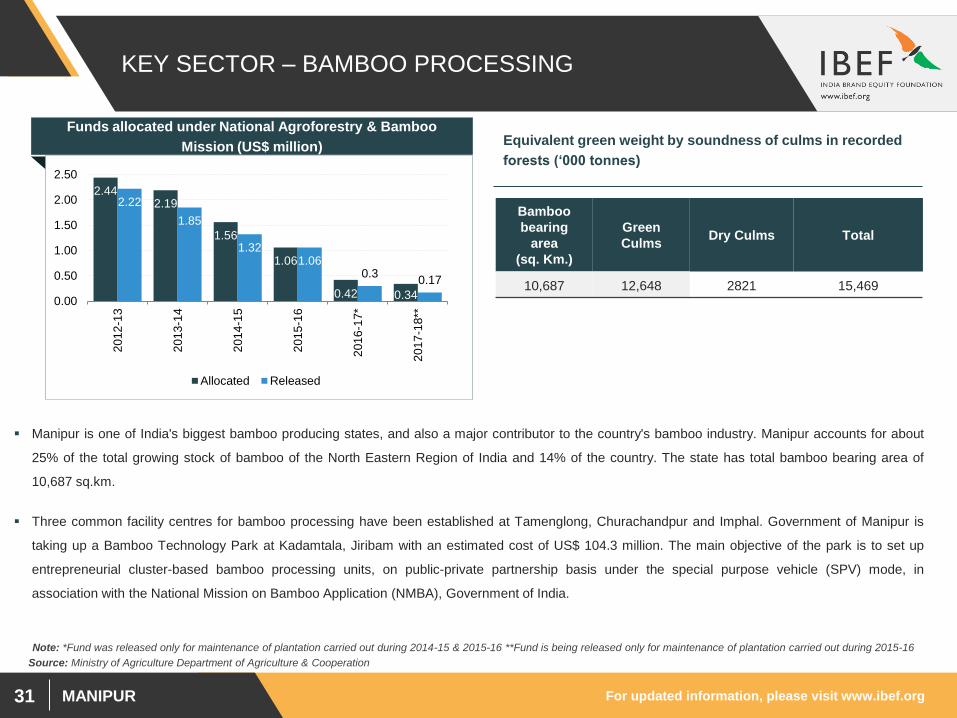
KEY SECTOR – BAMBOO PROCESSING
Manipur is one of India's biggest bamboo producing states, and also a major contributor to the country's bamboo industry. Manipur accounts for about
25% of the total growing stock of bamboo of the North Eastern Region of India and 14% of the country. The state has total bamboo bearing area of
10,687 sq.km.
Three common facility centres for bamboo processing have been established at Tamenglong, Churachandpur and Imphal. Government of Manipur is
taking up a Bamboo Technology Park at Kadamtala, Jiribam with an estimated cost of US$ 104.3 million. The main objective of the park is to set up
entrepreneurial cluster-based bamboo processing units, on public-private partnership basis under the special purpose vehicle (SPV) mode, in
association with the National Mission on Bamboo Application (NMBA), Government of India.
Funds allocated under National Agroforestry & Bamboo
Mission (US$ million)
2.44 2.19
1.56
1.06
0.42 0.34
2.22
1.85
1.32 1.06
0.3 0.17
0.00
0.50
1.00
1.50
2.00
2.50
201
2-1
3
201
3-1
4
201
4-1
5
201
5-1
6
201
6-1
7*
201
7-1
8**
Allocated Released
Bamboo
bearing
area
(sq. Km.)
Green
Culms Dry Culms Total
10,687 12,648 2821 15,469
Equivalent green weight by soundness of culms in recorded
forests (‘000 tonnes)
Note: *Fund was released only for maintenance of plantation carried out during 2014-15 & 2015-16 **Fund is being released only for maintenance of plantation carried out during 2015-16
Source: Ministry of Agriculture Department of Agriculture & Cooperation
MANIPUR
KEY PROCEDURES
& POLICIES

For updated information, please visit www.ibef.org MANIPUR 33
KEY INVESTMENT PROMOTION OFFICES
Agency Description
Manipur Industrial
Development Corporation
Limited (MANIDCO)
Formerly known as the Manipur Small Industries Corporation Limited (MSIC), MANIDCO’s objective is to aid,
advice, assist finance, protect and promote the interests of small and medium industries in the state.
Manipur Handloom &
Handicrafts Development
Corporation Limited
(MHHDCL)
MHHDCL was set up in 1976 to help production and direct marketing of handloom and handicraft products.
Manipur Food Industries
Corporation Limited (MFIC)
MFIC was incorporated in 1997. The corporation provides assistance and support services in the field of technical,
financial, marketing, etc., to food processing units.

For updated information, please visit www.ibef.org MANIPUR 34
KEY APPROVALS REQUIRED … (1/2)
List of approvals and clearances required Department
Incorporation of company Registrar of Companies
Registration, Industrial Entrepreneurs Memorandum (IEM), industrial
licenses Director of Commerce and Industries, Manipur
Permission for land use
Allotment of land Manipur Industrial Development Corporation Limited (MANIDCO)
Site environmental approval Manipur Pollution Control Board (MPCB)/Department of
Environment and Forest, Government of Manipur No objection certificate and consent under Water and Pollution Control Act
Registration under States Sales Tax Act and Central and State Excise Act
Excise Department of Manipur
Commercial taxes
For updated information, please visit www.ibef.org MANIPUR 35
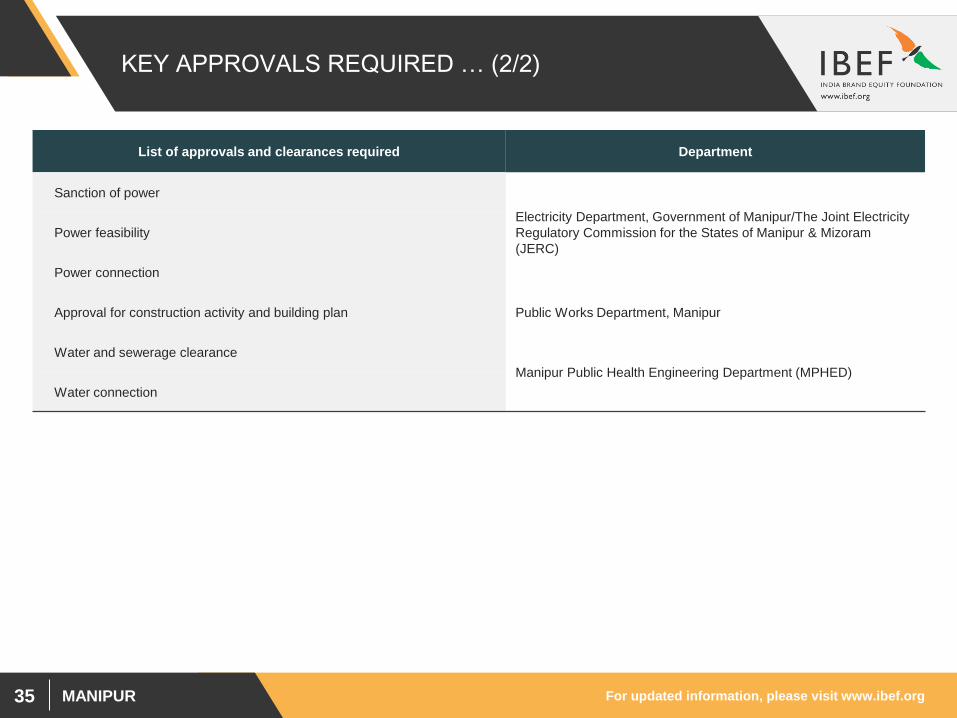
KEY APPROVALS REQUIRED … (2/2)
List of approvals and clearances required Department
Sanction of power
Electricity Department, Government of Manipur/The Joint Electricity
Regulatory Commission for the States of Manipur & Mizoram
(JERC)
Power feasibility
Power connection
Approval for construction activity and building plan Public Works Department, Manipur
Water and sewerage clearance
Manipur Public Health Engineering Department (MPHED)
Water connection
For updated information, please visit www.ibef.org MANIPUR 36
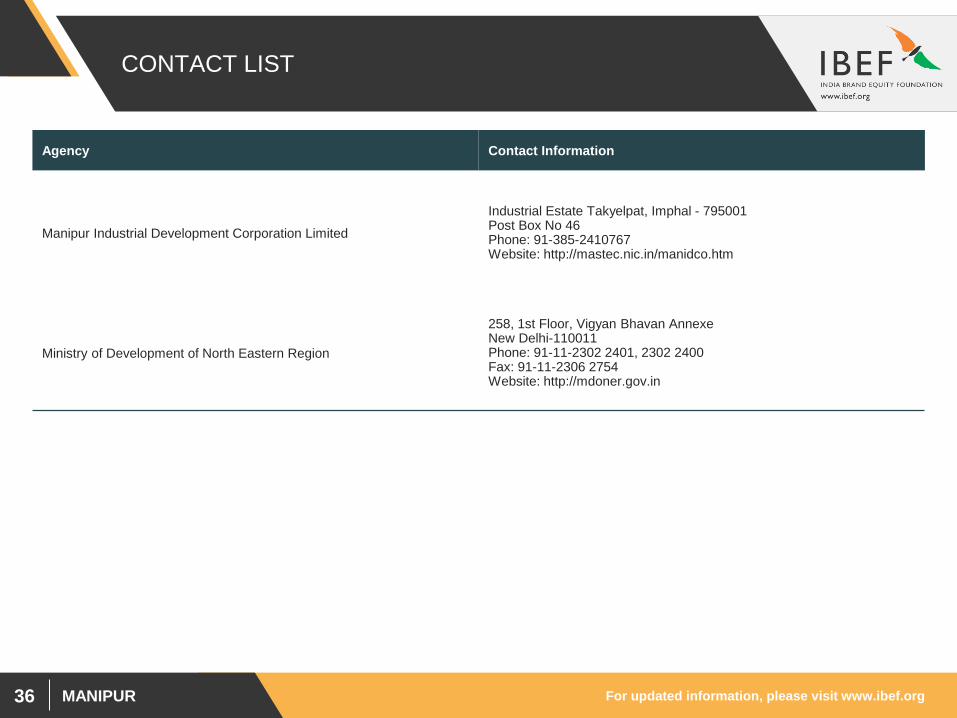
CONTACT LIST
Agency Contact Information
Manipur Industrial Development Corporation Limited
Industrial Estate Takyelpat, Imphal - 795001 Post Box No 46 Phone: 91-385-2410767 Website: http://mastec.nic.in/manidco.htm
Ministry of Development of North Eastern Region
258, 1st Floor, Vigyan Bhavan Annexe New Delhi-110011 Phone: 91-11-2302 2401, 2302 2400 Fax: 91-11-2306 2754 Website: http://mdoner.gov.in
For updated information, please visit www.ibef.org MANIPUR 37
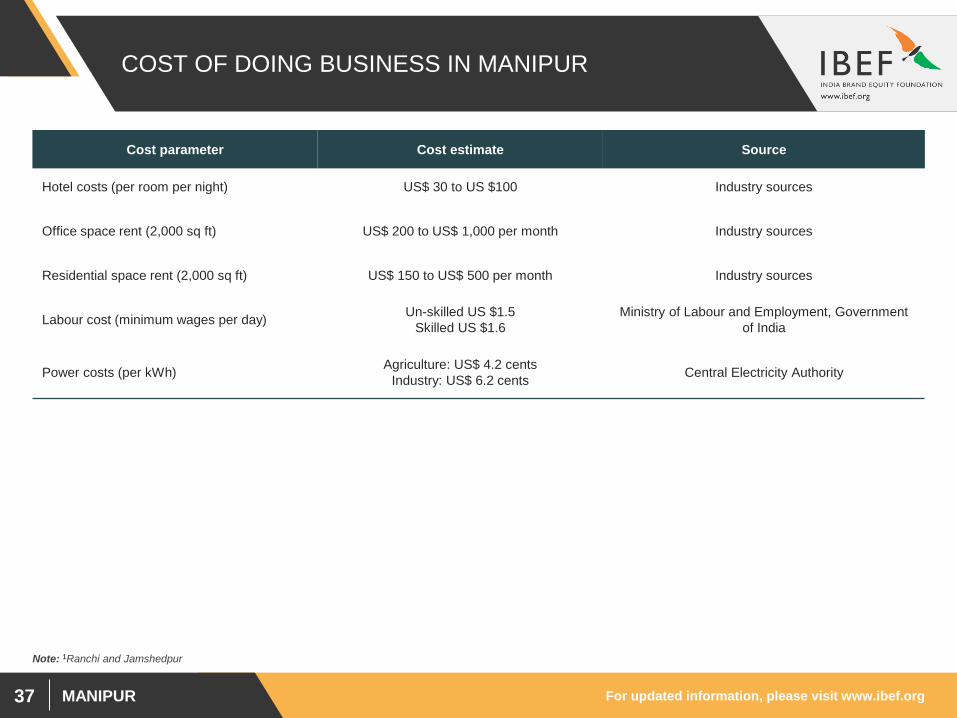
COST OF DOING BUSINESS IN MANIPUR
Note: 1Ranchi and Jamshedpur
Cost parameter Cost estimate Source
Hotel costs (per room per night) US$ 30 to US $100 Industry sources
Office space rent (2,000 sq ft) US$ 200 to US$ 1,000 per month Industry sources
Residential space rent (2,000 sq ft) US$ 150 to US$ 500 per month Industry sources
Labour cost (minimum wages per day) Un-skilled US $1.5
Skilled US $1.6
Ministry of Labour and Employment, Government
of India
Power costs (per kWh) Agriculture: US$ 4.2 cents
Industry: US$ 6.2 cents Central Electricity Authority
For updated information, please visit www.ibef.org MANIPUR 38
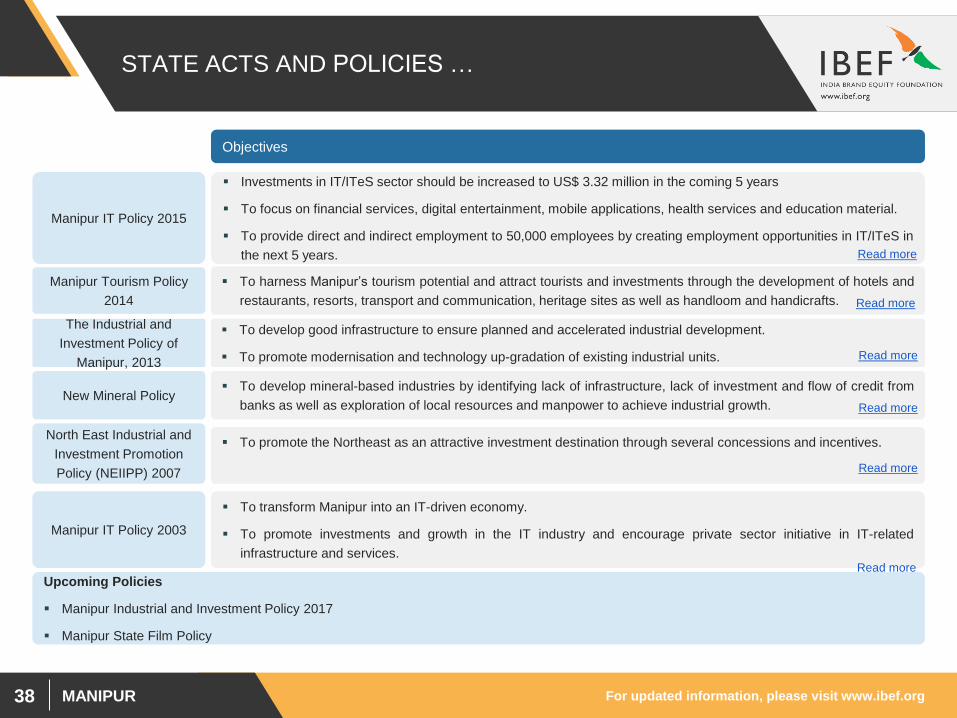
STATE ACTS AND POLICIES …
Objectives
To promote the Northeast as an attractive investment destination through several concessions and incentives.
North East Industrial and
Investment Promotion
Policy (NEIIPP) 2007 Read more
To transform Manipur into an IT-driven economy.
To promote investments and growth in the IT industry and encourage private sector initiative in IT-related
infrastructure and services.
Manipur IT Policy 2003
Read more
To develop mineral-based industries by identifying lack of infrastructure, lack of investment and flow of credit from
banks as well as exploration of local resources and manpower to achieve industrial growth. New Mineral Policy
Read more
To harness Manipur’s tourism potential and attract tourists and investments through the development of hotels and
restaurants, resorts, transport and communication, heritage sites as well as handloom and handicrafts.
Manipur Tourism Policy
2014 Read more
To develop good infrastructure to ensure planned and accelerated industrial development.
To promote modernisation and technology up-gradation of existing industrial units.
The Industrial and
Investment Policy of
Manipur, 2013 Read more
Manipur IT Policy 2015
Investments in IT/ITeS sector should be increased to US$ 3.32 million in the coming 5 years
To focus on financial services, digital entertainment, mobile applications, health services and education material.
To provide direct and indirect employment to 50,000 employees by creating employment opportunities in IT/ITeS in
the next 5 years. Read more
Upcoming Policies
Manipur Industrial and Investment Policy 2017
Manipur State Film Policy
MANIPUR
ANNEXURE
For updated information, please visit www.ibef.org MANIPUR 40
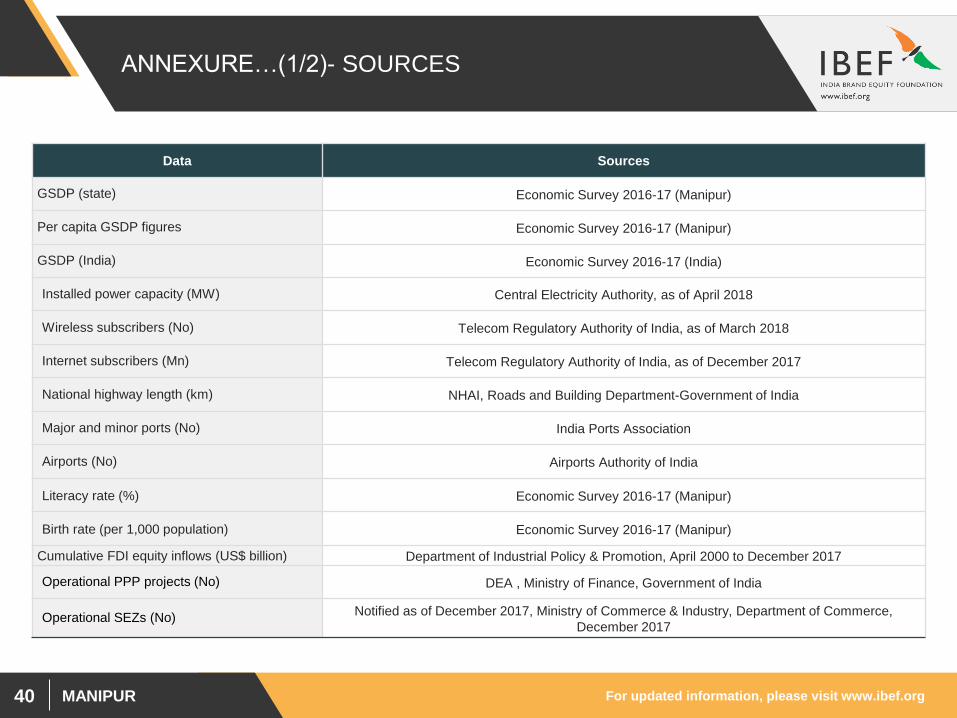
ANNEXURE…(1/2)- SOURCES
Data Sources
GSDP (state) Economic Survey 2016-17 (Manipur)
Per capita GSDP figures Economic Survey 2016-17 (Manipur)
GSDP (India) Economic Survey 2016-17 (India)
Installed power capacity (MW) Central Electricity Authority, as of April 2018
Wireless subscribers (No) Telecom Regulatory Authority of India, as of March 2018
Internet subscribers (Mn) Telecom Regulatory Authority of India, as of December 2017
National highway length (km) NHAI, Roads and Building Department-Government of India
Major and minor ports (No) India Ports Association
Airports (No) Airports Authority of India
Literacy rate (%) Economic Survey 2016-17 (Manipur)
Birth rate (per 1,000 population) Economic Survey 2016-17 (Manipur)
Cumulative FDI equity inflows (US$ billion) Department of Industrial Policy & Promotion, April 2000 to December 2017
Operational PPP projects (No) DEA , Ministry of Finance, Government of India
Operational SEZs (No) Notified as of December 2017, Ministry of Commerce & Industry, Department of Commerce,
December 2017
For updated information, please visit www.ibef.org MANIPUR 41
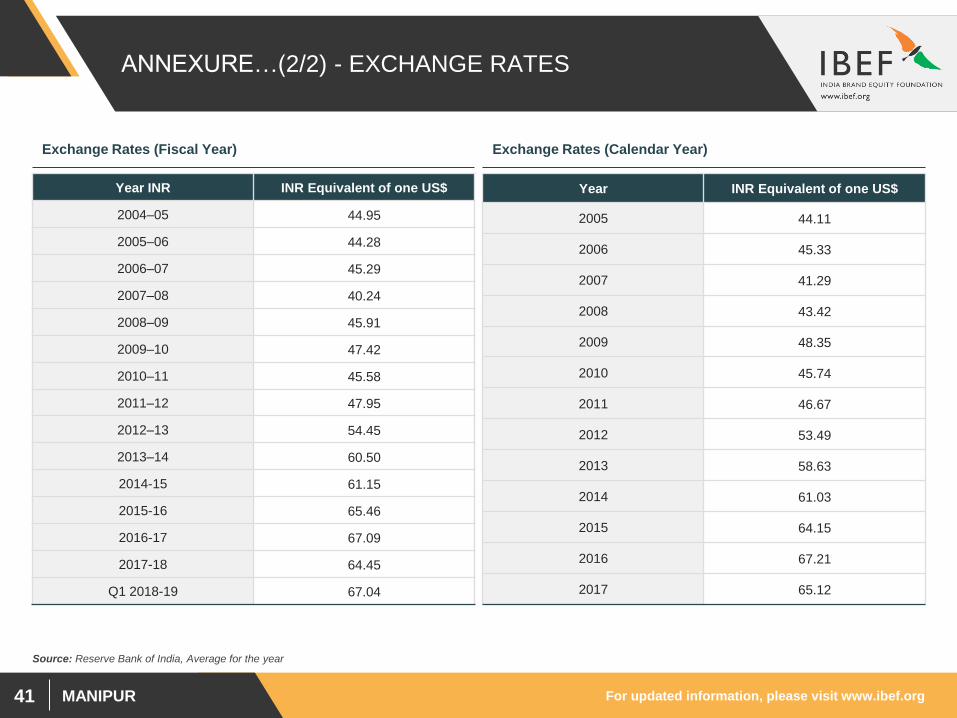
ANNEXURE…(2/2) - EXCHANGE RATES
Exchange Rates (Fiscal Year) Exchange Rates (Calendar Year)
Year INR INR Equivalent of one US$
2004–05 44.95
2005–06 44.28
2006–07 45.29
2007–08 40.24
2008–09 45.91
2009–10 47.42
2010–11 45.58
2011–12 47.95
2012–13 54.45
2013–14 60.50
2014-15 61.15
2015-16 65.46
2016-17 67.09
2017-18 64.45
Q1 2018-19 67.04
Year INR Equivalent of one US$
2005 44.11
2006 45.33
2007 41.29
2008 43.42
2009 48.35
2010 45.74
2011 46.67
2012 53.49
2013 58.63
2014 61.03
2015 64.15
2016 67.21
2017 65.12
Source: Reserve Bank of India, Average for the year
For updated information, please visit www.ibef.org MANIPUR 42
DISCLAIMER
India Brand Equity Foundation (IBEF) engaged Aranca to prepare this presentation and the same has been prepared by Aranca in consultation with
IBEF.
All rights reserved. All copyright in this presentation and related works is solely and exclusively owned by IBEF. The same may not be reproduced,
wholly or in part in any material form (including photocopying or storing it in any medium by electronic means and whether or not transiently or
incidentally to some other use of this presentation), modified or in any manner communicated to any third party except with the written approval of
IBEF.
This presentation is for information purposes only. While due care has been taken during the compilation of this presentation to ensure that the
information is accurate to the best of Aranca and IBEF’s knowledge and belief, the content is not to be construed in any manner whatsoever as a
substitute for professional advice.
Aranca and IBEF neither recommend nor endorse any specific products or services that may have been mentioned in this presentation and nor do
they assume any liability or responsibility for the outcome of decisions taken as a result of any reliance placed on this presentation.
Neither Aranca nor IBEF shall be liable for any direct or indirect damages that may arise due to any act or omission on the part of the user due to any
reliance placed or guidance taken from any portion of this presentation.