
Exclusive - weyak.qa‚وة التركيز.pdf Exclusive . Exclusive . Exclusive
, 120133, published online 31 October 20122 2012 Open Biol. Zhenxun Wang, Hyun Yong Jeon, Frank Rigo, C. Frank Bennett and Adrian R. Krainer by antisense oligonucleotidesManipulation of PK-M mutually exclusive alternative splicing
Supplementary datahttp://rsob.royalsocietypublishing.org/content/suppl/2012/10/30/rsob.120133.DC1.html
"Data Supplement"
Referenceshttp://rsob.royalsocietypublishing.org/content/2/10/120133.full.html#ref-list-1
This article cites 31 articles, 13 of which can be accessed free
any medium, provided the original work is properly cited.Attribution License, which permits unrestricted use, distribution, and reproduction in This is an open-access article distributed under the terms of the Creative Commons
Subject collections
(27 articles)molecular biology � (3 articles)biotechnology �
(29 articles)biochemistry � Articles on similar topics can be found in the following collections
Email alerting service hereright-hand corner of the article or click Receive free email alerts when new articles cite this article - sign up in the box at the top
on January 17, 2013rsob.royalsocietypublishing.orgDownloaded from
on January 17, 2013rsob.royalsocietypublishing.orgDownloaded from
rsob.royalsocietypublishing.org
ResearchCite this article: Wang Z, Jeon HY, Rigo F,
Bennett CF, Krainer AR. 2012 Manipulation of
PK-M mutually exclusive alternative splicing by
antisense oligonucleotides. Open Biol 2:
120133.
http://dx.doi.org/10.1098/rsob.120133
Received: 10 September 2012
Accepted: 11 October 2012
Subject Area:biochemistry/biotechnology/molecular biology
Keywords:alternative splicing, antisense oligonucleotides,
cancer
Author for correspondence:Adrian R. Krainer
e-mail: [email protected]
†Present address: Genome Institute
of Singapore, Singapore 138672,
Republic of Singapore.
Electronic supplementary material is available
at http://dx.doi.org/10.1098/rsob.120133.
& 2012 The Authors. Published by the Royal Society under the terms of the Creative Commons AttributionLicense http://creativecommons.org/licenses/by/3.0/, which permits unrestricted use, provided the originalauthor and source are credited.
Manipulation of PK-M mutuallyexclusive alternative splicing byantisense oligonucleotidesZhenxun Wang1,2,†, Hyun Yong Jeon1,3, Frank Rigo4,
C. Frank Bennett4 and Adrian R. Krainer1,2
1Cold Spring Harbor Laboratory, Cold Spring Harbor, NY 11724, USA2Watson School of Biological Sciences, Cold Spring Harbor, NY 11724, USA3Graduate Program in Molecular and Cellular Biology, Stony Brook University,Stony Brook, NY 11794, USA4Isis Pharmaceuticals, Carlsbad, CA 92008, USA
1. SummaryAlternative splicing of the pyruvate kinase M gene involves a choice between
mutually exclusive exons 9 and 10. Use of exon 10 to generate the M2 isoform
is crucial for aerobic glycolysis (the Warburg effect) and tumour growth. We pre-
viously demonstrated that splicing enhancer elements that activate exon 10 are
mainly found in exon 10 itself, and deleting or mutating these elements increases
the inclusion of exon 9 in cancer cells. To systematically search for new enhancer
elements in exon 10 and develop an effective pharmacological method to force a
switch from PK-M2 to PK-M1, we carried out an antisense oligonucleotide
(ASO) screen. We found potent ASOs that target a novel enhancer in exon 10
and strongly switch the splicing of endogenous PK-M transcripts to include
exon 9. We further show that the ASO-mediated switch in alternative splicing
leads to apoptosis in glioblastoma cell lines, and this is caused by the downregula-
tion of PK-M2, and not by the upregulation of PK-M1. These data highlight the
potential of ASO-mediated inhibition of PK-M2 splicing as therapy for cancer.
2. IntroductionCancer cells preferentially use the glycolytic metabolic pathway with lactate
generation, even under normal oxygen conditions [1]. This metabolic feature
is termed the Warburg effect. Expression of the type II isoform of the
pyruvate kinase M gene (PKM2, referred to here as PK-M) has been shown to
mediate this effect, and to facilitate the proliferation of cancer cells in vivo [2].
The PK-M gene consists of 12 exons; exons 9 and 10 are alternatively spliced
in a mutually exclusive fashion to give rise to M1 and M2 isoforms, respectively
[3]. PK-M catalyses the final step in glycolysis to generate pyruvate and ATP
from phosphoenolpyruvate and ADP [4]. Exons 9 and 10 each encode a
56-amino acid segment that confers distinctive properties to the respective
PK-M isozymes. PK-M1 is constitutively active, whereas PK-M2 is allosteri-
cally regulated by fructose-1,6-bisphosphate levels and interaction with
tyrosine-phosphorylated signalling proteins [5].
Consistent with the correlation between proliferation and PK-M2
expression, PK-M2 is highly expressed in embryonic tissues and in a broad
range of cancer cells, whereas PK-M1 is predominantly expressed in terminally
differentiated tissues [2,6]. In particular, the mammalian target of rapamycin
pathway, which is a central mediator of cellular growth and proliferation,
rsob.royalsocietypublishing.orgOpen
Biol2:120133
2
on January 17, 2013rsob.royalsocietypublishing.orgDownloaded from
transcriptionally induces PK-M expression through the
transcription factor hypoxia inducible factor-1a (HIF-1a) [7].
Paradoxically, downregulation of PK-M2 kinase activity is
required for cancer cell growth. As PK-M2 is a rate-limiting
enzyme in glycolysis, inhibition of PK-M activity decreases
carbon flux through the catabolic glycolytic pathway,
allowing upstream intermediates to be shunted to anabolic
pathways, and thereby facilitating proliferation [2] and
detoxification of reactive oxygen species (ROS) [8]. Apart
from allosteric regulation, PK-M2 kinase activity can be sup-
pressed in other ways, including growth-signalling-mediated
inhibition through the binding of phosphorylated tyrosine
proteins to its allosteric pocket [5], direct phosphorylation
at Y105 [9], acetylation at K305 [10] and oxidation at C358
via ROS [8]. The multitude of avenues leading to PK-M2 inhi-
bition underlies the importance of PK-M2 regulation and
glycolysis in tumorigenesis.
PK-M2 has also been demonstrated to have critical func-
tions beyond its kinase activity. In particular, PK-M2 can
translocate into the nucleus and serve as a transcriptional
co-activator for HIF-1a [11] and b-catenin [12] in mediating
transactivation of targets important for tumour growth and
proliferation. In spite of the importance of PK-M2 in tumor-
igenesis, little is known regarding alternative splicing of the
PK-M pre-mRNA that predominantly generates the PK-M2
isoform in all cancer cells.
We and others previously showed that exon 9 inclusion,
which generates the PK-M1 isoform, is actively repressed in
cancer cells via the well-characterized PTB/nPTB and
hnRNPA1/A2 splicing repressors [6,13]. We further showed
that critical cis-elements that mediate the predominant
PK-M2 splicing pattern in cancer cells are located in the
exons, and we identified a potent exon-10 exonic splicing
enhancer (ESE) that recruits the splicing activator SRSF3,
promoting use of this exon [14].
Because of the importance of PK-M2 as a potential cancer
drug target, and in order to systematically search for new
splicing elements that mediate the PK-M2 dominant splicing
patterns, we conducted an antisense oligonucleotide (ASO)
screen targeting endogenous PK-M exon 10 to discover
ASOs that switch the expression of the PK-M2 isoform to
the PK-M1 isoform in cancer cells.
ASOs have generally been used to downregulate mRNA
expression by homing to target mRNAs via Watson–Crick
base pairing and inducing ribonuclease H (RNase H)-mediated
degradation of the RNA [15]. Certain chemical modifications
have been used to generate a class of nuclease-resistant ASOs
with high affinity for their RNA targets and which do not operate
through the RNase H mechanism. ASOs have been engineered
with a wide range of chemical modifications, such as 20-O-
methyl (20OMe), 2-O-methoxyethyl (MOE), peptide nucleic
acid, locked nucleic acid and phosphorodiamidate morpholino.
These ASOs work by direct sequence-specific annealing to the
target transcript to block either splicing cis-elements, or
ribosome recruitment so as to inhibit translation [16,17].
Our splicing ASO screen uncovered potent oligonucleo-
tides that increase PK-M1 inclusion in cancer cell lines. We
show that the effective ASOs principally target a new ESE
in exon 10, and transfection of these ASOs into glioblastoma
cell lines induces apoptosis. We demonstrate that this pheno-
type is caused by the ASO-mediated downregulation of
PK-M2 expression, highlighting the therapeutic potential
of the PK-M pre-mRNA as an ASO drug target.
3. Results3.1. An exon 10-focused antisense oligonucleotide screen
uncovers potent oligonucleotides that increase exon9 inclusion and exon 10 skipping in cell lines
We previously reported that the critical cis-elements involved in
the activation of exon 10 in proliferating cells are located within
the exon [14]. To pinpoint the locations of these elements, we
performed a systematic ASO walk along the entire length of
PK-M exon 10. These ASOs have a phosphorothioate backbone
and MOE at the 20 ribose position, which allows them to bind to
RNA targets with high affinity, while conferring resistance to
both endogenous nucleases and to cleavage of the target
RNA by RNase H [18,19]. The overlapping 15-mer ASOs
were designed to cover the entire 167 nt exon 10 in 5 nt steps.
To examine the effects of individual ASOs on endogenous
PK-M transcripts, we transfected each ASO into HEK-293
cells at a nominal final concentration of 30 nM, and analysed
the splicing of the endogenous PK-M transcripts by radio-
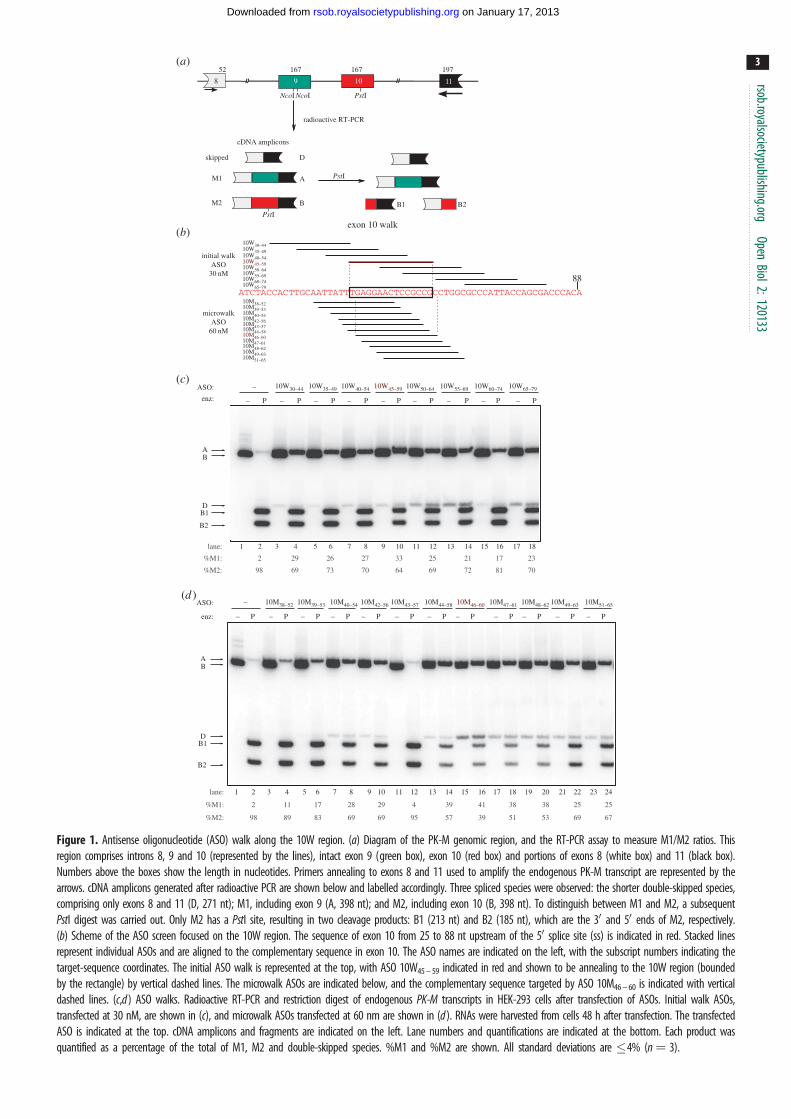
active RT-PCR, 48 h after transfection (figure 1a). Some
exon 10 ASOs strongly increased the proportion of PK-M1
mRNA, with a concurrent increase in the amount of double-
skipped mRNA ( joining of exons 8 and 11) and a decrease
in PK-M2 mRNA, suggesting that these ASOs target func-
tional ESEs in exon 10. The two most potent ASOs that
decreased the proportion of PK-M2 mRNA were 10W45 –59
(figure 1c, lane 10) and 10W140 – 154 (see the electronic sup-
plementary material, figure S1b, lane 10). ASO 10W140–154
targets the previously characterized exon 10 SRSF3 motif
[14], whereas ASO 10W45 – 59 targets a non-overlapping 15 nt
region in the middle of exon 10 (termed the 10W region).
3.2. Antisense oligonucleotide microwalks centred onthe 10W exonic splicing enhancer region
To find optimal ASOs that target the exon 10 region defined by
ASO 10W45–59, we performed an ASO microwalk (figure 1b,d).
Overlapping 15 nt ASOs targeting this region were designed in
1 nt steps. A total of 12 ASOs were synthesized for this region,
and transfected into HEK-293 cells at a nominal concentration
of 60 nM. ASO 10M46–60 was the most potent in increasing
endogenous PK-M1 mRNA (figure 1d, lane 16) and decreasing
PK-M2 mRNA abundance. We also performed a second micro-
walk centred on the region defined by ASO 10W140–154, and
found that the ASO 10MS139–153 optimally abrogated
the SRSF3-dependent ESE in exon 10 (see the electronic
supplementary material, figure S1c, lane 10).
3.3. Antisense oligonucleotides 10W45 – 59 and 10M46 – 60
target a novel activation region of PK-M exon 10Because of the strong effect of ASOs 10W45–59 and 10M46–60 on
PK-M splicing, we characterized the 15 nt 10W candidate ESE
region in detail. To map the enhancer elements present in the
10W45–59 region, we took advantage of the high sequence iden-
tity between exons 9 and 10, and individually duplicated the
entire 10W region of exon 10, or the first 7 nt (F7) or last 8 nt
(B7) of the 10W region, into their corresponding exon 9 locations
(figure 2a). Because of the low baseline PK-M1 inclusion from the
(a)
(b)
9
radioactive RT-PCR
52 167 167 197
NcoI NcoI PstI
Exon 9
PstI
cDNA amplicons
PstIM1
M2
8 10 11
Exon 9
skipped D
A
B B1 B2
ATCTACCACTTGCAATTATTTGAGGAACTCCGCCGCCTGGCGCCCATTACCAGCGACCCACA
88
10W30–44
10M38–5210M39–5310M40–5410M42–5610M43–5710M44–5810M46–6010M47–6110M48–6210M49–6310M51–65
exon 10 walk
initial walkASO
30 nM
microwalkASO
60 nM
(c)
– Penz:
ASO:
AB
D
1 2 3 4 5 6 7 8 9 10 11 12 13 14 15 16 17 18
B1
B2
–
– P – P – P – P – P – P – P – P
%M2: 98 69 73 70 64 69 72 81 70
%M1:
lane:
2 29 26 27 33 25 21 17 23
1 2 3 4 5 6 7 8 9 10 11 12 13 14 15 16 17 18 19 20 21 22 23 24
%M2: 98 89 83 69 69 95 57 39 51 53 69 67
%M1:
lane:
2 11 17 28 29 4 39 41 38 38 25 25
enz:
ASO:
AB
DB1
B2
– P – P – P – P – P – P – P – P – P – P – P – P
–(d )
10W35–4910W40–5410W45–5910W50–6410W55–6910W60–7410W65–79
10W30–44 10W35–49 10W40–54 10W45–59 10W50–64 10W55–69 10W60–74 10W65–79
10M38–52 10M39–53 10M40–54 10M42–56 10M43–57 10M44–58 10M46–60 10M47–61 10M48–62 10M49–63 10M51–65
Figure 1. Antisense oligonucleotide (ASO) walk along the 10W region. (a) Diagram of the PK-M genomic region, and the RT-PCR assay to measure M1/M2 ratios. Thisregion comprises introns 8, 9 and 10 (represented by the lines), intact exon 9 (green box), exon 10 (red box) and portions of exons 8 (white box) and 11 (black box).Numbers above the boxes show the length in nucleotides. Primers annealing to exons 8 and 11 used to amplify the endogenous PK-M transcript are represented by thearrows. cDNA amplicons generated after radioactive PCR are shown below and labelled accordingly. Three spliced species were observed: the shorter double-skipped species,comprising only exons 8 and 11 (D, 271 nt); M1, including exon 9 (A, 398 nt); and M2, including exon 10 (B, 398 nt). To distinguish between M1 and M2, a subsequentPstI digest was carried out. Only M2 has a PstI site, resulting in two cleavage products: B1 (213 nt) and B2 (185 nt), which are the 30 and 50 ends of M2, respectively.(b) Scheme of the ASO screen focused on the 10W region. The sequence of exon 10 from 25 to 88 nt upstream of the 50 splice site (ss) is indicated in red. Stacked linesrepresent individual ASOs and are aligned to the complementary sequence in exon 10. The ASO names are indicated on the left, with the subscript numbers indicating thetarget-sequence coordinates. The initial ASO walk is represented at the top, with ASO 10W45 – 59 indicated in red and shown to be annealing to the 10W region (boundedby the rectangle) by vertical dashed lines. The microwalk ASOs are indicated below, and the complementary sequence targeted by ASO 10M46 – 60 is indicated with verticaldashed lines. (c,d ) ASO walks. Radioactive RT-PCR and restriction digest of endogenous PK-M transcripts in HEK-293 cells after transfection of ASOs. Initial walk ASOs,transfected at 30 nM, are shown in (c), and microwalk ASOs transfected at 60 nm are shown in (d ). RNAs were harvested from cells 48 h after transfection. The transfectedASO is indicated at the top. cDNA amplicons and fragments are indicated on the left. Lane numbers and quantifications are indicated at the bottom. Each product wasquantified as a percentage of the total of M1, M2 and double-skipped species. %M1 and %M2 are shown. All standard deviations are �4% (n¼ 3).
rsob.royalsocietypublishing.orgOpen
Biol2:120133
3
on January 17, 2013rsob.royalsocietypublishing.orgDownloaded from
–
– P – P – P –
– P – P – P – P – P – P – P – P – P
P – P – P
P – P – Penz:
minigene: 10W 10F 10B
f
ab
d
b2
b3
f1
%M1:lane: 1 2 3 4 5 6
2 <1 29
%M1:
%Skp:
lane: 1 2 3 4 5 616 63 85
26 8
%M2: 93 11 7
%Skp:lane: 1 2 3 4 5 6
1 60 82%M2: 99 40 18
%Skp:
lane: 1 2 3 4 5 6
95 11 10
20 34%M2:
%M1:
86 68 56%Skp:
lane: 1 2 3 4 5 6
71 19 12
74 80%M2:
%M1:
92 7 9%Skp:
lane: 1 2 3 4 5 6
52 1 1
6 5%M2:
%M1:
93 93 94
ab
d
b2
b3
9 10 10101010WT exon 10 duplication
enz:
g
b
d
b2
b3
ASO:
minigene:
controlenz:
ASO: control
minigene:
minigene rescue mutants:
9d10W
9 10dInt9
9dM
homologous intron 9 region
exon 10 10w region
ASO binding sites
remove/delete binding sites
(a) (b)
(c) (d)
(e)
( f ) (g) (h)
ab
d
b2
b3
9
d10W
enz:ASO: control
minigene:
ab
d
b2
b3
9 10
dInt 9
enz:
minigene:
ab
d
b2
b3
9
dM
enz:
ASO: control
minigene:
10W45–59 10M46–60 10W45–59 10M46–60
10W45–59 10M46–60 ASO: control 10W45–59 10M46–60 10W45–59 10M46–60
exon 10 to exon 9 subexonic duplication
duplicatedregion:
10W
10F
10B
regiontargeted by:
ASO
10W45–59
M1
M2
Ex 10 10W region
10
10W10F10B 10M46–60
G7 ASO 3¢ -5¢
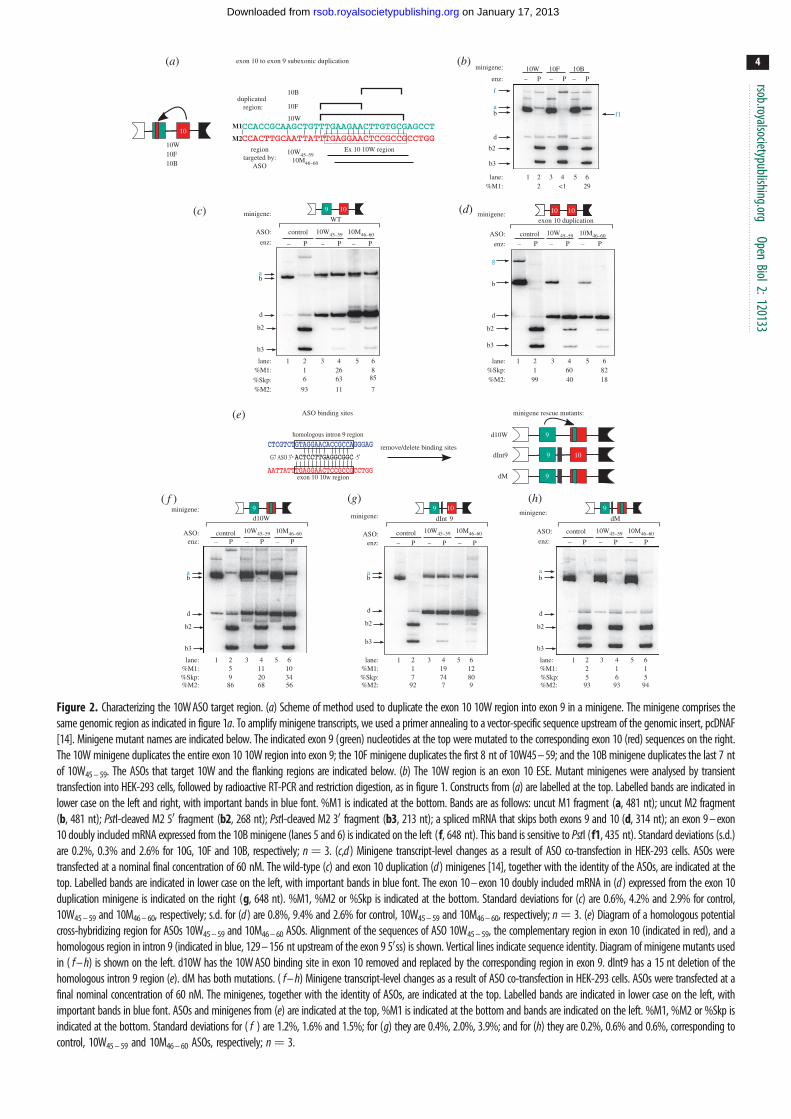
Figure 2. Characterizing the 10W ASO target region. (a) Scheme of method used to duplicate the exon 10 10W region into exon 9 in a minigene. The minigene comprises thesame genomic region as indicated in figure 1a. To amplify minigene transcripts, we used a primer annealing to a vector-specific sequence upstream of the genomic insert, pcDNAF[14]. Minigene mutant names are indicated below. The indicated exon 9 (green) nucleotides at the top were mutated to the corresponding exon 10 (red) sequences on the right.The 10W minigene duplicates the entire exon 10 10W region into exon 9; the 10F minigene duplicates the first 8 nt of 10W45 – 59; and the 10B minigene duplicates the last 7 ntof 10W45 – 59. The ASOs that target 10W and the flanking regions are indicated below. (b) The 10W region is an exon 10 ESE. Mutant minigenes were analysed by transienttransfection into HEK-293 cells, followed by radioactive RT-PCR and restriction digestion, as in figure 1. Constructs from (a) are labelled at the top. Labelled bands are indicated inlower case on the left and right, with important bands in blue font. %M1 is indicated at the bottom. Bands are as follows: uncut M1 fragment (a, 481 nt); uncut M2 fragment(b, 481 nt); PstI-cleaved M2 50 fragment (b2, 268 nt); PstI-cleaved M2 30 fragment (b3, 213 nt); a spliced mRNA that skips both exons 9 and 10 (d, 314 nt); an exon 9 – exon10 doubly included mRNA expressed from the 10B minigene (lanes 5 and 6) is indicated on the left (f, 648 nt). This band is sensitive to PstI (f1, 435 nt). Standard deviations (s.d.)are 0.2%, 0.3% and 2.6% for 10G, 10F and 10B, respectively; n¼ 3. (c,d ) Minigene transcript-level changes as a result of ASO co-transfection in HEK-293 cells. ASOs weretransfected at a nominal final concentration of 60 nM. The wild-type (c) and exon 10 duplication (d ) minigenes [14], together with the identity of the ASOs, are indicated at thetop. Labelled bands are indicated in lower case on the left, with important bands in blue font. The exon 10 – exon 10 doubly included mRNA in (d ) expressed from the exon 10duplication minigene is indicated on the right (g, 648 nt). %M1, %M2 or %Skp is indicated at the bottom. Standard deviations for (c) are 0.6%, 4.2% and 2.9% for control,10W45 – 59 and 10M46 – 60, respectively; s.d. for (d ) are 0.8%, 9.4% and 2.6% for control, 10W45 – 59 and 10M46 – 60, respectively; n¼ 3. (e) Diagram of a homologous potentialcross-hybridizing region for ASOs 10W45 – 59 and 10M46 – 60 ASOs. Alignment of the sequences of ASO 10W45 – 59, the complementary region in exon 10 (indicated in red), and ahomologous region in intron 9 (indicated in blue, 129 – 156 nt upstream of the exon 9 50ss) is shown. Vertical lines indicate sequence identity. Diagram of minigene mutants usedin ( f – h) is shown on the left. d10W has the 10W ASO binding site in exon 10 removed and replaced by the corresponding region in exon 9. dInt9 has a 15 nt deletion of thehomologous intron 9 region (e). dM has both mutations. ( f – h) Minigene transcript-level changes as a result of ASO co-transfection in HEK-293 cells. ASOs were transfected at afinal nominal concentration of 60 nM. The minigenes, together with the identity of ASOs, are indicated at the top. Labelled bands are indicated in lower case on the left, withimportant bands in blue font. ASOs and minigenes from (e) are indicated at the top, %M1 is indicated at the bottom and bands are indicated on the left. %M1, %M2 or %Skp isindicated at the bottom. Standard deviations for ( f ) are 1.2%, 1.6% and 1.5%; for (g) they are 0.4%, 2.0%, 3.9%; and for (h) they are 0.2%, 0.6% and 0.6%, corresponding tocontrol, 10W45 – 59 and 10M46 – 60 ASOs, respectively; n¼ 3.
rsob.royalsocietypublishing.orgOpen
Biol2:120133
4
on January 17, 2013rsob.royalsocietypublishing.orgDownloaded from
rsob.royalsocietypublishing.orgOpen
Biol2:120133
5
on January 17, 2013rsob.royalsocietypublishing.orgDownloaded from
wild-type minigene, any strong ESEs comprised by the candidate
regions should lead to an increase in PK-M1 mRNAs expressed
from the minigene. Duplication of the B7 region, but not the F7
and 10W region, led to increased exon 9 inclusion (figure 2b,
compare lanes 2 and 4 with lane 6). This result suggests that
the 8 nt B7 motif is a bona fide exon 10 ESE. Interestingly, dupli-
cation of F7 alone led to a further decrease in exon 9 inclusion,
compared with the wild-type minigene (figure 1c, lanes 1
and 2), suggesting that F7 is an exon 10 splicing silencer that
also represses the inclusion of exon 9 when placed in the context
of the 10 W minigene.
3.4. Antisense oligonucleotides 10W45 – 59 and 10M46 – 60
interfere with exon 10 definitionTo characterize the mechanism of action of ASOs 10W45 – 59
and 10M46 – 60 on the inclusion of exon 9 and skipping of
exon 10, we co-transfected these ASOs with the previously
characterized PK-M wild-type or duplicated exon 10 mini-
genes (figure 2c,d ). The wild-type minigene comprises the
flanking exons 8 and 11, and the complete genomic region
between both exons, whereas the duplication construct has
exon 10 cleanly replacing exon 9.
As expected, both ASOs 10W45 – 59 and 10M46 – 60 switched
the splicing of the minigene transcript by simultaneously
increasing the amount of M1 mRNA and decreasing the
amount of M2 mRNA expressed from the wild-type minigene
(figure 2c). However, ASO 10W45 – 59 increased exon 9
inclusion to a greater extent than 10M46 – 60, although the
latter decreased exon 10 inclusion to a greater extent, result-
ing in higher levels of double-skipped (Skp) transcripts
(figure 2c, compare lanes 4 and 6).
Co-transfection of ASOs 10W45–59 or 10M46–60 with the
exon 10 duplication minigene interfered with the inclusion of
exon 10, leading to a large increase in double-skipped species
(figure 2d). ASO 10M46–60 was especially potent, nearly con-
verting all the mRNA to the Skp isoform (figure 2d, compare
lanes 4 and 6). These results suggest that both ASO 10W45–59
and ASO 10M46–60 interfere with the activation of exon 10.
3.5. The 10W region of exon 10 is the critical bindingsite for antisense oligonucleotides 10W45 – 59
and 10M46 – 60
Alignment of the 10W region with the PK-M exons 8–11
genomic region revealed a highly homologous region in
intron 9 (figure 2e). To weigh the relative contributions of
the exon 10 and intron 9 complementary regions for the
effect of ASOs 10W45 – 59 and 10M46 – 60 on PK-M splicing,
we made minigene mutations that eliminated the pre-
sumptive target sites in exon 10, intron 9 or both, and
determined the effect of the ASOs on splicing of the
mutant-minigene transcripts. Three mutants were generated
(figure 2e): (i) we mutated the exon 10 10W region by dupli-
cating the corresponding exon 9 region (termed the d10W
construct); (ii) we introduced a 15 nt deletion in intron 9
that removed the homologous target region (termed the
dInt9 construct); and (iii) we introduced both mutations in
the same minigene (termed the dM construct).
There was a slight decrease in baseline minigene PK-M2
mRNA expressed from the d10W minigene (figure 2f,
lane 2), suggesting that the duplicated exon 9 region contains
weak repressor elements. This was not the case for the dInt9
construct, suggesting that this region alone does not have a
major effect in dictating M1/M2 ratios.
The loss of the 10W binding site largely abrogated exon 9
inclusion and exon 10 skipping promoted by ASOs 10W45 – 59
and 10M46 – 60 (figure 2f, lanes 4 and 6). By contrast, removal
of the intron 9 homologous region did not block the effect of
ASOs 10W45 – 59 and 10M46 – 60 on splicing (figure 2g, lanes 4
and 6). However, when both binding sites were removed,
the effect of ASOs 10W45 – 59 and 10M46 – 60 was completely
abrogated (figure 2h, lanes 4 and 6). The above results indicate
that ASOs 10W45–59 and 10M46–60 largely mediate exon 9
inclusion through the 10W complementary region in exon 10,
though a small effect is attributable to cross-hybridization
with the homologous region in intron 9.
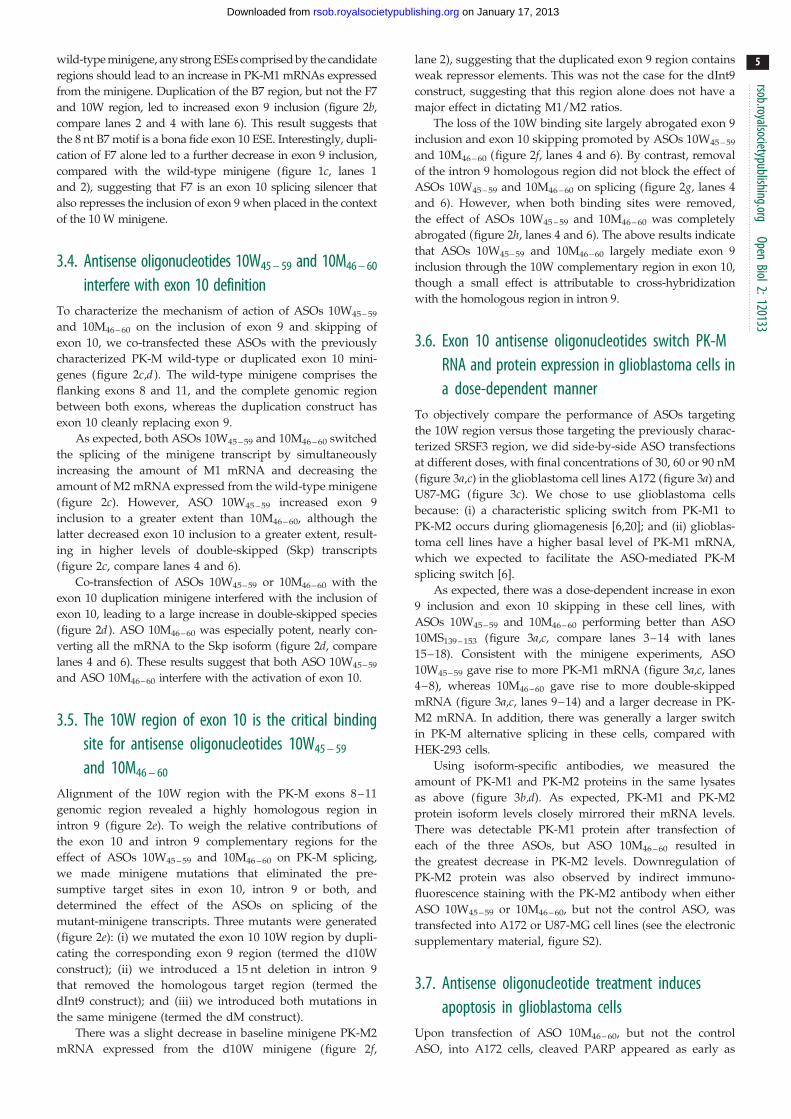
3.6. Exon 10 antisense oligonucleotides switch PK-MRNA and protein expression in glioblastoma cells ina dose-dependent manner
To objectively compare the performance of ASOs targeting
the 10W region versus those targeting the previously charac-
terized SRSF3 region, we did side-by-side ASO transfections
at different doses, with final concentrations of 30, 60 or 90 nM
(figure 3a,c) in the glioblastoma cell lines A172 (figure 3a) and
U87-MG (figure 3c). We chose to use glioblastoma cells
because: (i) a characteristic splicing switch from PK-M1 to
PK-M2 occurs during gliomagenesis [6,20]; and (ii) glioblas-
toma cell lines have a higher basal level of PK-M1 mRNA,
which we expected to facilitate the ASO-mediated PK-M
splicing switch [6].
As expected, there was a dose-dependent increase in exon
9 inclusion and exon 10 skipping in these cell lines, with
ASOs 10W45–59 and 10M46–60 performing better than ASO
10MS139–153 (figure 3a,c, compare lanes 3–14 with lanes
15–18). Consistent with the minigene experiments, ASO
10W45–59 gave rise to more PK-M1 mRNA (figure 3a,c, lanes
4–8), whereas 10M46–60 gave rise to more double-skipped
mRNA (figure 3a,c, lanes 9–14) and a larger decrease in PK-
M2 mRNA. In addition, there was generally a larger switch
in PK-M alternative splicing in these cells, compared with
HEK-293 cells.
Using isoform-specific antibodies, we measured the
amount of PK-M1 and PK-M2 proteins in the same lysates
as above (figure 3b,d). As expected, PK-M1 and PK-M2
protein isoform levels closely mirrored their mRNA levels.
There was detectable PK-M1 protein after transfection of
each of the three ASOs, but ASO 10M46 – 60 resulted in
the greatest decrease in PK-M2 levels. Downregulation of
PK-M2 protein was also observed by indirect immuno-
fluorescence staining with the PK-M2 antibody when either
ASO 10W45 – 59 or 10M46 – 60, but not the control ASO, was
transfected into A172 or U87-MG cell lines (see the electronic
supplementary material, figure S2).
3.7. Antisense oligonucleotide treatment inducesapoptosis in glioblastoma cells
Upon transfection of ASO 10M46 – 60, but not the control
ASO, into A172 cells, cleaved PARP appeared as early as
AB
DB1
B2
– P – P – P – P – P – P – P – P – P
– P – P – P – P – P – P – P – P – P
enz:
ASO:
cell line:
control 10W45–59 10M49–60 10MS139–154
AB
DB1
B2
enz:
ASO:
cell line:
control
(a)
(b)
(c)
(d )
actin
PK-M1
PK-M2
actin
PK-M1
PK-M2
cell line:ASO:
10W45–59 10M49–60 10MS139–154
10W45–59 10M49–60 10MS139–154control control
cell line:ASO: 10W45–59 10M49–60 10MS139–154control control
%Skp:
lane: 1 2 3 4 5 6 7 8 9 10 11 12 13 14 15 16 17 18
815 52 63 73 49 49 56 39 44
12 23 10 15
%M2:
%M1:
85 48 37 27 42 38 21 51 41
%Skp:
lane: 1 2 3 4 5 6 7 8 9 10 11 12 13 14 15 16 17 18
124 43 50 54
2 3 536 38 45 24 29
17 22 11 14
%M2:
%M1:
96 55 46 41 52 44 33 65 57
Figure 3. Effects of ASOs on PK-M mRNA and protein levels in glioblastoma cells. (a,c) Effects of ASOs 10M46 – 60, 10W45 – 59 and 10MS139 – 153 on endogenous PK-MmRNAs in (a) A172 and (c) U87-MG glioblastoma cells. Radioactive RT-PCR and restriction digest of endogenous PK-M transcripts were performed for the indicatedcell lines 36 h after transfection of 30, 60 or 90 nM 10W45 – 59 or 10M46 – 60 ASO, or 60 or 90 nM 10MS139 – 153 ASO. The control ASO was transfected at 90 nM. %M1,%M2 and %Skp are indicated at the bottom. All s.d. are �4%; n ¼ 3. (b,d ) Immunoblot analysis of PK-M protein isoform levels in (b) A172 and (d ) U87-MG cellstransfected in (a,c). A representative blot from one of three independent experiments is shown. Antibodies used are indicated on the left.
rsob.royalsocietypublishing.orgOpen
Biol2:120133
6
on January 17, 2013rsob.royalsocietypublishing.orgDownloaded from
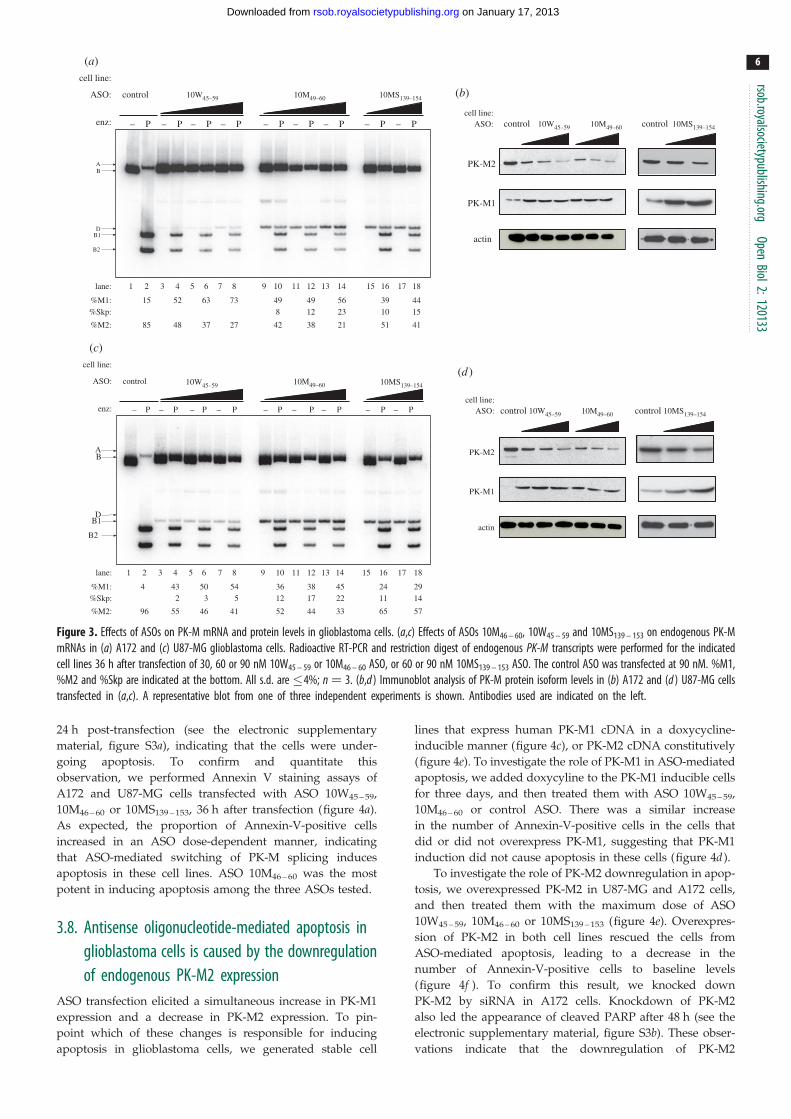
24 h post-transfection (see the electronic supplementary
material, figure S3a), indicating that the cells were under-
going apoptosis. To confirm and quantitate this
observation, we performed Annexin V staining assays of
A172 and U87-MG cells transfected with ASO 10W45 – 59,
10M46 – 60 or 10MS139 – 153, 36 h after transfection (figure 4a).
As expected, the proportion of Annexin-V-positive cells
increased in an ASO dose-dependent manner, indicating
that ASO-mediated switching of PK-M splicing induces
apoptosis in these cell lines. ASO 10M46 – 60 was the most
potent in inducing apoptosis among the three ASOs tested.
3.8. Antisense oligonucleotide-mediated apoptosis inglioblastoma cells is caused by the downregulationof endogenous PK-M2 expression
ASO transfection elicited a simultaneous increase in PK-M1
expression and a decrease in PK-M2 expression. To pin-
point which of these changes is responsible for inducing
apoptosis in glioblastoma cells, we generated stable cell
lines that express human PK-M1 cDNA in a doxycycline-
inducible manner (figure 4c), or PK-M2 cDNA constitutively
(figure 4e). To investigate the role of PK-M1 in ASO-mediated
apoptosis, we added doxycyline to the PK-M1 inducible cells
for three days, and then treated them with ASO 10W45 – 59,
10M46 – 60 or control ASO. There was a similar increase
in the number of Annexin-V-positive cells in the cells that
did or did not overexpress PK-M1, suggesting that PK-M1
induction did not cause apoptosis in these cells (figure 4d ).
To investigate the role of PK-M2 downregulation in apop-
tosis, we overexpressed PK-M2 in U87-MG and A172 cells,
and then treated them with the maximum dose of ASO
10W45 – 59, 10M46 – 60 or 10MS139 – 153 (figure 4e). Overexpres-
sion of PK-M2 in both cell lines rescued the cells from
ASO-mediated apoptosis, leading to a decrease in the
number of Annexin-V-positive cells to baseline levels
(figure 4f ). To confirm this result, we knocked down
PK-M2 by siRNA in A172 cells. Knockdown of PK-M2
also led the appearance of cleaved PARP after 48 h (see the
electronic supplementary material, figure S3b). These obser-
vations indicate that the downregulation of PK-M2
70 A172
U8760
50
40
30
20
% a
popt
osis
10
Ctl 10W45–59
10M46–6010W45–5910MS139–153control(a)
(b)
(d)(c)
(e)
( f )
ASO:
105
104
103
103
102
102 104 105
0 96.7 1.41 73 6616.9 25 46.8 35.8
96.5 2.09 81.1 62.915.6 20.1 45.5 30.9
0.14 1.79 3.83 6.24 3.11 5.84 3.47 14
0.16 1.27 1.05 2.31 5.67 11.4 8.76 14.9
0 103102 104 1050 103102 104 1050 103102 104 1050
7 A
AD
A172
U87
Annexin V-APC
10M46–6010MS139–153 10W45–59
10W45–59
10W45–59
10M46–60
10MS
139–153
10W45–59
10M46–60
10MS
139–153
10W45–59
10M46–60
10MS
139–153
10W45–59
10M46–60
10MS
139–153
10M46–60
10M46–60 10MS139–153Ctl
0
35
17.5
ASO:
fold
cha
nge
over
con
trol
ASO
A172
A172 M2
U87
U87 M2
15.0
12.5
10.0
7.5
5.0
2.5
0
30
25
20
15
10
ASO: Ctl
5
0
% a
popt
osis
ASO:
cell line: A172 dox T7M1
dox: – + +
actin
T7
PK-M1
actin
T7
PK-M2
cell line:
ASO: Ctl
actin
T7
PK-M2
cell line:
ASO:
U87 U87 T7M2
A172
10M 10W10MS Ctl 10M 10W10MS
Ctl 10M 10W10MS Ctl 10M 10W10MS
A172 T7M2
no doxdox
Figure 4. Effects of ASOs on glioblastoma cells. (a,b) Exon 10 ASOs induce apoptosis in glioblastoma cells. (a) U87-MG or A172 cells were transfected with theindicated ASOs at a nominal final concentration of 90 nM, stained with Annexin V-APC/7-AAD 36 h after transfection and analysed by flow cytometry. Thepercentage of Annexin-V-positive cells is indicated for the two right quadrants in each plot. Each plot is a representative of three biological replicates. (b) ASO-induced apoptosis is dose-dependent. The indicated cells were transfected with ASOs 10W45 – 59 or 10M46 – 60 at 30, 60, or 90 nM, or ASO 10MS139 – 153 at 60 or90 nM. The control (Ctl) ASO was transfected at 90 nM. The percentage of Annexin-V-positive cells is plotted for each condition. The identity and dose of ASOs areindicated below the x-axis. Error bars represent s.d. (n ¼ 3). (c,d ) Role of PK-M1 protein isoform in apoptosis induction. (c) Immunoblot analysis of A172 cells stablytransduced with rtTA and doxycycline (dox)-inducible human T7-tagged PK-M1 cDNA. Cells were grown in parallel, with or without doxycycline, and harvested after72 h. Antibodies used are indicated on the left. (d ) Cells were grown as in (c) and then transfected with the indicated ASOs at 60 nM. Cells were then stained andanalysed for Annexin V 36 h after transfection. Histograms indicate the percentage of Annexin-V-positive cells for each condition. Doxcycyline on/off conditions areindicated on the left. Error bars represent s.d. (n ¼ 3). (e,f ) Role of PK-M2 protein isoform in apoptosis induction. A172 or U87 cells were stably transduced withT7-tagged human PK-M2 cDNA; transductants and the parental cell lines were transfected with the indicated ASOs at a nominal final concentration of 90 nM.(e) Immunoblot analysis of cells transfected with the indicated ASOs. Antibodies used are indicated on the left. ( f ) ASO-transfected cells were analysed for AnnexinV as in (d ). Histograms indicate the fold increase in Annexin-V-positive cells, compared with control ASO, for each cell line. Error bars represent s.d. (n ¼ 3).
rsob.royalsocietypublishing.orgOpen
Biol2:120133
7
on January 17, 2013rsob.royalsocietypublishing.orgDownloaded from
expression, but not the induction of PK-M1 expression,
leads to apoptosis in these cell lines.
4. DiscussionWe performed a systematic exon 10 ASO screen, and devel-
oped potent ASOs that increase the inclusion of exon 9 and
skipping of exon 10 in transfected cell lines. We found that
these ASOs switch PK-M splicing especially effectively in
glioblastoma cells, and they induce apoptosis. Finally, we
showed that it is the downregulation of PK-M2 expression
that causes this apoptosis.
Glioblastomas exhibit a high rate of glycolysis, even
under normal oxygen conditions [6]. Consistent with this
phenomenon, the splicing profile of glioblastoma cell lines,
as with other cancer cell lines, is predominantly PK-M2.
Because PK-M2 is a rate-limiting glycolytic enzyme, targeting
rsob.royalsocietypublishing.orgOpen
Biol2:120133
8
on January 17, 2013rsob.royalsocietypublishing.orgDownloaded from
this isoform might inhibit the entire glycolytic pathway,
leading to apoptosis, as previously observed by glucose
withdrawal in glioblastoma cells in vitro [21]. The replace-
ment of PK-M2 in tumour cells with PK-M1 also leads to a
shunting of glycolytic end-products into the mitochondria
[5], phenocopying the apoptotic phenotype displayed
by glioblastoma cells after treatment with dichloroacetic
acid [22,23]. In addition, because PK-M2 also functions as a
co-activator of HIF-1 [11] and b-catenin [12] transactivation,
reducing the level of PK-M2, as opposed to just inhibiting
its kinase function, might also interfere with anti-apoptotic
and pro-proliferative functions [24] mediated by these factors.
How does blocking the activation of the PK-M exon 10
10W region result in activation of exon 9? This may be
explained in terms of 30 splice site (ss) competition, such that
the loss of exon 10 definition leads to more efficient recognition
of the exon 9 30ss by the spliceosome. This was previously
observed upon knockdown of SRSF3 [14]—a recently discov-
ered exon 10 activator—leading to a large increase in PK-M1
mRNA levels in HEK-293 cells. Although here we have suc-
cessfully targeted a novel exon 10 ESE motif, we do not
presently know which splicing factor(s) actually binds to this
10W ESE. In addition, even though the highly homologous
10W-like region in intron 9 does not by itself play a strong
role in exon 10 activation and/or exon 9 repression, rescue
experiments indicate that it works in tandem with the 10W
ESE in exon 10. It will be of interest to identify the factors
responsible for recognition of the exon 10 10W ESE and of
the related element in intron 9, so as to elucidate the exact
mechanism of exon 10 activation mediated by these elements.
However, due to the complicated mechanism controlling
mutually exclusive exon use in this gene, we cannot rule out
the potential influence of RNA secondary and/or tertiary
structures in mediating exon 10 activation. Consequently,
apart from or in conjunction with disrupting RNA–protein
interactions, these ASOs might also work by disrupting
putative RNA higher-order structure present in exon 10.
Additionally, the 10W region appears to comprise adja-
cent silencer (10F) and enhancer (10B) regions. Although it
is clear from the minigene-duplication experiments that
the silencing effect of 10F is masked by 10B in the native con-
text of exon 10, but is dominant in the context of exon 9, the
mechanism responsible for this context-specific repression
remains unknown.
Although certain exon 10 ASOs increase the expression of
PK-M1 protein isoform and decrease that of PK-M2 protein
isoform, we cannot rule out that these ASOs might partially
disrupt PK-M2 mRNA export and translation by remaining
hybridized to the spliced mRNA. Although previous exper-
iments targeting SMN2 pre-mRNA argued against the
influence of analogous ASOs on mRNA transport and trans-
lation [25], further work will be necessary to establish
whether the PK-M ASOs act solely at the level of modulating
alternative splicing.
Although siRNA-mediated knockdown of PK-M2 in the
NCI 60 panel of cell lines has also been reported to induce
apoptosis [26], that strategy might be less effective, consider-
ing that the onset of apoptosis was greatly delayed (144 h
versus 36 h in the present study). In addition, because glio-
blastoma cells can freely take up certain chemically
modified ASOs in vivo [27] without the aid of delivery
agents, ASO-mediated PK-M switching could potentially be
a particularly effective therapeutic strategy.
Although the ASOs we have screened are potent enough to
switch the PK-M splicing profile of glioblastoma cells from PK-
M1 to PK-M2 in vitro, the effects of these ASOs on cells and
tissues that predominantly express PK-M1 are presently
unknown. This will be difficult to test in vitro, because all
cell lines assayed to date predominantly include exon 10 and
express the PK-M2 isoform, regardless of their transformation
status [26] (data not shown). However, given our successful
experience with intracerebroventricular administration of
ASOs in rodents and non-human primates [28–31], it should
be possible in the future to assess the safety of PK-M2
reduction in normal CNS tissues, as well as to evaluate the
efficacy of these ASOs in mouse glioblastoma models.
5. Experimental procedures5.1. Cells and transfectionsHEK-293, U87-MG and A172 cells were obtained from ATCC
and grown in DMEM supplemented with 10 per cent (v/v)
FBS, penicillin and streptomycin, at 378C and 5 per cent
CO2. 5 mg of minigene plasmid per 10 cm dish, or 1 mg per
6-cm dish, was transiently transfected using Lipofectamine
2000 (Invitrogen). Total RNA from transfected cells was har-
vested after 48 h. For ASO transfections, 2 � 106 cells were
first plated in 6 cm dishes, and then transfections were
performed using an ASO : Lipofectamine 2000 ratio of
20 pmoles : 1 ml. For Annexin V assays and RT-PCR exper-
iments in glioblastoma cells, total RNA and protein from
transfected cells were harvested after 36 h.
5.2. Oligonucleotide synthesis20-O-methoxyethyl-modified oligonucleotides with a phos-
phorothioate backbone were synthesized on an Applied
Biosystems 380B automated DNA synthesizer (Applied Bio-
systems, Foster City, CA) and purified as described [32].
The oligonucleotides were dissolved in water. The sequence
of the control ASO is 50-TCATTTGCTTCATACAGG-30.
5.3. RNA interferenceFour siRNAs targeting exon 10 of human PKM2 were
obtained from Sigma Genosys, and have the sense-strand
sequences 50-CCAUAAUCGUCCGCACCAA-30 (M2si1), 50-
CAUCUACCACUUGCAAUUA-30 (M2si2), 50-CCGUGGA
GGCCUCCUUCAA-30 (M2si3) and 50CUUGCAAUUAUUU
GAGGAA-30 (M2si4). 4 � 106 A172 cells in six-well plates
were transfected with 400 pmol of siRNA duplex using
Lipofectamine 2000. Cells were harvested 48 h later.
5.4. Retrovirus transductionTo generate cell lines that overexpress human PK-M1 isoform
in a doxycyline-dependent manner, A172 cells were first
infected with MSCV-rtTA-hygro virus, and selected in hygro-
mycin for two weeks. Human PK-M1 cDNA was amplified
from A172 cells transfected with 10M46 – 60 ASO using the fol-
lowing primer pair: hPKT7cDNAF (50-GGGGAACTCGA
GATGGCTTCTAGGATGGCATCGATGACAGGTGGCCAAC
AGATGGGCATGTCGAAGCCCCATAGTGAAGCCG-30) and
rsob.royalsocietypublishing.orgOpen
9
on January 17, 2013rsob.royalsocietypublishing.orgDownloaded from
hPKT7cDNAR (50-GGGGAAGAATTCTCACGGCACAGGAA
CAACACGCATG-30), with Phusion high-fidelity DNA poly-
merase (Finnzymes). The resulting amplicon containing the
T7 tag was gel-purified and cloned between the EcoRI and
XhoI sites of the retroviral TtiGP plasmid. A172-rTA cells
were then infected with TtiGP-PKM1 virus. To make cell
lines constitutively overexpressing human PK-M2, PK-M2
cDNA from A172 cells was amplified using the same primers
and cloned between the EcoRI and XhoI sites of the retroviral
PIG plasmid. A172 and U87-MG cells were then infected
with the PIG-PKM2 virus. All infected cells were then selected
with 100 mg ml21 puromycin for 3 days. All plasmids were
sequenced to confirm their identities.
Biol2:120133
5.5. ImmunoblottingCells were lysed in SDS, and total protein concentration was
measured by the Bradford assay. 5–30 mg of total protein was
separated by SDS–PAGE and transferred onto nitrocellulose,
followed by blocking with 5 per cent (w/v) milk in Tris-
buffered saline with Tween-20, probing with the indicated
antibodies, and visualization by enhanced chemilumines-
cence (Roche). Primary antibodies were: b-actin (Genscript,
mAb, 1 : 10 000); PK-M2 (Cell Signaling Technology, rAb,
1 : 2000); PARP (Cell Signaling Technology, rAb, 1 : 1000);
T7 (mAb, 1 : 1000) and PK-M1 (ProteinTech, rAb, 1 : 1000).
Secondary antibodies were goat anti-mouse or anti-rabbit
HRP conjugates, 1 : 20 000 (Bio-Rad).
5.6. Minigene constructionDNA oligonucleotides were obtained from Sigma Genosys. The
PK-M2 minigene was constructed by amplifying a 6.4 kb PK-Mexon 8–11 fragment from human genomic DNA (Promega)
using Phusion high-fidelity DNA polymerase and
primers PKMinigeneF (50-GGGGAAAGATCTGCCACCATGG
GAGAAACAGCCAAAGGGGAC-30) and PKMinigeneR
(50-GGGGAACTCGAGCTAGACATTCATGGCAAAGTTCAC
C-30). The product was then digested and cloned between the
BamHI and XhoI sites of pcDNA3.1þ (Invitrogen). For exon-
duplication and intron-deletion constructs, the upstream
KpnI site 1552 nt downstream of exon 8 was removed by a
1 nt deletion, and an EcoRV restriction site was generated
90 nt upstream of exon 9 by a 2 nt insertion to create a modi-
fied wild-type minigene. To generate the 10W, 10B7 and
1010F7 constructs, modified exon 9 fragments were generated
by annealing the following oligonucleotides: 10W F (50-CC
CTAAACCTTACAGATAGCTCGTGAGGCTGAGGCAGCCA
TGTTCCACCGCAAGCTGTTTGAGGAACTCCGCCGAGCC
TCAAGTCACTCCACAGACCTCATGGAAGCCAT-30), 10F7F
(50-CCCTAAACCTTACAGATAGCTCGTGAGGCTGAGGCA
GCCATGTTCCACCGCAAGCTGTTTGAGGAACTTGTGCG
AGCCTCAAGTCACTCCACAGACCTCATGGAAGCCAT-30),
10B7F (50-CCCTAAACCTTACAGATAGCTCGTGAGGCTGA
GGCAGCCATGTTCCACCGCAAGCTGTTTGAAGAACTCC
GCCGAGCCTCAAGTCACTCCACAGACCTCATGGAAGCC
AT-30), with Exon 9Rev oligo (50-CCCTTAGGGCCCTACCTG
CCAGACTCCGTCAGAACTATCAAAGCTGCTGCTAAACA
CTTATAAGAAGCCTCCACGCTGCCCATGGCCATGGCTTC
CATGAGGTCTG -30), and amplifying using Ex10ADupF
(50-TTCCCCATTCTGTCTTCCCATGTGTTGTGTCTCGTTTTTT
TCCTCCTCCTTCCCTCTTCCTTGCCCCCTCTTCCCCTAAAC
CTTACAG-30) and Ex10ADupR (50-AGTGTTACCTGCCCTT
AGGGCC CTAC-30). The 106 nt oligonucleotide carries
mutations that duplicate specific stretches of exon 10 over
the corresponding region of exon 9. Another fragment was
amplified from the wild-type minigene using the following
primer pairs: Ex10BF 50-GTAGGGCCCTAAGGGCAGGTAA
CAC-30 and RKpnI (50-GGGGAAGGTACCACTGAGCAGG
GCATT-30). Both fragments were then gel-purified, and sub-
jected to a second overlap-extension (OE) PCR using the end
primers FEcoRV (50-GGGGAAGATATCAATTCCCCATTCT
GTCTTCCCATGT-30) and RKpnI (50-GGGGAGGTACCACT
GAGCAGGGCATT-30).
To generate the d10W minigene construct, a modified
exon 10 fragment was constructed by annealing d10W F
(50-ATGTTGCTCCCCTAGATTGCCCGTGAGGCAGAGGCT
GCCATCTACCACTTGCAATTATTTGAAGAACTTGTGCGC
CTGGCGCCCATTACCAGCGACCCCACAGAAGCCAC-30)
with Exon 10 Rev (50-CGCTGCCGCCTCCTACCTGCCA
GACTTGGTGAGGACGATTATGGCCCCACTGCAGCACTT
GAAGGAGGCCTCCACGGCACCCACGGCGGTGGCTTCT
GTGGGGTCGCT-3) and amplifying using Ex9ADupF (50-TG
GACGGATGTTGCTCCCCTAG-30) and Ex9ADupR (50-GGT
ACCACTGAGCAGGGCATTCCAGGGAGCCGCTGCCGCC
TCCTAC-30). The 108 nt oligonucleotide carries mutations
that duplicate specific stretches of exon 9 over the correspon-
ding region in exon 10. Another fragment was amplified from
the wild-type minigene using the following primer pairs:
FEcoRV and Ex9BR (50-GTAGGGCCCTAAGGGCAGGTAAC
AC-30). Both fragments were then gel-purified and subjected
to a second OE PCR using the FEcoRV and RKpnI primers.
To generate the dInt9 mutant, two fragments were
generated from the wild-type minigene construct, using the
following primer pairs: FEcoRV and PKMdelB12R (50-TGC
CCTGCCATGACCTCCCAGACGAGAAGAGGCTCTGTGCC
CAG-30) and PKMdelB125 (50-ACAGAGCCTCTTCT CGTCT
GGGAGGTCATGGCAGGGCAG-30). To generate the dM
double mutant, the same two fragments were generated
from the d10W minigene. Both fragments were then gel-
purified and subjected to a second OE PCR using FEcoRV
and RKpnI. All generated fragments were then cloned bet-
ween the EcoRV and KpnI sites of the modified wild-type
minigene plasmid.
5.7. RT-PCRTotal RNA (2 mg) was extracted from cell lines using
Trizol (Invitrogen). Contaminating DNA was removed with
DNAase I (Promega). Reverse transcription was carried out
using ImPromp-II reverse transcriptase (Promega). Semi-
quantitative PCR using Amplitaq polymerase (Applied
Biosystems) was performed by including [a-32P]-dCTP in the
reactions. The human-specific primer sets used to amplify
endogenous transcripts anneal to PK-M exons 8 and 11, and
their sequences are: hPKMF, 50-AGAAACAGCCAAAGGG
GACT-30; hPKMR, 50-CATTCATGGCAAAGTTCACC-30. To
amplify minigene-specific transcripts, the forward primer was
replaced with a primer annealing to the pcDNA3.1(þ) vector,
pcDNAF (50-TAATACGACTCACTATAGGG-30). After 28
amplification cycles for minigene-derived transcripts, and 27
cycles for endogenous transcripts, the reactions were divided
into two aliquots for digestion with PstI (New England Biolabs)
or no digestion. The products were analysed on a 5 per cent
native polyacrylamide gel, visualized by autoradiography
rsob.royalsocietypublishing.orgOpen
Biol2:120133
10
on January 17, 2013rsob.royalsocietypublishing.orgDownloaded from
and quantified on a Typhoon 9410 phosphorimager (GE
Healthcare) using MULTI GAUGE software v. 2.3. The percentage
M1 mRNA in endogenous transcripts was calculated using the
GC-content-normalized intensities of the top undigested band
(M1, A), the bottom two digested bands (M2, B1 B2) in the
PstI-digest lanes and the double-skipped species (D), if detect-
able. The percentage M1 mRNA from minigene transcripts
was calculated using the GC-content-normalized intensities of
the top undigested band (a, M1) and other higher-mobility
digested bands corresponding to M2 and its variant species
(b–g, as described above) in the PstI-digest lanes. All the PCR
products were gel-purified, cloned and sequenced to verify
their identities.
5.8. Annexin V AssaysFor Annexin V/7-AAD assays, cells were stained with Annexin
V-APC and 7-AAD, and analysed for apoptosis by flow cyto-
metry using an LSRII Cell Analyzer (Becton–Dickinson).
Briefly, 106 cells were collected 36 h after transfection,
washed twice with phosphate-buffered saline (PBS), resus-
pended in 1 � Binding Buffer (10 mM HEPES, pH 7.4,
140 mM NaCl, 2.5 mM CaCl2) and incubated with 5 ml each
of Annexin V-APC antibody and 7-AAD (Becton–Dickinson)
in the dark for 15 min. Both early-apoptotic (7AAD-/Annexin
Vþ) and late-apoptotic (7AADþ/Annexin Vþ) cells were
included in the quantification.
5.9. ImmunofluorescenceCells were first transfected with ASOs as above, and then plated
onto four-well culture slides (BD Biosciences) 24 h post-trans-
fection. At 36 h post-transfection, cells were washed with PBS
and fixed with 3.7 per cent formaldehyde in PBS for 20 min.
Cells were then permeabilized in 0.1 per cent Triton X-100 in
PBS for 10 min after washing in PBS, blocked for 20 min in
blocking buffer (1% goat serum in PBS) and then incubated
overnight with rabbit monoclonal anti-PKM2 antibody (Cell
Signaling Technology). After washing three times with PBS,
the cells were then incubated for 1 h in blocking buffer contain-
ing Alexa Fluor 594 conjugated goat anti-rabbit secondary
antibody (Molecular Probes/Invitrogen). Cells were washed
with PBS, and then culture slides were disassembled and
mounted with Prolong Gold mounting solution containing
DAPI (Molecular Probes/Invitrogen). Cells were analysed
using a Zeiss Axioplan1 upright fluorescent microscope.
6. AcknowledgementsWe thank members of the Krainer laboratory, in particular
Yimin Hua and Kentaro Sahashi, for helpful discussions.
A.R.K. was supported by NCI grant no. CA13106 and by
the St Giles Foundation. Z.W. is supported by a National
Science Scholarship from the Agency for Science, Technology
and Research, Singapore.
References
1. Vander Heiden M, Cantley L, Thompson CB. 2009Understanding the Warburg effect: the metabolicrequirements of cell proliferation. Science 324,1029 – 1033. (doi:10.1126/science.1160809)
2. Christofk H et al. 2008 The M2 splice isoform ofpyruvate kinase is important for cancer metabolismand tumour growth. Nature 452, 230 – 233.(doi:10.1038/nature06734)
3. Noguchi T, Inoue H, Tanaka T. 1986 The M1- andM2-type isozymes of rat pyruvate kinase areproduced from the same gene byalternative RNA splicing. J. Biol. Chem. 261,13 807 – 13 812.
4. Dombrauckas JD, Santarsiero BD, Mesecar AD. 2005Structural basis for tumor pyruvate kinase M2allosteric regulation and catalysis. Biochemistry 44,9417 – 9429. (doi:10.1021/bi0474923)
5. Christofk H, Vander Heiden M, Wu N, Asara J,Cantley L. 2008 Pyruvate kinase M2 is aphosphotyrosine-binding protein. Nature 452,181 – 186. (doi:10.1038/nature06667)
6. Clower CV, Chatterjee D, Wang Z, Cantley LC,Vander Heiden MG, Krainer AR. 2010 Thealternative splicing repressors hnRNP A1/A2and PTB influence pyruvate kinase isoformexpression and cell metabolism. Proc. Natl Acad.Sci. USA 107, 1894 – 1899. (doi:10.1073/pnas.0914845107)
7. Sun Q et al. 2011 Mammalian target of rapamycinup-regulation of pyruvate kinase isoenzyme typeM2 is critical for aerobic glycolysis and tumor
growth. Proc. Natl Acad. Sci. USA 108, 4129 – 4134.(doi:10.1073/pnas.1014769108)
8. Anastasiou D et al. 2011 Inhibition of pyruvatekinase M2 by reactive oxygen species contributes toantioxidant responses. Science 334, 1278 – 1283.(doi:10.1126/science.1211485)
9. Hitosugi T et al. 2009 Tyrosine phosphorylationinhibits PKM2 to promote the Warburg effect andtumor growth. Sci. Signal 2, ra73. (doi:10.1126/scisignal.2000431)
10. Lv L et al. 2011 Acetylation targets the M2 isoformof pyruvate kinase for degradation throughchaperone-mediated autophagy and promotestumor growth. Mol. Cell 42, 719 – 730. (doi:10.1016/j.molcel.2011.04.025)
11. Luo W, Hu H, Chang R, Zhong J, Knabel M, O’MeallyR, Cole RN, Pandey A, Semenza GL. 2011 Pyruvatekinase M2 is a PHD3-stimulated coactivator forhypoxia-inducible factor 1. Cell 145, 732 – 744.(doi:10.1016/j.cell.2011.03.054)
12. Yang W, Xia Y, Ji H, Zheng Y, Liang J, Huang W, GaoX, Aldape K, Lu Z. 2011 Nuclear PKM2 regulatesbeta-catenin transactivation upon EGFR activation.Nature 480, 118 – 122. (doi:10.1038/nature10598)
13. David CJ, Chen M, Assanah M, Canoll P, Manley JL.2010 HnRNP proteins controlled by c-Mycderegulate pyruvate kinase mRNA splicing in cancer.Nature 463, 364 – 368. (doi:10.1038/nature08697)
14. Wang Z, Chatterjee D, Jeon HY, Akerman M, VanderHeiden MG, Cantley LC, Krainer AR. 2012 Exon-centric regulation of pyruvate kinase M alternative
splicing via mutually exclusive exons. J. Mol. Cell.Biol. 4, 79 – 87. (doi:10.1093/jmcb/mjr030)
15. Crooke S. 2001 Basic principles of antisensetechnology. In Antisense drug technology: principles,strategies, and applications (ed. S Crooke),pp. 1 – 28. New York, NY: Marcel Dekker.
16. Muntoni F, Wood MJ. 2011 Targeting RNA to treatneuromuscular disease. Nat. Rev. Drug Discov. 10,621 – 637. (doi:10.1038/nrd3459)
17. Opalinska JB, Gewirtz AM. 2002 Nucleic-acidtherapeutics: basic principles and recentapplications. Nat. Rev. Drug Discov. 1, 503 – 514.(doi:10.1038/nrd837)
18. Monia BP, Lesnik EA, Gonzalez C, Lima WF, McGeeD, Guinosso CJ, Kawasaki AM, Cook PD, Freier SM.1993 Evaluation of 20-modified oligonucleotidescontaining 20-deoxy gaps as antisense inhibitors ofgene expression. J. Biol. Chem. 268,14 514 – 14 522.
19. McKay RA, Miraglia LJ, Cummins LL, Owens SR,Sasmor H, Dean NM. 1999 Characterization of apotent and specific class of antisenseoligonucleotide inhibitor of human protein kinaseC-alpha expression. J. Biol. Chem. 274, 1715 – 1722.(doi:10.1074/jbc.274.3.1715)
20. Bluemlein K, Gruning NM, Feichtinger RG, LehrachH, Kofler B, Ralser M. 2011 No evidence for a shiftin pyruvate kinase PKM1 to PKM2 expression duringtumorigenesis. Oncotarget 2, 393 – 400.
21. Jelluma N, Yang X, Stokoe D, Evan GI, Dansen TB,Haas-Kogan DA. 2006 Glucose withdrawal induces

rsob.royalsocietypublishing.orgOpen
Biol2:12013
11
on January 17, 2013rsob.royalsocietypublishing.orgDownloaded from
oxidative stress followed by apoptosis inglioblastoma cells but not in normal humanastrocytes. Mol. Cancer Res. 4, 319 – 330. (doi:10.1158/1541-7786.MCR-05-0061)
22. Michelakis ED et al. 2010 Metabolic modulationof glioblastoma with dichloroacetate. Sci.Transl. Med. 2, 31ra34. (doi:10.1126/scitranslmed.3000677)
23. Bonnet S et al. 2007 A mitochondria-Kþ channel axis issuppressed in cancer and its normalization promotesapoptosis and inhibits cancer growth. Cancer Cell 11,37 – 51. (doi:10.1016/j.ccr.2006.10.020)
24. Sendoel A, Kohler I, Fellmann C, Lowe SW,Hengartner MO. 2010 HIF-1 antagonizes p53-mediated apoptosis through a secreted neuronaltyrosinase. Nature 465, 577 – 583. (doi:10.1038/nature09141)
25. Hua Y, Vickers TA, Baker BF, Bennett CF, Krainer AR.2007 Enhancement of SMN2 exon 7 inclusionby antisense oligonucleotides targeting the exon. PLoSBiol. 5, e73. (doi:10.1371/journal.pbio.0050073)
26. Goldberg MS, Sharp PA. 2012 Pyruvate kinaseM2-specific siRNA induces apoptosis and tumorregression. J. Exp. Med. 209, 217 – 224. (doi:10.1084/jem.20111487)
27. Dean N et al. 1996 Inhibition of growth of humantumor cell lines in nude mice by an antisense ofoligonucleotide inhibitor of protein kinase C-alphaexpression. Cancer Res. 56, 3499 – 3507.
28. Hua Y, Sahashi K, Hung G, Rigo F, Passini MA,Bennett CF, Krainer AR. 2010 Antisense correction ofSMN2 splicing in the CNS rescues necrosis in a typeIII SMA mouse model. Genes Dev. 24, 1634 – 1644.(doi:10.1101/gad.1941310)
29. Smith RA et al. 2006 Antisense oligonucleotidetherapy for neurodegenerative disease. J. Clin.Invest. 116, 2290 – 2296. (doi:10.1172/JCI25424)
30. Passini MA et al. 2011 Antisense oligonucleotidesdelivered to the mouse CNS amelioratesymptoms of severe spinal muscular atrophy. Sci.Transl. Med. 3, 72ra18. (doi:10.1126/scitranslmed.3001777)
31. Kordasiewicz HB et al. 2012 Sustained therapeuticreversal of Huntington’s disease by transientrepression of huntingtin synthesis. Neuron 74,1031 – 1044. (doi:10.1016/j.neuron.2012.05.009)
32. Hua Y, Vickers TA, Okunola HL, Bennett CF, KrainerAR. 2008 Antisense masking of an hnRNP A1/A2intronic splicing silencer corrects SMN2 splicing intransgenic mice. Am. J. Hum. Genet. 82, 834 – 848.(doi:10.1016/j.ajhg.2008.01.014)
3


![مسند أحمد بن حنبل [ جزء 6 - صفحة 360 ] · Web view( حديث ضباعة بنت الزبير رضي الله عنها ) 27075 - حدثنا عبد الله حدثني](https://static.fdocuments.net/doc/165x107/5b34e55e7f8b9aec518cab7b/-6-360-web-view-.jpg)


