
Manhattan Market Snapshot - May 2016
3
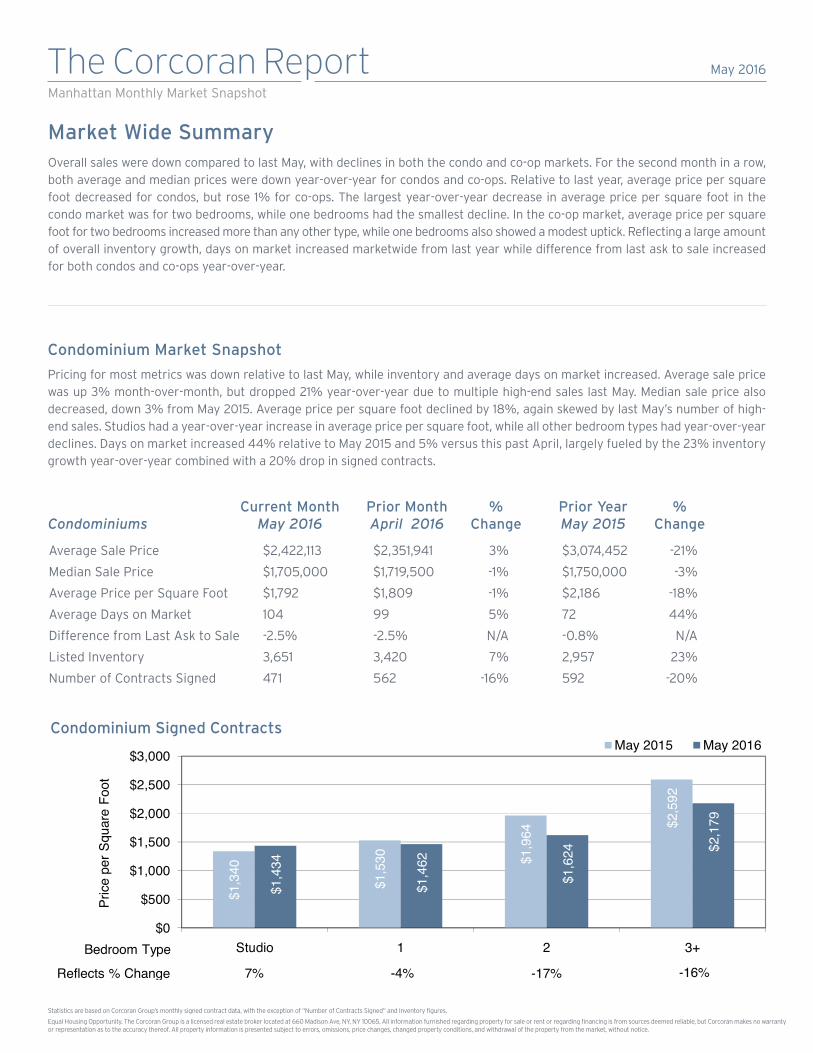
Condominium Market Snapshot Pricing for most metrics was down relative to last May, while inventory and average days on market increased. Average sale price was up 3% month-over-month, but dropped 21% year-over-year due to multiple high-end sales last May. Median sale price also decreased, down 3% from May 2015. Average price per square foot declined by 18%, again skewed by last May’s number of high- end sales. Studios had a year-over-year increase in average price per square foot, while all other bedroom types had year-over-year declines. Days on market increased 44% relative to May 2015 and 5% versus this past April, largely fueled by the 23% inventory growth year-over-year combined with a 20% drop in signed contracts. Current Month Prior Month % Prior Year % Condominiums May 2016 April 2016 Change May 2015 Change Average Sale Price $2,422,113 $2,351,941 3% $3,074,452 -21% Median Sale Price $1,705,000 $1,719,500 -1% $1,750,000 -3% Average Price per Square Foot $1,792 $1,809 -1% $2,186 -18% Average Days on Market 104 99 5% 72 44% Difference from Last Ask to Sale -2.5% -2.5% N/A -0.8% N/A Listed Inventory 3,651 3,420 7% 2,957 23% Number of Contracts Signed 471 562 -16% 592 -20% May 2016 The Corcoran Report Manhattan Monthly Market Snapshot Market Wide Summary Overall sales were down compared to last May, with declines in both the condo and co-op markets. For the second month in a row, both average and median prices were down year-over-year for condos and co-ops. Relative to last year, average price per square foot decreased for condos, but rose 1% for co-ops. The largest year-over-year decrease in average price per square foot in the condo market was for two bedrooms, while one bedrooms had the smallest decline. In the co-op market, average price per square foot for two bedrooms increased more than any other type, while one bedrooms also showed a modest uptick. Reflecting a large amount of overall inventory growth, days on market increased marketwide from last year while difference from last ask to sale increased for both condos and co-ops year-over-year. Condominium Signed Contracts Statistics are based on Corcoran Group’s monthly signed contract data, with the exception of “Number of Contracts Signed” and Inventory figures. Equal Housing Opportunity. The Corcoran Group is a licensed real estate broker located at 660 Madison Ave, NY, NY 10065. All information furnished regarding property for sale or rent or regarding financing is from sources deemed reliable, but Corcoran makes no warranty or representation as to the accuracy thereof. All property information is presented subject to errors, omissions, price changes, changed property conditions, and withdrawal of the property from the market, without notice. $1,340 $1,530 $1,964 $2,592 $1,434 $1,462 $1,624 $2,179 $0 $500 $1,000 $1,500 $2,000 $2,500 $3,000 + 3 2 1 o i d u t S Price per Square Foot Bedroom Type May 2015 May 2016 7% -4% -17% -16% Reflects % Change
-
Upload
charles-zivancev -
Category
Real Estate
-
view
76 -
download
0
Transcript of Manhattan Market Snapshot - May 2016
Condominium Market Snapshot
Pricing for most metrics was down relative to last May, while inventory and average days on market increased. Average sale price was up 3% month-over-month, but dropped 21% year-over-year due to multiple high-end sales last May. Median sale price also decreased, down 3% from May 2015. Average price per square foot declined by 18%, again skewed by last May’s number of high-end sales. Studios had a year-over-year increase in average price per square foot, while all other bedroom types had year-over-year declines. Days on market increased 44% relative to May 2015 and 5% versus this past April, largely fueled by the 23% inventorygrowth year-over-year combined with a 20% drop in signed contracts.
Current Month Prior Month % Prior Year %Condominiums May 2016 April 2016 Change May 2015 Change
Average Sale Price $2,422,113 $2,351,941 3% $3,074,452 -21%
Median Sale Price $1,705,000 $1,719,500 -1% $1,750,000 -3%
Average Price per Square Foot $1,792 $1,809 -1% $2,186 -18%
Average Days on Market 104 99 5% 72 44%
Difference from Last Ask to Sale -2.5% -2.5% N/A -0.8% N/A
Listed Inventory 3,651 3,420 7% 2,957 23%
Number of Contracts Signed 471 562 -16% 592 -20%
May 2016The Corcoran ReportManhattan Monthly Market Snapshot
Market Wide SummaryOverall sales were down compared to last May, with declines in both the condo and co-op markets. For the second month in a row, both average and median prices were down year-over-year for condos and co-ops. Relative to last year, average price per square foot decreased for condos, but rose 1% for co-ops. The largest year-over-year decrease in average price per square foot in the condo market was for two bedrooms, while one bedrooms had the smallest decline. In the co-op market, average price per square foot for two bedrooms increased more than any other type, while one bedrooms also showed a modest uptick. Reflecting a large amount of overall inventory growth, days on market increased marketwide from last year while difference from last ask to sale increased for both condos and co-ops year-over-year.
Condominium Signed Contracts
Statistics are based on Corcoran Group’s monthly signed contract data, with the exception of “Number of Contracts Signed” and Inventory figures.
Equal Housing Opportunity. The Corcoran Group is a licensed real estate broker located at 660 Madison Ave, NY, NY 10065. All information furnished regarding property for sale or rent or regarding financing is from sources deemed reliable, but Corcoran makes no warranty or representation as to the accuracy thereof. All property information is presented subject to errors, omissions, price changes, changed property conditions, and withdrawal of the property from the market, without notice.
$1,3
40
$1,5
30 $1,9
64
$2,5
92
$1,4
34
$1,4
62
$1,6
24 $2,1
79
$0
$500
$1,000
$1,500
$2,000
$2,500
$3,000
+321oidutS
Pric
e pe
r Squ
are
Foot
Bedroom Type
May 2015 May 2016
$863 $9
55 $1,1
29
$1,5
07
$1,0
39
$976 $1
,219 $1
,464
$0
$200
$400
$600
$800
$1,000
$1,200
$1,400
$1,600
+321oidutS
Pric
e pe
r Squ
are
Foot
Bedroom Type
May 2015 May 2016
7% -4% -17% -16%Reflects % Change
20% 2% 8% -3%Reflects % Change
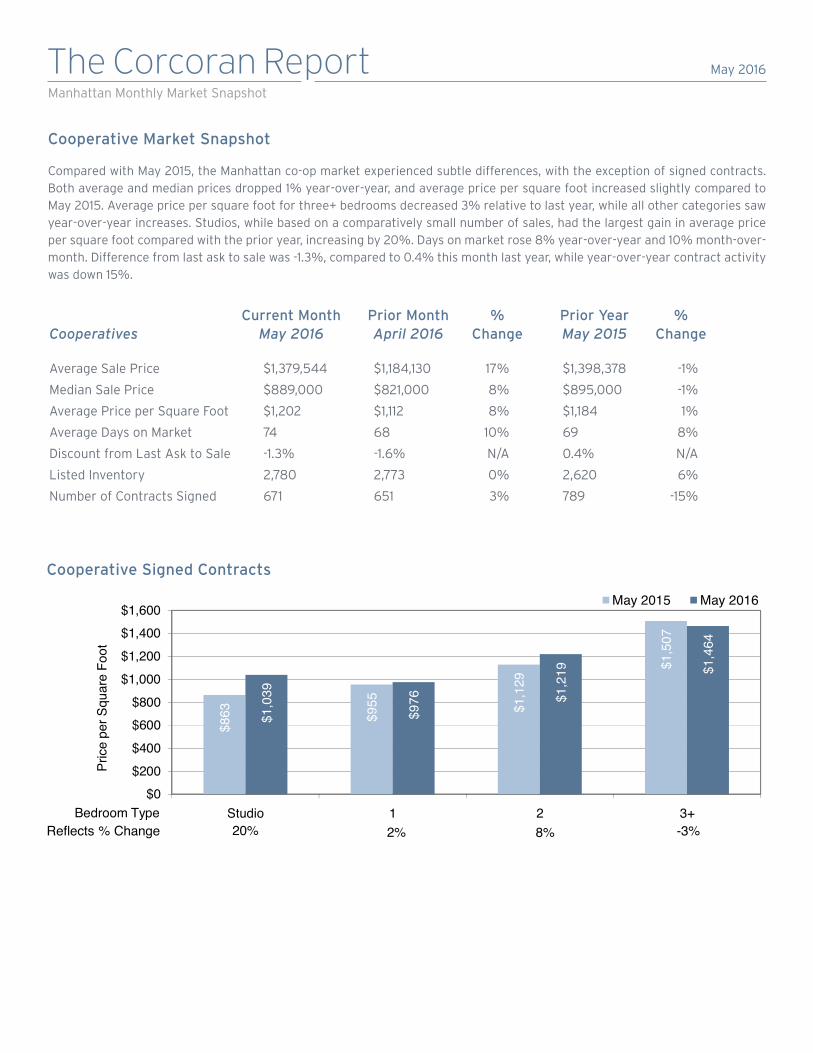
Cooperative Market Snapshot
Compared with May 2015, the Manhattan co-op market experienced subtle differences, with the exception of signed contracts. Both average and median prices dropped 1% year-over-year, and average price per square foot increased slightly compared to May 2015. Average price per square foot for three+ bedrooms decreased 3% relative to last year, while all other categories saw year-over-year increases. Studios, while based on a comparatively small number of sales, had the largest gain in average price per square foot compared with the prior year, increasing by 20%. Days on market rose 8% year-over-year and 10% month-over-month. Difference from last ask to sale was -1.3%, compared to 0.4% this month last year, while year-over-year contract activity was down 15%.
Current Month Prior Month % Prior Year %Cooperatives May 2016 April 2016 Change May 2015 Change
Average Sale Price $1,379,544 $1,184,130 17% $1,398,378 -1%
Median Sale Price $889,000 $821,000 8% $895,000 -1%
Average Price per Square Foot $1,202 $1,112 8% $1,184 1%
Average Days on Market 74 68 10% 69 8%
Discount from Last Ask to Sale -1.3% -1.6% N/A 0.4% N/A
Listed Inventory 2,780 2,773 0% 2,620 6%
Number of Contracts Signed 671 651 3% 789 -15%
May 2016The Corcoran ReportManhattan Monthly Market Snapshot
Cooperative Signed Contracts
$1,3
40
$1,5
30 $1,9
64
$2,5
92
$1,4
34
$1,4
62
$1,6
24 $2,1
79
$0
$500
$1,000
$1,500
$2,000
$2,500
$3,000
+321oidutS
Pric
e pe
r Squ
are
Foot
Bedroom Type
May 2015 May 2016
$863 $9
55 $1,1
29
$1,5
07
$1,0
39
$976 $1
,219 $1
,464
$0
$200
$400
$600
$800
$1,000
$1,200
$1,400
$1,600
+321oidutS
Pric
e pe
r Squ
are
Foot
Bedroom Type
May 2015 May 2016
7% -4% -17% -16%Reflects % Change
20% 2% 8% -3%Reflects % Change
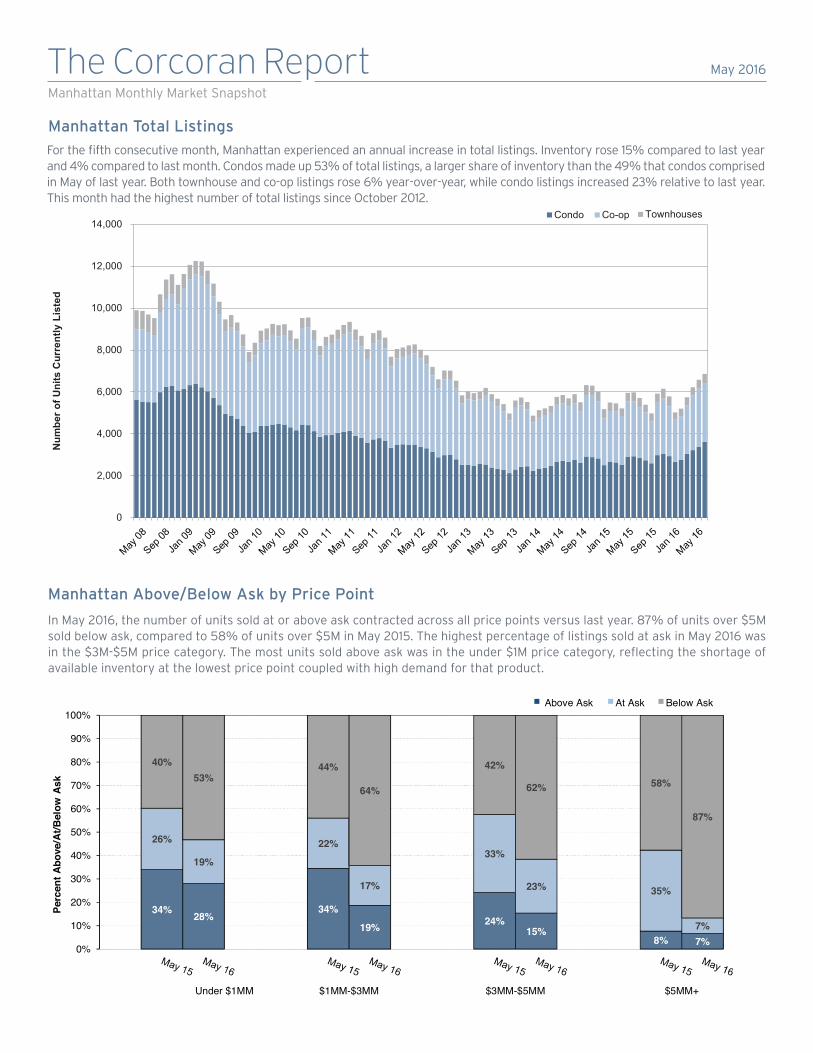
Manhattan Total Listings
For the fifth consecutive month, Manhattan experienced an annual increase in total listings. Inventory rose 15% compared to last year and 4% compared to last month. Condos made up 53% of total listings, a larger share of inventory than the 49% that condos comprised in May of last year. Both townhouse and co-op listings rose 6% year-over-year, while condo listings increased 23% relative to last year. This month had the highest number of total listings since October 2012.
May 2016The Corcoran ReportManhattan Monthly Market Snapshot
Manhattan Above/Below Ask by Price Point
In May 2016, the number of units sold at or above ask contracted across all price points versus last year. 87% of units over $5M sold below ask, compared to 58% of units over $5M in May 2015. The highest percentage of listings sold at ask in May 2016 was in the $3M-$5M price category. The most units sold above ask was in the under $1M price category, reflecting the shortage of available inventory at the lowest price point coupled with high demand for that product.
34% 28%34%
19% 24%15%
8% 7%
26%
19%
22%
17%
33%
23% 35%
7%
40%53%
44%
64%
42%
62% 58%
87%
0%
10%
20%
30%
40%
50%
60%
70%
80%
90%
100%
+MM5$MM5$-MM3$MM3$-MM1$MM1$ rednU
Perc
ent A
bove
/At/B
elow
Ask
Above Ask At Ask Below Ask
0
2,000
4,000
6,000
8,000
10,000
12,000
14,000
Num
ber o
f Uni
ts C
urre
ntly
Lis
ted
Condo Co-op Townhouses
Num
ber o
f New
Lis
tings
0%
2%
4%
6%
8%
10%
12%
14%
16%
18%
20%
0
500
1,000
1,500
2,000
2,500
3,000
Num
ber o
f New
Lis
tings
Manhattan New Listings by Price Category
$0-$1MM $1MM-$3MM $3MM-$5MM $5MM+ % $5MM+
0%
2%
4%
6%
8%
10%
12%
14%
16%
18%
20%
0
500
1,000
1,500
2,000
2,500
3,000$0-$1MM $1MM-$3MM $3MM-$5MM $5MM+ % $5MM+