Mangroves Monitoring and Evaluation Manual for Jamaica ...
75
Mangroves Monitoring and Evaluation Manual for Jamaica (2019) i Public Disclosure Authorized Public Disclosure Authorized Public Disclosure Authorized Public Disclosure Authorized
Transcript of Mangroves Monitoring and Evaluation Manual for Jamaica ...

Mangroves Monitoring and Evaluation Manual for Jamaica (2019)
i
Pub
lic D
iscl
osur
e A
utho
rized
Pub
lic D
iscl
osur
e A
utho
rized
Pub
lic D
iscl
osur
e A
utho
rized
Pub
lic D
iscl
osur
e A
utho
rized

Mangroves Monitoring and Evaluation Manual for Jamaica (2019)
ii
Acknowledgements
The “Mangroves Monitoring and Evaluation Manual for Jamaica”, produced as part of the PROFOR funded
“Assessment and Economic Valuation of Coastal Protection Services Provided by Mangroves in Jamaica”, is
the result of World Bank technical work started in 2017 at the request of the Government of Jamaica
through the National Environment and Planning Agency (NEPA), and the Office of Disaster Preparedness
and Emergency Management (ODPEM). Numerous entities and professionals interested in the subject
participated and an important group of collaborators made possible the materialization of this
assessment. The team especially wishes to thank the guidance and leadership of Tahseen Sayed
(Caribbean Country Director, LCC3C), Tahseen Sayed (Country Director, LCC3C), Sameh Naguib Wahba
Tadros (Director, GSURB), Ming Zhang (Practice Manager GSU10), and Saurabh Dani (Task Team Leader,
GSU10).
Leading Authors and Editors
The “Mangroves Monitoring and Evaluation Manual for Jamaica”, was prepared by a group of specialists in
disaster risk management and natural resources led by Saurabh Dani (Task Team Leader, GSURR), and
Juliana Castaño-Isaza (Senior Consultant in Disaster Risk & Natural Resources Management, GSURR).
Simone Lee (Local PROFOR Coordinator, GSU10) coordinated this effort at the local level, and Dr. Peter
Edwards (Economist Consultant, GSU10) provided technical inputs to this manual.
The complete methodologies, data collection and analytics were led by a team of specialists from the
University of the West Indies MONA campus in Kingston Jamaica, comprised by: Dr. Arpita Mandal, Dr.
Rose-Ann Smith, Dr. Taneisha Edwards, Dr. Robert Kinlocke, Dr. Simon Mitchell from the Department of
Geography and Geology; Camilo Trench, Dr. Mona Webber, Patrice Francis, from the Centre for Marine
Science; and Dr. Adrian Spence from the International Centre for Environmental and Nuclear Sciences.
Invaluable support and leadership was provided during the development of this Manual by Andrea
Donaldson, Anthony McKenzie, Carroll Ainsworth, and Monique Curtis from the National Environment and
Planning Agency (NEPA); and Michele Edwards and Anna-Kay Spaulding from the Office of Disaster
Preparedness and Emergency Management (ODPEM).
Front page design by PuntoAparte.
Mangroves Monitoring and Evaluation Manual for Jamaica (2019)
iii
Contents
List of Figures .............................................................................................................................................................................................................. v
List of Tables .............................................................................................................................................................................................................. vi
Glossary ............................................................................................................................................................................................................................. vii
Acronyms............................................................................................................................................................................................................................ x
Purpose of Document ................................................................................................................................................................................................... 1
Introduction ...................................................................................................................................................................................................................... 1
Habitat status of mangroves in Jamaica ......................................................................................................................................................... 2
Importance of mangroves ..................................................................................................................................................................................... 4
Site Selection............................................................................................................................................................................................................... 5
Component 1: Socio-Economic Monitoring ........................................................................................................................................................ 6
Theoretical Framework ........................................................................................................................................................................................... 6
Methods of Data Collection.................................................................................................................................................................................. 7
Step 1: Conduct Field Reconnaissance and Secondary Data Collection ...................................................................................... 7
Step 2: Develop Primary Data Collection Approach ............................................................................................................................. 8
Step 3: Conduct Field Training and Data Collection ............................................................................................................................. 9
Step 4: Monitor Data Quality Standards ................................................................................................................................................. 10
Analyses of Socio-economic Data .................................................................................................................................................................. 11
Component 2: Ecological Monitoring ................................................................................................................................................................. 14
Theoretical Background ...................................................................................................................................................................................... 14
Methods of Data Collection............................................................................................................................................................................... 15
Resources required .......................................................................................................................................................................................... 15
Mangrove species composition and relative abundance (for diversity) ................................................................................... 15
Mangrove Trunk Diameter (DBH) .............................................................................................................................................................. 16
Mangrove height and canopy width ........................................................................................................................................................ 18
Prop roots/aerial roots network ................................................................................................................................................................. 18
Ecosystem services: Fisheries production using light-traps to collect fish larvae and other water column fauna. 19
Timing and Frequency .................................................................................................................................................................................... 21
Data management ........................................................................................................................................................................................... 21
Analyses ..................................................................................................................................................................................................................... 21
Mangrove species composition, relative abundance and diversity ............................................................................................ 21
Mangrove trunk diameter (DBH) ............................................................................................................................................................... 22
Mangrove height and canopy width ........................................................................................................................................................ 22
Prop roots/aerial roots network ................................................................................................................................................................. 22
Mangroves Monitoring and Evaluation Manual for Jamaica (2019)
iv
Component 3: Physical Monitoring ..................................................................................................................................................................... 23
Theoretical Background ...................................................................................................................................................................................... 23
Methods of Data Collection............................................................................................................................................................................... 23
Flooding and Coastal Erosion ..................................................................................................................................................................... 23
Sediment Sampling and Assessment ....................................................................................................................................................... 24
Surface Accretion.............................................................................................................................................................................................. 24
Wind Data ............................................................................................................................................................................................................ 27
Water Level and Pressure .............................................................................................................................................................................. 28
Water Quality ..................................................................................................................................................................................................... 30
Bathymetry and shoreline dynamics ........................................................................................................................................................ 31
Soil health ............................................................................................................................................................................................................ 32
Soil-atmospheric carbon flux ...................................................................................................................................................................... 32
Soil carbon biogeochemistry ....................................................................................................................................................................... 33
Analyses ..................................................................................................................................................................................................................... 33
Flooding and Coastal Erosion ..................................................................................................................................................................... 33
Sediment Sampling and Assessment ....................................................................................................................................................... 36
Surface Accretion and Soil Surface Elevation ....................................................................................................................................... 36
Wind Data and Wave Parameters ............................................................................................................................................................. 37
Water Quality and Soil Health .................................................................................................................................................................... 38
Bathymetry and shoreline dynamics ........................................................................................................................................................ 39
Further Monitoring Evaluation ............................................................................................................................................................................... 39
Improvements to Methodology ...................................................................................................................................................................... 39
What to do with the information .................................................................................................................................................................... 41
Linkages to other Economic Values ............................................................................................................................................................... 41
Economic Value of Carbon Sequestration ............................................................................................................................................. 42
Fisheries economic values ............................................................................................................................................................................ 42
Economics of shoreline stabilization .............................................................................................................................................................. 43
Water Quality ..................................................................................................................................................................................................... 44
References.......................................................................................................................................................................................................................... 2
Appendices ........................................................................................................................................................................................................................ 1
Appendix 1: Socio-economic Survey Instrument ........................................................................................................................................ 2
Appendix 2: Screenshots of Socio-economic survey using ODK ....................................................................................................... 15
Appendix 3: Vegetation assessment data sheet ....................................................................................................................................... 16
Appendix 4: Reconnaissance data sheet ...................................................................................................................................................... 17
Appendix 5: Benchmark Set Up Sheet .......................................................................................................................................................... 18

Mangroves Monitoring and Evaluation Manual for Jamaica (2019)
v
List of Figures
Figure 1: Map showing distribution of mangrove areas within protected areas of Jamaica (Modified from NEPA, 2014)
................................................................................................................................................................................................................................................ 3
Figure 2: Example of monitoring transect and plot setup (Created by Patrice Francis, 2019). ................................................... 16
Figure 3: Measuring stem diameter ..................................................................................................................................................................... 17
Figure 4: Samples of 1 X 1 m subplots representing low (left), medium (centre) and high (right) prop root (top) and
pneumataphore (bottom) densities ..................................................................................................................................................................... 19
Figure 5: Examples of light trap deployment in deep water with light on (left and centre) and in mangrove prop roots
(right) ................................................................................................................................................................................................................................ 20
Figure 6: Graph showing the number of trees at different locations. ................................................................................................... 21
Figure 7: Graph showing the mean diameter at breast height per species at different location .............................................. 22
Figure 8: Typical set up for benchmark and horizon markers (not drawn to scale). The measurements in the field will
vary according to suitable substrate for placement. Record the specifics unique to your site following the template of
Appendix 5: Benchmark Set Up Sheet. ............................................................................................................................................................... 24
Figure 9: (A-C) Installation of benchmark, with lengthening of the steel as necessary and subsequent hammering into
the substrate until no further downward movement is achieved ........................................................................................................... 25
Figure 10: Different views and setting of installed horizon marker and sediment plate (tile) for accretion or erosion
records. A: Horizon marker being laid down at Portland Cottage site 2, it is important to dust off roots so the horizon
marker is flat. B: Horizon marker at Plot 2 Freeport and adjacent tile, C: Horizon marker covered by a thin layer of
sediment, thickness of sediment is being checked with a spade and ruler. D: Horizon marker with no sediment, only
sparse leaf litter after a month at Freeport, E: Horizon marker with leaf litter at Bogue Rd, F: Horizon marker and
Sediment tiles with negligible sediment after 2 months. G: Horizon marker eroded in sections at Portland Cottage Site
1. ......................................................................................................................................................................................................................................... 26
Figure 11: Elevation measurements are being taken with a RSET removable device. A: Set up at Plot 1 Freeport, St.
James, B: Measurement at freeport plot 1, C: Measurement at Portland Cottage site 2, D: Measurement at Rodney
Street Site, E: Measurement at Bogue Road site. ........................................................................................................................................... 27
Figure 12: Idealised sketch showing the concept and location for deploying pressure sensors to determine water wave
parameters, and the spatial arrangement of researcher for collecting wind speed along a coast-perpendicular transect
using hand-held anemometers.............................................................................................................................................................................. 28
Figure 13: Photos of physical deployment and use of equipment to capture physical parameters. A: Wind anemometer
being used to collect average wind speed over a period of 120 s being held in the prevailing wind direction, B:
Deployment of pressure sensor protected by PVC fixture and horizontally mounted to a brick within mangrove roots
affected by waves, C: A more seaward location of deployed pressure sensor at the Rodney Street Site in a bed of sea-
grass, D: Field student carries a pressure sensor attached to a brick to a more seaward location for deployment. ........ 29
Figure 14: Evaluating the physical parameters of the water within mangrove systems. A: acid- washed HDPE bottles
left to dry prior to field day, B: Water is collected along a transect at each site, depending on the water level along the
transect, it may take multiple tries to fill bottles, C: YSI collected in-situ water parameters, the data and time is
recorded along with corresponding GPS coordinates, C: Sample bottles are labelled and stored according to protocol
for analysis. ..................................................................................................................................................................................................................... 30
Figure 15: Use of depth sounders along with GPS to collect bathymetry data. A: Hondex digital depth sounder devices
are shown. B: device should be emerged in water and held vertically to collect depth readings, C: two depth readings
are collected simultaneously along with GPS coordinates. ....................................................................................................................... 31
Figure 16: Equipment and process of collecting gas flux data. A: Collar deployed in substrate, B: Collar can be
deployed if the substrate is saturated, C: collar deployed and marked with flagging tape along with GPS to facilitate
Mangroves Monitoring and Evaluation Manual for Jamaica (2019)
vi
easier relocation and measurements, D and E: Survey chamber mounted to collar and allowed to collect readings for
10 minutes per collar after equilibration period of 2 h has elapsed. ..................................................................................................... 32
Figure 17: Analysis of secondary flood data in GIS, Map shows reported experience of flooding and predicted extents
of inundation from storm surges for 5 and 10 m in relation to critical infrastructure, Montego Bay ..................................... 35
Figure 18: Map of long-term lateral erosion or accretion constrained from spatial analysis of historic images of the
coastal zone. .................................................................................................................................................................................................................. 36
Figure 19: Bathymetry overlain on satellite imagery of a section of the Bay at Portland Cottage ........................................... 39
List of Tables
Table 1: Fishing activity in mangrove areas of Portland Bight and Salt Marsh ................................................................................. 11
Table 2: Shows the %age (%) of people who have experienced coastal flooding in the communities. ................................. 12
Table 3: Observed changes in Mangroves in Bogue, Portland Bight and Salt Marsh .................................................................... 12
Table 4: Shows the %age (%) of willingness amongst the people to participate in mangrove restoration. ......................... 13
Table 5: Shows the %age (%) of willingness to participate in Mangrove Restoration disaggregated by Gender for
Portland Bight. .............................................................................................................................................................................................................. 13
Table 6: The association between gender and selected variables based on the results of the Chi Squared test .............. 13
Table 7: Sample data for wind energy attenuation analyses ..................................................................................................................... 37
Table 8: Sample data for mean mangrove water parameters recorded at each site ...................................................................... 38

Mangroves Monitoring and Evaluation Manual for Jamaica (2019)
vii
Glossary
Anemometer Device used for measuring wind speed, and is also a common weather station instrument
ASTM Refers to ASTM International, or American Society for Testing and Materials, which is an
international standards organization that develops and publishes voluntary consensus
technical standards for a wide range of materials, products, systems, and services
Auger A drilling device, that usually includes a rotating helical screw blade called a "flighting" to
act as a screw conveyor to remove the drilled out material, which in this study is soil or
substrate
Bathymetry The measurement of depth of water in lakes, seas or oceans. In other words, bathymetry is
the underwater equivalent to hypsometry or topography
Benchmark A standard or point of reference against which measurements may be compared by the
installer or other; which in this study is a steel pole, fixed by cement
Buffer In GIS, a zone around a map feature measured in units of distance or time
Conductivity Rate at which an electric charge or heat passes through a material.
Depth sounder
(Echo sounder)
Device for determining water depth or detecting objects in water by measuring the time
taken for sound waves to return to the instrument from the object or benthos.
Gas flux Flow of volatile gas emissions from a specific location
Geochemistry The study of the chemical composition of the earth and its rocks and minerals
GPS Global positioning system
Horizon marker Layer of powder, dust, glitter, feldspar powder, kaolinite which is laid down on the surface
of a soil to later serve as an indicator of soil level. White lime was used in this study.
In situ “in the original place/appropriate position”
Lateral accretion Deposit Inclined layers of sediment, deposited laterally rather than in horizontal strata,
particularly by the lateral outbuilding sediment on the surface for example a river point
par or in a coastal zone
Loss on ignition Test used in inorganic analytical chemistry, particularly in the analysis of minerals. It
consists of strongly heating ("igniting") a sample of the material at a specified
temperature, allowing volatile substances to escape, until its mass ceases to change
Matlab Fourth-generation programming language and numerical analysis environment

Mangroves Monitoring and Evaluation Manual for Jamaica (2019)
viii
Oceanlyz MATLAB toolkit useful for constraining wave parameters from pressure loggers and
gauges
pH Expression of the acidity or alkalinity of a solution on a logarithmic scale on which 7 is
neutral. Lower values are more acid and higher values more alkaline. The pH is equal to
−log10 c, where c is the hydrogen ion concentration in moles per liter.
literal meaning-‘potential for hydrogen’.
Plot Area of a known size
Pneumatophores Mangrove aerial roots specialised for gaseous exchange which grow upward (protruding
from the soil/water) from the submerged primary root system.
Polyethylene Tough, light flexible synthetic resin made by polymerizing ethylene, chiefly used for plastic
bags, food containers, and other packaging
Prop roots Roots that extend from the main tree stem into the ground providing support to the tree.
In the case of mangroves these may also allow for gaseous exchange.
PVC Polyvinyl chloride, is a common, strong but lightweight plastic used in construction. It is
made softer and more flexible by the addition of plasticizers
Rset Rod Set Elevation Table
Salinity Amount of salt dissolved in a specific quantity of water.
Sapling Plant greater than 0.5m but less than 1.5 m high
Sedimentologist A person who studies modern and ancient sediments such as gravel, sand, silt, and clay,
and the processes that result in their formation (erosion and weathering), transport,
deposition and diagenesis
Seedling Young plant less than 0.5 m high
Site Area of interest or spatial location of a structure
Spatial Analysis A type of geographical analysis which seeks to explain patterns of human behavior and
its spatial expression in terms of mathematics and geometry, that is, locational analysis
Statistical inference The theory, methods, and practice of forming judgments about the parameters of a
population and the reliability of statistical relationships, typically on the basis of random
sampling
Statistics Branch of mathematics dealing with data collection, organization, analysis, interpretation
and presentation

Mangroves Monitoring and Evaluation Manual for Jamaica (2019)
ix
Substrate An underlying substance or layer; the layer from which organisms thrive; it may be soil,
peat, sand or a combination in this study
Taphonomy The branch of palaeontology that deals with the processes of fossilization and useful
evidence about the organism life and behaviour up to fossilisation
Ternary Diagram Ternary plot, ternary graph, triangle plot, simplex plot, Gibbs triangle or de Finetti diagram
is a barycentric plot on three variables which sum to a constant.
Total dissolved
solids
Measure of the dissolved combined content of all inorganic and organic substances
present in a liquid in molecular, ionized or micro-granular suspended form
Transect Line or narrow area within area site along or within which points are established for
collecting data
Tree In this study, plant greater than 1.5 m high
Vertical accretion Material that accumulates when deposits from rivers or coastal activity result in a higher
sediment level
wave attenuation Reduction in the strength of wave
YSI 566 One device that measures multiple water parameters
zooplanktologist Person who studies zooplankton taxa

Mangroves Monitoring and Evaluation Manual for Jamaica (2019)
x
Acronyms
ASA Analytics and Advisory Services
DBH Diameter at Breast Height
DO dissolved oxygen
ED Enumeration District
FAO Food and Agriculture Organization
GOJ Government of Jamaica
NRCA Natural Resource Conservation Authority
NEPA National Environment and Planning Agency
ODK Open Data Kit
ODPEM Office of Disaster Preparedness and Emergency Management
PROFOR Program for Forests
RSET Rod Surface Elevation Table
SDC Social Development Commission
SIDS Small Island Developing States
TNC The Nature Conservancy
UWI The University of the West Indies
WB World Bank

Mangroves Monitoring and Evaluation Manual for Jamaica (2019)
1
Purpose of Document
As a part of ongoing work on disaster risk reduction and protection of coastlines the
Government of Jamaica (GOJ) had received funding from the World Bank (WB) Program on
Forests (PROFOR) to implement the Analytics and Advisory Services (ASA) titled “Assessment and
Economic Valuation of Coastal Protection Services Provided by Mangroves in Jamaica”. This
activity was supervised by the World Bank, and led at the local level by the National
Environment and Planning Agency (NEPA).
This manual (which is one outcome of the project) may be used by a wide range of stakeholders
such as NEPA, Office of Disaster Preparedness and Emergency Management (ODPEM), parish
disaster coordinators, Forestry Department and any others who can benefit from information on
data collection methods on aspects of mangrove monitoring and evaluation. This manual has
been separated by areas of interest, namely Components (i) Socio-economic (ii) Ecological and
(ii) Physical data collection methodologies. It also includes a section on Economic Valuation
methods under ‘Further Monitoring’. The manual also indicates how data collected on these
different components can be combined to create a holistic approach to investigating coastal
ecosystems, flood risk and damage to life and livelihood as well as mitigation using nature
based solutions (i.e. mangroves).
Introduction
Jamaica, the third largest island in the Caribbean, has been impacted by tropical storms and
hurricanes (due to its location in the Atlantic hurricane belt), which has resulted in massive losses
to life and livelihood. The Planning Institute of Jamaica (PIOJ) reports six severe hydro-
meteorological events in Jamaica during the period 2002-2007 which resulted in massive
flooding, damage to infrastructure and losses totalling US$1.02 billion1. Much of the affected
communities and towns are coastal and the repeated flood events have also resulted in coastal
erosion.
In light of the extreme events affecting life and livelihood in Jamaica, and the growing
vulnerability of coastal communities to inundation and erosion, The GOJ has developed national
strategies and policies to promote resilient developments. One such, The National Development
Plan “Vision 2030 Jamaica” identified Sustainable Management and Use of Environmental and
1 PIOJ (2002, 2004, 2005a, 2005b, 2007, 2008, 2009, 2010 and 2012)

Mangroves Monitoring and Evaluation Manual for Jamaica (2019)
2
Natural Resources (Outcome 13), and Hazard Risk Reduction and Adaptation to Climate Change
(Outcome 14) as priority areas for the country’s long-term development strategy2.
The concept of using mangroves as natural barriers to coastal erosion came into scientific
knowledge and developed into policies following the 2004 Indian Ocean Tsunami and the 2005
storm surge from Hurricane Katrina that affected New Orleans. The World Bank (2016) study on
the impact of mangroves in lowering erosion in the countries of Philippines, Guatemala, Rwanda,
Columbia, Costa Rica, Indonesia and Botswana suggest that wave height can be reduced by 13
to 66% over a 100-meter-wide mangrove belt and by 50 to 100 % over a 500-meter-wide
mangrove belt3.
Habitat status of mangroves in Jamaica
Mangroves are halophytic (salt tolerant) plants which have the ability to thrive in the extreme
conditions found in coastal intertidal zones. They are tropical or subtropical and primarily found
in areas with low-oxygen and slow moving waters; which are also sites of sediment
accumulation4. Currently mangroves cover 167,000 -181,000km2 in 112 countries but the
majority are considered to be in a degraded condition4. Mangrove forest types, classified as
fringing, riverine, over-wash and basin, can be found throughout most Small Island Developing
States (SIDS) in the Caribbean (Antigua and Barbuda, Bahamas, Barbados, Cuba, Dominica,
Dominican Republic, Grenada, Haiti, Jamaica, St. Kitts and Nevis, St. Lucia, St. Vincent and
Grenadines, Trinidad and Tobago, Anguilla, Aruba, British Virgin Islands, Cayman, US Virgin
Islands, Guadeloupe, Martinique, Montserrat and Turks and Caicos). Of the 70 “true” mangrove
species found worldwide, 4 are found across the Caribbean – Red Mangrove (Rhizophora
mangle), Black Mangrove (Avicennia germinans), White Mangrove (Laguncularia racemose) and
Button Mangrove (Conocarpus erectus).
Approximately 20-35% of mangroves have been lost since the 1980s worldwide5, while
specifically in the Caribbean, 24-28% has been lost6. The major reasons for the reduction in
mangrove area are coastal and urban development, pollution (including solid waste), extraction
of fuel-wood, as well as conversion for aquaculture and agriculture7.
2 http://www.vision2030.gov.jm/ 3 World Bank (2016) 4 Basha (2018) 5 FAO (2007); Polidoro et. al. (2010); Webber et. al. (2016) 6 McKee et. al. (2007); Gilman et. al. (2008); Polidoro et. al. (2010) 7 Polidoro et. al., (2010)

Mangroves Monitoring and Evaluation Manual for Jamaica (2019)
3
In 1987, about 29% of Jamaica’s coastline was covered by mangrove forests representing
approximately 9,700ha. Estimates from 2010 indicated the main coastal wetland areas of the
country (Figure 1) where mangroves are found, amounted to approximately 11,670ha. This has
increased to 16,740ha as mentioned in the “Status of Jamaican Mangroves”8, however the
increase is said to be due to areas previously excluded from the 2005 mangrove survey, being
included in 2011.
Figure 1: Map showing distribution of mangrove areas within protected areas of Jamaica (Modified from NEPA, 2014)
Of the 7 south coast parishes, 5 showed an increase in wetland coverage over a 6-year period
from 2005 to 20119. St. Catherine and Clarendon were the only parishes that showed a decrease
in wetland area over time. In 2011, approximately 1,584ha of land in St. Catherine was classified
as wetland. This is a decrease of just over 50% from that classified in 2005, while Clarendon
showed a 40% decrease in wetland area; from 3,860ha to 2,334ha. Conversely, a section of the
Negril Great Morass located within Westmoreland showed an increase of approximately 42%
from 1,815ha in 2005 to 2,584ha in 2011. In St. Thomas, there was a marginal increase of 3% or
66 hectares, which was associated with the inclusion of the mangroves surrounding the Yallahs
Salt Ponds. Comparisons have been made between mangrove area coverage surveys using
remote sensing carried out in 2005 by The Nature Conservancy (TNC) and surveys (which
incorporated ground-truthing) conducted in 2012 by NEPA. The most significant increase in
coverage was 300% recorded for Kingston and St. Andrew in the 2012 surveys; this was again
8 NEPA (2014) 9 NEPA (2012)

Mangroves Monitoring and Evaluation Manual for Jamaica (2019)
4
attributed to newly documented areas that were excluded in the 2005 survey. The status in
2012 showed that the 3 parishes along the north coast including Westmoreland (when verified
against the desktop survey in 2011 for mangrove coverage) showed an increase in mangrove
coverage ranging from 9.3% to 99.7% for St Ann and Hanover. St James on the other hand
showed a 6% decrease. In all instances where there was an increase in wetland coverage this
was attributed to areas being omitted in the 2005 survey.
Despite this apparent large increase in area (due to changes in assessment methods), significant
areas of Jamaica’s mangrove forests have depleted due to the change in land use patterns. The
majority of the depletion is seen for areas where coastal developments have taken place
particularly along the North Coast.
Importance of mangroves
Mangroves provide a range of ecosystem services, including:10
Supporting & Regulating
Services Provisioning Services Cultural Services
1. Habitat for juvenile fish
that are important both
as essential components
of coral reef and other
ecosystems and are
important commercial
species;
2. Carbon sequestration;
3. Climate regulation;
4. Shoreline stabilization;
5. Water filtration and
pollution regulation.
6. Coastal Protection and
Resilience
1. Fisheries production
2. Aquaculture production
3. Pharmaceutical
generation
1. Recreation & tourism;
2. Educational
opportunities
3. Aesthetic & cultural
values.
Therefore the reduction of coastal mangroves in Jamaica has several consequences including an
increase in coastal erosion, since mangroves act as natural breakers of wave and wind force. The
decrease in mangrove area further affects biodiversity and is consequently likely to cause
reduction in commercial and non-commercial fisheries, which is an important livelihood for many
coastal communities. Finally, mangrove depletion will result in reduction of natural sediment and
10 Webber et. al. (2016)

Mangroves Monitoring and Evaluation Manual for Jamaica (2019)
5
nutrient filters, and loss of carbon reservoirs; all of which are important for climate change
adaptation mitigation, and disaster risk management.
Site Selection
The following criteria are important to consider when selecting a Monitoring site for
investigating the coastal protection services of mangroves:
Proximity to communities or important infrastructures
Sites with proximate sheltered and exposed (high wave energy) areas
Sites with continuous and fairly homogeneous forest cover, uninterrupted by pools or
channels as much as possible
Accessibility to the selected sites by land is considered but not a priority
It should be noted that each mangrove forest is different, so criteria may vary. Those above are
considered ideal for areas which provide strong protective services. However, areas which do
not satisfy all may still offer some degree of protection. Aerial photography or satellite imagery
should be used to determine the conditions/features of the site as well as size, and ideal
placement of transects and plots.
Mangroves Monitoring and Evaluation Manual for Jamaica (2019)
6
Component 1: Socio-Economic Monitoring
Theoretical Framework
The effects of coastal flooding, among other natural hazards, have long been understood within
the context of prevailing socio-economic conditions. Research has extensively indicated that
socio-economic characteristics may compound levels of vulnerability and have implications for
recovery and resilience11. More specifically, poor communities have been positioned as
disproportionately less able to cope with the impositions of environmental threat and are
therefore in greater need of intervention initiatives which seek to reduce inherent
vulnerabilities12.
Socio-economic domains provide particularly useful insight when intersected with demographic
variables such as age, gender and dependency ratios13. In this regard women and older cohorts
have commonly been constructed as more vulnerable. The role of women in the household and
their contribution to income and other conditions therefore presents important scope for
examining how households and, by extension communities, hazards such as flooding.
Additionally, variables such as the strength of community ties and willingness to participate have
also been found to influence the ways in which communities negotiate natural hazards14.
Understanding the social and economic context therefore represents an important pivot in
assessing the value and role of ecosystems which shape and are in turn shaped by socio-
economic conditions of those reliant on the resource. Specifically, mangrove ecosystems
arguably have significant value in the social and economic systems of the communities in
relatively close proximity. This can be viewed both from the perspective of the role that it plays
in potentially offsetting the threat of physical hazards, such as storm surges, and also in relation
to their value in socio-cultural and economic systems which are directly and indirectly influenced
by their presence.
In this manual, the socio-economic component sets out to understand this through two broad
objectives:
1. The social and economic value of the ecosystem services including the number of
livelihoods that benefit from mangrove existence.
11 Cutter et. al. (2003); Adger (2006); Baptiste and Kinlocke (2016) 12 Adger (2006); Kesavan and Swaminathan (2006) 13 Hann et. al. (2009); Cutter et. al. (2003) 14 Hahn et al (2009); Orencio and Fujii (2013)

Mangroves Monitoring and Evaluation Manual for Jamaica (2019)
7
2. The impact of mangroves on protection of coastal infrastructure and estimate losses thus
avoided
A household survey was developed to provide a quantitative assessment of these changes and
their social and economic implications.
Methods of Data Collection
The method of data collection can be considered in stages. These are outlined below.
Step 1: Conduct Field Reconnaissance and Secondary Data Collection
Conduct field reconnaissance to understand the spatial layout of the communities and
demarcate boundaries within which the assessment will be conducted. This may also be useful
for developing the questionnaire survey. For example, observations from the reconnaissance
fieldwork could facilitate the classification of communities into residential and commercial which
would further inform the type of questions asked.
It may be important here to liaise with community members to bring awareness of the data
collection process that will be taking place in the community and the objective of this process. In
so doing, bonds may be established which can allow for a smoother data collection process.
Liaising with community members is also effective in demarcating boundaries where a
researcher may be interested in a specific community or area of interest. This process can also
help in gaining some insight into specific areas of interest in the community which may be
useful in developing the survey instrument.
Use Secondary Data Sources to gather information on the demographic characteristics of the
community. The National Census Data will be a vital resource here and the population from
which the sample is selected may be based on estimates of the Enumeration District (ED) or
alternative other sources such as the Social Development Commission (SDC). ED boundaries
represent administrative divisions used for the collection of census data. A single community
may comprise several EDs or may be entirely contained within an ED. EDs are used to facilitate
more efficient management of population counts and are delimited by the number of
households contained within each unit. For urban areas, this is limited to 150 households per ED
and for rural areas this number is 100 households15. These spatial units comprehensively cover
the island.
15 PIOJ (n.d.)

Mangroves Monitoring and Evaluation Manual for Jamaica (2019)
8
On the other hand, SDC boundaries are delineated based on a combination of natural, cultural
and administrative features16. While population estimates based on these boundaries may
represent an appropriately nuanced estimate of community size, the national data set lacks
comprehensive coverage and does not include some communities in the island. This may
undermine cross community comparisons based on population estimates. Consider the
administrative scale at which the census data was collected. Note that data at the level of the
enumeration district may present a challenge if researchers are only interested in specific areas
within that enumeration district. In such circumstances, the most appropriate method would be
to count the houses or businesses in this delineated area of interest. This number would be a
subset of structures within the larger enumeration district but would be a more precise
representation of the population of interest.
Step 2: Develop Primary Data Collection Approach
Compute the sample based on selected parameters. For example, in this study the sample size
was calculated at the 95% confidence level and a margin of error of ±10%. The following
equation may be used:
Where:
Z = Z value (e.g. 1.96 for 95% confidence level)
p = %age picking a choice, expressed as decimal
(.5 used for sample size needed as this is a best fit for equal
probability across categories)
c = confidence interval, expressed as decimal
(e.g., .04 = ±4)
It should however be noted that these calculated samples were an overrepresentation of the
population as the calculation was done based on the entire ED. This approach was taken as the
population of the smaller, more specific area of interest was unknown. The larger sampling
frame was used as the basis for sampling as it would inevitably translate to an over
representation of the smaller area provided numbers were relatively close to the estimated
proportions. Nevertheless, it is accepted that the most appropriate method of determining
sample would have been through field mapping during reconnaissance.
Determine the sampling technique which may involve the use of probability or non-
probability techniques and the choice is ultimately conditioned by factors such as resources,
time and geographical scale. For example, the census method involves visits to each structure of
16 PIOJ (n.d.)

Mangroves Monitoring and Evaluation Manual for Jamaica (2019)
9
interest within the delineated study area. In this way each element the population had an equal
chance of being selected.
Develop survey for quantitative assessment of the various indicators. Including appropriate
stakeholders in the development and design of the survey instrument to ensure all critical
components are captured and reflect the expectations of stakeholders.
In designing the survey, consider the following:
The need for data to be disaggregated by gender
Assessment of poverty levels in the community using primary and secondary data
An assessment of socio-economic data including types of goods, estimated value, asset
evaluation
Observed changes in mangrove over the years and the impact of these changes
Current provision of services provided by mangrove and its importance- number of
livelihoods that benefit from mangrove existence disaggregated by gender
Opportunities for engaging persons in mangrove restoration activities
Flood risk and coping capacity.
Dominant land use of the community area (e.g. residential vs commercial)
A sample survey can be found in Appendix 1: Socio-economic Survey Instrument. It includes the
following sections:
Section A: Household Demographics
Section B: Housing Characteristics
Section C: Commercial Demographics
Section D: Fishing and Other Livelihoods
Section E: Mangroves Knowledge, Uses and Importance
Section F: Flooding Risk and Coping Capacity
Section G: Mangrove Management and Restorative Efforts
It is recommended that piloting the survey instrument be done prior to conducting data
collection. This allows for the identification of difficult, ambiguous or repetitive questions.
Amendments should be made as necessary following this process.
Step 3: Conduct Field Training and Data Collection
Prior to commencing fieldwork, ensure that fieldworkers are trained in the use of the
instrument and that they are familiarised with the content and administration of the survey
instrument. If mobile data collection tools are utilized, train data collectors in the manipulation
and management of mobile devices and the user interface associated with the relevant software,
Mangroves Monitoring and Evaluation Manual for Jamaica (2019)
10
such as the open source software, Open Data Kit (ODK)17. Appendix 2: Screenshots of Socio-
economic survey using ODK illustrates how the sample survey could be developed in Microsoft
Excel and how it is visualised after upload in ODK on mobile devices. However, the use of ODK
will require training and may be costly. Other options for collecting such data may include
online programs such as Google Forms and Survey Monkey or the traditional paper-based
survey. The online methods are however dependent on how many people you need to contact
and the characteristics of these people. They also do not facilitate offline collection and storage
of data which is more appropriated for field work.
Assign field supervisors with relevant skills and knowledge in mobile data collection to
manage any issues which may emerge in the field. It is also recommended that field workers
work in pairs for security purposes especially when working in new or unknown areas.
Step 4: Monitor Data Quality Standards
Data quality standards cannot be seen as a separate stage, but a continuous process from
determining the sample to collection and entry of data. Consider the following conditions in the
evaluation of data quality:
Validity by ensuring that the data meets the objectives of the study and represents the
intended result. The multi-stakeholder approach to developing the questionnaire is an
important step to achieving this.
Integrity by minimizing any errors that may arise from data entry and manipulation. The
choice of using ODK helps with minimizing errors as data are automatically uploaded in
various format thus reducing any errors that occur in data entry. The training in the ODK
prior to data collection also helps with this. Once data is uploaded to the database and
subsequently imported into a statistical software of your choice, data cleaning should be
conducted to identify outliers and errors. This may be done by generating charts and
tables for each of the variables in the dataset.
Reliability by ensuring consistent both in terms of the data collection processes and
analysis across time, items and researchers.
17 http://opendatakit.org
Mangroves Monitoring and Evaluation Manual for Jamaica (2019)
11
Analyses of Socio-economic Data
Analyse data using descriptive and inferential statistics. Consider disaggregation of data based
on various parameters which may include gender or location. Details of some key analyses are
provided below.
Assessment of poverty levels
Use descriptive statistics to examine a number of variables including household income, ability
to save, dependency on social welfare, characteristics of home etc. The results can be support by
existing secondary data.
Goods & value extracted
Use cross-tabulations to assess information on fishing and other goods extracted, particularly
from mangrove areas, by community. Use inferential statistics to compare means as it relates to
income, if data is provided. The data collected may be limited in this area due to lack of
knowledge, in some cases, or unwillingness to provide.
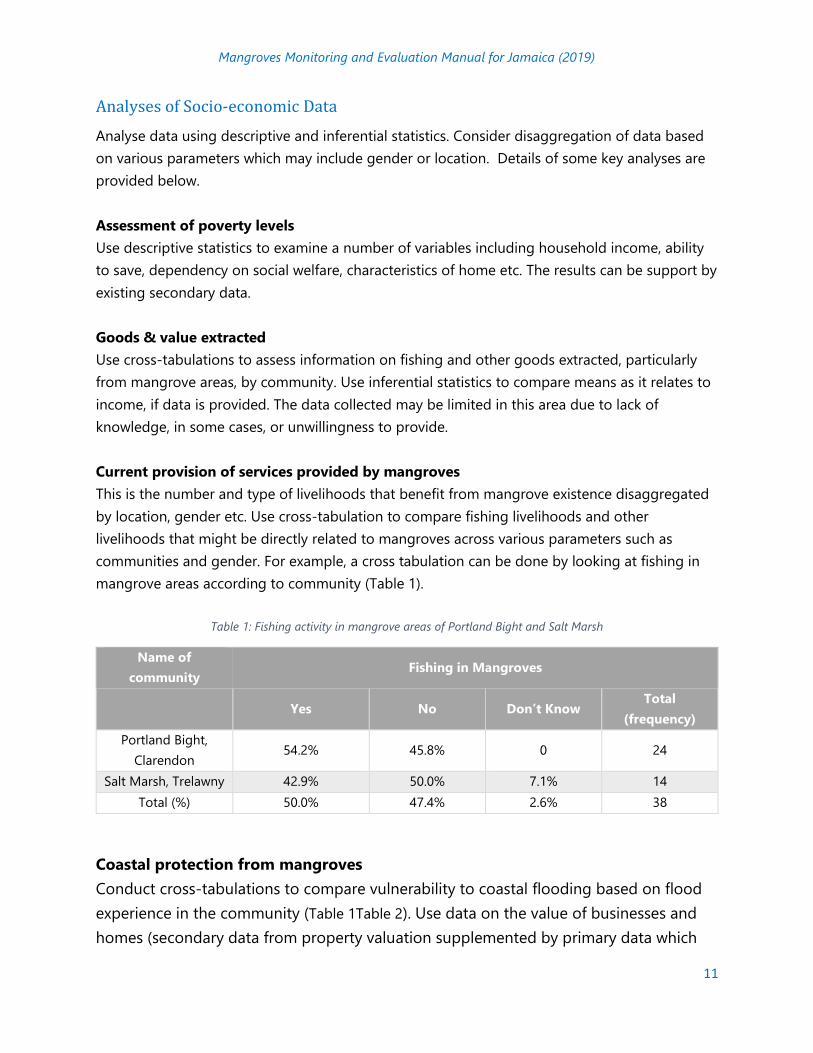
Current provision of services provided by mangroves
This is the number and type of livelihoods that benefit from mangrove existence disaggregated
by location, gender etc. Use cross-tabulation to compare fishing livelihoods and other
livelihoods that might be directly related to mangroves across various parameters such as
communities and gender. For example, a cross tabulation can be done by looking at fishing in
mangrove areas according to community (Table 1).
Table 1: Fishing activity in mangrove areas of Portland Bight and Salt Marsh
Name of
community Fishing in Mangroves
Yes No Don’t Know Total
(frequency)
Portland Bight,
Clarendon 54.2% 45.8% 0 24
Salt Marsh, Trelawny 42.9% 50.0% 7.1% 14
Total (%) 50.0% 47.4% 2.6% 38
Coastal protection from mangroves
Conduct cross-tabulations to compare vulnerability to coastal flooding based on flood
experience in the community (Table 1Table 2). Use data on the value of businesses and
homes (secondary data from property valuation supplemented by primary data which

Mangroves Monitoring and Evaluation Manual for Jamaica (2019)
12
may include annual earnings and number of employees etc.) and estimated income
from goods extracted from the sea to estimate avoided losses.
Table 2: Shows the %age (%) of people who have experienced coastal flooding in the communities.
Name of Community
Experience Coastal Flooding in the Community
Yes (%) No (%)
Portland Bight 88.7 11.3
Salt Marsh 34.1 65.9
Bogue 22 76.3
Total 54.4 45.2
Observed changes in mangroves
Includes possible reasons for such changes and current management or restorative efforts by
community members to restore mangrove and their willingness of communities and
opportunities for engaging persons in mangrove restoration activities disaggregated by gender
as part of the “Cost-effectiveness Assessment”. Use cross-tabulation to explore observed
changed in mangroves and opportunities for engaging persons in mangrove restoration
activities (Table 3, Table 4, Table 5).
Table 3: Observed changes in Mangroves in Bogue, Portland Bight and Salt Marsh
Name of the
Community
Changes observed in the extent of the
mangrove forest over the last 10 years
Decreased Same Increased Don't know
Bogue, St. James 46.7% 8.3% 8.3% 36.7%
Portland Bight,
Clarendon 22.6% 17.9% 46.2% 13.2%
Salt Marsh,
Trelawny 45.9% 20.0% 14.1% 20.0%
Total 36.3% 16.3% 26.3% 21.1%

Mangroves Monitoring and Evaluation Manual for Jamaica (2019)
13
Table 4: Shows the %age (%) of willingness amongst the people to participate in mangrove restoration.
Community Willingness to participate in mangrove restoration efforts (%)
Yes No Don’t Know
Bogue 65 13.3 20
Portland Bight 71.7 18.9 9.4
Salt Marsh 67.1 24.7 8.2
Total 68.5 19.5 11.6
Table 5: Shows the %age (%) of willingness to participate in Mangrove Restoration disaggregated by Gender for Portland
Bight.
Gender of
Respondents Yes (%) No (%) Don’t Know (%)
Total
Respondents
Male 71.2 26.9 1.9 52
Female 73.6 11.3 15.1 53
Total 76 20 9 105
Use inferential statistics to excavate latent patterns in the dataset (see Table 6). The application
of inferential statistics may range from the use of basic statistical tests such as the Chi squared
test to more complex explorations involving the use of regression models. It is recommended
that the Chi squared test or other bivariate analyses be used for initial diagnostics and as a
precursor for more in-depth probing of patterns within the data set.
Table 6: The association between gender and selected variables based on the results of the Chi Squared test
χ2 d.f. p value
Responses to flooding
– No action taken 0.65 1 0.406
– Relocated 1.24 1 0.264
– Flood proofed home 0.09 1 0.991
– Took out flood insurance 1.23 1 0.267
Other variables
Time taken to recover from last flood event 2.71 5 0.735
Willingness to participate in restoration activities 1.20 2 0.548
Current involvement in restoration activities 1.72 1 0.189

Mangroves Monitoring and Evaluation Manual for Jamaica (2019)
14
Component 2: Ecological Monitoring
Theoretical Background
The methods used to measure the structural attributes of mangroves such as species
composition, biomass indicated by Diameter at Breast Height (DBH), tree height and density are
based on the methods identified by Cintron and Novelli (1984) in the methods of studying
mangrove structure.
Two different heights (1.3 m and 1.5 m) can be used to determine DBH. The measurement of
DBH at a height of 1.3 m is to maintain the standard used currently in Jamaica while the 1.5 m
facilitates comparison with global assessments as done by Hortsman et al. (2014).
According to Hortsman et al. (2014), “For reliable representation of vegetation in mangrove wave
attenuation models, detailed site specific information on vegetation characteristics such as stem
and root diameter are important”. Establishing 3 subplot quadrats (0.5x0.5m/1m2) representing a
low, average and high pneumatophore/prop root density, counting the total number of
pneumatophores and determining the above ground length/height and diameter of 20
randomly selected roots are based on accepted methods18. The assessment of all
pneumatophores is an improvement based on the difficulty of making unbiased ‘random’
selections under the given field conditions.
18 Dahdouh-Guebas et al. (2007); Hortsman et al. (2014)

Mangroves Monitoring and Evaluation Manual for Jamaica (2019)
15
Methods of Data Collection
Resources required
Mangrove assessments require the following list of tools/equipment:
GPS unit
Dura copy waterproof copier paper / Waterproof tablets or smartphones with Open Data
Kit forms preloaded
Pencils and Permanent markers
Clipboard
100 m fiberglass open reel tape
10 m fiberglass open reel tape
Flagging tape
Caliper/DBH tape
7.5m Telescoping pole / 2 m graduated pole
1m pole/ ruler
Digital camera
Modified Light trap19
Cable ties
Ethanol
Fish ID guides
Stereomicroscope
Appropriate field gear (Long-sleeve shirts and trousers, hat, waterproof rubber boots).
With a team of 6 persons, 1 transect can be completed within 3 hours. However, this timing
depends on accessibility within the forest as well as the length of transect being assessed.
Mangrove species composition and relative abundance (for diversity)
1. Fill in data sheet (Appendix 3: Vegetation assessment data sheet) with date, time of
assessment; site and/or location name; name(s) of researchers; and any other notes such
as level of human/ natural disturbance.
2. Establish a transect (Figure 2) running from the seaward edge of the forest to the inland
areas (maximum transect line length is dependent on the area being assessed, therefore
transect can be 50m; 100m or longer). Furthermore exact placement of vegetation plots
will be informed by reconnaissance (Appendix 4: Reconnaissance data sheet).
19 Jones (2006)

Mangroves Monitoring and Evaluation Manual for Jamaica (2019)
16
3. Use a handheld GPS unit to record the location of the limits of each transect i.e. the start
position and end position of transect.
Figure 2: Example of monitoring transect and plot setup (Created by Patrice Francis, 2019).
4. Establish replicate vegetation plots of 10 X 10 m along each transect by marking trees
with flagging tape or paint. The length of each side of the plot should be 10 m where
possible. However, if there is insufficient space ‘linear plots’ of 5 x 20 m can be used.
5. Identify the type and number of tree species and record the results on the data sheet.
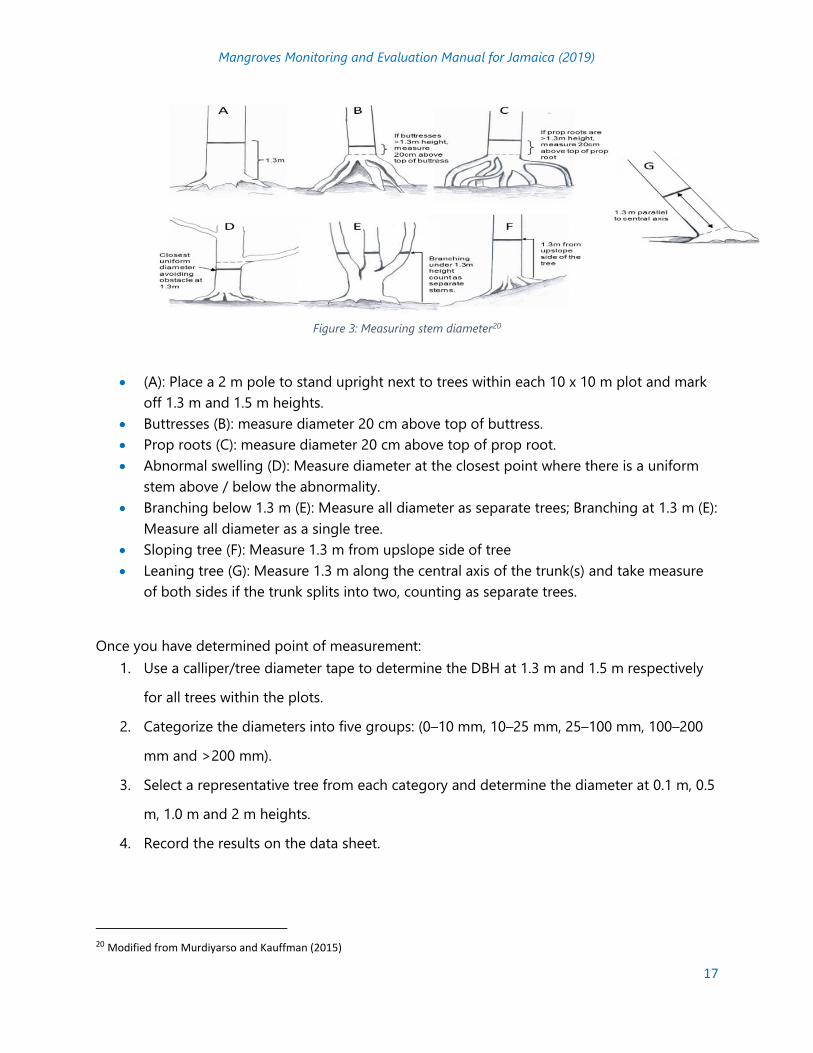
Mangrove Trunk Diameter (DBH)
Mangrove tree trunks come in a variety of formations (Figure 3). To determine the correct point
to measure DBH, use the guide below.
Mangroves Monitoring and Evaluation Manual for Jamaica (2019)
17
Figure 3: Measuring stem diameter20
(A): Place a 2 m pole to stand upright next to trees within each 10 x 10 m plot and mark
off 1.3 m and 1.5 m heights.
Buttresses (B): measure diameter 20 cm above top of buttress.
Prop roots (C): measure diameter 20 cm above top of prop root.
Abnormal swelling (D): Measure diameter at the closest point where there is a uniform
stem above / below the abnormality.
Branching below 1.3 m (E): Measure all diameter as separate trees; Branching at 1.3 m (E):
Measure all diameter as a single tree.
Sloping tree (F): Measure 1.3 m from upslope side of tree
Leaning tree (G): Measure 1.3 m along the central axis of the trunk(s) and take measure
of both sides if the trunk splits into two, counting as separate trees.
Once you have determined point of measurement:
1. Use a calliper/tree diameter tape to determine the DBH at 1.3 m and 1.5 m respectively
for all trees within the plots.
2. Categorize the diameters into five groups: (0–10 mm, 10–25 mm, 25–100 mm, 100–200
mm and >200 mm).
3. Select a representative tree from each category and determine the diameter at 0.1 m, 0.5
m, 1.0 m and 2 m heights.
4. Record the results on the data sheet.
20 Modified from Murdiyarso and Kauffman (2015)

Mangroves Monitoring and Evaluation Manual for Jamaica (2019)
18
Mangrove height and canopy width
1. Place a telescoping pole/ 2 m pole beside the tree to be measured.
2. Adjust the pole to the highest point of the tree and determine its height.
3. Place a meter ruler/graduated tape on the ground from edge to edge of the tree crown
and determine the width of the canopy.
4. Record the results on the appropriate field data sheet (Appendix 3: Vegetation
assessment data sheet).
Prop roots/aerial roots network
1. Establish three subplots (1 X 1 m) representing low, medium and high prop root
pneumatophore densities within each 10 X 10 m plot (Figure 4). These subplots should
be established before completing tree measurements to prevent damage to
pneumatophores/prop roots.
2. Count the total number of pneumatophores/ prop roots within each subplot.
3. Select twenty (20) random pneumatophores/prop root (if possible) per subplot and
determine their height as well as diameter at 0.1 m or 0.5 m.
4. Record the results.

Mangroves Monitoring and Evaluation Manual for Jamaica (2019)
19
Figure 4: Samples of 1 X 1 m subplots representing low (left), medium (centre) and high (right) prop root (top) and
pneumataphore (bottom) densities
Ecosystem services: Fisheries production using light-traps to collect fish larvae and other
water column fauna.
1. Check calendar for date of new moon.
2. Prepare lights for illuminating the light traps before deployment on the day of the new
moon by checking and changing batteries.
3. Turn lights on as trap is being deployed and leave illuminated (Figure 5)
4. Attach light traps to red mangrove roots hanging in at least 1 m water depth (Figure 5),
secure traps to the prop roots using cable ties and leave lighted traps in place overnight.

Mangroves Monitoring and Evaluation Manual for Jamaica (2019)
20
Figure 5: Examples of light trap deployment in deep water with light on (left and centre) and in mangrove prop roots
(right)
5. Collect light traps early next morning preferably at sunrise to prevent predation of fish
larvae by zooplankton.
6. Collect organisms from light trap collection bucket and immediately preserve sample in
ethanol.
7. In the lab, decant each the sample for storage in 200 ml bottles in 70% ethanol.
8. Identify fish larvae to family or species by using a trained ichthyologist and with the aid
of identification guides for Atlantic species21. Each type of larvae may be viewed under a
stereo microscope, photographed in lateral view (scale included in the frame) and with
fin rays clearly displayed. Enumerate types of larvae based on each photograph and
determine total numbers.
9. Identify other organisms under a stereo microscope by using a trained zooplanktologist
and with aid of identification guides for Atlantic species22. Different organisms may be
photographed (scale included in the frame) in lateral and dorso-ventral planes and
enumerated based on each photograph.
10. Record the results and determine the numbers per volume of sample and hence the
relative abundance of each fish family/species.
21 Suggested guidebooks: C.D. Todd; M.S. Laverack and G.A. Boxshall “Coastal Marine Zooplankton: A Practical Manual for
Students”; William J. Richards “Early Stages of Atlantic Fishes: An Identification Guide for the Western Central North Atlantic
Books I-V”; G.E. Newell and R.C. Newell “Marine plankton, a practical guide.”; J. Wickstead “Marine Zooplankton”; William
Johnson and Dennis Allen “Zooplankton of the Atlantic and Gulf Coasts: A Guide to Their Identification and Ecology”
Mangroves Monitoring and Evaluation Manual for Jamaica (2019)
21
Timing and Frequency
The level of interest, benefits of sampling as well as the monitoring cost will influence the time
intervals and frequency of monitoring22. Based on forest dynamics as well as the nature of
location (whether it is prone to natural disturbances such as hurricanes), monitoring should be
done every 2 years. If cost is a major issue then the forest could be monitored every 5 years23.
Monitoring should be done as close to same time of year as possible. It is recommended that
monitoring of ecosystem services for fisheries production, be conducted monthly for one year,
however, monitoring between February – April when water temperatures are minimal may also
be used24.
Data management
1. Create a spreadsheet in Excel for each mangrove site and enter the data from your field
data sheets using the layout of the field-data sheets.
2. Check the field data sheet against the data you entered in the computer and correct any
mistakes made during the data entry.
Analyses
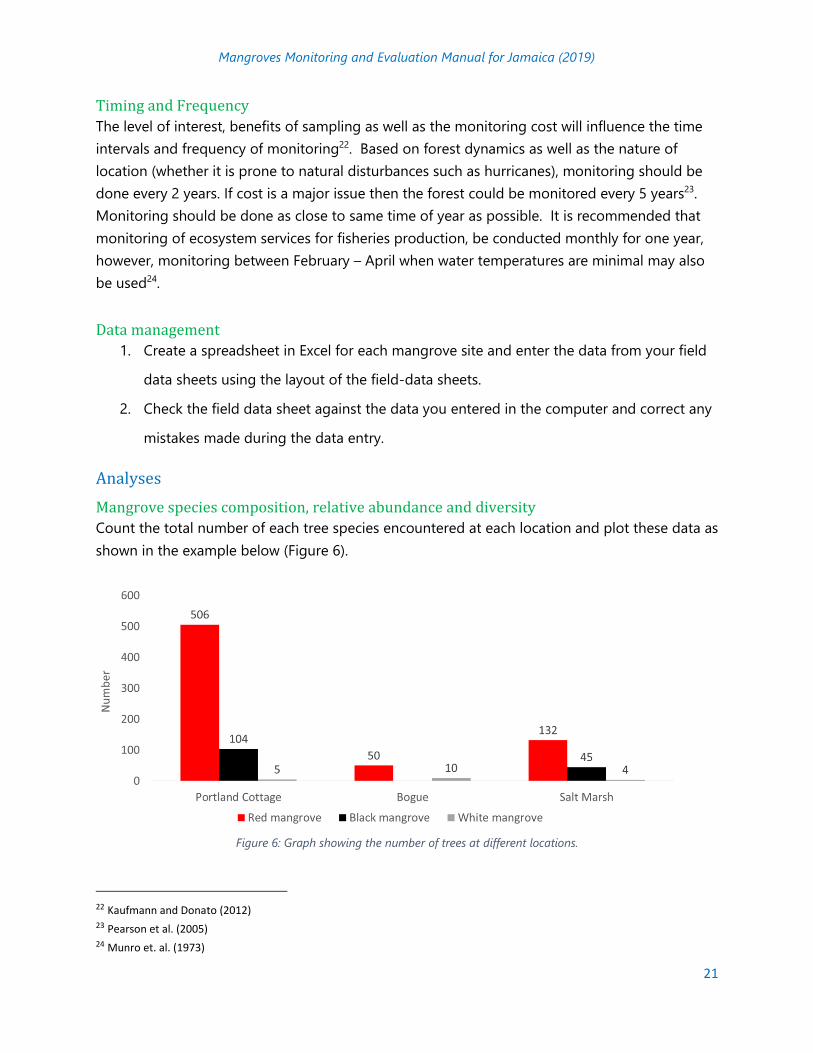
Mangrove species composition, relative abundance and diversity
Count the total number of each tree species encountered at each location and plot these data as
shown in the example below (Figure 6).
Figure 6: Graph showing the number of trees at different locations.
22 Kaufmann and Donato (2012) 23 Pearson et al. (2005) 24 Munro et. al. (1973)

Mangroves Monitoring and Evaluation Manual for Jamaica (2019)
22
Use the Simpson’s index to determine diversity.
n = the total number of organisms of a particular species
N = the total number of organisms of all species
Mangrove trunk diameter (DBH)
Calculate the mean (with standard error - SE) diameter at breast height per species /
plot/location as shown in the example below (Figure 7).
Figure 7: Graph showing the mean diameter at breast height per species at different location
Mangrove height and canopy width
Calculate the mean (with SE) height and canopy width per species / plot.
Prop roots/aerial roots network
Count the total number pneumatophores/ prop roots per subplots.
Determine the mean (with SE) root height/diameter for each density at each area.

Mangroves Monitoring and Evaluation Manual for Jamaica (2019)
23
Component 3: Physical Monitoring
Theoretical Background
Several methods are used to evaluate the physical attributes of mangroves. Mangroves have
been reported to prevent and reduce damages from extreme events by wave and wind
attenuation, soil stabilisation and keeping up with sea level rise25. To understand the physical
conditions of the mangrove, researchers must establish some baseline data and identify
sampling sites for continued monitoring and study. Mangrove forests are considered important
sinks that allow for the accumulation and storage of marine and terrigenous sediments because
of the trapping effects of the root and shoot structures26. Mangroves act as soil builders and can
if healthy keep up with sea-level rise by maintaining a positive surface elevation change
exceeding the rate of sea-level rise for a locality.
Contextual and spatial data on the experience of flooding by residents of communities in
proximity to mangrove forest are paramount to understand the risks and experience of loss or
damage and the extent of ecosystem services provided in the reduction of storm damage27. The
data can be mapped and represented spatially. The trends of lateral erosion or accretion
overtime are calculated using Geographic Information System (GIS). Vertical erosion or accretion
is assessed using a benchmark and horizon markers following previously accepted methods28.
Soil and water samples are collected to evaluate the characteristics and constituents of the
substrate and its health.
Baseline data such as bathymetry, wave pressure water level and wind parameters are collected
to validate and support additional levels of analysis towards the constraining of ecosystem
services provided by mangroves in the form of wave attenuation, and wind reduction.
Methods of Data Collection
Flooding and Coastal Erosion
Utilize primary data gathered from the socio-economic questionnaires administered in
Component 1 above.
Import to a GIS platform and project the spatial and descriptive data.
Choose suitable symbols and display accordingly.
25 Horstman et. al. (2014); Krauss et. al. (2003); Kumara et. al. (2010); McKee et. al. (2007) 26 Kumara et. al. (2010) 27 Barbier (2016) 28 Cahoon et. al. (1997); Cahoon et. al. (2002); Horstman et al. (2014); Krauss et. al. (2013)

Mangroves Monitoring and Evaluation Manual for Jamaica (2019)
24
Sediment Sampling and Assessment
1. Using an Edelman combination soil auger or other suitable auger collect in duplicates or
as needed representative soil samples (0-30 cm depth) along transect at each study site.
2. After collection, place the soil cores in double strength polyethylene bags, and seal the
bags.
3. Label the bags with permanent marker or affix labels that correspond to data sheet or
field note book, be sure to use a unique sample identifier for the site, transect and
sample.
4. Complete data sheet or field book with relevant details such as waypoint number,
sample number, colour and also include any other notes, such as types of mangrove
trees if any are associated with the sediment.
5. Transport samples to the laboratory under ambient conditions and process within 24 to
48 hours of collection or store the samples in ambient conditions until processing.
Surface Accretion
1. Install permanent benchmarks to set up the experimental sites (Figure 8). Additional
details can be accessed from USGS records29.
Figure 8: Typical set up for benchmark and horizon markers (not drawn to scale). The measurements in the field
will vary according to suitable substrate for placement. Record the specifics unique to your site following the
template of Appendix 5: Benchmark Set Up Sheet.
29 http://www.pwrc.usgs.gov/set/

Mangroves Monitoring and Evaluation Manual for Jamaica (2019)
25
2. Hammer steel or stainless steel rods of known lengths, pre-threaded and joined by
coupling into the mangrove substrate until no further penetration is possible (Figure 9).
Cement this benchmark into the ground at each site to ensure it remains vertical and
fixed.
Figure 9: (A-C) Installation of benchmark, with lengthening of the steel as necessary and subsequent hammering into the
substrate until no further downward movement is achieved
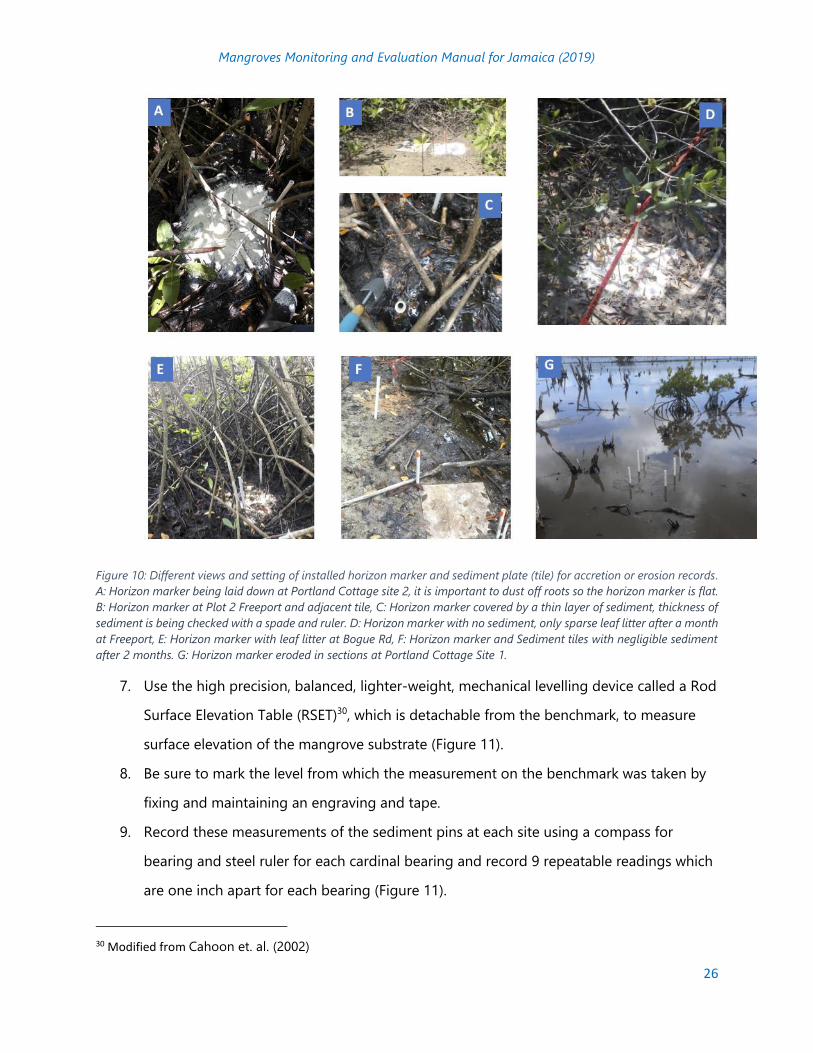
3. Note the proportion of the total length of the benchmark that has been inserted in the
mangrove substrate.
4. Record the length of the benchmark exposed above ground. Install 30 x 30 cm floor tiles
to trap accreted sediment at the benchmark site in conjunction with four powder
horizon markers at each site.
5. Insert locators for the horizon markers and tile with coloured or flagged PVC pipes to be
able to locate them again (Figure 10).
6. On a sketch of the experimental plot, add details, with accurate measurements and
dimensions of horizon markers and sediment plate so they can be found for
measurements at subsequent field exercises. Use template provided in Appendix 5:
Benchmark Set Up Sheet.
Mangroves Monitoring and Evaluation Manual for Jamaica (2019)
26
Figure 10: Different views and setting of installed horizon marker and sediment plate (tile) for accretion or erosion records.
A: Horizon marker being laid down at Portland Cottage site 2, it is important to dust off roots so the horizon marker is flat.
B: Horizon marker at Plot 2 Freeport and adjacent tile, C: Horizon marker covered by a thin layer of sediment, thickness of
sediment is being checked with a spade and ruler. D: Horizon marker with no sediment, only sparse leaf litter after a month
at Freeport, E: Horizon marker with leaf litter at Bogue Rd, F: Horizon marker and Sediment tiles with negligible sediment
after 2 months. G: Horizon marker eroded in sections at Portland Cottage Site 1.
7. Use the high precision, balanced, lighter-weight, mechanical levelling device called a Rod
Surface Elevation Table (RSET)30, which is detachable from the benchmark, to measure
surface elevation of the mangrove substrate (Figure 11).
8. Be sure to mark the level from which the measurement on the benchmark was taken by
fixing and maintaining an engraving and tape.
9. Record these measurements of the sediment pins at each site using a compass for
bearing and steel ruler for each cardinal bearing and record 9 repeatable readings which
are one inch apart for each bearing (Figure 11).
30 Modified from Cahoon et. al. (2002)

Mangroves Monitoring and Evaluation Manual for Jamaica (2019)
27
10. Repeat these RSET measurements at each subsequent site visit.
11. Take note if sediment is trapped on the tiles at each subsequent visit. If sediment is on
the tile, remove it for weighing and analysis.
12. Check the horizon markers at each site visit and record the thickness of any sediment
accreted above the horizon (Figure 11C)31
Figure 11: Elevation measurements are being taken with a RSET removable device. A: Set up at Plot 1 Freeport, St. James,
B: Measurement at freeport plot 1, C: Measurement at Portland Cottage site 2, D: Measurement at Rodney Street Site, E:
Measurement at Bogue Road site.
Wind Data
1. Collect the wind data using three hand held anemometers simultaneously, along a
seaward transect (Figure 12 and Figure 13A) and within the shelter of the mangroves at
predetermined time intervals.
31 Cahoon and Lynch (1997) and McKee et. al. (2007)

Mangroves Monitoring and Evaluation Manual for Jamaica (2019)
28
2. Set the anemometers to record the average wind speed, at the predetermined start time,
hold the anemometer for 120 s in the prevailing wind direction as determined by the
persons operating it at the time of data collection.
3. Record the GPS location at which the wind speed was taken along with corresponding
wind speed on a chart at each time interval.
Figure 12: Idealised sketch showing the concept and location for deploying pressure sensors to determine water wave
parameters, and the spatial arrangement of researcher for collecting wind speed along a coast-perpendicular transect
using hand-held anemometers
Water Level and Pressure
1. Pre-determine and set the time and date for data collection of the U20L-02 Water Level
Logger following their manual using a computer.
2. Install the loggers in a PVC pipe and affix to concrete blocks to ensure that they remain
stationary at consistent height above the sediment below the water.
3. Deploy the U20L-02 Water Level Logger along a seaward to landward transect with the
most landward being placed within the roots of the mangroves at a location affected by
water waves (Figure 12 and Figure 13).
4. Place the second logger in the middle of transect, seaward outside of mangrove roots.
5. Place the third logger at the most seaward position of wading or suitable location
(Figure 13) according to the site characteristics.
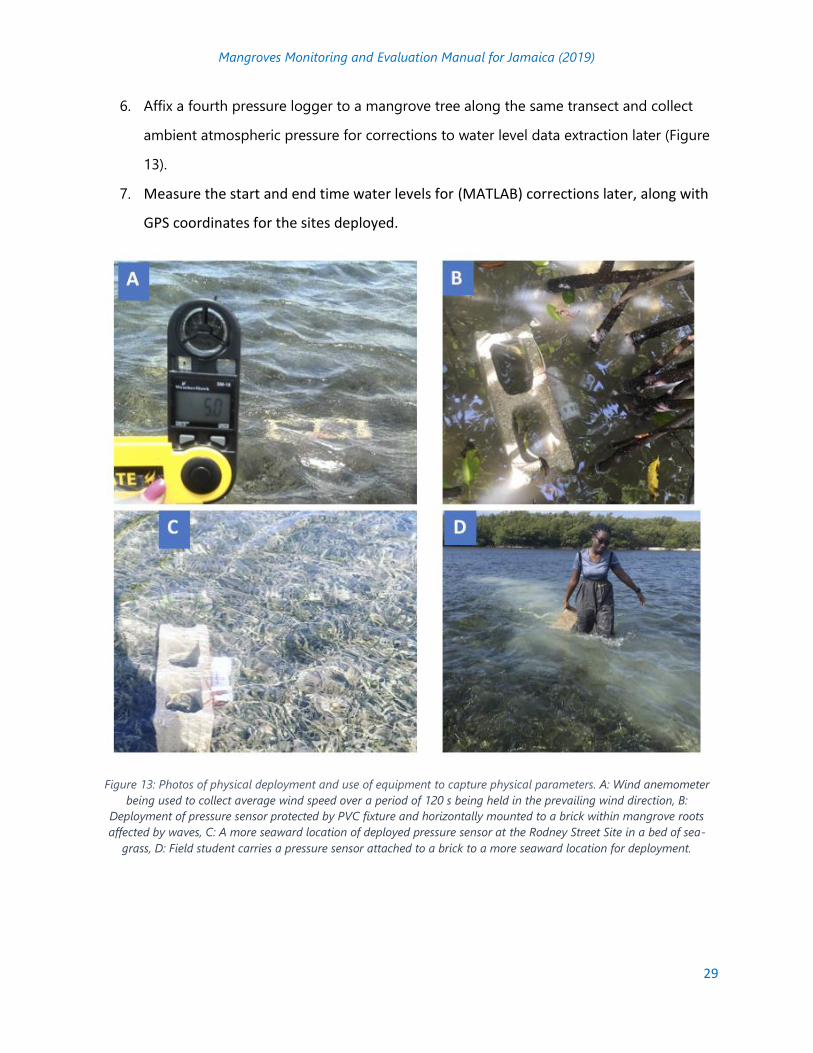
Mangroves Monitoring and Evaluation Manual for Jamaica (2019)
29
6. Affix a fourth pressure logger to a mangrove tree along the same transect and collect
ambient atmospheric pressure for corrections to water level data extraction later (Figure
13).
7. Measure the start and end time water levels for (MATLAB) corrections later, along with
GPS coordinates for the sites deployed.
Figure 13: Photos of physical deployment and use of equipment to capture physical parameters. A: Wind anemometer
being used to collect average wind speed over a period of 120 s being held in the prevailing wind direction, B:
Deployment of pressure sensor protected by PVC fixture and horizontally mounted to a brick within mangrove roots
affected by waves, C: A more seaward location of deployed pressure sensor at the Rodney Street Site in a bed of sea-
grass, D: Field student carries a pressure sensor attached to a brick to a more seaward location for deployment.

Mangroves Monitoring and Evaluation Manual for Jamaica (2019)
30
Water Quality
1. Collect 3 or more water samples at varying intervals seaward along transect using 1 L
acid-washed High-Density Polyethylene (HDPE) bottles or two 500 ml bottles per sample
(Figure 14A, B and D) under fully mixed conditions.
2. Record sample coordinates and unique identifier in GPS device and field notes.
3. Prior to collection, rinse each container with a small quantity of water collected at each
site to homogenize.
4. Record dissolved oxygen (DO), pH, salinity, conductivity, total dissolved solids and water
temperature, in situ using YSI 556 multi-probe system or other suitable multi-parameter
water probe (Figure 14C).
5. Place samples immediately on ice and transport to a temporary holding facility (with
refrigeration) or directly to the laboratory, prepare and freeze for further analysis within
24 to 48 hours (Figure 14D).
6. Submit samples to appropriate analytical facility to be analysed for trace elements,
nutrient loadings and stable isotope composition.
Figure 14: Evaluating the physical parameters of the water within mangrove systems. A: acid- washed HDPE bottles left
to dry prior to field day, B: Water is collected along a transect at each site, depending on the water level along the
transect, it may take multiple tries to fill bottles, C: YSI collected in-situ water parameters, the data and time is recorded
along with corresponding GPS coordinates, C: Sample bottles are labelled and stored according to protocol for analysis.
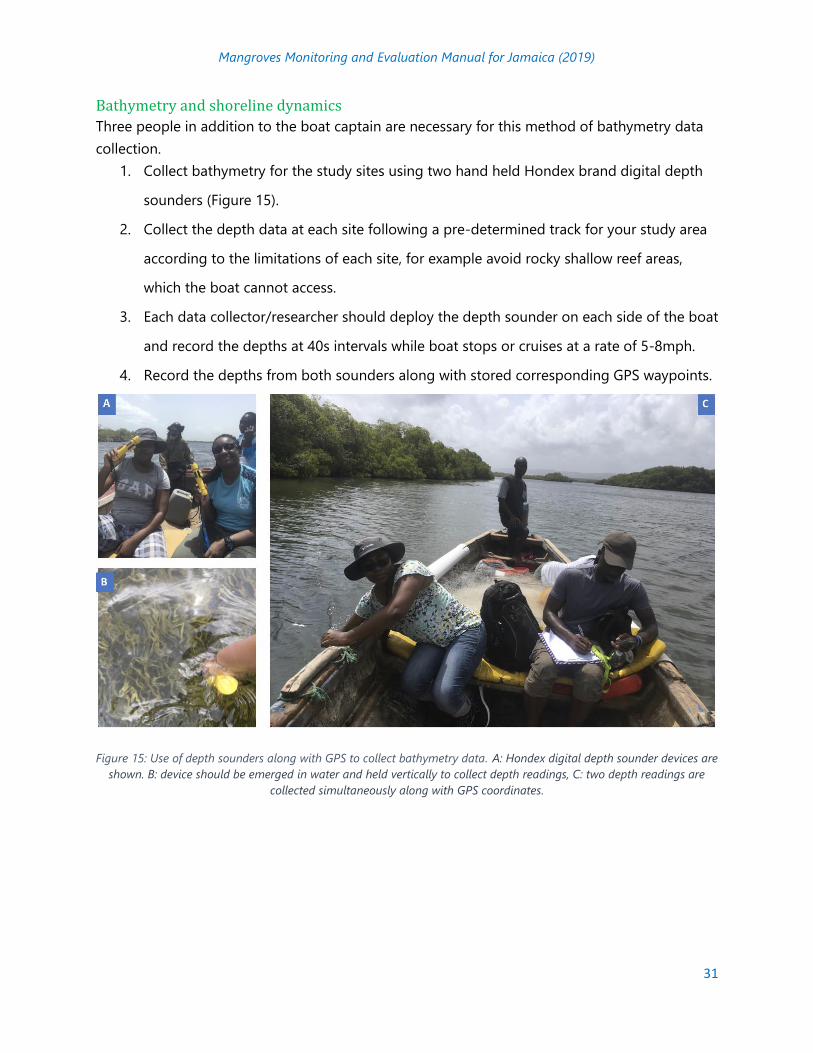
Mangroves Monitoring and Evaluation Manual for Jamaica (2019)
31
Bathymetry and shoreline dynamics
Three people in addition to the boat captain are necessary for this method of bathymetry data
collection.
1. Collect bathymetry for the study sites using two hand held Hondex brand digital depth
sounders (Figure 15).
2. Collect the depth data at each site following a pre-determined track for your study area
according to the limitations of each site, for example avoid rocky shallow reef areas,
which the boat cannot access.
3. Each data collector/researcher should deploy the depth sounder on each side of the boat
and record the depths at 40s intervals while boat stops or cruises at a rate of 5-8mph.
4. Record the depths from both sounders along with stored corresponding GPS waypoints.
Figure 15: Use of depth sounders along with GPS to collect bathymetry data. A: Hondex digital depth sounder devices are
shown. B: device should be emerged in water and held vertically to collect depth readings, C: two depth readings are
collected simultaneously along with GPS coordinates.

Mangroves Monitoring and Evaluation Manual for Jamaica (2019)
32
Soil health
1. Oven-dry samples and homogenize.
2. Sieve samples to obtain <2mm and <150μm size fractions. Use a standard ASTM nest of
sieves in a mechanical shaker to evaluate grain size32.
3. Submit fractions for geochemical analysis, taphonomic and constituent analysis.
Soil-atmospheric carbon flux
1. This requires an automated gas flux system consisting of a survey chamber and a control
unit equipped with an infrared gas analyser.
2. Place ten to twenty 10 cm or 20 cm diameter PVC soil collars 5-6 cm in soil surface at
least 2 h before commencing data collection (Figure 16A, B and C).
3. Mount survey chamber on soil collar and engage data acquisition for no more than 10
min/collar (Figure 16D and E).
4. Process gas flux data using proprietary software, statistical and GIS software packages.
5. Data can be presented in a variety of ways, but may be best represented spatially.
Figure 16: Equipment and process of collecting gas flux data. A: Collar deployed in substrate, B: Collar can be deployed if
the substrate is saturated, C: collar deployed and marked with flagging tape along with GPS to facilitate easier relocation
and measurements, D and E: Survey chamber mounted to collar and allowed to collect readings for 10 minutes per collar
after equilibration period of 2 h has elapsed.
32 Carver (1971)
Mangroves Monitoring and Evaluation Manual for Jamaica (2019)
33
Soil carbon biogeochemistry
Soil organic matter and organic carbon
The determination of soil organic matter (SOM) content by dry combustion – loss on ignition
(LOI) requires an analytical balance, a furnace, ceramic crucibles and a desiccator.
1. Determine mass of empty ceramic crucible.
2. Dry crucibles to constant weight at 105°C in furnace overnight. Allow crucibles to cool in
desiccator before weighing.
3. Accurately weigh 0.5 g of the <2 mm soil fraction into crucibles and dry soil to constant weight
at 105°C for 24 h. Allow soil to cool in desiccator before weighing. Determine dry mass of soil by
mass difference.
4. Combust dried soil at 550°C for 4 h, then cool samples in desiccator before weighing.
5. Calculate LOI (weight %) = 100 * ((mass of post 550°C ash)/(mass of post 105°C dry sample)).
6. Soil organic carbon content = LOI (weight %) * 0.58.
Soil organic carbon stocks
1. SOCSTOCK (Mg C ha-1) = SOC (%) x BD (g cm-3) x depth of soil (cm)
SOC (%) = the percentage of soil organic carbon measured
BD = bulk density (mass per unit volume of dried soil).
2. BD can be determined in the laboratory from appropriate sampling or through calculations using
appropriate pedotransfer functions.
Aboveground biomass and carbon stock
Determine aboveground (and belowground) biomass (ABG) and carbon stocks using regression
allometric models:
1. ABGest = exp (-2.187 + 0.916) x ln (ρD2H)) = 0.112 x (ρD2H)0.916 (ABG)est = estimated ABG (Kg) exp = exponential ln = natural log D = diameter at breast height (cm) H = height (m) ρ = wood specific density (g/cm3)
Note, diameter at breast height and tree height data are determined at component 2 of this
manual, the ecology section, while wood density data is obtained from the literature. Tree carbon
is calculated from biomass using a factor of 0.47, and belowground carbon stock is assumed to
be 20 % of the above ground stock
Analyses
Flooding and Coastal Erosion
Analysis of Primary Data from the questionnaires
These steps will require familiarity with a GIS programme.
Mangroves Monitoring and Evaluation Manual for Jamaica (2019)
34
1. The data and corresponding GPS coordinates collected from the questionnaires can be
mapped and presented in a geographic information system. To do this: Plot the
coordinates for the respondents who experienced flooding.
2. Run spatial queries to determine the limits of flooding such as closeness to contours
either by nearest distance or buffers.
3. Categorise and display the experience of flooding and other parameters collected from
the questionnaire in relation to the study plots.
Analysis of Relevant Secondary Data collection
These steps will require familiarity with a GIS programme:
1. Import flooding shapefiles received from Ministry offices or colleagues into your study
and overlay in GIS to create maps of reported flood extent.
2. Use these water levels of flooding to overlay the GIS Data layers so as to see the extent
of reported flooding in proximity to infrastructure and the study plots (Figure 17).
3. Create buffers related to the vectors above to highlight communities and national
infrastructure such as hospitals, roads, police stations etc. that are affected by flooding in
the case of extreme events.

Mangroves Monitoring and Evaluation Manual for Jamaica (2019)
35
Figure 17: Analysis of secondary flood data in GIS, Map shows reported experience of flooding and predicted extents of
inundation from storm surges for 5 and 10 m in relation to critical infrastructure, Montego Bay
Permanent Coastal Erosion
These steps will require familiarity with a GIS program:
1. Collect aerial photographs and clean satellite imagery (rasters) for your study sites.
2. Georeference raster imagery in a GIS.
3. Create vector files for the historical coastlines.
4. Compute by spatial algebra the lateral permanent erosion or accretion as in the example
of Trelawny (Figure 18).
5. Differentiate if relevant land reclamation results from prograding coastlines.

Mangroves Monitoring and Evaluation Manual for Jamaica (2019)
36
Figure 18: Map of long-term lateral erosion or accretion constrained from spatial analysis of historic images of the
coastal zone.
Sediment Sampling and Assessment
Lab analysis of Sediments
1. Consult a trained sedimentologist to assess the samples for grain size, skeletal grain
taphonomy, peat content and constituent analysis in a reputable sedimentary lab.
2. Report %ages of peat in sample or organic content loss on ignition.
3. Report the normalised %ages sediments by grain size of silt sand and clay to classify the
substrate.
4. Plot the %ages on a ternary diagram to determine the sediment textural classification of
the sediment
5. Evaluate coarse fraction where available for skeletal or non-skeletal biogenic or inorganic
grains
6. Deliver a fraction of each sediment sample collected to a reputable natural science lab
that can determine:
the oxide content of the sediment
elemental chemistry
metals and nutrients
Surface Accretion and Soil Surface Elevation
1. Calculate the difference of the mean elevation change between time 1 and time n (a
subsequent reading) or all 9 measurements for each cardinal direction at each

Mangroves Monitoring and Evaluation Manual for Jamaica (2019)
37
benchmark either sequentially for site visits or between the first measurement at
installation and the last measurements.
2. Using a standard methods in a spreadsheet calculate the mean, standard deviation,
standard error, maximum and minimum to record and interpret the dominant accretion
or erosion processes at each site at the benchmark.
3. Calculate the rate of accretion, erosion and subsidence using the result from 1 above
divided by the time in between measurements.
4. Comment if erosion was observed by absence of the horizon marker.
5. Accretion/Erosion – Subsidence = Elevation change33.
Wind Data and Wave Parameters
Wind energy attenuation
1. Subtract the most landward wind speed from the speed recorded just outside the
mangrove to determine the % reduction within the mangrove canopy (Table 7).
2. Calculate the % reduction of wind speed along the transect from the most seaward
measuring point to the midpoint outside the mangrove the mangrove canopy (Table 7).
Table 7: Sample data for wind energy attenuation analyses
Mean Wind Speed (m/s) Reduction in Wind Speed (%)
Sites Within Mangrove Forest
Outsides mangrove Forest Canopy
Wading Depth (Open Coast)
Outside Mangroves
Within Mangroves
Bogue Lagoon Site 1 2.9 4.3 4.5 4 36
Bogue Lagoon Site 2 3.1 5.3 5.7 7 46
Portland Cottage Site 1
2.5 5.8 5.9 2 58
Portland Cottage Site 2
2.4 5.1 5.7 11 58
Salt Marsh Site 1 3.4 6.8 7.5 9 55
Salt Marsh Site 2 4.1 6.1 6.9 12 41
3. Compute these for each sets of measurements.
33 Cahoon and Lynch (1997); Calloway et. al. (2013)
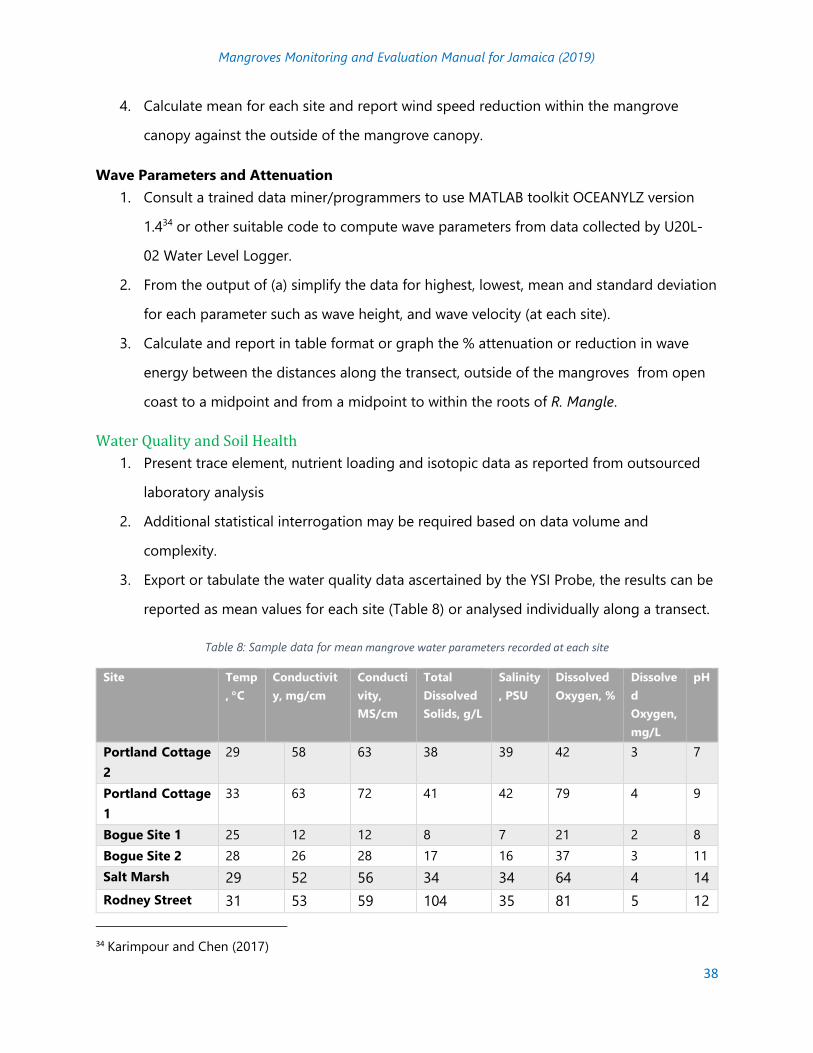
Mangroves Monitoring and Evaluation Manual for Jamaica (2019)
38
4. Calculate mean for each site and report wind speed reduction within the mangrove
canopy against the outside of the mangrove canopy.
Wave Parameters and Attenuation
1. Consult a trained data miner/programmers to use MATLAB toolkit OCEANYLZ version
1.434 or other suitable code to compute wave parameters from data collected by U20L-
02 Water Level Logger.
2. From the output of (a) simplify the data for highest, lowest, mean and standard deviation
for each parameter such as wave height, and wave velocity (at each site).
3. Calculate and report in table format or graph the % attenuation or reduction in wave
energy between the distances along the transect, outside of the mangroves from open
coast to a midpoint and from a midpoint to within the roots of R. Mangle.
Water Quality and Soil Health
1. Present trace element, nutrient loading and isotopic data as reported from outsourced
laboratory analysis
2. Additional statistical interrogation may be required based on data volume and
complexity.
3. Export or tabulate the water quality data ascertained by the YSI Probe, the results can be
reported as mean values for each site (Table 8) or analysed individually along a transect.
Table 8: Sample data for mean mangrove water parameters recorded at each site
Site Temp
, C
Conductivit
y, mg/cm
Conducti
vity,
MS/cm
Total
Dissolved
Solids, g/L
Salinity
, PSU
Dissolved
Oxygen, %
Dissolve
d
Oxygen,
mg/L
pH
Portland Cottage
2
29 58 63 38 39 42 3 7
Portland Cottage
1
33 63 72 41 42 79 4 9
Bogue Site 1 25 12 12 8 7 21 2 8
Bogue Site 2 28 26 28 17 16 37 3 11
Salt Marsh 29 52 56 34 34 64 4 14
Rodney Street 31 53 59 104 35 81 5 12
34 Karimpour and Chen (2017)
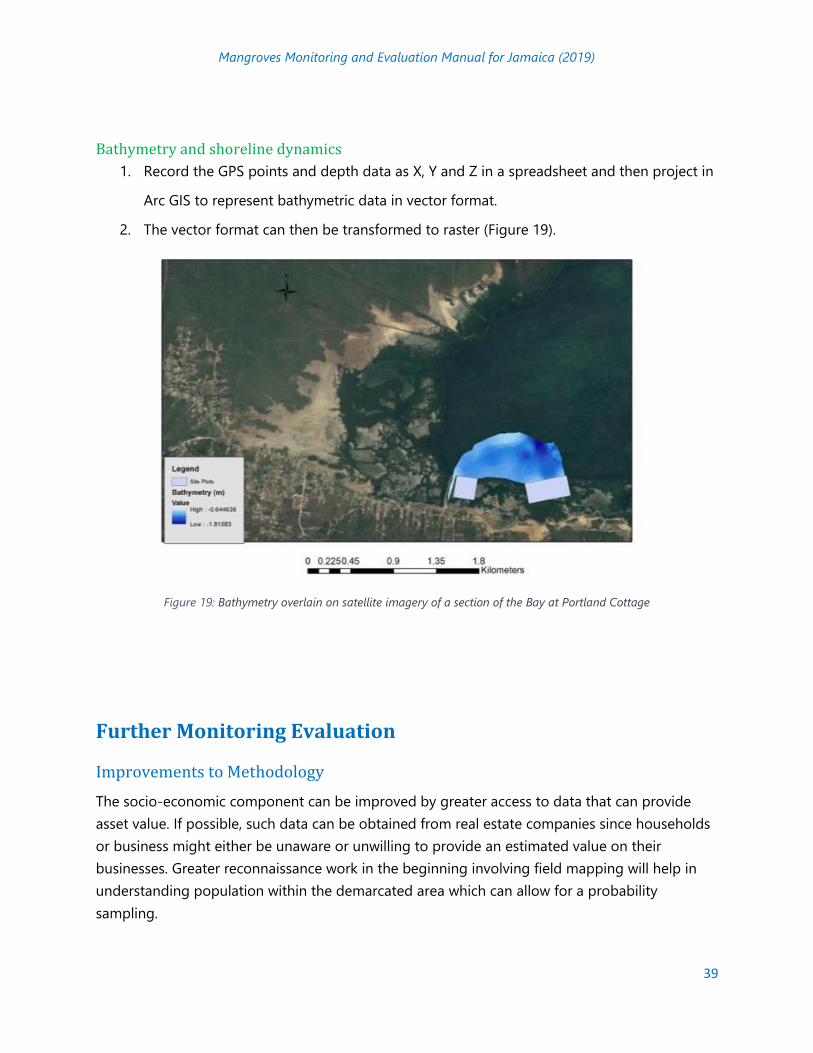
Mangroves Monitoring and Evaluation Manual for Jamaica (2019)
39
Bathymetry and shoreline dynamics
1. Record the GPS points and depth data as X, Y and Z in a spreadsheet and then project in
Arc GIS to represent bathymetric data in vector format.
2. The vector format can then be transformed to raster (Figure 19).
Figure 19: Bathymetry overlain on satellite imagery of a section of the Bay at Portland Cottage
Further Monitoring Evaluation
Improvements to Methodology
The socio-economic component can be improved by greater access to data that can provide
asset value. If possible, such data can be obtained from real estate companies since households
or business might either be unaware or unwilling to provide an estimated value on their
businesses. Greater reconnaissance work in the beginning involving field mapping will help in
understanding population within the demarcated area which can allow for a probability
sampling.

Mangroves Monitoring and Evaluation Manual for Jamaica (2019)
40
It would have been valuable to obtain information from fishers within the various communities
to allow for greater understanding of fish data and value. A household survey geared towards
household heads or a respondent who can provide information on the household can still result
in gaps where that respondent is unable to provide valuable and necessary information as it
relates to fish livelihoods.
For the ecological and physical components drones can be used in reconnaissance visits to
determine discontinuity in the forest for efficient placement of transects and plots. Furthermore,
reconnaissance can be designed so as to provide details of zonation; transition and type of
zones. The benchmark was designed for continued monitoring of vertical sediment accretion or
erosion in wetlands, however, the horizon markers are not expected to last as long either due to
burrowing organism or in-between cycles of erosion. Therefore, new horizon markers should be
installed over time at the sites to sustain continued monitoring and usefulness of the
benchmark.
A real time kinematic global positioning system set up could be used in conjunction with the
sediment elevation analysis to demarcate the topography more efficiently, however they are
exceptionally expensive and may not be practical to rent or borrow for mangrove sites in
Jamaica.
There are some limitations associated with this manual. The first limitation is that the
components are multi-disciplinary and advanced, therefore, replication will need a team of
specialist dedicated to using this manual in conjunction with other material such as the
references provided. The foregoing is because the document length is restrictive and cannot
capture all of the considerations taken for each site and methods and analysis used or tweaked
in acquiring relevant data that will be presented in the results for the PROFOR project. The team
can almost always find less advanced or more advanced methods and that will be dependent on
the needs of those who would wish to replicate the methods, the budget available, the length of
monitoring, or what is accepted in peer review process which is always changing as continued
research either methods to be less ideal or more superior. Furthermore, sites tend to differ from
each other in unique ways and may affect the usefulness of the methodology, or how they need
to be executed. Additionally, the availability of material for the methods may vary from region to
region, for example, most of the references used feldspar powder for the horizon markers, that
product was not available here in Jamaica and our budget did not allow us to consider shipping
it to Jamaica, we initially thought of using thin-set (used in tiling), but the colour of the type we
got did not stand out enough as a suitable long term horizon marker and we modified for that
by using white lime instead.

Mangroves Monitoring and Evaluation Manual for Jamaica (2019)
41
What to do with the information
The socio-economic component can provide some context to the communities under
investigation by looking at their characteristics. It can be used in collaboration with the physical
data to assess communities’ level of vulnerability to coastal flooding. Communities’ knowledge
and awareness of the mangrove changes and the reasons behind these can be used to support
the changes identified through the ecological component. Also, of great importance, is the value
of the mangroves and the opportunities for private/public partnerships in restorative efforts.
This will support both physical and ecological data.
With regards to the ecological section, the attempt is to correlate ecological parameters with the
physical parameters. For example, do the number of trees correlate with soil surface elevation or
any other physical parameter? The level of forest disturbance (garbage pollution etc.) could also
be explained by socio economic data collected.
The socio-economic data, together with the ecological and physical data sets are complimentary
in evaluating ecosystem services provided by mangroves to the communities in their vicinity.
With baseline data, several hypotheses can be tested regarding processes in mangrove strands
and indices can be created for use as inputs for models to determine vulnerability and any other
desirable query. The results of this study can also be used for comparison with other sites that
will be studied in the future.
Linkages to other Economic Values
The geophysical and ecological information collection while useful on its own can be used along
with social and economic information to demonstrate the importance of mangroves to people.
In some instances, the biophysical information can be used to model potential benefit streams
to a variety of beneficiaries including people directly dependent on the mangroves and wider
national or global society. The economic linkages that can be explored are in addition to the
benefits associated with damage reduction. These include benefits associated with climate
regulation (carbon sequestration), contribution to nearshore fisheries, contribution to soil
stabilization and reduced erosion as well as possible water quality improvements. Some of these
are discussed below.
In addition, an example of economic values of coastal resilience services provided by
mangroves, including: coastal flood risk reduction, fisheries provision, erosion control, carbon
sequestration, among others, could be found in the final report of the PROFOR funded
“Assessment and economic valuation of coastal protection services provided by mangroves in
Jamaica”. For more information please contact NEPA and/or ODPEM for details.
Mangroves Monitoring and Evaluation Manual for Jamaica (2019)
42
Economic Value of Carbon Sequestration
One of the major ecosystem services associated with mangrove forests are their ability to trap
and sequester carbon dioxide which is a known green-house gas. Sequestering carbon has an
economic value linked to the savings from removing a unit of CO2 from the atmosphere. This
value is typically expressed in the market or through other calculations such as the social cost of
carbon35. The PROFOR study collected some site-specific information on carbon stock
(including flux) in three areas: Portland Cottage, Bogue Lagoon, and Saltmarsh in Falmouth. It
would be beneficial for future efforts to expand the spatial coverage of sampling. This might be
through increased number of soil cores or wider distribution of the instruments used to measure
sub surface carbon stocks. Simultaneously, a representative sample of mangrove units should
be taken that provides a representative distribution of aboveground biomass. The combination
of above and below-ground soil carbon stocks should improve the site level accuracy of carbon
stock. This may also assist in improving the global scale models that are being used for
calculating sequestration rates. With more accurate site level carbon stock estimates these can
be used to calculate the economic benefits of CO2 removal from the atmosphere. There are
recent publications that present updated methods for measuring carbon36. To improve the site
level information on carbon stock at these side these comprehensive approaches should be
considered. The literature on the social cost of carbon has also advanced with some recent
theoretical contributions37. These recent approaches take into consideration how the social cost
of carbon may differ between developed and developing countries. Social cost of carbon
estimates should include factors such as appropriate discount rates, uncertainty and variable
time scales.
Fisheries economic values
The current analysis has two components currently that could be linked to fishing benefits. This
includes data on commercially important larval fish species (light trap analysis) and some
information from the household surveys indicating frequency of harvesting and consumption.
For this project one of the main gaps is how larval fish information be incorporated into models
that can then be used to provide estimates of contribution to commercial catch (of adults).
This information could be more beneficial if it was combined with simultaneously collected
biological data the corresponding adult species using appropriate fish census techniques. This
may require a combination of fish counts (adapted for mangroves) in conjunction with other
traditional in-water fish census techniques including belt transects (AGGRA and others) and/or
35 Tol (2000) 36 UNEP (2011); Lopez and Nespa (2015); FAO (2016) 37 Tol (2018)

Mangroves Monitoring and Evaluation Manual for Jamaica (2019)
43
stationary counts38. Biological sampling of harvestable adults that utilize mangroves and
associated ecosystems (seagrass beds and coral reefs) should generate data that can then be
extrapolated into estimates of economic contributions. Larval and fish census data thus
improving the models of mangrove nursery contribution to nearshore fisheries. Recent work
provide some additional information that could be used to develop more locally appropriate
models of fish productivity39. This will require improved site-specific information on commercial
or artisanal catch information. Another data gap is information related to mangrove crab harvest
and other invertebrates such as oysters. It is necessary to paint a complete picture of biomass
harvested from these mangrove systems. Even if it is difficult to assign monetary values to this
data it can be used to demonstrate the role mangroves play in providing a source of protein
source, contributions to subsistence diets and/or supplementary income. Some of this
information should be cross-referenced with the community survey data collected in the
socioeconomic survey component.
One key component that may be outside the control of the research team is the collection of
relevant catch data (per unit effort, species targeted, sales etc.) from fishers who operate from
beaches that may benefit from the nursery role of the corresponding mangrove forests. This
may require national collection by the Fisheries Division or a specific data collection exercises
supported by other means. Data collection could be restricted to species (fin and shellfish) that
require or depend on mangrove habitats for a significant phase of their life cycle. Collection of
these types of data (larval, household dependence, commercial catch) will provide a more
comprehensive picture of the economic importance of mangrove dependent fish species. This
data may also be critical for improving the accuracy of other bio-economic models that have
been previously used for other sites40.
Economics of shoreline stabilization
Combining information on nearshore oceanography (wind, waves), root density (prop roots and
pneumatophores) and historical data on erosion and accretion can be used to reflect the role
mangrove forests can play in securing infrastructure in the coastal zone. This includes the
economic benefits of reducing soil erosion on household stock and municipal infrastructure
such as roads and bridges. Additional information that would be needed is access to high
resolution areal imagery remote sensing data, information on property values as well as the cost
of capital infrastructure projects such as road repairs, seawall construction to name a few. Data
that includes root density, hydrodynamic conditions and other factors can be used to improve
38 Bohnsack and Bannerot (1986) 39 Hutchinson (2014) 40 UNEP (2011)

Mangroves Monitoring and Evaluation Manual for Jamaica (2019)
44
site level predictive models and generate more specific rates of erosion or accretion. Models
with predictive power can thus be linked to market based economic information such as the
cost of construction of coastal protection systems or benefits of avoided damage to personal or
commercial property. A range of market comparison methods can be used to provide economic
information that outlines savings (personal or municipal) when natural infrastructure
mechanisms are used in lieu of maintenance costs for the upkeep of hard or grey infrastructure.
Water Quality
This particular regulating ecosystem service of mangroves continues to present a challenge with
respect to converting it into monetizable units that can be directly linked to the ecosystem.
Mangroves role in water purification can be reasonably linked to the protection of seagrass
beds, coral reefs and contributing to maintaining navigable waters by reducing siltation.
However, the direct economic contribution of specific areas of mangroves cannot always be
linked to a particular economic activity (tourism, fishing etc.).
Linking water regulating ecosystem services of mangroves to specific economic values is made
more challenging due to continuing measurement limitations (what water quality parameters to
measure, location etc.). In addition, there is generally lack data availability on these key
parameters among other limitations all with serve to limit application of valuation methods
beyond (damage avoidance) market-based and benefit transfer studies41.
Nevertheless, there are still pieces of information that can improve the state of the literature on
applying water quality economic values to mangrove ecosystem services. The collection of data
on the role that mangroves play in regulating the flow of heavy metals or other toxins into
coastal waters would be potentially useful. This information could be linked to benefits to
human health and seafood safety. Both of which could potentially have economic values
associated with them. Another area of potential investigation is the role that mangrove
ecosystems play supporting fresh water and underground aquifers by preventing saltwater
intrusion. There are studies that have examined the ability of mangroves to reduce saltwater
intrusion42. These studies showed that the level of saltwater intrusion increased when coastal
mangrove forests were degraded. Similar studies could be applied to the Jamaican context and
this information could be then used as part of a market-based approach that compares the
avoided costs of desalination or lost potable water sources to benefits of maintaining
mangroves.
41 Barbier et. al. (2011) 42 Hilmi et. al. (2017)

Mangroves Monitoring and Evaluation Manual for Jamaica (2019)
2
References
Adger, W.N., Paavola, J., Huq, S., 2006. Toward justice in
adaptation to climate change. In: Adger, W.N., Paavola, J.,
Huq, S., Mace, M.J. (Eds.), Fairness in Adaptation to Climate
Change. MIT Press, Cambridge, MA, pp. 1–22
Barbier, E.B. (2016) The protective service of mangrove
ecosystems: A review of valuation methods. Marine Pollution
Bulletin, 109, pp 676-681.
Basha, S.K. (2018) An overview on global mangroves
distribution. Indian Journal of Geo Marine Sciences 47 (04),
pp 766-772
Baptiste, A. and R. Kinlocke (2016) We are not all the same!
Comparative climate change vulnerabilities among fishers in
Old Harbour Bay, Jamaica. Geoforum 73, pp 47-59
Bohnsack, J.A. and Bannerot, S.P. (1986). A Stationary Visual
Census Technique for Quantitatively Assessing Community
Structure of Coral Reef Fishes. NOAA Technical Report NMFS,
41, 1-15.
Cahoon, D.R. and Lynch, J.C. (1997) Vertical accretion and
shallow subsidence in a mangrove forest of southwestern
Florida, U.S.A. Mangroves and Salt Marshes, 1, pp 173 –186.
Cahoon, D.R., Lynch, J.C., Hensel, P., Boumans, R., Perez, B.C.,
Segura, B., Day Jr., J.W. (2002). A device for high precision
measurement of wetland sediment elevation: I. Recent
improvements to the sedimentation-erosion table. J.
Sediment. Res. 72, pp 730–733.
Callaway, J.C., Cahoon, D.R. and James Lynch, C. (2014). The
Surface Elevation Table: Marker Horizon Method for
Measuring Wetland Accretion and Elevation Dynamics. In
Methods in Biogeochemistry of Wetlands, pp 901–17.
Madison, WI: Soil Science Society of America.
Carver, R. (1971). Procedures in Sedimentary Petrology. Wiley
Interscience, New York.
Cintron, G., Novelli, Y., (1984). Methods for studying mangrove
structure. In: Snedaker, S.C., Snedaker, J.G. (Eds.), The
Mangrove Ecosystem: Research Methods. Monographs in
Oceanographic Methodology 8. UNESCO, Paris, pp. 91–113.
Cutter, S.L., Boruff, B.J., Shirley, W.L., 2003. Social vulnerability
to environmental hazards. Social Science Quarterly. 84, 242–
261.
Dahdouh-Guebas, F., Kairo, J.G., De Bondt, R., Koedam, N.,
(2007). Pneumatophore height and density in relation to
micro-topography in the grey mangrove Avicennia marina.
Belg. J. Bot. 140, pp 213–221.
FAO (2007) The World's Mangroves 1980-2005. FAO Forestry
Paper No. 153. Rome, Forest Resources Division, FAO. Pp 77.
FAO. 2016. Mangrove carbon estimator and monitoring guide
Jeremy S. Broadhead, Jacob J. Bukoski and Nikolai Beresnev.
FAO, and IUCN, Bangkok.
Gilman, E., Ellison, J., Duke, N. and Field, C. (2008). Threats to
mangroves from climate change and adaptation options: a
review. Aquatic Botany 89 pp 237–250.
Hahn, M.B., Riederer, A.M., Foster, S.O., 2009. The livelihood
vulnerability index: a pragmatic approach to assessing risks
from climate variability and change—a case study in
Mozambique. Global Environmental Change 1, 74–88.
Hilmi E., Kusmana C, Endang and Suhendang E. (2017).
Correlation Analysis between Seawater Intrusion and
Mangrove Greenbelt. Indonesian Journal of Forestry Research
Vol. 4, No. 2, October 2017, 151-168
Horstman, E.M., Dohmen-Janssen, C.M., Narra, P.M.F., van den
Bergb, N.J.F., M. Siemerink, S.J.M.H.Hulscher (2014). Wave
attenuation in mangroves: A quantitative approach to field
observations. Coastal Engineering 94, pp 47-62.
Hutchison, J; Spalding, M, and zu Ermgassen, P. (2014). The
Role of Mangroves in Fisheries Enhancement. The Nature
Conservancy and Wetlands International. 54 pages.
Jones, D.L. (2006). Design, construction, and use of a new light
trap for sampling larval coral reef fishes. NOAA Technical
Memorandum NMFS-SEFSC-544.
Karimpour, A., and Chen, Q. (2017). Wind Wave Analysis in
Depth Limited Water Using OCEANLYZ, a MATLAB toolbox.
Computers and Geosciences.
Kauffman, J. B., and Donato, D. C. (2012). Protocols for the
Measurement, Monitoring and Reporting of Structure,
Biomass and Carbon Stocks in Mangrove Forests. Working
Paper 86. Bogor: CIFOR.
Kesavan, P.C. and Swaminathan, M., 2006. Managing Extreme
Natural Disasters in Coastal Areas.
Philosophical Transactions: Mathematical, Physical and
Engineering Sciences 364 (1845) pp. 2191-2216
Krauss, K.W., Allen, J.A., Cahoon, D.R., (2003). Differential rates
of vertical accretion and elevation change among aerial root
types in Micronesian mangrove forests. Estuarine, Coastal and
Shelf Science, 56, pp 251-259.
Kumara, M. P., Jayatissa, L.P., Krauss, K.W., Phillips, D.H.,
Huxham, M. (2010). High mangrove density enhances surface
accretion, surface elevation change, and tree survival in

Mangroves Monitoring and Evaluation Manual for Jamaica (2019)
2
coastal areas susceptible to sea-level rise. Oecologia, 164, pp
545-553.
Lopez and Nespa. (2015). Carbon Storage: Utilizing Carbon-
Based Modeling for Mangrove Restoration Efforts. Marismas
Nacionales, Mexico. Pronatura Noroestes & Ecologists
Without Borders.
McKee, K.L., Rooth, J.E., and Feller, I.C. (2007). Mangrove
recruitment after forest disturbance is facilitated by
herbaceous species in the Caribbean. Ecological Applications
17 pp 1678-1693.
Munro, J.L., Gaut V.C., Thompson, R., Reeson O.H. (1973). The
spawning seasons of Caribbean reef fishes. Fish biology. 5 (1)
pp 69-84.
Murdiyarso D and Kauffman JB. (2015). Carbon stocks
assessment in mangroves [PowerPoint presentation]. In:
SWAMP toolbox: Theme C section C3. Retrieved from
www.cifor.org/swamp-toolbox.
NEPA (2012). Wetlands Verification St. Ann, St. James,
Hanover, Westmoreland – A reconfirmation exercise.
NEPA (2014). Status of Jamaican Mangroves.
Orencio, P.M., Fujii, M., 2013. An index to determine
vulnerability of communities in a coastal zone: a case study
of Baler, Aurora, Philippines. Ambio 42, 61–71.
PIOJ, ECLAC and UNDP. (2002). Jamaica: Macro-Socio-
Economic Assessment of the Damage Done by Flood Rains
and Landslides May 2002
PIOJ. (2004). JAMAICA Macro-Socio-Economic and
Environmental Assessment of the Damage done by
Hurricane Ivan Sept 10-12, 2004
PIOJ. (2005). Assessment of the Socio-Economic and
Environmental Impact of Hurricanes Dennis and Emily on
Jamaica.
PIOJ. (2005). Assessment of the Socio-Economic and
Environmental Impact of Hurricane Wilma on Jamaica
PIOJ. (2007). Assessment of the Socio-Economic and
Environmental Impact of Hurricane Dean on Jamaica.
PIOJ. (2008). Assessment of the Socio-Economic and
Environmental Impact of Tropical Storm Gustav on Jamaica
PIOJ. (2010). Jamaica Macro Socio-Economic and
Environmental Assessment of the Damage and Loss caused
by Tropical Depression No. 16/Tropical Storm Nicole.
PIOJ. (2012). Jamaica Macro Socio-Economic and
Environmental Assessment of the Damage and Loss Caused
by Hurricane Sandy.
PIOJ. (n.d.). Spatial Boundaries of Jamaica.
Pearson, T.R.H., Walker, S., Brown, S. (2005) Sourcebook for
land use, land-use change and forestry projects. Report from
BioCF and Winrock International. World Bank, Washington
DC.
Polidoro, B.A., Carpenter, K.E., Collins, L., Duke, N.C., Ellison,
A.M., Ellison, J.C., Farnsworth, E.J., Fernando, E.S., Kathiresan,
K., Koedam, N.E., Livingstone, S.R., Miyagi, T., Moore, G.E.,
Nam, V.N., Ong, J.E., Primavera, J.H., Salmo, S.G., Sanciangco,
J.C., Sukardjo, S., Wang, Y., and Yong, J.W.H. (2010). The Loss
of Species: Mangrove Extinction Risk and Geographic Areas of
Global Concern. PLoS ONE 5, 1 – 10.
UNEP. (2011). Economic Analysis of Mangrove Forests: A case
study in Gazi Bay, Kenya, UNEP, iii+42 pp.
Webber, M., Calumpong, H., Ferreira, B., Granek, E., Green, S.,
Renison, R., Soares, M., and J. Kairo. (2016). “Mangroves”.
Chapter 48 in United Nations The First Global Integrated
Marine Assessment: World Ocean Assessment I, pp 877-886.
World Bank. (2016). Managing Coasts with Natural Solutions:
Guidelines for Measuring and Valuing the Coastal Protection
Services of Mangroves and Coral Reefs. M. W. Beck and G-M.
Lange, editors. Wealth Accounting and the Valuation of
Ecosystem Services Partnership (WAVES), World Bank,
Washington, DC.

Mangroves Monitoring and Evaluation Manual for Jamaica (2019)
1
Appendices

Mangroves Monitoring and Evaluation Manual for Jamaica (2019)
2
Appendix 1: Socio-economic Survey Instrument
QUESTIONNAIRE
Name of Community: __________________
Questionnaire ID
1. Residential
2. Commercial if commercial skip to Section C
SECTION A- DEMOGRAPHICS
1. Gender
1. Male
2. Female
2. Please state age ___________________
3. Highest level of educational attainment:
1. No schooling
2. Primary/preparatory
3. All age/Elementary
4. Junior Secondary
5. New Secondary
6. Secondary High
7. Vocational High
8. University
9. Community College
10. Other tertiary
11. Other, please state ____________________
4. Relationship status:
1. Single
2. Common law union
3. Married
4. Divorce
5. Widow
6. Other ______________________
5. How many persons live in the household? ____________
6. How long have you resided in the area? _____________
7. What is the main income source for the household?
1. Paid government employee
2. Paid private employee
3. Unpaid employee in agriculture or any other business
4. Self-employed with paid employees
5. Self-employed without paid employees
6. Remittances
7. Other, please state

Mangroves Monitoring and Evaluation Manual for Jamaica (2019)
3
8. Have you receive any remittances in the last 6 months?
1. Yes
2. No
9. If yes, from where did you receive it?
1. Abroad, please state where _____
2. Same community
3. Outside of your community, please state where ________________
4. Please fill out table on each person living in the household
10. Do you or anyone in the household currently receive any Social Welfare benefits or pension?
1. Yes
2. No
11. If yes, what benefits or pensions? Tick all that apply.
1. Employment related pension
2. National Insurance
3. PATH Program
4. Other Public Assistance/Poor
5. Other (Specify)___________
6. Not Stated
12. Please fill out the necessary information for all members of your household
Househol
d size
Gender of
member
Age of
membe
r
Highest
level of
education
Main
Employme
nt status
(full time,
part time,
self-
employed)
Main
Occupation
Source of
income
other than
occupation
al earnings
Total
Income
past month
per
member
1(respon
dent)
2
3
4
5
13. Was the household able to save from their last month’s income?
1. Yes
2. No
14. Do you have any form of savings in the bank, credit union or any other financial institution?
Please tick all that apply

Mangroves Monitoring and Evaluation Manual for Jamaica (2019)
4
1. Banks
2. Credit Union
3. Partner
4. other financial institutions, please state ___________
15. Do you participate in partner?
1. Yes
2. No
16. Do you have access to subsidies from the government?
1. Yes
2. No
17. Do you have any outstanding loans?
1. Yes
2. No
18. If yes, where did you obtain this loans? Tick all that apply
1. Friends
2. Relatives
3. Banks
4. Credit unions
5. Other, please state _________________
19. What is the purpose of the loan? Tick all that apply
1. Mortgage
2. Borrowed to purchase food
3. Borrowed to pay rent
4. Borrowed to send children to school
5. Other, please state ________________
SECTION B HOUSING CHARACTERISTICS
20. Does any member of your household own, rent or lease this dwelling? 1. Owned 2. Rented 3. Leased 4. Squatted 5. Rent-free 6. Other, please state _______________
21. What about the land- is it owned, leased etc. by any member of the household? 1. Owned 2. Rented 3. Leased 4. Squatted 5. Rent-free 6. Other, please state ________________
22. How many rooms does the household occupy?

Mangroves Monitoring and Evaluation Manual for Jamaica (2019)
5
23. How many rooms are used for mainly sleeping? 24. What does the household used most for lighting?
1. Kerosene 2. Shared electricity 3. Owned electricity 4. Candle 5. Other, please state ___________
25. How does this household obtain water for domestic purposes? Tick all that apply 1. Public piped into dwelling 2. Public piped into yard 3. Private piped into dwelling 4. Private catchment, not piped 5. Public standpipe 6. Public catchment 7. Spring or river 8. Trucked water/water truck 9. Other, please state ___________________
26. Which kind of fuel does this household use most for cooking? 1. Wood 2. LPG 3. Charcoal 4. Kerosene 5. Biogas 6. Solar energy 7. Electric 8. Other, please state ___________________
27. Please fill in the following table to describe your home and assets. Tick where appropriate.
OUTER MATERIALS
ROOF MATERIALS
OTHER PARTS
OF THE HOME
Concrete and blocks
Metal sheeting Landline
Stone and brick
Shingle (Fiber glass) Mobile/Cell
phone
Concrete and wood
Tile (clay) Radio
Wood and brick Tile (other) Television
wood Concrete Personal
computer/laptop
Other, please state Other material
(specify:__________

Mangroves Monitoring and Evaluation Manual for Jamaica (2019)
6
OTHER PARTS OF
THE HOME OTHER PARTS OF
THE HOME Notes:
Kitchen attached to
the house
Inside toilet
Kitchen unattached
from the house
Outside toilet/latrine
Bathroom attached
to the house
Bathroom
unattached from the
house
28. Please tick where appropriate if you have the following household assets
Non-financial Assets
beds
Fridge
Stove
Chair set
Dining table set
Computer or laptop
Motor vehicle
Other
Section C- Commercial Demographics
29. Gender
1. Male
2. Female
30. Please state age ___________________
31. Highest level of educational attainment:
1. No schooling
2. Primary
3. Secondary
4. Tertiary
5. Other, please state ____________________
32. How would you describe your role or function in the business?
1. Owner

Mangroves Monitoring and Evaluation Manual for Jamaica (2019)
7
2. Manager
3. Other, please state ______________
33. How many employees work in the establishment? ____________
34. How long has the business been in operation within the community? _____________
35. What type of business form do you have?
1. Sole proprietorship
2. Partnership
3. Corporation
36. Which of the options below best describes the industry or activities in which your business
operates?
1. Wholesale
2. Craft
3. Hotels/guest house
4. Restaurants
5. Industrial sales and equipment
6. Call Center
7. Other, please state _________________________
37. What would be the value of your business if sold today? $_________________
38. How did you arrive at this value?
1. Formal Appraisal
2. Estimate by Owner
3. Other, please state ____________________________________________________
39. What is your business's most recent annual sales turnover?
1. Less than or equal to US$100 000
2. US$100 000 - 600 000
3. US$600 001 - 1 000 000
4. US$1 000 001 - 1 400 000
5. US$1 400 001 - 1 800 000
6. US$1 800 001 - 2 200 000
7. US$2 200 001 - 2 600 000
8. US$2 600 001 - 3 000 000
9. Greater than US$3 000 000
Section D - Fishing and other livelihoods
40. Do you or any member of your household consume fish as a protein source?
1. Yes
2. No
41. If yes, where do you purchase fish? Tick all that apply
1. In the town
2. At the jetty as soon as the fishers come in

Mangroves Monitoring and Evaluation Manual for Jamaica (2019)
8
3. At the supermarket
4. I receive from family and friends at no charge
5. I catch my own fish
42. What type of fish do you buy for consumption?
1. Snapper
2. Parrot
3. Grunt
4. Other, please state
43. Do you or anyone in your household fish within the community? If no, skip to Section E
1. Yes
2. No
44. If yes, where exactly is your main fishing spot/area?
45. How long have you been fishing in this area?
46. What types of fish do you catch there?
47. Do you fish within the mangrove area?
1. Yes
2. No
48. How often do you fish there?
1. Daily
2. 2X per week
3. 3X per week
4. More than 3X per week
49. What types of fish do you catch in those areas? _________________
50. Besides fish, do you extract any other product from the sea within these mangrove areas?
1. Oysters
2. Shells
3. Shrimps
4. Fish bait
5. Crabs
6. Other, please state _____________
51. What is the purpose of the fish catch? Tick all that apply
1. Home used
2. Commercial use
52. If for commercial use, which fish do you sell commercially? ___________________
53. Where/ to whom do you sell your fish? Tick all that apply
1. Supermarkets
2. Hotels/resorts
3. Restaurants
4. Shops

Mangroves Monitoring and Evaluation Manual for Jamaica (2019)
9
5. Community members
6. Other, please state ____________
54. What is your estimated income from these fish on a weekly basis? ________________
55. How has your income from fishery changed over the past 5 years?
1. Decreased
2. Same
3. Increased
4. Don’t know
56. How has the number of your fish catch changed over the past 5 years?
1. Decreased
2. Same
3. Increased
4. Don’t know
57. Are there any areas that you are prohibited from fishing?
1. Yes
2. No
58. If yes, please state where _______________________________
SECTION E- MANGROVE KNOWLEDGE, USES AND IMPORTANCE
59. Please rate which mangrove ecosystem services are directly important to you? Tick where
applies.
Very
Important
important Neither
important or
unimportant
Not
important
N/A
Aesthetic (Visual) appeal
Fish Habitat
Medicinal value
Source of food
Shoreline protection (from
erosion or storm surges)
Source of wood (fuel)
Source of wood (building
material)
Supporting offshore or
nearshore fisheries
production
Water quality
Wildlife habitat
Carbon store
Cultural value
Mangroves Monitoring and Evaluation Manual for Jamaica (2019)
10
Other, Please state __________________________________________________________
60. Do you earn any other income/ livelihood from services provided by mangroves in your
community? If no, skip to Question 69.
1. No
2. Yes
61. In what other ways (apart from fishing), do you earn an income/livelihood from mangrove? Tick
all that apply
1. Fuel wood
2. Tours through mangrove forest
3. Boat building
4. Making fences
5. Fishing equipment
6. Other, please state _____________________________________________
62. How many years have you been earning an income from mangrove?
63. How has your income from mangrove forest changed over the past 5 years?
1. Decreased
2. Same
3. Increased
4. Don’t know
64. How do you think your income from mangrove forest will change in the next 5 years?
1. Decreased
2. Same
3. Increased
4. Don’t know
65. Which species of mangrove is/are widely used by you for income generating activities? Tick all
that apply.
1. White
2. Red
3. Black
4. Button
66. How many times have you cut down/ gather these mangroves for use in the past month?
1. None
2. 1 to 5X
3. 6 to 10X
4. 11 to 15X
5. Greater than 15X
67. Was mangrove removed for the establishment of your home/ business?
1. Yes
2. No

Mangroves Monitoring and Evaluation Manual for Jamaica (2019)
11
3. Don’t know
68. Rate the extent to which the following issues are having an impact on mangroves in your
community? Tick in the appropriate spaces
This is
having a big
impact
This is having
an impact,
but not big
Not
causing any
damage
Not present
in this area
Deforestation
Overfishing
Illegal fishing
Illegal logging
Waste disposal (garbage, sewage)
Illegal fishpond operation
Shoreline erosion
Illegal cutting/clearing
Shoreline development (reclamation)
Sea level rise
Climate change (more severe drought,
storms, floods)
SECTION F- FLOOD RISK AND COPING CAPACITY
69. Have you experienced any coastal flooding in the community?
1. Yes
2. No
70. If yes, how many times in the past year, have the community flooded?
1. Once a year
2. Two times per year
3. Three times per year
4. Four times per year
5. Five times per year
6. Greater than 5 times per year
71. When was the last time you were affected in anyway by a flood? ____________
72. Did this flooding affect your property? If no, skip to question 70
1. Yes
2. No
73. Did the water enter your house?
1. Water did not enter house

Mangroves Monitoring and Evaluation Manual for Jamaica (2019)
12
2. Water was under the floor boards
3. Water was above floor boards
4. Water was above skirting boards
74. In what other ways, did the last flood affect you? Tick all that apply
1. Could not attend work
2. Children could not attend school
3. Injury to yourself/family members
4. Destroy livelihood equipment (e.g. boats)
5. Destroy crops and livestock
6. Had to relocate permanently
7. Had to relocate temporarily
8. Other, please state _________________
75. Was your house insured against flood damage?
1. Yes
2. No
3. Unsure
76. Do you have any flood defenses in place at your property? Tick all that apply
1. Sandbags
2. Non-return valves
3. Placed home on concrete blocks/stilts
4. Disconnected drainage
5. Floor / door modification
6. Bolted down manholes
7. Other……………………………………………….
8. None
77. Did these help to prevent water entering your house?
1. Yes
2. No
3. Unsure
78. What were the main factors that helped you to recover from the flood? Tick all that apply
1. Savings
2. Remittances
3. Borrowing money from friends and/or relatives
4. Crediting goods from shops or supermarkets
5. Government assistance
6. Sold assets
7. Move to safer place
8. Other, please state ______________________
79. How long did it take you to recover from the impact of the last flood?
1. Less than 1 month
2. 1 to 4 months
3. 5 to 8 months

Mangroves Monitoring and Evaluation Manual for Jamaica (2019)
13
4. 9 months to 1 year
5. Over 1 year
6. I have not recovered.
80. Apart from the last date you experience flood, were there other dates on which you have
suffered flooding? Please list
81. What actions have you taken to minimize the impact of future flood events on your household?
Tick all that apply
1. I have not done anything
2. Relocated
3. Flood proof home (barriers, raise house)
4. Took out Flood insurance
5. Other, please state ______________
SECTION G- MANGROVE MANAGEMENT AND RESTORATIVE EFFORTS
82. How healthy are the mangroves in your area?
1. Very healthy
2. Healthy
3. Average
4. Unhealthy
5. Very unhealthy
6. Don’t know
83. Based on your experience, what changes, if any, have you observed in the extent of the
mangrove forest over the last 30 years?
1. Decline
2. Increase
3. No change
4. Don’t know
84. If you believe that some change has occurred, what do you think is responsible for the observed
change identified above? ____________________________________
85. Are you aware of any illegal or destructive activities in the mangrove forest of your community?
1. Yes
2. No
3. Don’t know
86. If yes, what activities are these? Tick all that apply
1. Illegal fishing
2. Illegal logging
3. Garbage/solid waste dumping
4. Sewage waste
5. Theft
6. Illegal fishpond operation
7. Other, please state ________________

Mangroves Monitoring and Evaluation Manual for Jamaica (2019)
14
87. How well are mangroves managed in your area?
1. Excellently
2. Adequately
3. Could be better
4. Not very well managed
5. No management
88. Who are currently responsible for the management of mangroves in your area?
1. Government
2. Community members
3. Private organisation, Please state which ___________
4. Non-governmental organisation, please state which _______
5. Other, please state _____________
6. No one
7. Don’t know
89. How can we ensure mangroves are better protected and maintained in your community? Tick all
that apply
1. Engaging community members
2. Fines or penalties for damaging mangroves
3. Community education
4. On gound works (fencing, groynes)
5. Planting/Replanting mangroves
6. Long-term monitoring programs
7. Restoration and rehabilitation programs
8. Policies for mangrove protection
9. Enact laws for mangrove protection
10. More research on local mangroves
11. Educating local government
12. Other, please state___________________________________
90. Are you aware of any initiatives designed to improve the condition of/restore mangroves in your
area?
1. Yes
2. No
91. Are you currently involved in mangrove restorative activities?
1. Yes
2. No
92. If yes, what some of these activities you participated in? Tick all that apply
1. Planting/Replanting mangroves
2. Community education
3. Research
4. Other, please state __________________________________________
93. Are you willing to be a part of mangrove restoration efforts?
1. Yes 2. No
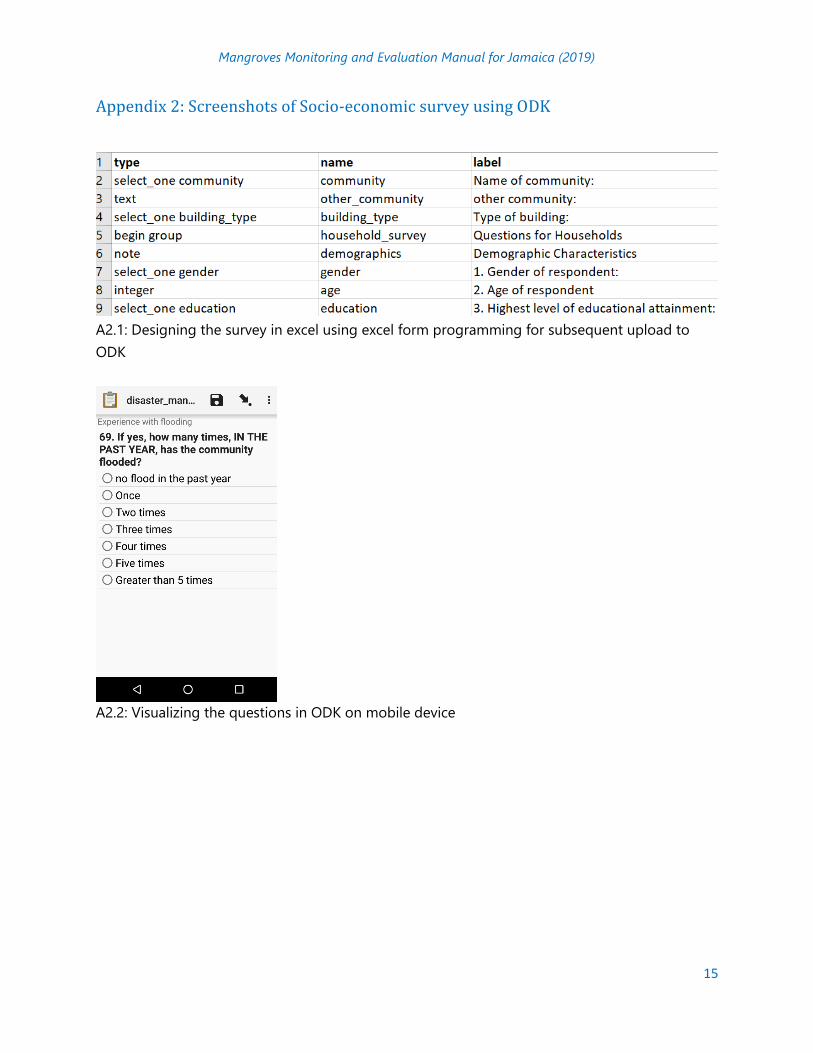
Mangroves Monitoring and Evaluation Manual for Jamaica (2019)
15
Appendix 2: Screenshots of Socio-economic survey using ODK
A2.1: Designing the survey in excel using excel form programming for subsequent upload to
ODK
A2.2: Visualizing the questions in ODK on mobile device
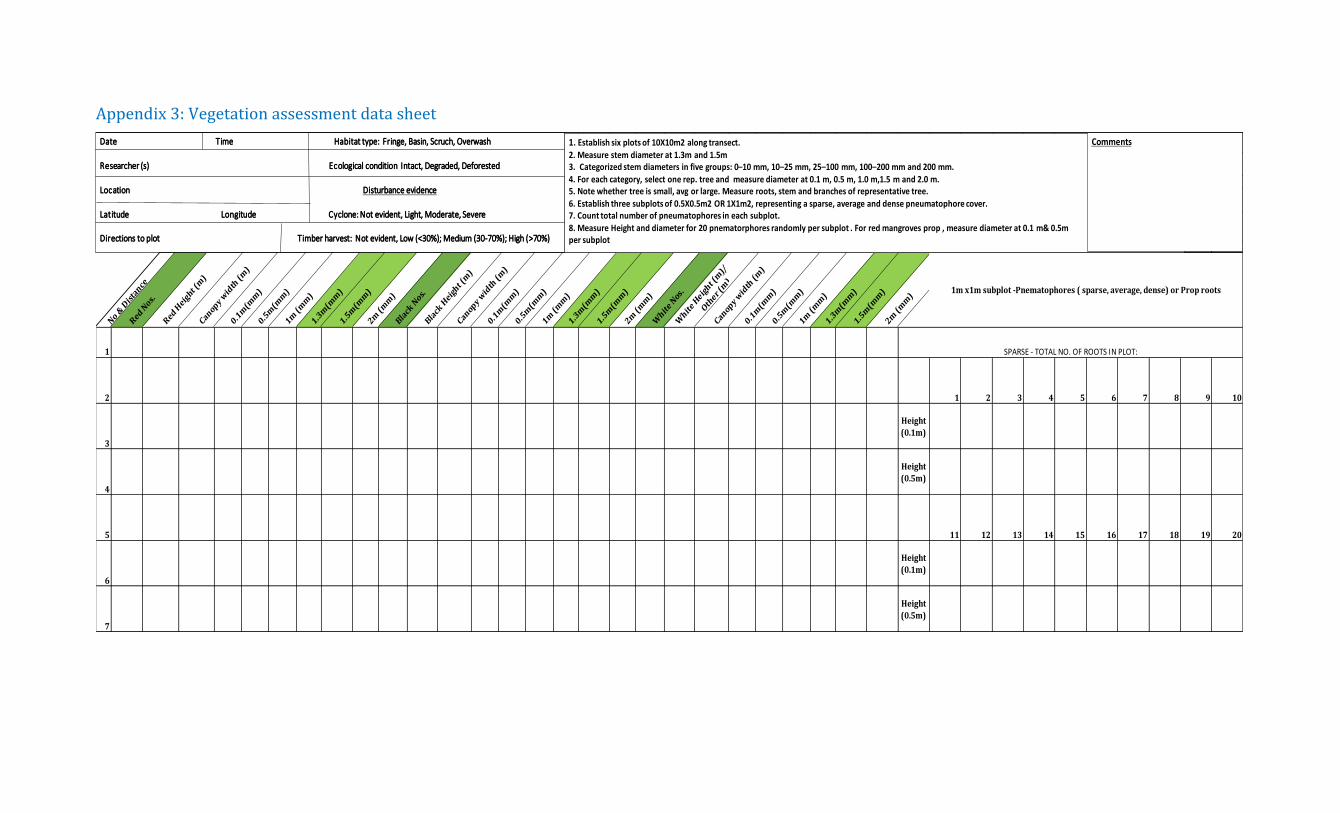
Appendix 3: Vegetation assessment data sheet
No &
Dis
tance
Red N
os.
Red H
eight (
m)
Canopy wid
th (m
)
0.1m
(mm
)
0.5m
(mm
)
1m (m
m)
1.3m
(mm
)
1.5m
(mm
)
2m (m
m)
Black
Nos.
Black
Heig
ht (m
)
Canopy wid
th (m
)
0.1m
(mm
)
0.5m
(mm
)
1m (m
m)
1.3m
(mm
)
1.5m
(mm
)
2m (m
m)
Whit
e Nos.
Whit
e Heig
ht (m
)/
Oth
er (m
)
Canopy wid
th (m
)
0.1m
(mm
)
0.5m
(mm
)
1m (m
m)
1.3m
(mm
)
1.5m
(mm
)
2m (m
m)
1
2 1 2 3 4 5 6 7 8 9 10
3
Height
(0.1m)
4
Height
(0.5m)
5 11 12 13 14 15 16 17 18 19 20
6
Height
(0.1m)
7
Height
(0.5m)
1m x1m subplot -Pnematophores ( sparse, average, dense) or Prop roots
SPARSE - TOTAL NO. OF ROOTS IN PLOT:
Date Time Habitat type: Fringe, Basin, Scruch, Overwash
Researcher (s) Ecological condition Intact, Degraded, Deforested
Location Disturbance evidence
Latitude Longitude Cyclone: Not evident, Light, Moderate, Severe
Directions to plot Timber harvest: Not evident, Low (<30%); Medium (30-70%); High (>70%)
1. Establish six plots of 10X10m2 along transect.2. Measure stem diameter at 1.3m and 1.5m3. Categorized stem diameters in five groups: 0–10 mm, 10–25 mm, 25–100 mm, 100–200 mm and 200 mm.
4. For each category, select one rep. tree and measure diameter at 0.1 m, 0.5 m, 1.0 m,1.5 m and 2.0 m.5. Note whether tree is small, avg or large. Measure roots, stem and branches of representative tree.6. Establish three subplots of 0.5X0.5m2 OR 1X1m2, representing a sparse, average and dense pneumatophore cover. 7. Count total number of pneumatophores in each subplot.
8. Measure Height and diameter for 20 pnematorphores randomly per subplot . For red mangroves prop , measure diameter at 0.1 m& 0.5m per subplot
Comments

Mangroves Monitoring and Evaluation Manual for Jamaica (2019)
17
Appendix 4: Reconnaissance data sheet
Reconnaissance Data sheet for Transect/ Vegetation plot placement
Date________________________ Time_________________________
Site _________________________ Researchers_________________________
Name of Transect/ Transect No._________________
Transect/Plot position
Description GPS Coordinates -N GPS Coordinates -W
Other Notes
Sketch of zonation pattern with distance

Mangroves Monitoring and Evaluation Manual for Jamaica (2019)
18
Appendix 5: Benchmark Set Up Sheet
Castaño-Isaza