
Mangalore Refineries & Petrochemicals Nirmal...
20
Transcript of Mangalore Refineries & Petrochemicals Nirmal...


Please refer to the disclaimer towards the end of the document.
Institutional Equities
Initi
atin
g C
over
age
Reuters: MRPL; Bloomberg: MRPL IN
Mangalore Refineries & Petrochemicals
Headwinds Priced In, Tailwinds Being Ignored Mangalore Refineries & Petrochemicals (MRPL) is all set to join the club of complex refiners by September 2013, but its stock price plummeted 20% since the beginning of 2013 due to: (1) The US-led sanctions against Iran leading to a sustained decline in crude oil sourcing by the company from its chief supplier, (2) Delay in full commercial operations of expanded capacity under phase III, and (3) The government mulling product pricing for refiners on the basis of export parity. We, however, believe that all negatives have been priced in and the stock offers great value for long-term investors - in terms of valuation as well as earnings growth. We have assigned a Buy rating to MRPL with a target price of Rs69 to reflect: (1) Attractive valuation at 1.1x FY14E P/BV (below 1SD from the mean), (2) The Nelson complexity index rising to ~10 from 5.0 before the expansion, (3) Likely increase in gross refining margin (GRM) by US$3-US$4/bbl from 1QFY15E, and (4) Expansion project execution risk receding as the secondary units are expected to come on stream by September 2013.
Refinery complexity to show full potential from September 2013: Commercial operations of secondary units under the phase III expansion have been delayed on account of external and internal problems of MRPL. Our channel checks and interaction with the management revealed that the project is 98% mechanically complete and the full potential of the expansion would be felt by July-August 2013. The most critical element for commissioning of secondary units, the captive power plant, is already generating ~20MW from Unit I and is likely to touch 116MW by mid-September 2013. The mechanical commencement of DCU (delayed coker unit) has taken place and its pre-commissioning is expected to start soon. The polypropylene unit is likely to go on stream by the end of October 2013. We have factored in the impact of full commissioning of the expanded capacity to show results from 4QFY14 with a throughput of 14.5mt/15.30mt/15.30mt for FY14E/FY15E/FY16E.
Sustained decline in crude oil sourcing from Iran: MRPL enjoyed the advantage of ~90-day credit facility from Iran, which boosted its GRM by US$1/bbl. Our GRM estimate considers negligible value from this facility. MRPL is aggressively changing its crude oil basket by replacing Iranian crude with crude from Oman, Dubai and Venezuela. The usage of Iranian crude oil dropped from 124kbpd in FY12 to ~76kbpd in FY13E. The management sees no risk to its throughput guidance in the event of stopping Iran crude oil imports completely, although such a scenario is unlikely. The Petroleum and Natural Gas minister recently said the government has no intention to stop crude oil imports from Iran and it plans to create Rs20bn energy insurance pool to resolve the insurance predicament facing Indian refiners.
Outlook and valuation: We have assigned a Buy rating to MRPL with a target price of Rs69 to reflect: (1) Attractive valuation of 1.1x FY14E P/BV (below 1SD from the mean), (2) Negatives from Iran crude oil exposure priced into our GRM assumption, assigning zero value to the increased credit facility benefit, (3) Completion of phase III expansion after a nearly 24-month delay (4) Benefits of higher complexity level likely to reflect from 4QFY14, and (5) The stock price implying a 23% discount to India refinery replacement value and a 45% discount compared to global refiners.
BUY
Sector: Oil & Gas
CMP: Rs48
Target Price: Rs69
Upside: 43%
Ashutosh B [email protected] +91 22 3926 8110
Vivek Sarin [email protected] +91 22 3926 8176
Key Data
Current Shares O/S (mn) 1752.6
Mkt Cap (Rsbn/US$bn) 85.6/1.6
52 Wk H / L (Rs) 74/48
Daily Vol. (3M NSE Avg.) 390,321
Shareholding (%) 4QFY13 3QFY13 2QFY13
Promoter 88.6 88.6 88.6
FII 1.1 0.9 1.0
DII 2.9 2.9 2.7
Corporate 1.0 1.1 1.2
General public 6.6 6.6 6.5
One Year Indexed Stock Performance
Price Performance (%)
1 M 6 M 1 Yr
MRPL (2.8) (25.6) (21.7)
Nifty Index 1.6 2.7 9.5
Source: Bloomberg
Y/E March (Rsmn) FY11 FY12 FY13E FY14E FY15E
Net sales 388,869 537,703 658,531 696,036 619,821
YoY (% ) 21.7 38.3 22.5 5.7 (10.9)
EBITDA 20,483 16,366 9,647 22,782 34,493
EBITDA margin (%) 5.3 3.0 1.5 3.3 5.6
Net profit 11,766 9,086 (3,097) 7,095 15,429
EPS 6.21 4.94 (1.77) 4.05 8.80
RoAE (%) 19.4 13.2 (4.4) 9.9 19.1
RoACE (%) 13.5 7.3 (16.0) 5.5 10.6
P/E (x) 7.9 9.9 (27.7) 12.1 5.6
EV/EBITDA (x) 3.9 9.0 16.1 6.9 4.2
Source: Company, Nirmal Bang Institutional Equities Research
70
80
90
100
110
120
Apr-12 Jun-12 Aug-12 Oct-12 Dec-12 Feb-13 Apr-13
MANGALORE REFINE NSE CNX NIFTY INDEX
29 April 2013

Institutional Equities
2 ONGC Mangalore Refineries & Petrochemicals
Increased Nelson complexity to expand GRM Post phase III expansion, Nelson complexity would increase to ~10 from 5.0 pre-expansion, leading to higher distillate yield of ~80% from 73% earlier, on the back of commencement of secondary units and the polypropylene unit. We expect the GRM to improve by US$3.5-US$4.0/bbl on the cumulative effect of higher TAN crude oil processing ability, higher distillate yield, savings from SPM (single-point mooring) and earnings from the polypropylene unit, although the total effect would be pruned by US$1.5/bbl after considering the impact of Iran crude oil sourcing and export parity pricing. We have assumed GRMs at US$3.80/US$5.75/US$7.0 for FY13E/FY14E/FY15E, respectively.
Phase III expanded capacity likely to come on stream in September 2013
The phase III expansion, which was scheduled to start in October 2011 but was delayed due to several external and internal problems, is now likely to begin from September 2013. Equipment constraints in respect of the captive power plant have been resolved by Bharat Heavy Electricals’ (BHEL) and one unit of the power plant has already starting operations by generating 20MW and is likely to produce entire 116MW by September 2013. All secondary units, SPM and the polypropylene unit are expected to be operational by Oct 2013.
We have considered Brent crude oil price estimates of US$110/US$105/US$100 for FY13E/FY14E/FY15E, respectively, and India rupee-US dollar exchange rate of Rs54.5/Rs52.0/Rs51.0 per $ for FY13E/FY14E/FY15E, respectively, which leads to the decline in revenue for FY15E despite higher throughput and expanding GRM.
Exhibit 1: One-year forward P/BV Exhibit 2: One-year forward average P/BV
Source: Bloomberg, Nirmal Bang Institutional Equities Research Source: Bloomberg, Nirmal Bang Institutional Equities Research
0.8
1.3
1.8
2.3
2.8
3.3
3.8
Ap
r-0
9
Jun
-09
Au
g-0
9
Oct
-09
De
c-0
9
Fe
b-1
0
Ap
r-1
0
Jun
-10
Au
g-1
0
Oct
-10
De
c-1
0
Fe
b-1
1
Ap
r-1
1
Jun
-11
Au
g-1
1
Oct
-11
De
c-1
1
Fe
b-1
2
Ap
r-1
2
Jun
-12
Au
g-1
2
Oct
-12
De
c-1
2
Fe
b-1
3
Ap
r-1
3
(x)
Current P/BV Avg.P/BV 1SD 2SD -1SD -2SD
0
20
40
60
80
100
120
140
160
Ap
r-1
1
Ma
y-1
1
Jun
-11
Jul-1
1
Au
g-1
1
Se
p-1
1
Oct
-11
No
v-1
1
De
c-1
1
Jan
-12
Fe
b-1
2
Ma
r-1
2
Ap
r-1
2
Ma
y-1
2
Jun
-12
Jul-1
2
Au
g-1
2
Se
p-1
2
Oct
-12
No
v-1
2
De
c-1
2
Jan
-13
Fe
b-1
3
Ma
r-1
3
Ap
r-1
3
(Rs)
Max 3.4x Min 1.2x Avg 2.0x 1.6x 2.7x Daily price

Institutional Equities
3 ONGC Mangalore Refineries & Petrochemicals
Investment Arguments
Refinery entering complexity league
Post phase III expansion, MRPL’s refinery throughput is expected to increase to 15.0mt from 11.8mt before expansion and upgradation. Our channel checks and interactions with the management indicate that the phase III expansion project is 98% mechanically complete and is expected to be commissioned by July-August 2013, with most secondary units and the polypropylene unit set to commence commercial operations by October 2013. We expect the full benefits from expanded capacity to commence from 4QFY14. We have projected refinery throughput at 14.5mt/15.3mt/15.3mt for FY14E/FY15E/FY16E, respectively, which implies refinery capacity utilisation of 102% for all respective years compared to the past five years’ average of 110%. The management has given guidance of refinery throughput at 14.5mmt for FY14E.
Exhibit 3: Refinery throughput and capacity utilisation
Source: Company, Nirmal Bang Institutional Equities Research
Exhibit 4: Phase III expansion project and current status
Unit Capacity Status of commissioning
CDU/VDU (crude oil distillation unit/vaccum distillation unit)
3 mmtpa Commissioned in March 2012
PFCC(petro fluidised catalytic cracking) 2.2 mmtpa Likely to be commissioned by September 2013
DCU(Delayed coker unit) 3 mmtpa Mechanical completion done, pre-commissioning phase to
begin in September 2013
DHDT(diesel hydro-treating unit) 3.7 mmtpa Commissioned in November 2012
CHT(coker heavy gas oil hydro-treating unit) 0.65 mmtpa Likely to be commissioned in July 2013
Hydrogen generation unit (HGU) 70 ktpa Commissioned in April 2012
Sulphur recovery unit 3*185tpd Train 1 commissioned, rest two trains to be commissioned by
August 2013
ATF treatment unit 70tph -
Polypropylene unit 0.44 mmtpa Likely to be operational in October 2013
Captive power plant 118MW Currently generating 20MW, rest of the units to operational
by September 2013
Tankage 23 nos. -
Mounded bullets 04 nos. -
Source: Nirmal Bang Institutional Equities Research
0
20
40
60
80
100
120
140
0
2
4
6
8
10
12
14
16
18
FY08 FY09 FY10 FY11 FY12 FY13E FY14E FY15E
(%)(mmt)
Installed capacity Crude oil throughput Utilisation rate (RHS)

Institutional Equities
4 ONGC Mangalore Refineries & Petrochemicals
Exhibit 5: Refinery expansion - Main contractors
Contractor Project undertaken
Technip Design, engineering, supply and installation of fired heater in major units
Jacobs Providing EPC management consulting service for CDU/VDU project
Toyo Engineering EPC contract on lumpsum turnkey basis for setting up the BoP of delayed coker unit
Larsen & Toubro Design, detailed engineering procurement, supply, construction, installation, testing and commissioning of
diesel hydro-treating unit, and hydrogen generation unit
Punj Lloyd Construction of petro fluid catalytic cracking unit
Maire Technimont Heavy coker gas oil hydro-treating unit
Source: Nirmal Bang Institutional Equities Research
Post phase III expansion, which comprises installation of secondary units (to enhance distillate yield) and the polypropylene unit, the Nelson complexity index would increase to ~10.0 from 5.0 currently. The expansion in Nelson complexity index and synchronisation of the polypropylene unit will result in US$3.5-US$4.0/bbl expansion in GRM. Despite attractive valuation, the market has been apprehensive about the stock on account of execution risks in phase III expansion, which has been delayed by almost 24 months. As per the original schedule, Phase III expansion project was supposed to commence from October 2011, but a host of external and internal problems led to the delay. The reasons cited were BHEL’s inability to deliver necessary equipment for the captive power plant and also the emergence of labour problems subsequently.
Our channel checks and interactions with the management indicate that all secondary units under the expansion project would start operations in July-August 2013, with the polypropylene unit expected to start operations in October 2013. BHEL has delivered all units of the captive power plant (CPP), which is already generating 20MW and is likely to touch 116MW by the end of September 2013. Clarity emerging on commissioning of the power plant raises the likelihood of phase III expansion project being commissioned, as being an integrated operation the power plant would facilitate co-generation of power and steam.
Post expansion, the distillate yield would increase to ~80% from 73% prior to expansion. As of 3QFY13 end, the refiner witnessed distillate yield of 76.8% from 75.3% a quarter ago. MRPL expects to commission the project in July-August 2013, with the plant integration likely to be complete by September 2013. As the time lag between the trial run and commercial production would be around one month, the full impact of the expansion would be witnessed only from 4QFY14.
Exhibit 6: Refinery expansion update
3QFY12 4QFY12 1QFY13 2QFY13 3QFY13 4QFY13
Refinery commissioning
Percentage completion 91.5 94.7 95.4 96.4 97.8 98.0
Commissioning guidance Likely to be
commissioned by 15 January 2012
Likely to be commissioned by 15
May 2012 - - - -
Polypropylene unit
Percentage completion 74.3 - 81.6 83.5 85.0 -
Commissioning guidance To be operational by
15 January 2012 Likely completion by
December 2012 -
To be operational by January -
February 2013 -
Commissioning likely by October
2013
CDU/VDU/CHDT
Commissioning guidance Mechanical
completion by March 2012
CDU/VDU commissioned in March 2012, Diesel
hydro-treater and hydrogen-treater to be
commissioned, last unit to be completed by
October 2012
Hydrogen unit completed and
DHDT is nearing completion
DHDT to be completed by the
second week of November 2012
DHDT completed -
Single-mooring project
Commissioning guidance VLCC tanker to be
taken on charter by May 2012
Completion by July 2012 94.6% complete, to be operational by August 2012
96.7% completed, to be operational by November 2012 by
taking on charter Aframax, Suezmax
vessels
Trial operation on 3 January 2013, expected to be
fully operational by February 2013
Likely to start operations from 15
May 2013, full impact of SPM after ISRL builds 48”sub-
sea pipeline
Source: Stock exchange filings, company

Institutional Equities
5 ONGC Mangalore Refineries & Petrochemicals
Looking to aggressively expand its crude oil basket beyond Iran
After the US and the EU imposed sanctions on Iran, MRPL reduced crude oil sourcing from Iran. MRPL met ~55.0%-58.0% of its crude oil requirement from Iran in FY11, which declined to ~48.0% in FY12 and is likely to touch 26.5% in FY13E. Iranian crude oil provided MRPL with the twin benefits of a long-term arrangement for crude oil sourcing along with a 90-day credit period, leading to a positive impact on its GRM by ~US$1/bbl.
We believe the continuous decline in MRPL’s stock price factors in the impact on its GRM following sanctions on Iran. The company is aggressively looking at replacing its crude oil basket with crude from Oman, Dubai, Saudi Arabia and Venezuela. The management is confident that there will be no risk to its FY14 throughput guidance even if crude oil sourcing from Iran is stopped altogether. The street’s sensitivity to crude oil sourcing appears exaggerated as there is no dearth of suppliers, given the general supplier credit period of 25-30 days. Given that post expansion, MRPL will be able to process higher acid crude, it will have the liberty to source more grades of crude oil (particularity lower API and higher sulphur content oil). MRPL’s refinery would be able to source crude oil grades up to 28 API compared to 33.7 before the phase III expansion.
Our interaction with MRPL’s management and the MoPNG (Ministry of Petroleum & Natural Gas) reveals slim chances of Iran crude oil sourcing coming to a grinding halt. In February 2013, Indian refineries imported close to 259,000bpd of crude oil from Iran, down 43% from same month a year ago, although the government planned to import 310,000 bpd of crude oil from Iran in FY13. Indian refineries ‘usage of crude oil from Iran reduced to 7.3% in FY13 from 11.0% in FY12. Despite global pressure, the government plans to import ~124,000 bpd of Iranian crude oil in FY14E. MRPL is likely to import ~35,000bpd-40,000bpd of Iranian crude oil in FY14E and the government is preparing a Rs20bn Energy Insurance Pool (EIP) to back Indian firms that insure domestic refineries processing Iranian crude oil. For claims beyond Rs20bn, the government would extend sovereign guarantee up to Rs100bn.
Exhibit 7: Crude oil sourcing beyond Iran
Bought around 650,000bbl of upper Zakum grade during May 1-15, 2013
Crude oil imports from Iran likely to be brought down to 80,000bpd by FY14E
Bought 1.15mn bbl of sour crude though tenders in October 2012
Bought 550,000bbl of Dubai crude oil from BP at a premium of US$1.25/bbl to Dubai crude
Bought 600,000bbl of Omani crude oil from Itochu at a premium of US$2.50/bbl to Dubai crude
For the first time, entered into an annual crude oil deal with Iraq
Short –term crude oil supply arrangement with Azerbaijan Socar
Bought 650,000bbl each of Oman & Banaco Arab medium crude oil from Shell
Purchased 650,000bbl of Yeman's low sulphur Masila crude from Arcadia Petroleum
Increased the size of annual crude oil supply contract with Saudi Aramco to 55,000bbl until FY14
Source: Media reports
Exhibit 8: Crude sourcing from Iran
Year mmt bpd Throughput (mmt) Throughput (bpd) % of throughput
FY10 7.3 146,897 12.5 250,000 58.8
FY11 7.1 142,000 12.6 252,800 56.2
FY12 6.2 124,000 12.8 256,400 48.4
FY13E 3.8 76,000 14.3 286,400 26.5
Source: Nirmal Bang Institutional Equities Research
Exhibit 9: India’s crude oil imports
Iran crude oil sourcing fell to 259,00bpd in February 2013, down 43% from a year ago
The government plans to import 310,000bpd of Iranian crude oil in FY13E
Crude oil imports from Iran fell to 7.3% in FY13E from 11% in FY12
Indian refiners plan to import 124,000 bpd Iranian crude oil in FY14E
Crude oil imports from Latin America rose to 17.3% in 2012 from 9.5% a year ago
Source: Media reports
Institutional Equities
6 ONGC Mangalore Refineries & Petrochemicals
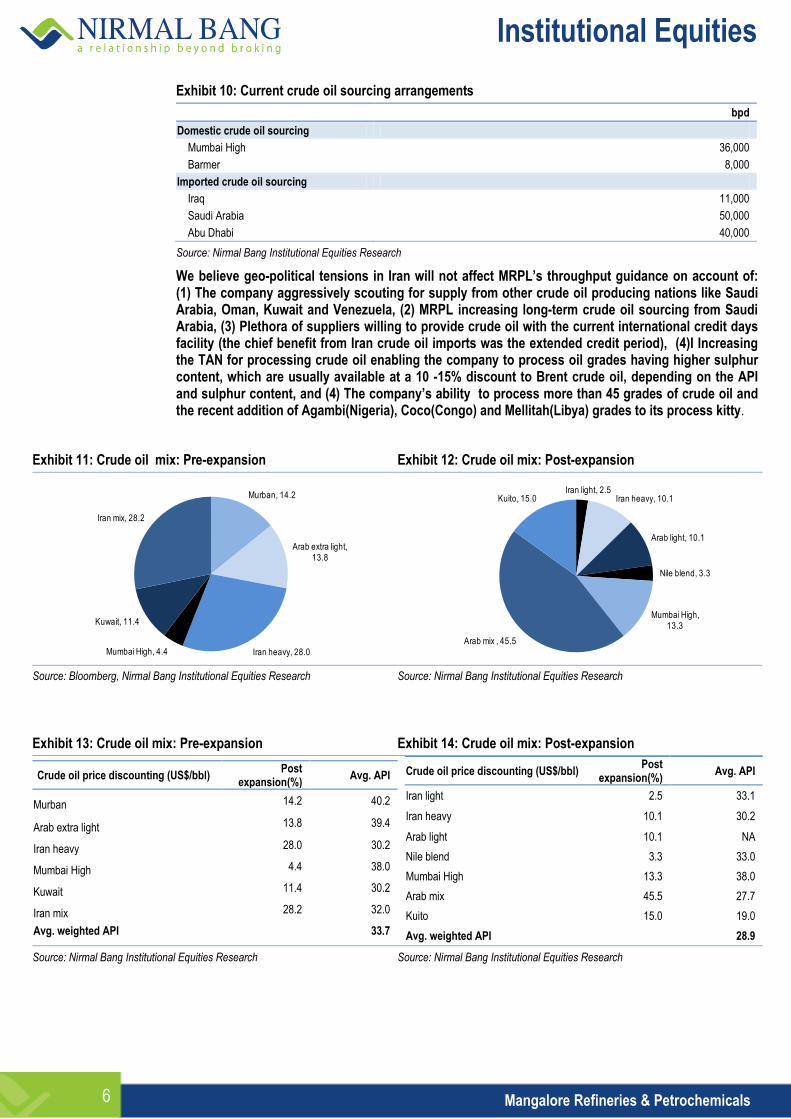
Exhibit 10: Current crude oil sourcing arrangements
bpd
Domestic crude oil sourcing
Mumbai High 36,000
Barmer 8,000
Imported crude oil sourcing
Iraq 11,000
Saudi Arabia 50,000
Abu Dhabi 40,000
Source: Nirmal Bang Institutional Equities Research
We believe geo-political tensions in Iran will not affect MRPL’s throughput guidance on account of: (1) The company aggressively scouting for supply from other crude oil producing nations like Saudi Arabia, Oman, Kuwait and Venezuela, (2) MRPL increasing long-term crude oil sourcing from Saudi Arabia, (3) Plethora of suppliers willing to provide crude oil with the current international credit days facility (the chief benefit from Iran crude oil imports was the extended credit period), (4)I Increasing the TAN for processing crude oil enabling the company to process oil grades having higher sulphur content, which are usually available at a 10 -15% discount to Brent crude oil, depending on the API and sulphur content, and (4) The company’s ability to process more than 45 grades of crude oil and the recent addition of Agambi(Nigeria), Coco(Congo) and Mellitah(Libya) grades to its process kitty.
Exhibit 11: Crude oil mix: Pre-expansion Exhibit 12: Crude oil mix: Post-expansion
Source: Bloomberg, Nirmal Bang Institutional Equities Research Source: Nirmal Bang Institutional Equities Research
Exhibit 13: Crude oil mix: Pre-expansion Exhibit 14: Crude oil mix: Post-expansion
Crude oil price discounting (US$/bbl) Post
expansion(%) Avg. API
Murban 14.2 40.2
Arab extra light 13.8 39.4
Iran heavy 28.0 30.2
Mumbai High 4.4 38.0
Kuwait 11.4 30.2
Iran mix 28.2 32.0
Avg. weighted API
33.7
Crude oil price discounting (US$/bbl) Post
expansion(%) Avg. API
Iran light 2.5 33.1
Iran heavy 10.1 30.2
Arab light 10.1 NA
Nile blend 3.3 33.0
Mumbai High 13.3 38.0
Arab mix 45.5 27.7
Kuito 15.0 19.0
Avg. weighted API
28.9
Source: Nirmal Bang Institutional Equities Research Source: Nirmal Bang Institutional Equities Research
Murban, 14.2
Arab extra light, 13.8
Iran heavy, 28.0Mumbai High, 4.4
Kuwait, 11.4
Iran mix, 28.2
Iran light, 2.5Iran heavy, 10.1
Arab light, 10.1
Nile blend, 3.3
Mumbai High, 13.3
Arab mix , 45.5
Kuito, 15.0

Institutional Equities
7 ONGC Mangalore Refineries & Petrochemicals
Increased Nelson complexity to expand GRM
Post phase III expansion and upgradation, MRPL’s refinery capacity would increase to 15.0mmt from 11.8mmt and Nelson complexity would rise to ~10 from 5 before the expansion, and commencement of operations by the secondary units would help the company to process higher acid crude oil. We expect the GRM to improve by US$3.5-US$4.0/bbl on the cumulative effect of: (1) The rise in Nelson complexity to ~10, (2) Secondary units like DCU, PFCC, DHDT increasing the distillate yield to ~80% from 73% currently, (3) Sulphur recovery unit to enable the processing of more acidic crude oil, and (4) Severity to polypropylene rising to 20% compared to 10%-12% global average, thereby providing more polypropylene volume without comprising on the quality.
We expect GRMs of US$3.80/US$5.95/US$7.00 per bbl for FY13E/FY14E/FY15E, respectively, after considering the erosion in its working capital advantage due to reduced Iran crude oil sourcing together with the probable impact of export parity pricing. We expect the company’s GRMs to remain at a discount to benchmark Singapore refining margins in FY13/FY14, with the spread likely to narrow once all the benefits of complexity kick in. We expect Singapore refining margins at US$7.3/US$6.8 for FY14E/FY15E, respectively, compared to US$7.8/bbl in FY13E. We expect refining margins to remain under pressure, with nearly ~7.2mb/d of refining capacity coming up globally, thereby keeping the utilisation level depressed.
Exhibit 15: Refining margin Exhibit 16: Quarterly Singapore complex GRM
Source: Company, Reuters Source: Reuters
Exhibit 17: Monthly Singapore complex GRM
Source:Reuters
0
1
2
3
4
5
6
7
8
9
FY10 FY11 FY12 FY13E FY14E FY15E
(US$/bbl)
Singapore complex margin MRPL refining margin
4
5
6
7
8
9
10
11
12 M
ar-
11
Ma
y-1
1
Jul-1
1
Se
p-1
1
No
v-1
1
Jan
-12
Ma
r-1
2
Ma
y-1
2
Jul-1
2
Se
p-1
2
No
v-1
2
Jan
-13
Ma
r-1
3
(US$/bbl)
Quarterly GRM Average GRM
0
2
4
6
8
10
12
Jan
-11
Ma
r-1
1
Ma
y-1
1
Jul-1
1
Se
p-1
1
No
v-1
1
Jan
-12
Ma
r-1
2
Ma
y-1
2
Jul-1
2
Se
p-1
2
No
v-1
2
Jan
-13
Ma
r-1
3(US$/bbl)

Institutional Equities
8 ONGC Mangalore Refineries & Petrochemicals
As per the Organisation of Petroleum Exporting Countries’ (OPEC) energy outlook, around 7.2mb/d of new crude oil distillation capacity would be added to the global refining system until 2016. The major portion of this new capacity is expected to materialise in Asia, mainly in China and India, together accounting for more than 40%, or 3.2mb/d, of additional capacity. China alone would expand its refining sector by more than 2mb/d, in line with the objective specified in its 12th Five Year Plan. The speed of expansion in India, however, seems to be slowing down with the change in the tax rate policy.
As regards the other three regions with likely highest capacity addition until 2016 - Middle East, Latin America and FSU (former Soviet Union) - the drivers are a combination of local demand and polices aimed at capturing the demand for value-added products through domestic refining operations.
Exhibit 18: Distillation capacity addition in existing projects - 2012-16
Note: OPEC energy outlook
In the Middle East, demand is expected to grow by 0.6mb/d in the medium term, whereas crude oil distillation capacity is likely to rise by 1.8mb/d. In Latin America, the demand is expected to increase by 0.5mb/d versus 0.8mb/d additional distillation capacity and FSU to witness expansion in demand of only 0.2 mb/d compared to 0.5mb/d, primarily driven by the polices designed to encourage the export of products rather than crude oil. Based on the above, it is clear that new refineries in Middle East could have a major impact on inter-regional product movement, at least in the medium term.
-
0.5
1.0
1.5
2.0
2.5
US & Canada
Latin America
Africa Europe FSU Middle East
China Other Asia
(mnbpd)

Institutional Equities
9 ONGC Mangalore Refineries & Petrochemicals
Exhibit 19: Refinery capacity addition in Asia
Company Capacity (kbpd)
2012
PetroChina 100
Sinopec Qingdao 40
Sinopec Anqing 50
Sinopec Jinling 100
Sinopec, Shanghai 80
HPCL, Bhatinda 180
Essar Vadinar 120
Total 670
2013
PetroChina, Huabei 100
PetroChina, Sichuan 200
Sinopec, Shijiazhuang 80
Sinopec, Fujian 40
Sinopec, Maoming 130
Sinopec Wuhan 40
Byco, Pakistan 120
MRPL, India 60
Total 760
2014E
PetroChina, Lianing 200
PetroChina, Henan 200
CNPC, Tianjin 261
CNPC, Jieyang 400
Sinopec, Tangshan 200
Sinopec, Jiangsu 90
Sinopec, Henan 160
Sinopec, Gaoqiao 240
Sinochem, Quanzhou 240
IOC, Paradip 300
Nargarjuna, Cuddalore 120
Total 2,411
2015E
PetroChina, Yunan 200
Sinopec Shandong 200
Sinopec Jiejiang 300
CNOOC Huizhou 200
Dung Quat, Vietnam 70
Nghi son, vietnam 200
Total 1,170
Source: Nirmal Bang Institutional Equities Research
Exhibit 20: Refinery expansion in the Middle East (2012-16)
Jubail, Saudi Arabia
Yanbu, Saudi Arabia
Ruwais, UAE
Karbala, Iraq
Isfahan, Iran
Rabigh, Saudi Arabia
Jizan Industrial city, Saudi Arabia
Ras Tanura, Saudi Arabia
Al Zour, Kuwait
Iraq building four new units having a total capacity of 0.75mb/d
UAE plans refinery at Fujairah
Oman considering 230,000b/d refinery at Duqm

Institutional Equities
10 ONGC Mangalore Refineries & Petrochemicals
Additional refining capacity of 1.8mb/d in 2012-16 by other countries
Source: OPEC energy outlook
Future refinery capacity utilisation rate prospects are often seen as good indicators of margins and thereby the profitability in the refining business. Utilisation rate depends on a set of factors that comprise development in demand for refined products, including their mix, the structure of available feedstock, existing refinery capacity and changes therein. The GRM increase in 4QFY13 is largely attributed to the significant number of outages that took place, which led the Singapore complex margin to top US$10/bbl. The key reason for GRM expansion in 2012 and in the first-half of 2013 was high net refining shutdown, which means refining shutdowns were more than refining restarts, thereby leading to low supply in the market. In 2012, net refining shutdown stood at 1,052kbpd and first-half of 2013 is believed to have witnessed 1,056kbpd shutdown. In 2012, refining restarts were to the extent of 3424kbpd and refining shutdown at 4,476kbpd, while in the first-half of 2013 refining restarts are likely to the extent of 1204kbpd and refinery shutdowns at 2,250kbpd, thereby holding the capacity utilisation rate in the first-half of 2013.
Exhibit 21: Refinery maintenance shutdown Exhibit 22: Global crude oil demand, refining capacity & crude runs
Source: Nirmal Bang Institutional Equities Research Source: Nirmal Bang Institutional Equities Research
The most critical factor for the utilisation rate is the number of closures offsetting the impact of additional capacity. Cumulative capacity closures since 2008, including known closures announced in 2013 and 2014, have already reached 4mb/d and are heading towards the 5mb/d mark, as currently there are at least 15 refineries on sale globally. The paradigm shift that the refining sector has seen is closure. The largest closures are in Europe, with ~1.7mb/d closed (0.45mb/d in Germany, 0.4mb/d in the UK, ~0.4mb/d in France and 0.3mb/d in Italy).
Exhibit 23: Global refinery closures
Cumulative capacity closure since 2008, including those announced in 2013/14, touched 4mb/d
Closures could touch 5mb/d, as at least 15 refineries are believed to be on sale globally
Europe
Around 1.7mb/d of capacity closed in Europe, of which 0.45mb/d each in Germany/UK, and 0.4mb/d in France
Japan
More than 0.8mb/d of capacity closed
Closure mainly due to the new guideline for meeting the cracking to crude distillation ratio of 13% by March 2014
Meet requirement refiners either closed distillation unit or increase residue upgrading
Nippon Oil shut down 0.26mb/d of capacity in June 2012 and another 0.25mb/d of capacity to be shut by 2014
China
China raised minimum capacity limit to 40,000b/d
With effect from 2014, anything below 40,000b/d capacity to be closed down
US and Canada
Between 2010 and 2011, five refineries closed on the East coast
Two other refineries, Sunoco in Philadelphia and Phillips66 in Trainer ,witnessed a narrow escape from closure
Source: OPEC energy outlook
-
1,000
2,000
3,000
4,000
5,000
6,000
J F M A M J J A S O N D
5-yr average 2012 2013
50
60
70
80
90
100
1980 1985 1990 1995 2000 2005 2010 2015 2016
(mnbpd)
Crude runs Oil demand Distillation capacity

Institutional Equities
11 ONGC Mangalore Refineries & Petrochemicals
Exhibit 24: Cumulative refinery capacity closure (2008-14) Exhibit 25: Global oil demand, refining capacity and crude runs
Source: OPEC energy outlook Source: OPEC energy outlook
The situation for the refining sector, in terms of average utilisation rate, would not change significantly over the medium term. It is critical, however, to recognise that this relatively balanced increase in refining capacity and demand for refined products is happening in the context of the industry experiencing a capacity surplus that has been gradually building up since 2009. In the years that immediately followed, crude oil demand gradually recovered and with that crude runs, although the pace of crude run growth was slower because of increasing non-crude supplies (ethanol and natural gas liquids, in particular).
The closure of around 5mb/d of capacity across the US, Europe, Japan and other places so far has primarily removed surplus capacity and it had little impact on margins. Shutting down a further 2mb/d for a combined total 7 mb/d should lead to improved margins as global refinery utilisation rates in this case would then increase to 82%, but it is potentially misleading to infer refining margins purely as function of distillation capacity utilisation. As per OPEC, in order to restore the refining margin to long-term viable level, it is necessary to exclude much more than 7 mb/d from the market, which would then restore the utilisation rate to 82%. Thus, closure to the extent of 10 mb/d is required to touch global refinery utilisation rate of 85%. It should be noted that global refinery utilisation rate has not touched 85% since 1980.
We have projected GRMs of US$3.8/US$5.95/US$$7.00 per bbl for FY13E/FY14E/FY15E, respectively. MRPL’s management has given guidance of GRM improvement of US$3.5-US$4.0/bbl once the entire phase III expanded capacity is commissioned. We expect improvement in the GRM on account of multiple levers such as: (1) Light- heavy crude oil upgrade to provide an incremental US$1.5/bbl to GRM, (2) Increase in distillate yield to 80% from 73% to offer a positive delta of US$0.5/bbl, (3) Polypropylene having a severity of 20% compared to global average of 10%-12% to give higher quantity, while maintaining the quality to add another US$1.5/bbl, (4) Single mooring point will give the advantage of saving US$0.5/bbl as the company would be served by VLCCs (very large crude carriers) compared to the current procurement via Aframax grade tankers, and (5) MRPL enjoying deferred VAT payment facility on products except gasoline/diesel, which would be ultimately paid after 15 years.
Exhibit 26: GRM bridge for FY15E
Source: Nirmal Bang Institutional Equities Research
0
1
2
3
4
5
2008 2009 2010 2011 2012 2013 2014
(mnbpd)
Europe US & Canada Asia Latin America
0
2
4
6
8
10
1990 1995 2000 2005 2010 2015
(mnbpd)
Effect of refinery closures
5.0
7.0
1.50 0.50
1.00 0.50 (1.00)
(0.5)
0
1
2
3
4
5
6
7
8
9
Core GRM before
expansion
Light-Heavy crude oil
advantage
Distillate improvement
Polypropylene effect
SPM advantage
Iran sourcing Export parity Core GRM
(US$/bbl)

Institutional Equities
12 ONGC Mangalore Refineries & Petrochemicals
Exhibit 27: Refinery product slate comparison
Pre-expansion Post-expansion
Production (mmt) % of total Production (mmt) % of total
LPG 0.3 2.6 1.01 7.1
Gasoline 1.19 10.1 1.17 8.3
Mixed xylene 0.08 0.7 0.25 1.7
Naphtha 0.9 7.6 1.14 8.0
Light distillate 2.47 21 3.57 25.1
Kerosene 0.34 2.9 1.05 7.4
Diesel 5.28 44.9 5.75 40.6
ATF 1.09 9.2 2.06 14.6
Middle distillate 6.71 57 8.86 62.6
FO 2.27 19.3 0.57 4.0
LSHS 0.01 - 0.22 1.5
Bitumen 0.21 1.8 0.23 1.7
CRMB 0.04 0.3 - -
Sulphur 0.06 0.5 0.25 1.8
Heavy ends 2.59 21.9 1.27 9
Polypropylene - - 0.45 3.2
Total 11.77 100 14.15 100
Light distillate to total - 21.0 - 25.2
Middle distillate to total - 57.0 - 62.6
Heavy ends - 22.0 - 9.0
Source: Nirmal Bang Institutional Equities Research
Exhibit 28: SPM project details
Project Amount to be spent
(Rsmn) Capex distribution
SPM sys & 48"sub-sea pipeline 3,640 Entire capex to borne by MRPL
Cavern storage 2,200 Capex in the ratio of 1:4, with Indian strategic resources
Booster pumping system 1,300 Entire capex to borne by MRPL
36" pipeline to refinery 280 Entire capex to absorbed by MRPL
Land development and oil spill management
70 Entire capex to absorbed by MRPL
Sub-total 7,490
Other 3,000 Shared between MRPL and Indian strategic resource
ltd(ISRL)
Total 10,490
Source: Nirmal Bang Institutional Equities Research
Exhibit 29: Factors behind GRM expansion
Project Pre-expansion Post-expansion
Nelson complexity 5.00 10.00
API (%) 33.70 28.80
Distillate yield(%) 73.00 80.00
Capacity(mmt) 11.80 15.00
Theortical GRM(US$/bbl) 5.00 8.50
Source: Nirmal Bang Institutional Equities Research

Institutional Equities
13 ONGC Mangalore Refineries & Petrochemicals
Exhibit 30: Expansion of units - How it would help in boosting GRM
PFCC unit Maximising production of propylene
(Petro fluidised catalytic cracking) FCC naphtha to be utilised for producing paraxylene
Higher capacity enables the processing of more heavy crude oils
DCU Upgrade high sulphur residue into distillate and naphtha
(Delayed coker unit) Used for higher production of diesel using DHDTU
Higher coker distillate to be used for hydro-cracking units(HCU)
DHDTU (Diesel hydro-treating unit) Increase the production of Euro III/IV fuels
New CDU/VDU Able to process higher heavier and sour crude oils
Source: Nirmal Bang Institutional Equities Research
Exhibit 31: Special incentives from Karnataka government
Plant & machinery Exemption from entry tax during the initial period of four years from the date of
commencement of project implementation
Crude oil Exemption from entry tax on the crude oil required for the third phase (3mmt) for 15 years
from the start of production
CST Exemption for 15 years on sales made out of the Phase III throughput
VAT
Interest-free soft loans at 100% of eligible gross VAT during the first three years and thereafter at 60% of gross VAT on sale of PP, petcoke, LSHS, naphtha, liquefied
petroleum gas (incremental production), mixed xylenes and reformate to non-SEZs for 15 years and to be repaid in 15 equal installments thereafter with a maximum limit of Rs5bn per
annum
Source: Nirmal Bang Institutional Equities Research
Exhibit 32: Refinery expansion - Cost advantage
Capacity
(mtpa) Capacity
(bpd) Capex
(US$mn) Capex/
bbl Nelson
complexity Capex/Nelson
complexity Complexity/
bbl
Essar Oil 20 400,000 5,158 12,895 11.8 1,093 2.99
Bina, BPCL 9 180,000 2,553 14,183 9 1,576 4.32
Bhatinda, HPCL 9 180,000 4,000 22,222 9 2,469 6.76
Paradip, IOC 15 300,000 6,600 22,000 9 2,444 6.70
Reliance Industries’ SEZ 29 580,000 7,300 12,586 14 899 2.46
MRPL post- expansion 15 300,000 4,434 14780 10 1,478 4.05
Source: Nirmal Bang Institutional Equities Research
Exhibit 33: Benefits from Karnataka and Central governments
Karnataka government
Interest-free soft loan at the rate of 100% of eligible gross VAT for the first three years
60% of eligible gross VAT on sale of polypropylene, pet coke, LSHS, naphtha
LPG, mixed xylenes to non-SEZ units for12 years to be repaid after 15 years by 15 EMIs limited to Rs5,000mn per annum
Central government
Eligible for income-tax benefits under Section 80(IB) of the Income Tax Act, 1962
Successfully commissioned CDU/VDU, meeting the March 2013 deadline
Source: Nirmal Bang Institutional Equities Research
Comfortable debt position to help in funding capex
The total capex likely to be incurred on phase III expansion would be around ~Rs145bn. Peak debt is likely to touch Rs75.61bn in FY14E from Rs61.8bn in FY12 and the rest would be met from internal accruals. The debt-to-equity ratio is expected to peak in FY14E, at 1.01x, and later decline once the cash flows from phase III expansion start flowing in. Being a subsidiary of ONGC, the company enjoys the privilege of lower interest cost loans at 7% per annum and OIDB(Oil Industry development board) loans at 9% per annum. The company has given guidance of peak debt at Rs75bn.

Institutional Equities
14 ONGC Mangalore Refineries & Petrochemicals
Exhibit 34: Comfortable debt position to aid in funding capex
FY09 FY10 FY11 FY12 FY13E FY14E FY15E
Capex (Rsmn) 3,337 14,564 37,917 30,263 43,707 26,000 11,000
Debt (Rsmn) 19868 16964 15570 61831 69809 75615 68483
Debt-equity ratio (x) 0.42 0.30 0.24 0.86 1.01 1.01 0.79
Interest payment/EBITDA(x)
15.27 13.27 19.57 7.92 2.35 4.56 6.42
Source: Company, Nirmal Bang Institutional Equities Research
Exhibit 35: Phase III capex scenario
Total capex(Rsbn)
Amount spent so far (Rsbn)
Project completion in percentage terms
Refinery expansion and upgradation 122 115 94.6
Polypropylene project 18 13 72.2
SPM 10 7 67.0
Source: Company, Nirmal Bang Institutional Equities Research
Exhibit 36: Debt status
Outstanding Approved debt (Rsbn) Availed till now(Rsbn) Interest rate (%)
Debt as of Now(Rsbn) 56 - - -
OIDB(Rsbn) 8 - 8 9.5
ECB(Rsbn) 15 US$650mn US$300mn 6.0
ONGC(Rsbn) 33 50 33 9.5
Source: Company, Nirmal Bang Institutional Equities Research
Impact on earnings with expanded capacity expected to go fully on stream from FY15
We expect EBITDA to post a 28% CAGR over FY12-FY15E at Rs34,493compared to a negative 9% CAGR over FY09-FY12. EBITDA growth is largely on account of the entire effect of increase in complexity and operational efficiencies to start kicking in from 4QFY14. EBITDA margin is expected at 5.6% in FY15E compared to the past five years’ average of 3.6%. Profits are expected to post a 20% CAGR over FY12-FY15E at Rs15,429mn and PAT margin is likely to improve to 2.5% versus the past five years’ average of 1.8%. We expect the RoE to improve to 19.1% in FY15E from 13.2% in FY12.
Exhibit 37: Gross profit growth Exhibit 38: EBITDA growth
Source: Company, Nirmal Bang Institutional Equities Research Source: Company, Nirmal Bang Institutional Equities Research
(50)
(40)
(30)
(20)
(10)
0
10
20
30
40
50
60
0
5,000
10,000
15,000
20,000
25,000
30,000
35,000
40,000
45,000
FY10 FY11 FY12 FY13E FY14E FY15E
(%)(Rsmn)
Gross profit Growth YoY (RHS)
(100)
(50)
0
50
100
150
200
0
5,000
10,000
15,000
20,000
25,000
30,000
35,000
FY10 FY11 FY12 FY13E FY14E FY15E
(%)(Rsmn)
EBITDA Growth YoY (RHS)

Institutional Equities
15 ONGC Mangalore Refineries & Petrochemicals
Exhibit 39: EBITDA/PAT margin
Source: Nirmal Bang Institutional Equities Research
Outlook and valuation
We have assigned a Buy rating to MRPL with a target price of Rs69 - on the basis of EV/EBITDA methodology - assigning a multiple of 5.5x FY15E earnings (20% discount to the average global multiple of 7.0x) considering the cyclical nature of the refining industry. We have valued the stock at a 20% discount to global refining companies’ stocks on account of: (1) The company’s policy against going in for any forex hedging covers for inventories and finished products, thereby leading to sharp fluctuations in quarterly earnings, (2) Delay in phase III expansion by almost two years, and (3) Uncertainty on the pricing front, with the finance ministry exerting pressure for export parity mechanism for subsidised petroleum products. At the target price of Rs69, the stock trades at 5.6x FY15E earnings, which is at ~30% discount to global refining companies’ average and 1.1x FY14E book value, which is ~26% discount to the global refining companies’ average.
Exhibit 40: MRPL’s valuation
Methodology Value
(Rs/share) Remarks
EV/EBITDA 69.4 EV/EBITDA multiple of 5.5x, 20% discount to global average
P/E 70.0 PE multiple of 8x, with 20% discount to global average
P/BV 69.0 P/BV multiple of 1.4x
DCF 75.0 WACC of 11.85% and terminal value of 1%
Source: Nirmal Bang Institutional Equities Research
We have chosen the EV/EBITDA methodology on account of: (1) Capex of Rs150bn to be capitalised in FY15E to increase interest costs and depreciation by ~Rs6bn and sway earnings, and (2) Given the cyclical nature of the refining industry, EBITDA to be a key indicator for gauging refining business operations.
Exhibit 41: What the market sidetracks
Execution risk of Phase III expansion project receding
All units under Phase III expansion project achieving mechanical completion
GRM expansion of US$3.5-US5.0/bbl from current core GRM of US$5.0/bbl
Significant exposure ~20%-50% to export markets gives protection if export parity prices implemented
Ability to meet throughput guidance despite having zero exposure to Iranian crude oil
Post commercial run, DHTDS units can earn additional income of Rs2,000/t from diesel
MAT paying company from FY15 on account of benefits under Section 80IB from the current tax rate of 33%
Increased acidic crude oil processing ability would lead to sourcing of ~80% high sulphur crude oil
Acquiring ~2mmt of high sulphur African crude oil currently having API of 25-28
Source: Nirmal Bang Institutional Equities Research
(1)
0
1
2
3
4
5
6
FY10 FY11 FY12 FY13E FY14E FY15E
(%)
EBITDA margin PAT margin

Institutional Equities
16 ONGC Mangalore Refineries & Petrochemicals
We have assigned Buy rating to MRPL to reflect: (1) The company entering complexity league, which would led to GRM expansion of US$3.5-US$4.0/bbl (2) Ability to maintain the guided throughput with even nil exposure to Iranian crude oil, (3) Higher GRM leading the RoAE to increase to 19.1% in FY15E from 12% in FY13E, (4) Earnings CAGR of 20% likely over FY12-FY15E from a negative CAGR of 8.7% over FY09-FY12, (5) Stock price implying that it is trading at a 22% discount to Indian refining companies’ average and a 45% discount to global refining companies’ average, and (6) The stock trading at an attractive valuation of 1.1x FY14 book value, which is ~1 SD below the mean.
Exhibit 42: Implied EV/bbl valuation
CMP 49
EV (Rsmn) 160,591
EV (US$mn) 2,947
Capacity(mt) 15
Capacity(bbl) 300,000
EV(US$/bbl) 9,822
Replacement value for Indian refiners(US$/bbl) 12,746
Replacement value for global refineries(US$/bbl) 18,000
Replacement discount to Indian refiners (%) (23)
Replacement discount to global refiners (%) (45)
Source: Nirmal Bang Institutional Equities Research
Exhibit 43: GRM sensitivity
Impact in FY14E 4.50 5.00 5.50 5.75 6.25 6.75
Revenue (Rsmn) 696,036 696,036 696,036 696,036 696,036 696,036
EBITDA (Rsmn) 15,856 18,627 21,397 22,782 25,553 28,323
PAT (Rsmn) 2,455 4,311 6,167 7,095 8,951 10,808
EPS (Rs/share) 1.40 2.46 3.52 4.05 5.11 6.17
Valuation (Rs/share) 69 69 69 69 69 69
Impact in FY15E 5.50 6.00 6.50 7.00 7.50 8.00
Revenue (Rsmn) 619,821 619,821 619,821 619,821 619,821 619,821
EBITDA (Rsmn) 25,949 28,797 31,645 34,493 37,341 40,189
PAT (Rsmn) 9,704 11,612 13,520 15,429 17,337 19,245
EPS (Rs/share) 5.54 6.63 7.71 8.80 9.89 10.98
Valuation (Rs/share) 42 51 60 69 78 87
Source: Nirmal Bang Institutional Equities Research
Exhibit 44: Refinery throughput utilisation sensitivity
Impact in FY14E 95.0 97.5 100 102.5 105 107.5 110
Revenue (Rsmn) 696,036 696,036 696,036 696,036 696,036 696,036 696036
EBITDA (Rsmn) 21,276 21,814 22,352 22,890 23,428 23,966 24504
PAT (Rsmn) 6,086 6,446 6,807 7,167 7,528 7,888 8249
EPS (Rs/share) 3.47 3.68 3.88 4.09 4.30 4.50 4.71
Valuation (Rs/share) 69 69 69 69 69 69 69.17
Impact in FY15E 95.0 97.5 100 102.5 105 107.5 110
Revenue (Rsmn) 619,821 619,821 619,821 619,821 619,821 619,821 619,821
EBITDA (Rsmn) 32,184 33,009 33,833 34,658 35,482 36,307 37,131
PAT (Rsmn) 13,882 14,434 14,987 15,539 16,092 16,644 17,196
EPS (Rs/share) 7.92 8.24 8.55 8.87 9.18 9.50 9.81
Valuation (Rs/share) 62 65 67 70 72 75 77
Source: Nirmal Bang Institutional Equities Research
Institutional Equities
17 ONGC Mangalore Refineries & Petrochemicals
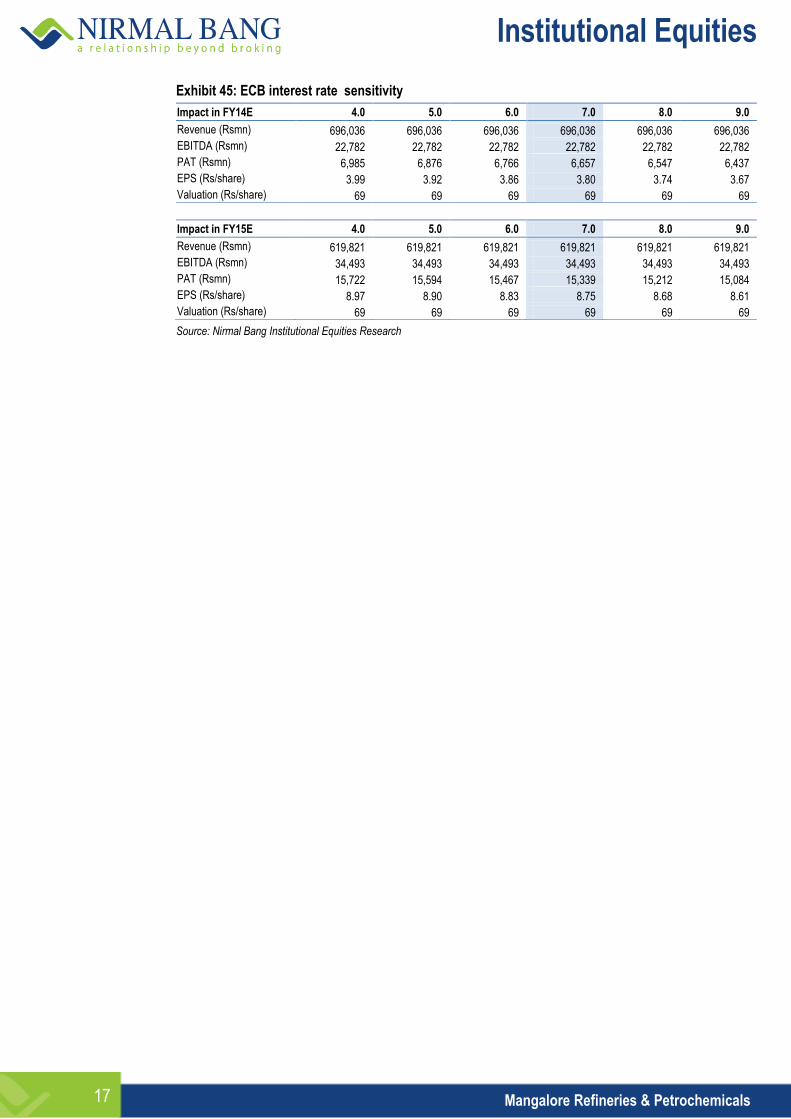
Exhibit 45: ECB interest rate sensitivity
Impact in FY14E 4.0 5.0 6.0 7.0 8.0 9.0
Revenue (Rsmn) 696,036 696,036 696,036 696,036 696,036 696,036
EBITDA (Rsmn) 22,782 22,782 22,782 22,782 22,782 22,782
PAT (Rsmn) 6,985 6,876 6,766 6,657 6,547 6,437
EPS (Rs/share) 3.99 3.92 3.86 3.80 3.74 3.67
Valuation (Rs/share) 69 69 69 69 69 69
Impact in FY15E 4.0 5.0 6.0 7.0 8.0 9.0
Revenue (Rsmn) 619,821 619,821 619,821 619,821 619,821 619,821
EBITDA (Rsmn) 34,493 34,493 34,493 34,493 34,493 34,493
PAT (Rsmn) 15,722 15,594 15,467 15,339 15,212 15,084
EPS (Rs/share) 8.97 8.90 8.83 8.75 8.68 8.61
Valuation (Rs/share) 69 69 69 69 69 69
Source: Nirmal Bang Institutional Equities Research

Institutional Equities
18 ONGC Mangalore Refineries & Petrochemicals
Exhibit 46: Income statement
Y/E March (Rsmn) FY11 FY12 FY13E FY14E FY15E
Net sales 388,869 537,703 658,531 696,036 619,821
% growth 21.7 38.3 22.5 5.7 (10.9)
Staff costs 1,845 1,606 1,794 1,773 1,867
Raw materials 364,041 510,865 637,709 668,160 579,948
Other expenses 2,755 9,097 12,604 4,149 4,369
Total expenditure 368,641 521,569 652,107 674,082 586,183
EBITDA 20,483 16,366 9,647 22,782 34,493
% growth 33.6 (20.1) (41.1) 136.2 51.4
EBITDA margin (%) 5.3 3.0 1.5 3.3 5.6
Other income 2,359 3,706 3,224 827 855
Interest costs 1,047 2,067 4,100 4,996 5,373
Depreciation 3,914 4,339 5,866 10,517 9,512
Profit before tax 17,371 13,202 518 10,590 23,028
% growth 2.7 (24.0) - - -
Tax 5,604 4,116 3,615 3,495 7,599
Effective tax rate (%) 32.3 31.2 697.9 33.0 33.0
Net profit 11,766 9,086 (3,097) 7,095 15,429
% growth 5.8 (22.8) (134.1) (329.1) 117.5
EPS (Rs) 6.21 4.94 (1.77) 4.05 8.80
Source: Company, Nirmal Bang Institutional Equities Research
Exhibit 48: Balance sheet
Y/E March (Rsmn) FY11 FY12 FY13E FY14E FY15E
Equity 17,619 17,573 17,573 17,573 17,573
Reserves 47,670 54,719 51,622 57,154 69,182
Net worth 65,289 72,292 69,195 74,726 86,755
Total loans 15,570 61,831 69,809 75,615 68,483
Short term loans 0 18,551 9,275 3,710 1,113
Long term loans 15,570 43,280 60,534 71,905 67,370
Deferred tax liabilities 3,472 4,531 4,531 4,531 4,531
Liabilities 84,330 138,654 143,535 154,873 159,769
Gross block 76,198 90,243 150,243 190,243 190,743
Depreciation 45,301 49,644 55,510 66,027 75,539
Net block 30,896 40,598 94,733 124,216 115,204
CWIP 54,674 70,892 54,599 40,599 51,099
Long-term Investments 948 423 423 423 423
Inventories 40,974 78,176 61,738 64,070 55,611
Debtors 25,266 34,593 34,280 36,232 32,265
Cash 24,151 22,347 504 317 4,415
Other current assets 284 1,241 1,241 1,241 1,241
Loans & advances 7,605 13,292 13,292 13,292 13,292
Total current assets 98,280 149,648 111,054 115,152 106,823
Creditors 96,874 119,572 117,273 123,952 110,379
Provisions 3,594 3,334 - 1,564 3,400
Total current liabilities 100,469 122,906 117,273 125,515 113,780
Net current assets (2,188) 26,741 (6,219) (10,364) (6,956)
Total assets 84,330 138,654 143,535 154,873 159,769
Source: Company, Nirmal Bang Institutional Equities Research
Financials
Exhibit 47: Cash flow
Y/E March (Rsmn) FY11 FY12 FY13E FY14E FY15E
PBT 17,371 13,202 518 10,590 23,028
(Inc.)/dec. in working capital 11,537 (29,674) 11,117 3,958 690
Cash flow from operations 28,908 (16,472) 11,635 14,548 23,718
Depreciation 3,914 4,339 5,866 10,517 9,512
Interest paid (-) 1,047 2,067 4,100 4,996 5,373
Tax paid (-) 5,604 4,116 3,615 3,495 7,599
Dividends paid (-) (2,444) (2,037) 0 (1,564) (3,400)
Net cash from operations 37,377 (9,413) 21,186 29,405 41,927
Capital expenditure (-) (37,917) (30,263) (43,707) (26,000) (11,000)
Net cash after capex (540) (39,675) (22,521) 3,405 30,927
Other income 2,096 3,462 4,030 4,150 4,275
Inc./(dec.) in LT borrowings (1,394) 27,711 17,253 11,371 (4,535)
Inc./(dec.) in ST borrowings 0 18,551 (9,275) (5,565) (2,597)
(Inc.)/dec in investments 15,288 525 0 0 0
Equity issue/(buyback) 0 (46) 0 0 0
Cash from financial activities 15,450 10,528 (10,513) 13,361 28,070
Others (39) 4 0 0 0
Opening cash 23,440 24,151 22,347 504 317
Closing cash 24,152 22,347 504 316 4,415
Change in cash 15,411 10,532 (10,513) 13,361 28,070
Source: Company, Nirmal Bang Institutional Equities Research
Exhibit 49: Key ratios
Y/E March FY11 FY12 FY13E FY14E FY15E
Per share
EPS 6.2 4.9 (1.8) 4.0 8.8
Book value per share 37.3 41.2 39.5 42.6 49.5
Dividend per share 1.2 1.0 0.0 0.8 1.7
Cash EPS per share 8.9 7.7 1.6 10.0 14.2
Free cash flow per share 3.2 (25.1) (14.7) 0.3 11.4
Valuation (x)
P/E 7.9 9.9 (27.7) 12.1 5.6
P/BV 1.3 1.2 1.2 1.1 1.0
EV/EBITDA 3.9 9.0 16.1 6.9 4.2
Margins (%)
EBITDA margin 5.3 3.0 1.5 3.3 5.6
Net profit margin 3.0 1.7 (0.5) 1.0 2.5
Asset-based ratios (%)
RoAE 19.4 13.2 (4.4) 9.9 19.1
RoACE 13.5 7.3 (16.0) 5.5 10.6
DuPont analysis RoE
PAT/PBT (%) 67.7 68.8 (597.9) 67.0 67.0
PBT/EBIT (%) 106.5 111.7 13.7 86.3 92.2
EBIT/sales (%) 4.2 2.2 0.6 1.8 4.0
Sales/assets (x) 4.6 3.9 4.6 4.5 3.9
Assets/equity (x) 1.3 1.9 2.1 2.1 1.8
Source: Company, Nirmal Bang Institutional Equities Research

Institutional Equities
19 ONGC Mangalore Refineries & Petrochemicals
Disclaimer Stock Ratings Absolute Returns
BUY > 15%
HOLD 0-15%
SELL < 0%
This report is published by Nirmal Bang’s Institutional Equities Research desk. Nirmal Bang has other business units with independent research teams separated by Chinese walls, and therefore may, at times, have different or contrary views on stocks and markets. This report is for the personal information of the authorised recipient and is not for public distribution. This should not be reproduced or redistributed to any other person or in any form. This report is for the general information for the clients of Nirmal Bang Equities Pvt. Ltd., a division of Nirmal Bang, and should not be construed as an offer or solicitation of an offer to buy/sell any securities. We have exercised due diligence in checking the correctness and authenticity of the information contained herein, so far as it relates to current and historical information, but do not guarantee its accuracy or completeness. The opinions expressed are our current opinions as of the date appearing in the material and may be subject to change from time to time without notice. Nirmal Bang or any persons connected with it do not accept any liability arising from the use of this document or the information contained therein. The recipients of this material should rely on their own judgment and take their own professional advice before acting on this information. Nirmal Bang or any of its connected persons including its directors or subsidiaries or associates or employees or agents shall not be in any way responsible for any loss or damage that may arise to any person/s from any inadvertent error in the information contained, views and opinions expressed in this publication.
Team Details:
Name Email Id Direct Line
Rahul Arora CEO [email protected] +91 22 3926 8098 / 99
Hemindra Hazari Head of Research [email protected] +91 22 3926 8017 / 18
Sales and Dealing:
Neha Grover AVP Sales [email protected] +91 22 3926 8093
Ravi Jagtiani Dealing Desk [email protected] +91 22 3926 8230, +91 22 6636 8832
Sudhindar Rao Dealing Desk [email protected] +91 22 3926 8229
Pradeep Kasat Dealing Desk [email protected] +91 22 3926 8102/8103, +91 22 6636 8831
Michael Pillai Dealing Desk [email protected] +91 22 3926 8100/8101, +91 22 6636 8830
Nirmal Bang Equities Pvt. Ltd.
Correspondence Address
B-2, 301/302, Marathon Innova,
Nr. Peninsula Corporate Park
Lower Parel (W), Mumbai-400013.
Board No. : 91 22 3926 8000/1
Fax. : 022 3926 8010