MANCHESTER URBAN ONDS RESTORATION PROGRAM
89
MANCHESTER URBAN PONDS RESTORATION PROGRAM YEAR 5 REPORT 2004 ART GRINDLE Program Coordinator & JEN DROCIAK Manchester Conservation Commission April 2005
Transcript of MANCHESTER URBAN ONDS RESTORATION PROGRAM

MANCHESTER URBAN PONDSRESTORATION PROGRAM
YEAR 5 REPORT2004
ART GRINDLEProgram Coordinator
&
JEN DROCIAKManchester Conservation Commission
April 2005

II

III
TABLE OF CONTENTS
Acknowledgements………………………………………………………………………………………………...V
Introduction……………………………………………………………………………………………………..…1
Section I. Work Plan & Areas of Focus for 2003 – 2004……………………………………….3
Section II. Outreach & Education Endeavors……………………………………………………..…...5
Section III. Sampling Procedures & Laboratory Analysis Costs……………...……………….….13
Section IV. Water Quality Monitoring & Status of Manchester’s Urban Ponds………...…... 17
v Crystal Lake……………………………………………………………………………………………….19
v Dorrs Pond………………………………………………………………………………………….……25
v Maxwell Pond………………………………………………………………………………………….….31
v McQuesten Pond………………………………………………………………………………………….37
v Nutts Pond………………………………………………………………………………………………..41
v Pine Island Pond……………………………………………………..…………………………………...49
v Stevens Pond……………………………………………………………………………………………...55
Section V. Pond Project Prioritization Status…………………………………………….……….…...61
Appendices
A. Newsletters, Fact-Sheets & Puzzles
B. Glossary
C. Manchester Urban Ponds Restoration Program Sampling Protocol
D. Water Quality Data Spreadsheets
A Note About This Publication
The text from Section IV(Water Quality Analysis of Manchester’s Urban Ponds) was largely taken from the Volunteer LakeAssessment Program’s bi-annual water quality reports. The associated water quality graphs following analysis are taken directlyfrom these reports. Special thank you to Andrea Lamoreaux (VLAP Coordinator) for use of the information in this report.
Cover Photos
Left: Dorrs Pond, by Art GrindleRight: Dorrs Pond Boardwalk, by Jen Drociak

IV
V
ACKNOWLEDGEMENTS
The authors would like to thank the following people for their assistance throughout the last five years:
Manchester Conservation Commission: Todd Connors, Jen Drociak, Marty Gavin, Kathleen Neville, JoAnnO’Shaughnessy, Michael Poisson, Eric Skoglund.
City of Manchester: Rick Cantu, Marty Gavin, Ron Johnson, Joanne McLaughlin, Department of Planning and CommunityDevelpoment.
Department of Environmental Services: Andy Chapman, Jody Connor, Steve Couture, Walt Henderson, AndreaLaMoreaux, Steve Landry, Stephanie Lindloff, Amy Smagula, Ken Warren. Thank you to the summer interns in the DESLimnology Center who ran the water samples during field season, and to personnel in the Laboratory Services unit at DESwho also participated in running water samples.
SEPP Advisory Committee and Associates: Cyndy Carlson, Andy Chapman, Carl DeLoi, Trish Garrigan, Tom Siegle, EricWilliams.
Urban Ponds Restoration Program Interns: 2001: Kat St. Jean; 2002: Lydia Henry; 2003: Emily Welch.
Black Brook Advisory Committee: Art Grindle, Jen Drociak, Ron Johnson, Steve Landry, Grace Levergood, StephanieLindloff, Jim MacCartney, Kathleen Neville, Margaret Watkins.
Comprehensive Environmental (CEI): Rebecca Balke, Ben Lundsted, Eileen Pannetier.
Friends: Jane Beaulieu (For Manchester)
Crystal Lake Preservation Association (CLPA) including Ken Cardin, J. Andrew Manning, and Robert Corbeil.
Dorrs Pond Preservation Society (DPPS) including Terri Duminsil, Rita Espinoza, and Blanche Grondin.
Pine Island Pond Environmental Society (PIPES) including Merrill Lewis, David Erickson, Carole Lessard, and BrendanDaley.
Thank-You to all of our Cleanup Volunteers!
2000: Todd Baril, Matt Barrett, Leslie Barrett, Donald Bouchard, Bill Boyd, Cyndy Carlson, Amanda DeSantis, Jen Drociak, Rich Duport,Rita Espinoza, Roger Gamache, Rich Girard, Louella Grindle, Blanche Grondin, Scott Grondin, Will Infantine, Liz Jestude, Chris Kfoury,Barrett Kimball, Eric Lamper, Devin Martin, Joanne McLaughlin, Steve McLaughlin, Frank Norris, Ann Piekarski, Richard Piroso, MaryRalbovosky, Jim Robinson, Avery Sinclair, Steve Smith, Sonja Tashin, Keith Zimmerman.
2001: Sudip Adhikan, Doug Burns, John Burns, Laura Burns, Ken Cardin, Cyndy Carlson, Steve Couture, Terri DeLangis, Brian Dodge,Jen Drociak, Rita Espinoza, David Ferrarini, Ryan Girard, Louella Grindle, Blanche Grondin, Meena Gywali, Riley Harris, Eric Laaberge,Alix Laclair, Andy Manning, Jim McLean, Dan Meagher, Tim Meagher, Tom Mulroy, Beth O’Neil, Robert Rivet, Tim Searles, EricSkoglund, Marie Thibault, Nate Thibault, Kevin Urban, Paul Urban, Brenden Vesci, Matt Woodbury.
2002: John Angelo, Cyndy Carlson, Steve Couture, Jen Drociak, Kristina Drociak, Rita Espinoza, Armand Forest, Marty Gavin, LouellaGrindle, Blanche Grondin, Riley Harris, Zane Knoy, Joanne McLaughlin, Nicole Minehart, Eric Skoglund, Mark Saltmarsh.
2003: Emily Burr, Christos Chakas, Andy Chapman, Heidi Clark, Pat Driscoll, Jen Drociak, Christa Elliott, Rita Espinoza, Greg Gauthier,Chris Goudreault, David Goudreault, Margorie Goudreault, Marty Gavin, Louella Grindle, Blanche Grondin, Norman Horion, Liz Jestude,Pete Martineau, Lowell McPherson, Brandon Meehan, Candace Puchaz, Carolyn Puchaz, Bob Shaw, Scott Shephard, Rob Sinclair, StevenSmith, Phyllis Stewart, Gail Trimbur, Claude Venna, Steve Viggiano.
2004: Emily Burr, George Burr, Christos Chakas, Andy Chapman, Karen Drapeau, Pat Driscoll, Jen Drociak, Terri Dumensil, RitaEspinoza, Sandy Finn, Greg Gauthier, Marty Gavin, Blanche Grondin , Andrea Hoben, Liz Jestude, Matt Kilrain, Mike MacDonald, RuthMac Donald, Sonya Martineau, Lowell McPherson, Elana Pachos, Josh Pratt, Eric Skoglund, Gail Trimbur, Ann Walls, Eric Williams.
Thank You to our Water Quality Monitoring Volunteers!

VI

INTRODUCTION
Since 2000, the Manchester Urban Ponds Restoration Program (UPRP) has been overseen by the ManchesterConservation Commission (MCC) and has been part of a greater environmental effort in Manchester. As part of asolution to address Manchester’s combined sewer overflows (CSOs) and improve environmental conditions withinthe city, six (6) Supplemental Environmental Projects (SEPs) were implemented. These projects are: EnvironmentalEducation Curriculum Development, Children’s Environmental Health Risk Reduction, Stormwater Management,Streambank Stabilization, Land Preservation, and the Urban Ponds Restoration Program. The UPRP wasestablished to assess the condition of seven of Manchester’s urban ponds (Crystal Lake, Dorrs Pond, MaxwellPond, McQuesten Pond, Nutts Pond, Pine Island Pond, and Stevens Pond), and to improve their water quality.
The primary Goal of the UPRP is:
v To attempt to return the ponds to their historic uses (such as boating, fishing or swimming).
The primary Objectives to meet that goal are:
v To promote public awareness, education, and stewardship;
v To reduce pollutant loading and nutrient inputs in order to improve water quality;
v To maintain or enhance biological diversity; and
v To provide improved recreational uses.
Manchester’s urban ponds are quite different from one another and face unique challenges posed by the urbanlandscape that surrounds them. To better understand each pond, the UPRP has gathered baseline water quality andbiological data over the past four years, and has identified water quality threats and trends at each pond. The currentwater quality is described in Section IV.
In April 2002 members of the Manchester Conservation Commission met with the Urban Ponds RestorationCoordinator to establish pond “goals” and project “prioritization.” Each of the seven ponds was discussed at lengthwith regards to potential water quality improvements, outreach/education opportunities, recreational opportunities,land preservation opportunities, and other management objectives. The result is a clearly defined set of goals andprioritized projects within each of the aforementioned categories. The list was revised in April 2003 and can befound in Section V.
For more information on any of these projects, please contact the Urban Ponds Restoration Coordinator at (603)624-6450 or [email protected] or visit http://www.manchesternh.gov/UrbanPonds.
1

2

3
SECTION I. WORK PLAN & AREAS OF FOCUS FOR 2003-2004
SECTION I. WORK OBJECTIVES (GENERAL)
1. Water Quality: Gain and report a better understanding of water quality in several parameters at each pond.
2. Outreach/Education: Promote community awareness and generate involvement in Manchester’s urban ponds.
3. Restoration Projects: Develop and implement restoration projects at each pond.
4. Aesthetics/Recreation: Remove debris from ponds, work to create/retrofit pond areas as pleasant recreational places.
5. Partnerships/Visioning: Establish relationships and work with partners from municipal, state, and federal agencies to
generate ideas and ensure programmatic understanding.
SECTION II. JOB DUTIES (SUPPORT WORK OBJECTIVES)
1. Water Quality: Continue collecting data and maintaining a water quality and biological “database” (Begin
analyzing/interpreting/summarizing/reporting data.
2. Outreach/Education: Place more emphasis on outreach/education for the next two years. Enlist help of conservation
commissioners and existing environmental groups in town as necessary.
3. Restoration Projects: Prioritize and balance pond restoration projects for each pond in three categories: Water Quality
Improvement, Outreach/Education, and Recreation. Use MCC document to prioritize/report/plan projects.
4. Aesthetics/Recreation: Hold bi-annual pond cleanups, assist Parks & Recreation with conceptual trail work & kiosk
construction/retrofit, and assist with other activities at each pond.
5. Partnerships/Visioning: Work closely with the Manchester Conservation Commission, Planning Department,
Environmental Protection Division, SEPP Advisory Committee, and other state and federal officials.
SECTION III. KEY ASSIGNMENTS (SPECIFIC)
1. Water Quality
• Continue sampling each pond on a regular basis (at least once a month April-October).
• Seek additional opportunities for more advanced chemical, biological sampling/surveying (i.e. additional sedimentdepth sampling, macroinvertebrate sampling, fish surveys, bird surveys, etc).
• Continue systematically adding data into database and interpreting data.
• Summarize and report data and trends in a meaningful way so
i. Stake holders (including MCC, SEPP and public) can understand and take any appropriate action.
ii. Restoration projects at the ponds are properly prioritized and implemented.
iii. Summarized data is available for “measurable results” type documents, sampling data and cleanup volumes.
4
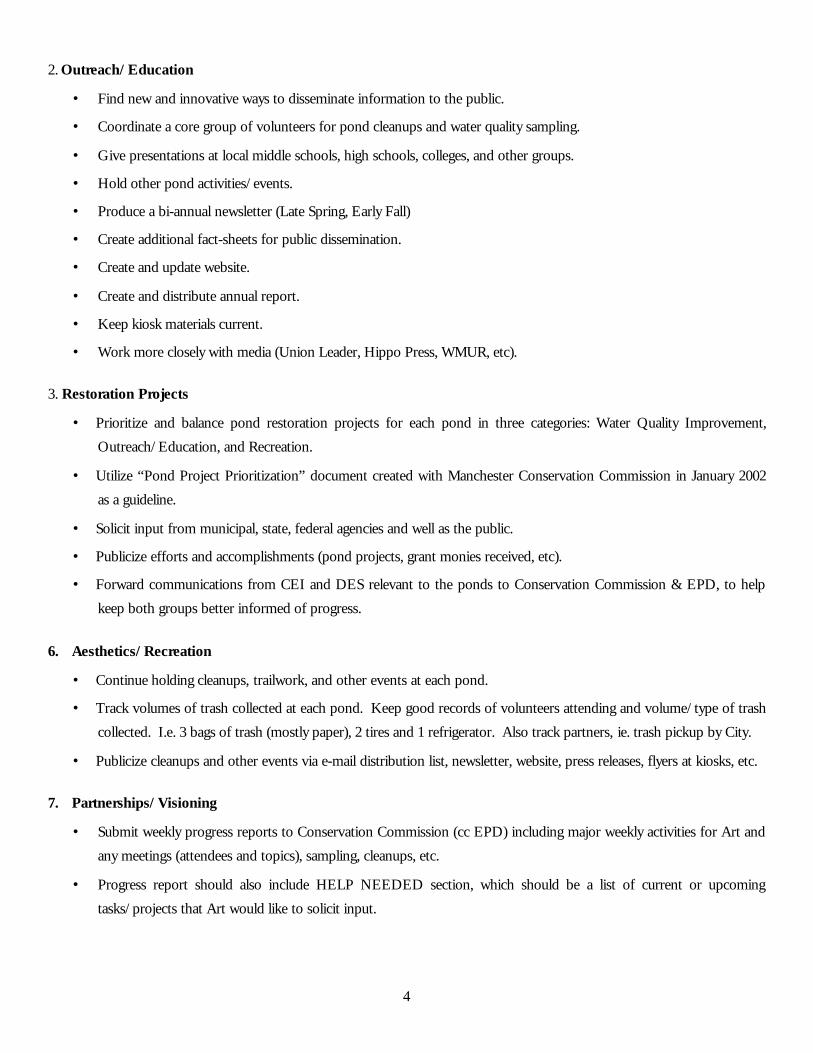
2. Outreach/Education
• Find new and innovative ways to disseminate information to the public.
• Coordinate a core group of volunteers for pond cleanups and water quality sampling.
• Give presentations at local middle schools, high schools, colleges, and other groups.
• Hold other pond activities/events.
• Produce a bi-annual newsletter (Late Spring, Early Fall)
• Create additional fact-sheets for public dissemination.
• Create and update website.
• Create and distribute annual report.
• Keep kiosk materials current.
• Work more closely with media (Union Leader, Hippo Press, WMUR, etc).
3. Restoration Projects
• Prioritize and balance pond restoration projects for each pond in three categories: Water Quality Improvement,
Outreach/Education, and Recreation.
• Utilize “Pond Project Prioritization” document created with Manchester Conservation Commission in January 2002
as a guideline.
• Solicit input from municipal, state, federal agencies and well as the public.
• Publicize efforts and accomplishments (pond projects, grant monies received, etc).
• Forward communications from CEI and DES relevant to the ponds to Conservation Commission & EPD, to help
keep both groups better informed of progress.
6. Aesthetics/Recreation
• Continue holding cleanups, trailwork, and other events at each pond.
• Track volumes of trash collected at each pond. Keep good records of volunteers attending and volume/type of trash
collected. I.e. 3 bags of trash (mostly paper), 2 tires and 1 refrigerator. Also track partners, ie. trash pickup by City.
• Publicize cleanups and other events via e-mail distribution list, newsletter, website, press releases, flyers at kiosks, etc.
7. Partnerships/Visioning
• Submit weekly progress reports to Conservation Commission (cc EPD) including major weekly activities for Art and
any meetings (attendees and topics), sampling, cleanups, etc.
• Progress report should also include HELP NEEDED section, which should be a list of current or upcoming
tasks/projects that Art would like to solicit input.

5
• Attend information-sharing and collaborative/brainstorming meetings with key partners (Conservation Commission,Environmental Protection Division, Planning Department, SEPP Advisory Committee, Department of
Environmental Services, etc)
• Attend SEPP Advisory Committee meetings and Conservation Commission meetings with program updates, items
for action, and needed assistance.
• Brainstorm innovative ideas for outreach/education, and new projects.
• Keep Conservation Commission informed of weekly schedule (especially during Summer).
• Create tentative summer sampling/activity schedule and distribute to Conservation Commission.
• Create annual scope, in conjunction with Conservation Commission, with activities planned for each month. Include
activities completed in weekly update.
• Meet with direct supervision at least once per month with the goal of meeting more often.
• Meet with other Conservation Commission supervisors more frequently/regularly and utilize their skills/experience
when needed.
• Attend Planning Board staff meetings with program updates and keep Planning Board administrative assistants aware
of your schedule.
• Distribute important documents (ie, outreach/education, newsletters, reports, etc) to Conservation Commission for
review

6
7
SECTION II. OUTREACH & EDUCATION ENDEAVORS
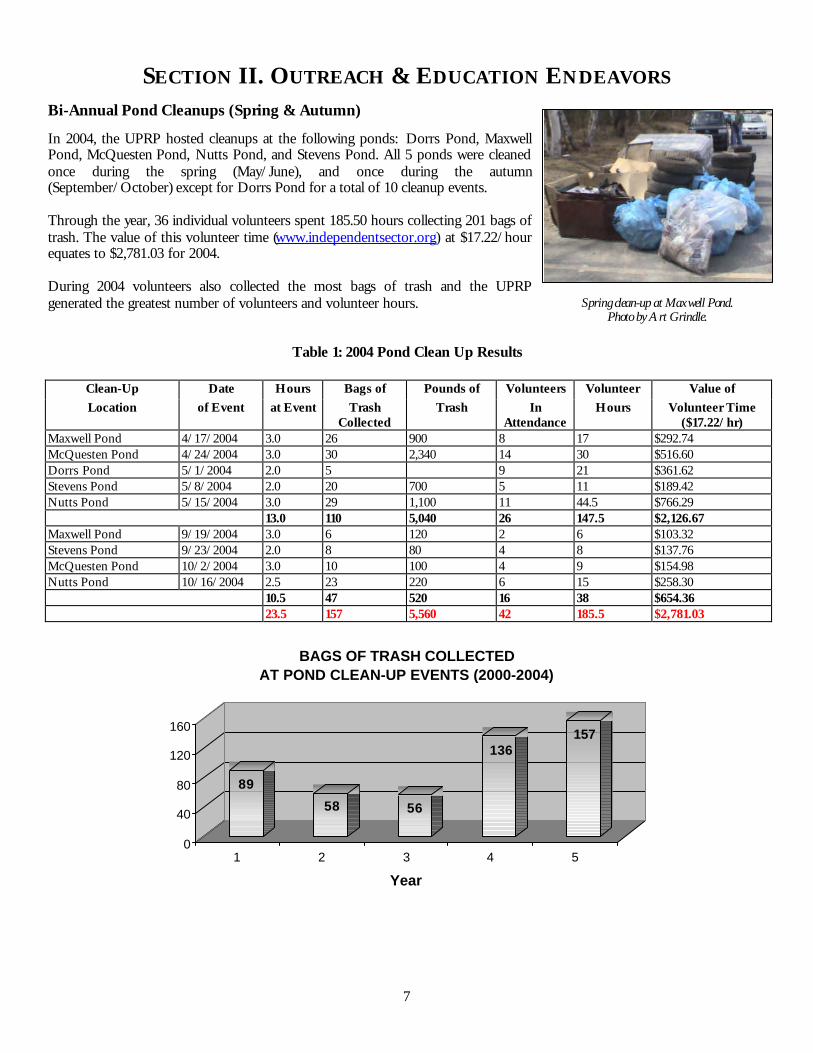
Bi-Annual Pond Cleanups (Spring & Autumn)
In 2004, the UPRP hosted cleanups at the following ponds: Dorrs Pond, MaxwellPond, McQuesten Pond, Nutts Pond, and Stevens Pond. All 5 ponds were cleanedonce during the spring (May/June), and once during the autumn(September/October) except for Dorrs Pond for a total of 10 cleanup events.
Through the year, 36 individual volunteers spent 185.50 hours collecting 201 bags oftrash. The value of this volunteer time (www.independentsector.org) at $17.22/hourequates to $2,781.03 for 2004.
During 2004 volunteers also collected the most bags of trash and the UPRPgenerated the greatest number of volunteers and volunteer hours.
Table 1: 2004 Pond Clean Up Results
Clean-Up Date Hours Bags of Pounds of Volunteers Volunteer Value ofLocation of Event at Event Trash
CollectedTrash In
AttendanceHours Volunteer Time
($17.22/hr)Maxwell Pond 4/17/2004 3.0 26 900 8 17 $292.74McQuesten Pond 4/24/2004 3.0 30 2,340 14 30 $516.60Dorrs Pond 5/1/2004 2.0 5 9 21 $361.62Stevens Pond 5/8/2004 2.0 20 700 5 11 $189.42Nutts Pond 5/15/2004 3.0 29 1,100 11 44.5 $766.29
13.0 110 5,040 26 147.5 $2,126.67Maxwell Pond 9/19/2004 3.0 6 120 2 6 $103.32Stevens Pond 9/23/2004 2.0 8 80 4 8 $137.76McQuesten Pond 10/2/2004 3.0 10 100 4 9 $154.98Nutts Pond 10/16/2004 2.5 23 220 6 15 $258.30
10.5 47 520 16 38 $654.3623.5 157 5,560 42 185.5 $2,781.03
Spring clean-up at Maxwell Pond.Photo by Art Grindle.
89
58 56
136157
0
40
80
120
160
1 2 3 4 5
Year
BAGS OF TRASH COLLECTED AT POND CLEAN-UP EVENTS (2000-2004)

8
69
117
67
118
185.5
0
40
80
120
160
200
1 2 3 4 5
Year
TOTAL VOLUNTEER HOURS AT POND CLEAN-UP EVENTS (2000 - 2004)
3235
15
3236
0
10
20
30
40
1 2 3 4 5
Year
TOTAL NUMBER OF VOLUNTEERS AT POND CLEAN-UP EVENTS (2000 - 2004)

9
10 810
5
1317
32
6
24
40
80
25
20
28
52
913
9
37
28
0
20
40
60
80
Dorrs Pond Maxwell Pond McQuesten Pond Nutts Pond Stevens Pond
BAGS OF TRASH COLLECTED PER POND (2000 - 2004)
2000 2001 2002 2003 2004
15 15 12
24 21 2113
16.5 23
6
20
39
5463
12
47.5
164.5
1824
10
19
0
30
60
90
120
150
180
Dorrs Pond Maxwell Pond McQuesten Pond Nutts Pond Stevens Pond
VOLUNTEER HOURS PER POND (2000 - 2004)
2000 2001 2002 2003 2004

10
Presentations, “Traveling Display”, and Information Dissemination
In 2004, Jen Drociak and Art Grindle spent 38.5 hours at events (andkept the display at several locations unattended) distributing 876publications. Publications include the UPRP brochure, SEPPbrochure, Common Exotic Plant fact-sheets, Common Fish fact-sheets, History fact-sheets, Pond fact Sheets, “Pond Possibilities”newsletter, clean-up post-cards, and other items. Following is adescription of each event.
v January 21 – March 5, 2004: 288 publications weredistributed at UNH Manchester where the display was locatedduring this time.
v February 5, 2004: 65 publications were distributed at the ForManchester annual meeting where Art Grindle gave apresentation to recruit volunteers and raise awareness of theUPRP.
v March 9 – April 16 2004: 94 publications were distributed at the Manchester Public Library West were the display waslocated during this time.
v April 23, 2004: Jen Drociak and Art Grindle gave a presentation at the second annual “Manchester Earth DayForum” which was held at the PSNH Energy Park in Manchester. 21 publications were distributed at this event.
v May 15, 2004: 100 publications were distributed at the Amoskeag Fishways “Fabulous Fishways Carnival” inManchester were the display was located during this time.
v September 11 & 12, 2004: Jen Drociak and Art Grindle attended the second annual Mill City Festival at Arms Park inManchester. 123 publications were distributed at this event.
v November 13, 2004: Jen Drociak attended the annual Rivers & Watershed Conference in Concord, sponsored by theNHDES and NH Rivers Council. 102 publications were distributed at this event.
The table below illustrates the Event/Display Locations for 2002, 2003, and 2004. It also details the date of the event, hours inattendance, approximate number of people in attendance, and total number of publications distributed.
Table 2: 2004 Public Events
Event/Display Location DateOf Event
HoursAt
Event# People
In Attendance# Publications
Distributed2002
NHACC 32nd Annual 11/2/02 2.5 100 27DES Rivers & Watershed 11/9/02 6 50 26Springfield College Ecology Class 12/15/02 1.5 25 50
10 175 1032003
Manchester Chamber of Commerce Visitor Welcome Center N/A N/A 50For Manchester Annual Meeting 2/12/03 4.5 50 6St. Anselm's College Ecology Class 4/7/03 2 125 218Manchester Earth Day Forum - PSNH 4/24/03 5 100 204Amoskeag Fishways Fabulous Fishways Carnival 5/3/03 5 200 121NH Lakes Association Annual Congress 6/21/03 1Mill City Festival - Day 1 9/6/03 5.5 200 189
UPRP Traveling Display. Photo by Jen Drociak
11
Mill City Festival - Day 2 9/7/03 8 200 171Manchester City Library East 10/0/03 N/AAmoskeag Fishways 10/0/03 N/AUNH Manchester 10/0/03 N/ADES Rivers & Watershed 10/0/03 N/AManchester City Library East 11/8/03 5 100 109
11/14/03-12/12/03 11618 975 1134
2004
UNH Manchester1/21/04-3/5/04 N/A N/A 288
For Manchester Annual Meeting 2/5/04 3 30 65
Manchester Library – West3/9/04-4/16/04 N/A N/A 94
Manchester Earth Day Forum 4/23/04 3 50+ 21Household Hazardous Waste Day 5/8/04 5 N/A 83Amoskeag Fishways Carnival 5/15/04 4 N/A 100
Mill City Festival9/11 &9/12/04 18 N/A 123
NH DES Rivers & Watershed Conference 11/13/04 5.5 200 10238.5 280+ 876
Mailing List & E-Mail Distribution List
As of December 2004 there were 317 people on the UPRP Mailing List. The mailing list is used primarily for the newsletter.
As of the same time there were 140 people on the E-Mail Distribution List . The e-mail distribution list is used several timesa year to distribute the newsletter and notify people of upcoming events, program updates, and success stories.
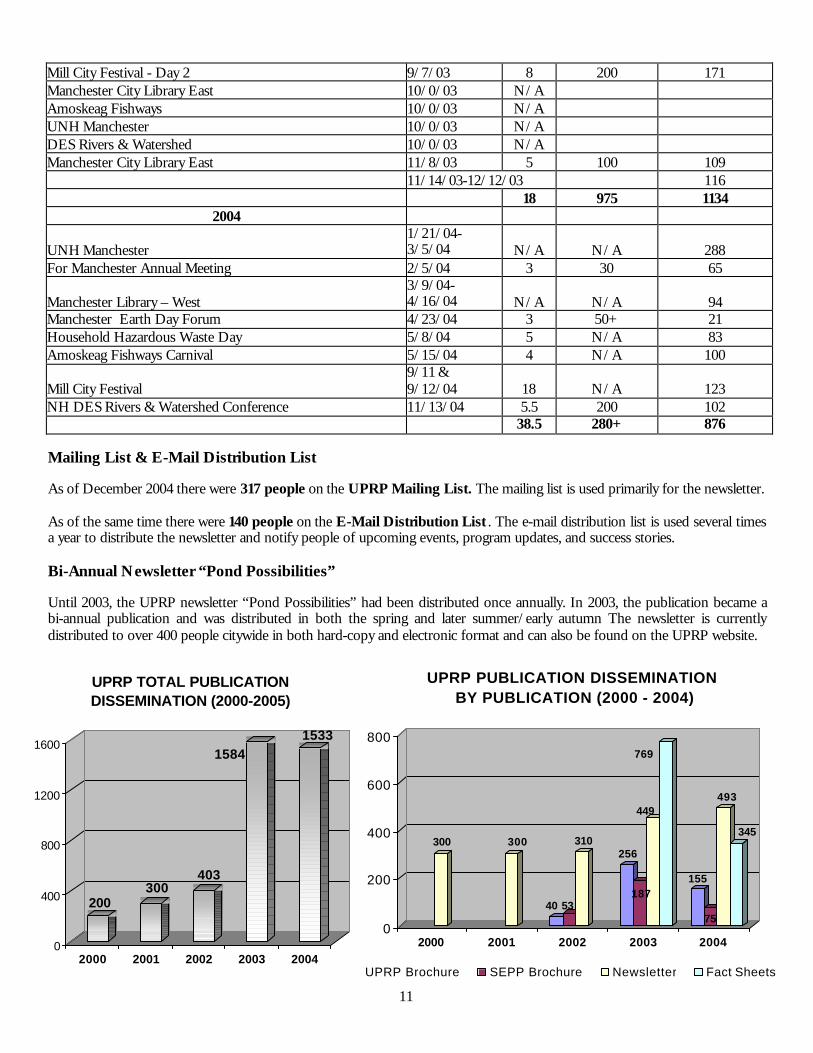
Bi-Annual Newsletter “Pond Possibilities”
Until 2003, the UPRP newsletter “Pond Possibilities” had been distributed once annually. In 2003, the publication became abi-annual publication and was distributed in both the spring and later summer/early autumn The newsletter is currentlydistributed to over 400 people citywide in both hard-copy and electronic format and can also be found on the UPRP website.
200300
403
15841533
0
400
800
1200
1600
2000 2001 2002 2003 2004
UPRP TOTAL PUBLICATION DISSEMINATION (2000-2005)
300 300
40 53
310256
187
449
769
155
75
493
345
0
200
400
600
800
2000 2001 2002 2003 2004
UPRP PUBLICATION DISSEMINATION BY PUBLICATION (2000 - 2004)
UPRP Brochure SEPP Brochure Newsletter Fact Sheets
12
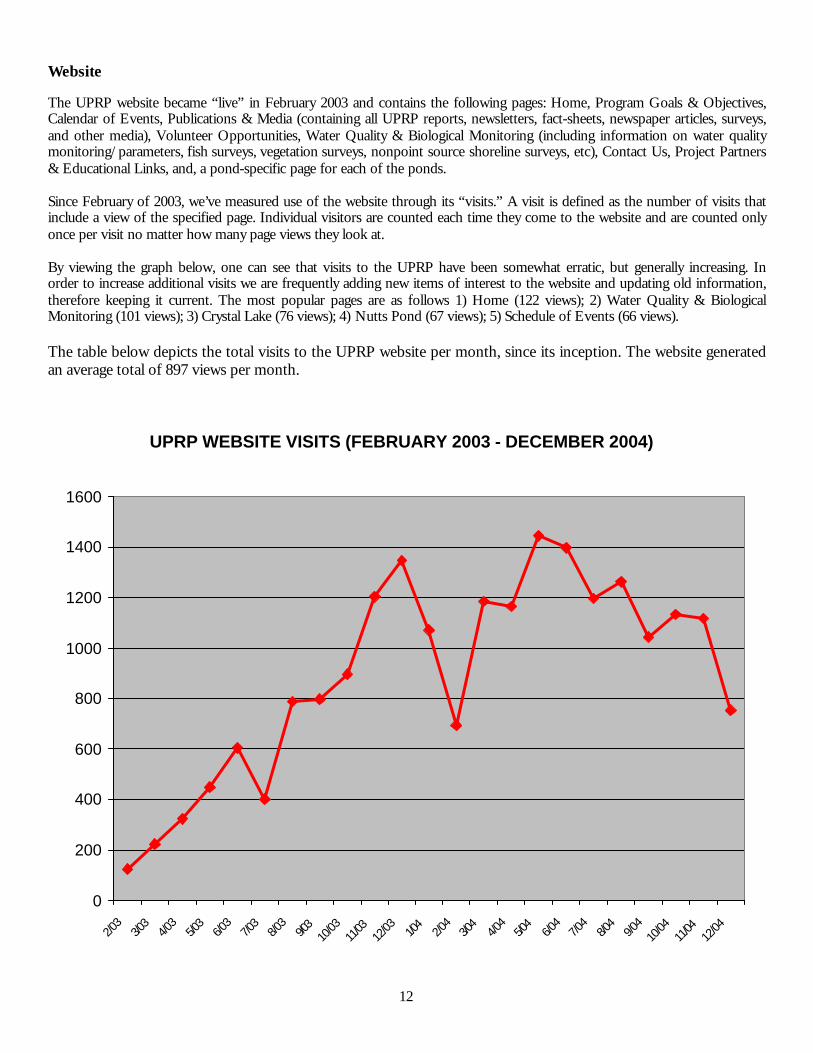
Website
The UPRP website became “live” in February 2003 and contains the following pages: Home, Program Goals & Objectives,Calendar of Events, Publications & Media (containing all UPRP reports, newsletters, fact-sheets, newspaper articles, surveys,and other media), Volunteer Opportunities, Water Quality & Biological Monitoring (including information on water qualitymonitoring/parameters, fish surveys, vegetation surveys, nonpoint source shoreline surveys, etc), Contact Us, Project Partners& Educational Links, and, a pond-specific page for each of the ponds.
Since February of 2003, we’ve measured use of the website through its “visits.” A visit is defined as the number of visits thatinclude a view of the specified page. Individual visitors are counted each time they come to the website and are counted onlyonce per visit no matter how many page views they look at.
By viewing the graph below, one can see that visits to the UPRP have been somewhat erratic, but generally increasing. Inorder to increase additional visits we are frequently adding new items of interest to the website and updating old information,therefore keeping it current. The most popular pages are as follows 1) Home (122 views); 2) Water Quality & BiologicalMonitoring (101 views); 3) Crystal Lake (76 views); 4) Nutts Pond (67 views); 5) Schedule of Events (66 views).
The table below depicts the total visits to the UPRP website per month, since its inception. The website generatedan average total of 897 views per month.
UPRP WEBSITE VISITS (FEBRUARY 2003 - DECEMBER 2004)
0
200
400
600
800
1000
1200
1400
1600
2/03
3/03
4/03
5/03
6/03
7/03
8/03
9/03
10/03
11/03
12/03 1/0
42/0
43/0
44/0
45/0
46/0
47/0
48/0
49/0
410
/0411
/0412
/04
13
SECTION III. SAMPLING PROCEDURES &LABORATORY ANALYSIS COSTS
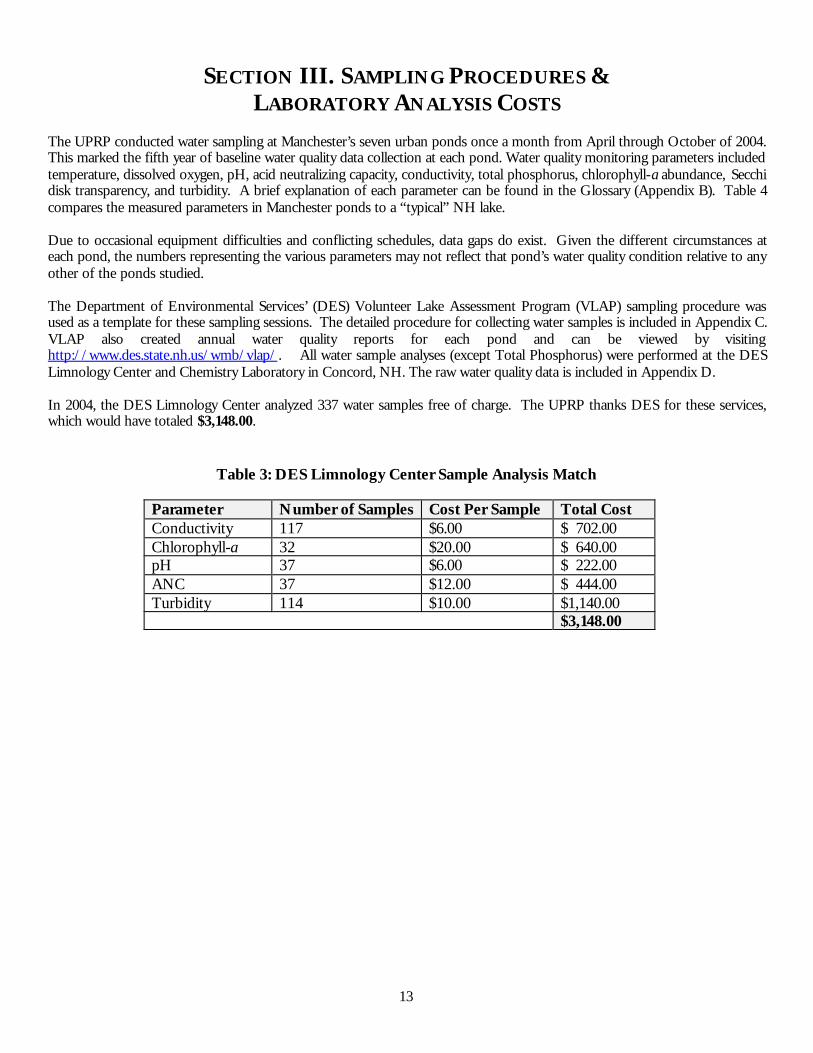
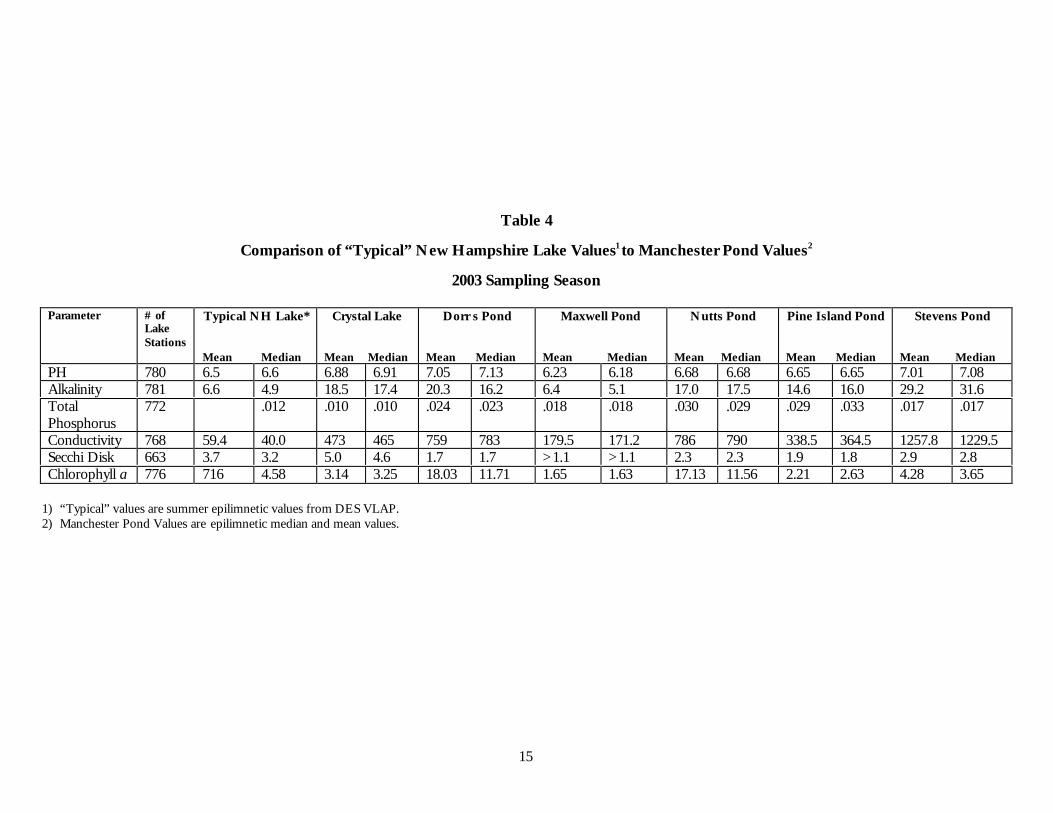
The UPRP conducted water sampling at Manchester’s seven urban ponds once a month from April through October of 2004.This marked the fifth year of baseline water quality data collection at each pond. Water quality monitoring parameters includedtemperature, dissolved oxygen, pH, acid neutralizing capacity, conductivity, total phosphorus, chlorophyll-a abundance, Secchidisk transparency, and turbidity. A brief explanation of each parameter can be found in the Glossary (Appendix B). Table 4compares the measured parameters in Manchester ponds to a “typical” NH lake.
Due to occasional equipment difficulties and conflicting schedules, data gaps do exist. Given the different circumstances ateach pond, the numbers representing the various parameters may not reflect that pond’s water quality condition relative to anyother of the ponds studied.
The Department of Environmental Services’ (DES) Volunteer Lake Assessment Program (VLAP) sampling procedure wasused as a template for these sampling sessions. The detailed procedure for collecting water samples is included in Appendix C.VLAP also created annual water quality reports for each pond and can be viewed by visitinghttp://www.des.state.nh.us/wmb/vlap/. All water sample analyses (except Total Phosphorus) were performed at the DESLimnology Center and Chemistry Laboratory in Concord, NH. The raw water quality data is included in Appendix D.
In 2004, the DES Limnology Center analyzed 337 water samples free of charge. The UPRP thanks DES for these services,which would have totaled $3,148.00.
Table 3: DES Limnology Center Sample Analysis Match
Parameter Number of Samples Cost Per Sample Total CostConductivity 117 $6.00 $ 702.00Chlorophyll-a 32 $20.00 $ 640.00pH 37 $6.00 $ 222.00ANC 37 $12.00 $ 444.00Turbidity 114 $10.00 $1,140.00
$3,148.00

15
Table 4
Comparison of “Typical” New Hampshire Lake Values1 to Manchester Pond Values2
2003 Sampling Season
Parameter # ofLakeStations
Typical NH Lake*
Mean Median
Crystal Lake
Mean Median
Dorr s Pond
Mean Median
Maxwell Pond
Mean Median
Nutts Pond
Mean Median
Pine Island Pond
Mean Median
Stevens Pond
Mean MedianPH 780 6.5 6.6 6.88 6.91 7.05 7.13 6.23 6.18 6.68 6.68 6.65 6.65 7.01 7.08Alkalinity 781 6.6 4.9 18.5 17.4 20.3 16.2 6.4 5.1 17.0 17.5 14.6 16.0 29.2 31.6TotalPhosphorus
772 .012 .010 .010 .024 .023 .018 .018 .030 .029 .029 .033 .017 .017
Conductivity 768 59.4 40.0 473 465 759 783 179.5 171.2 786 790 338.5 364.5 1257.8 1229.5Secchi Disk 663 3.7 3.2 5.0 4.6 1.7 1.7 >1.1 >1.1 2.3 2.3 1.9 1.8 2.9 2.8Chlorophyll a 776 716 4.58 3.14 3.25 18.03 11.71 1.65 1.63 17.13 11.56 2.21 2.63 4.28 3.65
1) “Typical” values are summer epilimnetic values from DES VLAP.2) Manchester Pond Values are epilimnetic median and mean values.

16

17
SECTION IV.
WATER QUALITY MONITORING & STATUS OF MANCHESTER’S URBAN PONDS

18
19
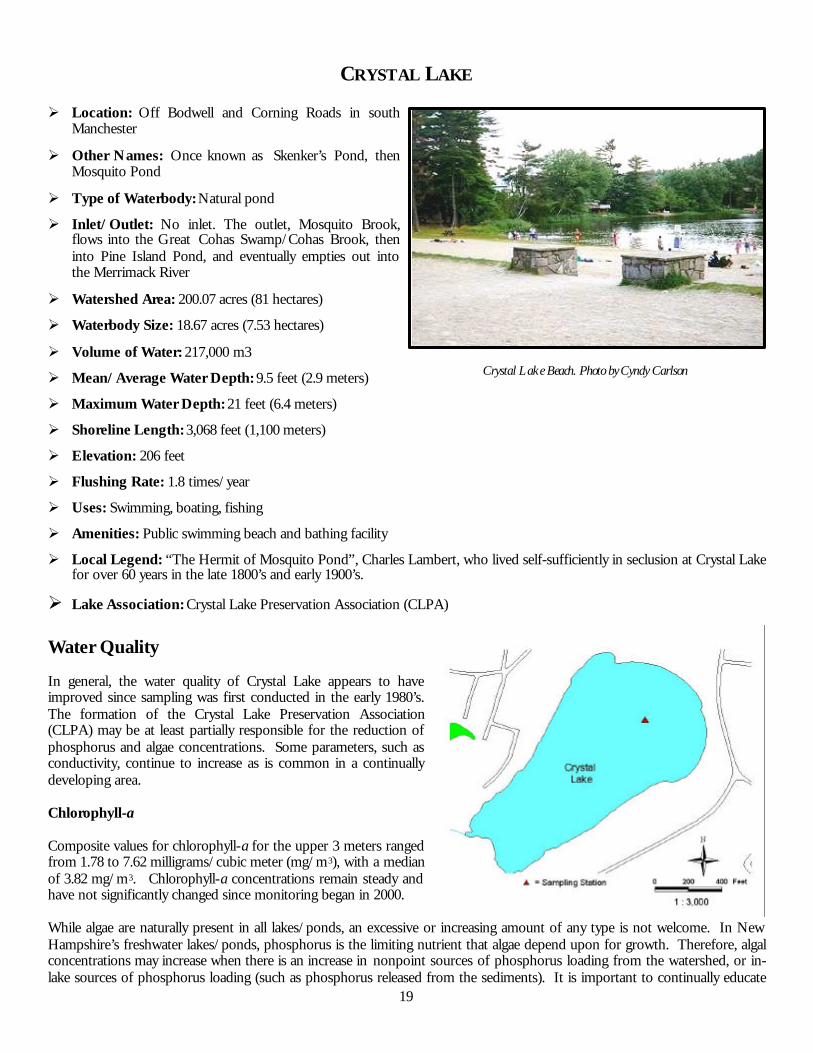
CRYSTAL LAKE
Ø Location: Off Bodwell and Corning Roads in southManchester
Ø Other Names: Once known as Skenker’s Pond, thenMosquito Pond
Ø Type of Waterbody: Natural pond
Ø Inlet/Outlet: No inlet. The outlet, Mosquito Brook,flows into the Great Cohas Swamp/Cohas Brook, theninto Pine Island Pond, and eventually empties out intothe Merrimack River
Ø Watershed Area: 200.07 acres (81 hectares)
Ø Waterbody Size: 18.67 acres (7.53 hectares)
Ø Volume of Water: 217,000 m3
Ø Mean/Average Water Depth: 9.5 feet (2.9 meters)
Ø Maximum Water Depth: 21 feet (6.4 meters)
Ø Shoreline Length: 3,068 feet (1,100 meters)
Ø Elevation: 206 feet
Ø Flushing Rate: 1.8 times/year
Ø Uses: Swimming, boating, fishing
Ø Amenities: Public swimming beach and bathing facility
Ø Local Legend: “The Hermit of Mosquito Pond”, Charles Lambert, who lived self-sufficiently in seclusion at Crystal Lakefor over 60 years in the late 1800’s and early 1900’s.
Ø Lake Association: Crystal Lake Preservation Association (CLPA)
Water Quality
In general, the water quality of Crystal Lake appears to haveimproved since sampling was first conducted in the early 1980’s.The formation of the Crystal Lake Preservation Association(CLPA) may be at least partially responsible for the reduction ofphosphorus and algae concentrations. Some parameters, such asconductivity, continue to increase as is common in a continuallydeveloping area.
Chlorophyll-a
Composite values for chlorophyll-a for the upper 3 meters rangedfrom 1.78 to 7.62 milligrams/cubic meter (mg/m3), with a medianof 3.82 mg/m3. Chlorophyll-a concentrations remain steady andhave not significantly changed since monitoring began in 2000.
While algae are naturally present in all lakes/ponds, an excessive or increasing amount of any type is not welcome. In NewHampshire’s freshwater lakes/ponds, phosphorus is the limiting nutrient that algae depend upon for growth. Therefore, algalconcentrations may increase when there is an increase in nonpoint sources of phosphorus loading from the watershed, or in-lake sources of phosphorus loading (such as phosphorus released from the sediments). It is important to continually educate
Crystal Lake Beach. Photo by Cyndy Carlson

20
residents about how activities within the watershed can affect phosphorus loading and lake quality, (i.e. excessive lawnfertilization and unmanaged pet wastes).
Conductivity
Conductivity in the epilimnion (top layers) ranged from 447 to 468 uMhos/cm, with an average of 459 uMhos/cm. Theconductivity has increased in the lake with the exception of 2004, since monitoring began in 2000.
Dissolved Oxygen (DO)
The dissolved oxygen concentration was low in the hypolimnion (bottom layer) at the deep spot of the lake during the midand late summer sampling events. The June sampling event found the water column to be supersaturated. As stratified lakesage, oxygen becomes depleted in the hypolimnion. In addition, depleted oxygen concentration in the hypolimnion ofthermally stratified lakes (cold bottom layer, warmer top layer) typically occurs as the summer progresses. Specifically, the lossof oxygen in the hypolimnion results primarily from the process of biological breakdown of organic matter (i.e.; biologicalorganisms use oxygen to break down organic matter), both in the water column and particularly at the bottom of thelake/pond where the water meets the sediment. When oxygen levels are depleted to less than 1 mg/L in the hypolimnion thephosphorus that is normally bound up in the sediment may be re-released into the water column
pH and Acid Neutralizing Capacity (ANC)
The mean pH at the deep spot this season ranged from 6.79 to 7.14, which means that the water column ranges from beingslightly acidic to slightly basic.
The Acid Neutralizing Capacity (ANC) ranged from 5.3 to 19.3 mg/L of CaCO3 with an average of 14.4. This is much greaterthe state mean of 6.7 mg/L. Specifically, this means that the lake/pond has a “low vulnerability” to acidic inputs (such as acidprecipitation)
Phosphorus (TP)
The total phosphorus concentration measured in the epilimnion ranged from 0.008 to 0.017 mg/L, with a mean of 0.012mg/L. The median was 0.009 mg/L.
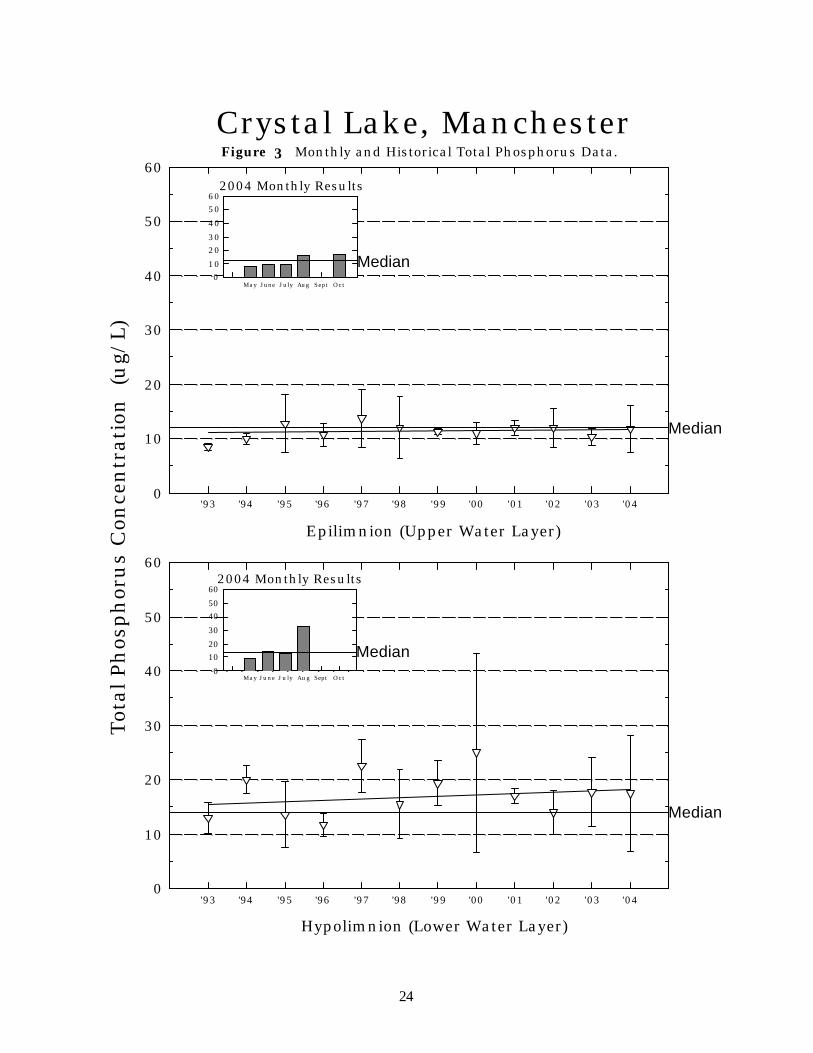
The current year data for the epilimnion (see Figure 3) show that the total phosphorus concentration increasedthrough the season, peaking in October. The historical data show that the 2004 median epilimnetic total phosphorusconcentration is slightly lower than the state median.
The current year data for the hypolimnion show that the total phosphorus concentration remained fairly steady early in theseason, then increased by the end of August.
Overall, the statistical analysis of the historical data show that the total phosphorus concentration in the epilimnion and thehypolimnion has not significantly changed since monitoring began in 1993. Specifically, the total phosphorus concentration inthe epilimnion and hypolimnion has varied, but has not continually increased or decreased since monitoring began.
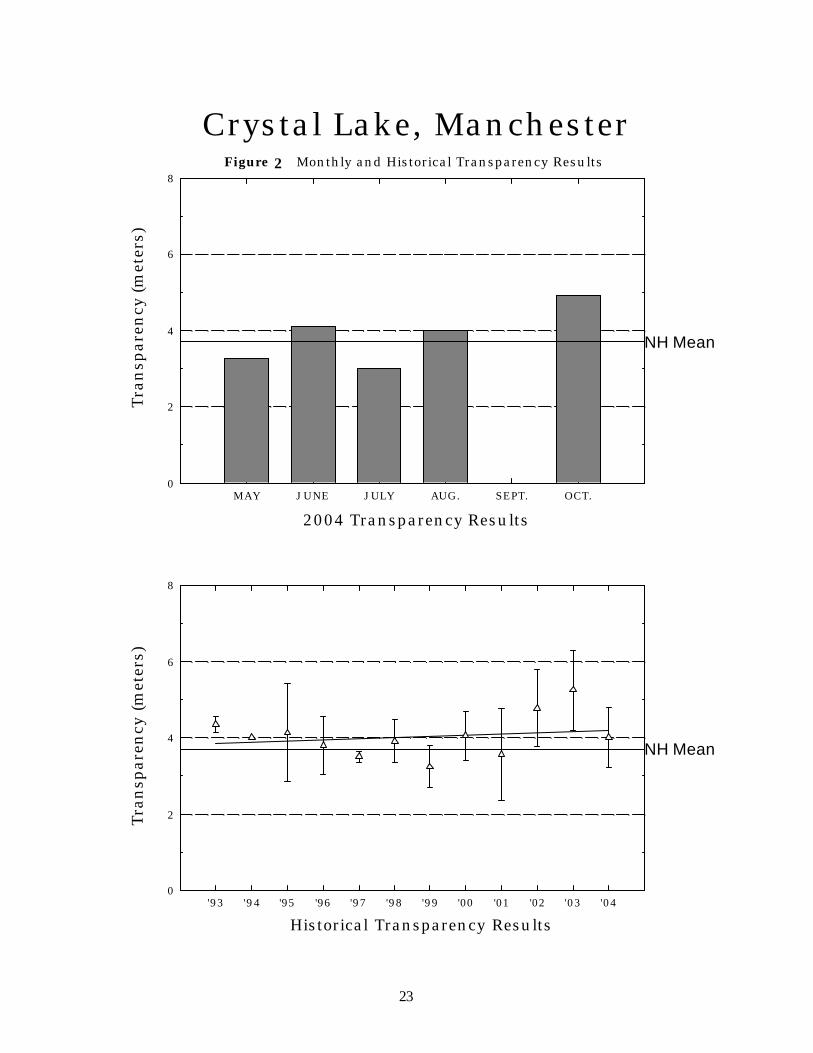
Transparency
Secchi disk transparency ranged from 3.0 to 4.9 meters, with a median of 4.0.
The current year data (see Figure 2) show that the in-lake transparency increased from May to June this season, worsened inJuly then increased through October.
The historical data show that the 2004 mean transparency is greater than the state mean.
Overall, the statistical analysis of the historical data show that the mean annual in-lake transparency has not significantlychanged since monitoring began in 1993. Specifically, the in-lake transparency has remained relatively stable and has rangedbetween approximately 3.0 to 5.0 meters.
21
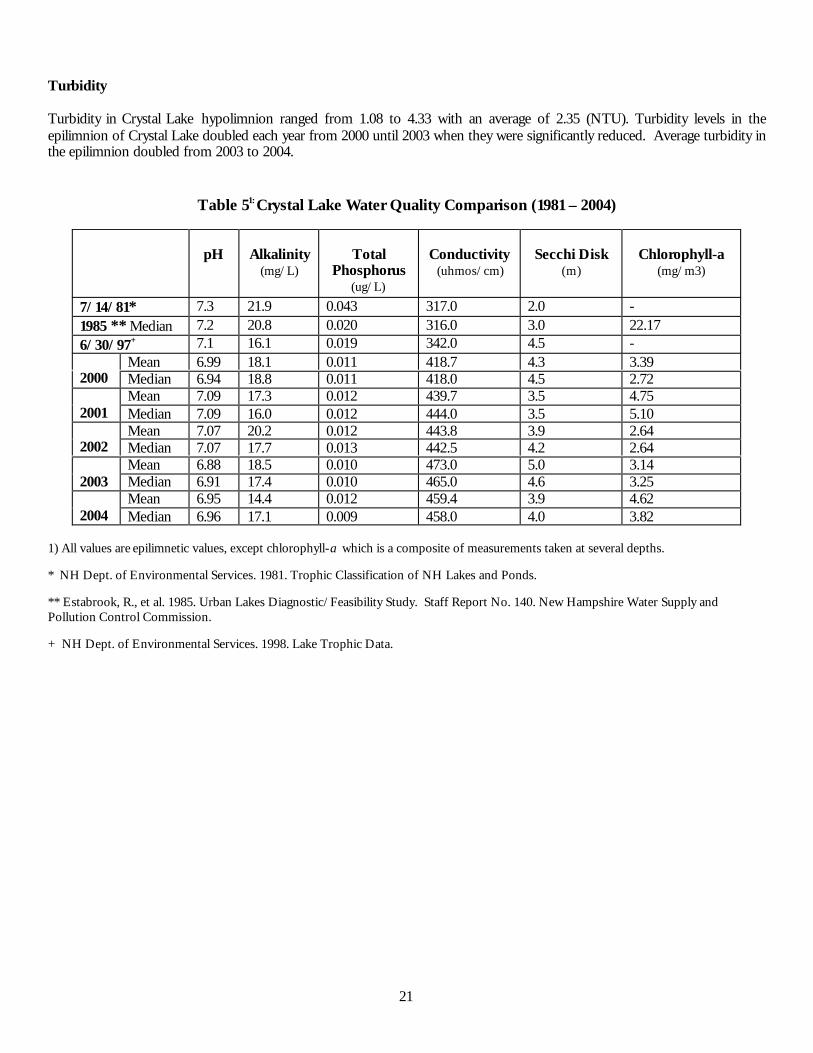
Turbidity
Turbidity in Crystal Lake hypolimnion ranged from 1.08 to 4.33 with an average of 2.35 (NTU). Turbidity levels in theepilimnion of Crystal Lake doubled each year from 2000 until 2003 when they were significantly reduced. Average turbidity inthe epilimnion doubled from 2003 to 2004.
Table 51: Crystal Lake Water Quality Comparison (1981 – 2004)
pH Alkalinity(mg/L)
TotalPhosphorus
(ug/L)
Conductivity(uhmos/cm)
Secchi Disk(m)
Chlorophyll-a(mg/m3)
7/14/81* 7.3 21.9 0.043 317.0 2.0 -1985 ** Median 7.2 20.8 0.020 316.0 3.0 22.176/30/97+ 7.1 16.1 0.019 342.0 4.5 -
Mean 6.99 18.1 0.011 418.7 4.3 3.392000 Median 6.94 18.8 0.011 418.0 4.5 2.72
Mean 7.09 17.3 0.012 439.7 3.5 4.752001 Median 7.09 16.0 0.012 444.0 3.5 5.10
Mean 7.07 20.2 0.012 443.8 3.9 2.642002 Median 7.07 17.7 0.013 442.5 4.2 2.64
Mean 6.88 18.5 0.010 473.0 5.0 3.142003 Median 6.91 17.4 0.010 465.0 4.6 3.25
Mean 6.95 14.4 0.012 459.4 3.9 4.622004 Median 6.96 17.1 0.009 458.0 4.0 3.82
1) All values are epilimnetic values, except chlorophyll-a which is a composite of measurements taken at several depths.
* NH Dept. of Environmental Services. 1981. Trophic Classification of NH Lakes and Ponds.
** Estabrook, R., et al. 1985. Urban Lakes Diagnostic/Feasibility Study. Staff Report No. 140. New Hampshire Water Supply andPollution Control Commission.
+ NH Dept. of Environmental Services. 1998. Lake Trophic Data.

22
2
2004 Chlorophyll-a Results
Crystal Lake, ManchesterC
hlo
roph
yll-
a (m
g/m
3)
Ch
loro
ph
yll-
a (m
g/m
3 )
MAY JUNE JULY AUG SEPT OCT0
4
8
12
16
NH Mean
'93 '94 '95 '96 '97 '98 '99 '00 '01 '02 '03 '040
4
8
12
16
NH Mean
Figure 1. Monthly and Historical Chlorophyll-a Results
Historical Chlorophyll-a Results
23
Tra
nsp
aren
cy (m
eter
s)
2004 Transparency Results
Tran
spar
ency
(m
eter
s)Crystal Lake, Manchester
MAY JUNE JULY AUG. SEPT. OCT.0
2
4
6
8
NH Mean
'93 '94 '95 '96 '97 '98 '99 '00 '01 '02 '03 '040
2
4
6
8
NH Mean
Figure 2. Monthly and Historical Transparency Results
Historical Transparency Results
2
24
'93 '94 '95 '96 '97 '98 '99 '00 '01 '02 '03 '040
10
20
30
40
50
60
Median
May June July Aug Sept Oct0
1020
30
4050
60
Median
'93 '94 '95 '96 '97 '98 '99 '00 '01 '02 '03 '040
10
20
30
40
50
60
Median
May June July Aug Sept Oct0
10
2030
40
5060
Median
Crystal Lake, ManchesterTot
al P
hos
ph
oru
s C
once
ntr
atio
n (u
g/L)
2004 Monthly Results
2004 Monthly Results
Hypolimnion (Lower Water Layer)
Figure 3. Monthly and Historical Total Phosphorus Data.
Epilimnion (Upper Water Layer)
3
25
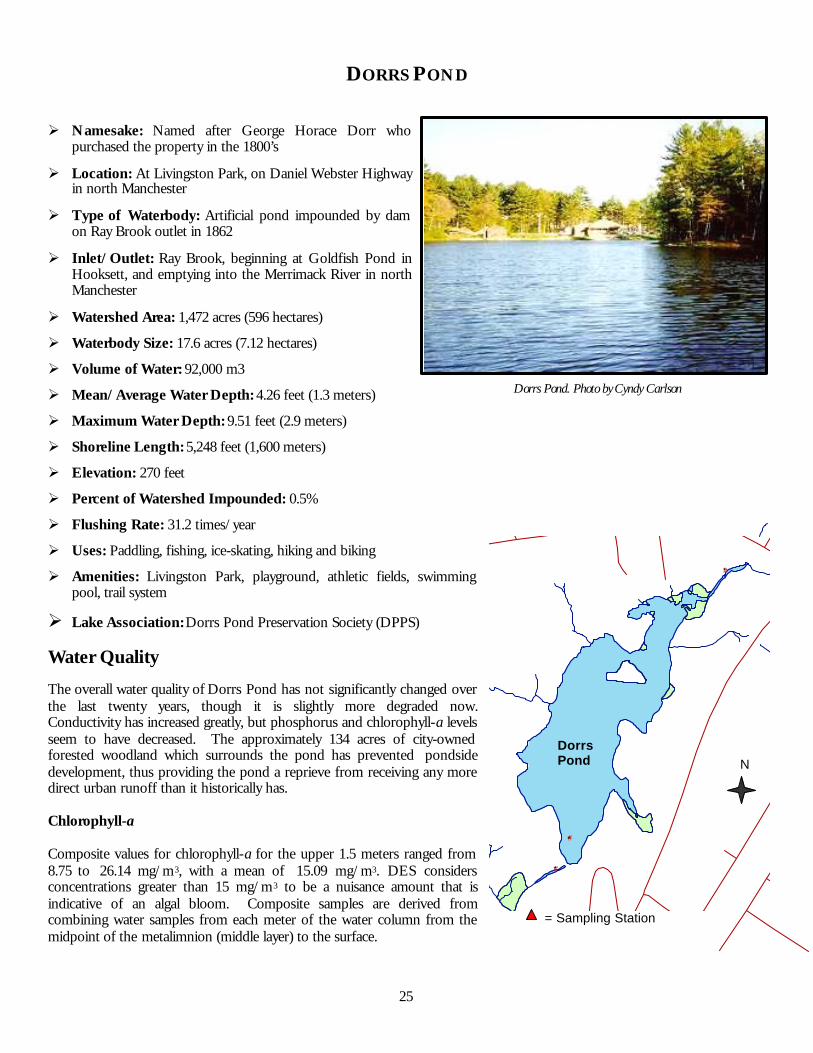
DORRS POND
Ø Namesake: Named after George Horace Dorr whopurchased the property in the 1800’s
Ø Location: At Livingston Park, on Daniel Webster Highwayin north Manchester
Ø Type of Waterbody: Artificial pond impounded by damon Ray Brook outlet in 1862
Ø Inlet/Outlet: Ray Brook, beginning at Goldfish Pond inHooksett, and emptying into the Merrimack River in northManchester
Ø Watershed Area: 1,472 acres (596 hectares)
Ø Waterbody Size: 17.6 acres (7.12 hectares)
Ø Volume of Water: 92,000 m3
Ø Mean/Average Water Depth: 4.26 feet (1.3 meters)
Ø Maximum Water Depth: 9.51 feet (2.9 meters)
Ø Shoreline Length: 5,248 feet (1,600 meters)
Ø Elevation: 270 feet
Ø Percent of Watershed Impounded: 0.5%
Ø Flushing Rate: 31.2 times/year
Ø Uses: Paddling, fishing, ice-skating, hiking and biking
Ø Amenities: Livingston Park, playground, athletic fields, swimmingpool, trail system
Ø Lake Association: Dorrs Pond Preservation Society (DPPS)
Water Quality
The overall water quality of Dorrs Pond has not significantly changed overthe last twenty years, though it is slightly more degraded now.Conductivity has increased greatly, but phosphorus and chlorophyll-a levelsseem to have decreased. The approximately 134 acres of city-ownedforested woodland which surrounds the pond has prevented pondsidedevelopment, thus providing the pond a reprieve from receiving any moredirect urban runoff than it historically has.
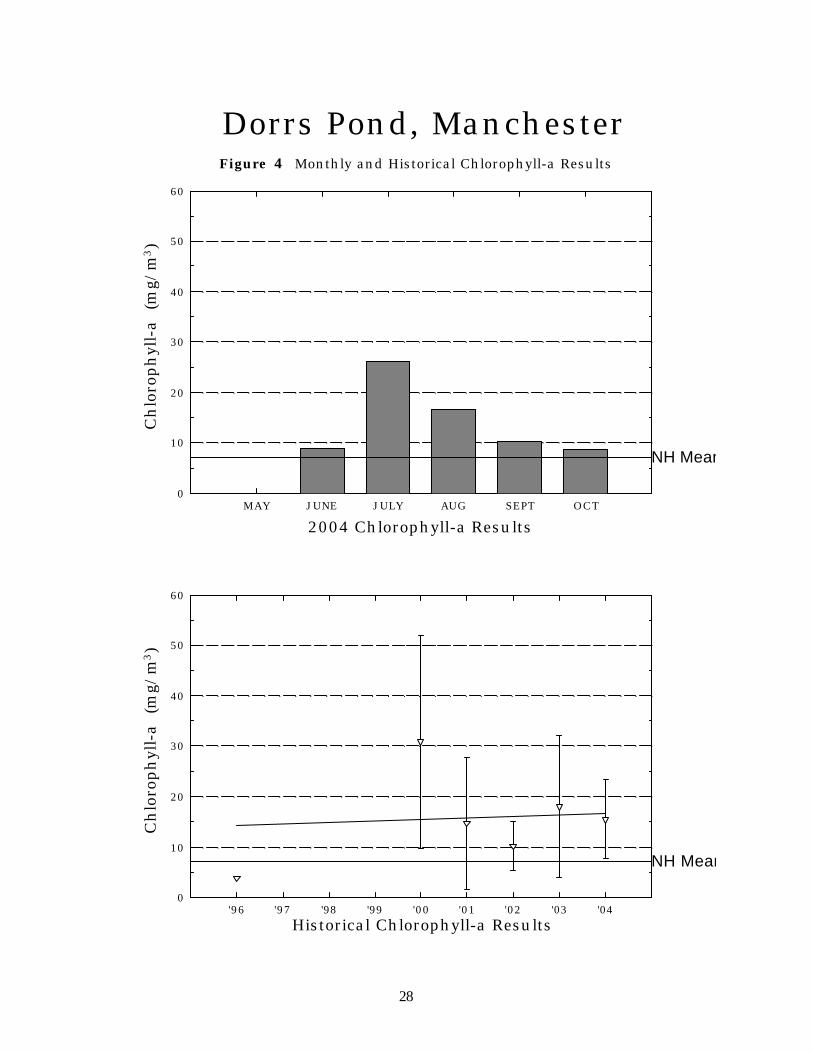
Chlorophyll-a
Composite values for chlorophyll-a for the upper 1.5 meters ranged from8.75 to 26.14 mg/m3, with a mean of 15.09 mg/m3. DES considersconcentrations greater than 15 mg/m3 to be a nuisance amount that isindicative of an algal bloom. Composite samples are derived fromcombining water samples from each meter of the water column from themidpoint of the metalimnion (middle layer) to the surface.
Dorrs Pond. Photo by Cyndy Carlson
= Sampling Station
#*
#*
#*
DorrsPond N
26
The current year data (see Figure 5) show that the chlorophyll-a concentration was relatively low at the start and end of theseason, and peaked in July.
The historical data show that the 2004 chlorophyll-a mean is more than twice the state mean.
Overall, visual inspection of the historical data shows consistent variation in-lake chlorophyll-a, meaning that theconcentration has fluctuated since monitoring originally began in 1996.
Conductivity
Conductivity in the epilimnion ranged from 533 to 757 uMhos/cm, with a mean of 644 uMhos/cm. When the pond wasstratified, the hypolimnion conductivity averaged 652.5 uMhos/cm. Conductivity has steadily dropped for the past two years.As expected, the two major inlets also were highly conductive, averaging 850 and 807 uMhos/cm each. Though theserepresent decreases from previous years, these are still very high conductivity levels, most likely caused by the large amount ofurban runoff that this location receives. Mean conductivity levels have risen significantly since 1985.
Dissolved Oxygen (DO)
Hypolimnion dissolved oxygen readings varied greatly from month to month at Dorrs Pond. This may be due to the shallowarea in which readings were taken. The sampling station is relatively close to the dam/outlet which creates a current in thisarea. Factors influencing pond flow, such as precipitation, may also influence dissolved oxygen concentration in this particulararea.
The dissolved oxygen concentration was consistently low in the hypolimnion at the deep spot of the pond, but not depleted.The season’s lowest recorded dissolved oxygen saturation was 40%. As stratified lakes/ponds age, oxygen becomes depletedin the hypolimnion (the lower layer) by the process of decomposition. Specifically, the loss of oxygen in the hypolimnionresults primarily from the process of biological breakdown of organic matter (i.e.; biological organisms use oxygen to breakdown organic matter), both in the water column and particularly at the bottom of the lake/pond where the water meets thesediment. When oxygen levels are depleted to less than 1 mg/L in the hypolimnion, the phosphorus that is normally boundup in the sediment may be re-released into the water column.
pH and Acid Neutralizing Capacity (ANC)
The pH of Dorrs Pond ranged from 6.72 to 7.47, with an average of 6.97. pH values in the 1985 DES study were notsignificantly different than those taken from 2000 through 2004. The 1985 median was 7.0. Alkalinity, or Acid NeutralizingCapacity (ANC) ranged from 20.6 to 28.4 mg of CaCO/L, peaking in August, with an average of 24.3 mg/L in 2004. This ismuch greater than the state mean of 6.7 mg/L. Specifically, this means that the pond is “not vulnerable” to acidic inputs (suchas acid precipitation).
Total Phosphorus (TP)
The total phosphorus concentration (TP) measured in the epilimnion of Dorrs Pond varied from .020 to .036 mg/L, with amean of .028 mg/L. This is an increase from TP levels measured in 2003. When the pond was stratified, TP in the lower levelor hypolimnion reached 0.042 mg/L. Two of the pond’s main inlets are still significant sources of phosphorus input, evenwith apparent reduction from last year at Lessard’s Brook. Lessard’s Brook averaged 0.026 mg/L of TP and Inlet 2 Eastaveraged 0.038 mg/L of TP.
The current year data (Figure 7) for the epilimnion show that the total phosphorus concentration remained relatively steadywith a peak in August. The total phosphorus concentration on each sampling event was greater than the state median.
Overall, visual inspection of the historical data trend line for the epilimnion shows relatively stable total phosphorus trendsince monitoring began in 1996.

27
Transparency
Secchi disk transparency ranged from 1.1 to 2.5 meters, with a median of 1.6 meters. The minimum transparency wasrecorded in July. Water clarity and chlorophyll-a concentrations seem to be somewhat related since water clarity andchlorophyll a both peaked in July.
Overall, visual inspection of the historical data trend line (see Figure 6) shows a stable trend for in-lake transparency, meaningthat the transparency has not varied greatly since monitoring began in 1996.
Turbidity
Turbidity of epilimnion samples ranged from 2.90 to 6.64 (NTU), with an average of 4.61 (NTU) in 2004. High turbidity ismost likely caused by a large volume of urban runoff to this location. Turbidity measurements were not taken at Dorrs Pondduring the 1985 DES Diagnostic/Feasibility Study.
Table 61: Dorrs Pond Water Quality Comparison (1981 – 2004)
pH Alkalinity (mg/L)
TotalPhosphorus
(ug/L)
Conductivity(umhos/cm)
Secchi Disk(m)
Chlorophyll-a(mg/m3)
7/14/81* 6.80 13.9 0.060 201 1.3 -1985 ** Median 7.00 15.4 0.042 258 1.6 38.847/17/97+ 7.10 22.2 0.031 469 1.3 -
Mean 7.08 16.2 0.045 408 1.1 30.842000 Median 7.08 - - - 1.0 -
Mean 7.15 21.7 0.024 831.3 1.3 14.752001 Median 7.09 21.9 0.024 851.0 1.1 9.74
Mean 7.07 26.5 0.021 882.6 2.0 8.402002 Median 7.07 26.5 0.021 899.0 2.0 8.72
Mean 7.05 20.3 0.024 759.0 1.7 18.032003 Median 7.13 16.2 0.023 783.0 1.7 11.71
Mean 6.97 24.3 0.028 644.0 1.7 15.092004 Median 6.87 23.8 0.028 648.0 1.6 12.74
1) All values are epilimnetic, except chlorophyll-a which is a composite.
* NH Dept. of Environmental Services. 1981. Trophic Classification of NH Lakes and Ponds.
** Estabrook, R., et.al. 1985. Urban Lakes Diagnostic/Feasibility Study. Staff Report No. 140. New Hampshire Water Supply andPollution Control Commission.
+ NH Dept. Of Environmental Services. 1998. Lake Trophic Data.
28
2004 Chlorophyll-a Results
Dorrs Pond, ManchesterC
hlo
roph
yll-
a (m
g/m
3)
Ch
loro
ph
yll-
a (m
g/m
3)
MAY JUNE JULY AUG SEPT OCT0
10
20
30
40
50
60
NH Mean
'96 '97 '98 '99 '00 '01 '02 '03 '040
10
20
30
40
50
60
NH Mean
Figure 1. Monthly and Historical Chlorophyll-a Results
Historical Chlorophyll-a Results
4

29
Tran
spar
ency
(m
eter
s)
2004 Transparency Results
Tra
nsp
aren
cy (m
eter
s)Dorrs Pond, Manchester
MAY JUNE JULY AUG. SEPT. OCT.0
2
4
6
8
NH Mean
'96 '97 '98 '99 '00 '01 '02 '03 '040
2
4
6
8
NH Mean
Figure 2. Monthly and Historical Transparency Results
Historical Transparency Results
5.

30
'96 '97 '98 '99 '00 '01 '02 '03 '040
20
40
60
80
100
Median
May June July Aug Sept Oct0
20
40
60
80
100
Median
'96 '97 '98 '99 '00 '01 '02 '03 '040
20
40
60
80
100
Median
May June July Aug Sept Oct0
20
40
60
80
100
Median
Dorrs Pond, ManchesterTot
al P
hos
ph
oru
s C
once
ntr
atio
n (u
g/L)
2004 Monthly Results
2004 Monthly Results
Hypolimnion (Lower Water Layer)
Figure 3. Monthly and Historical Total Phosphorus Data.
Epilimnion (Upper Water Layer)
6.

31
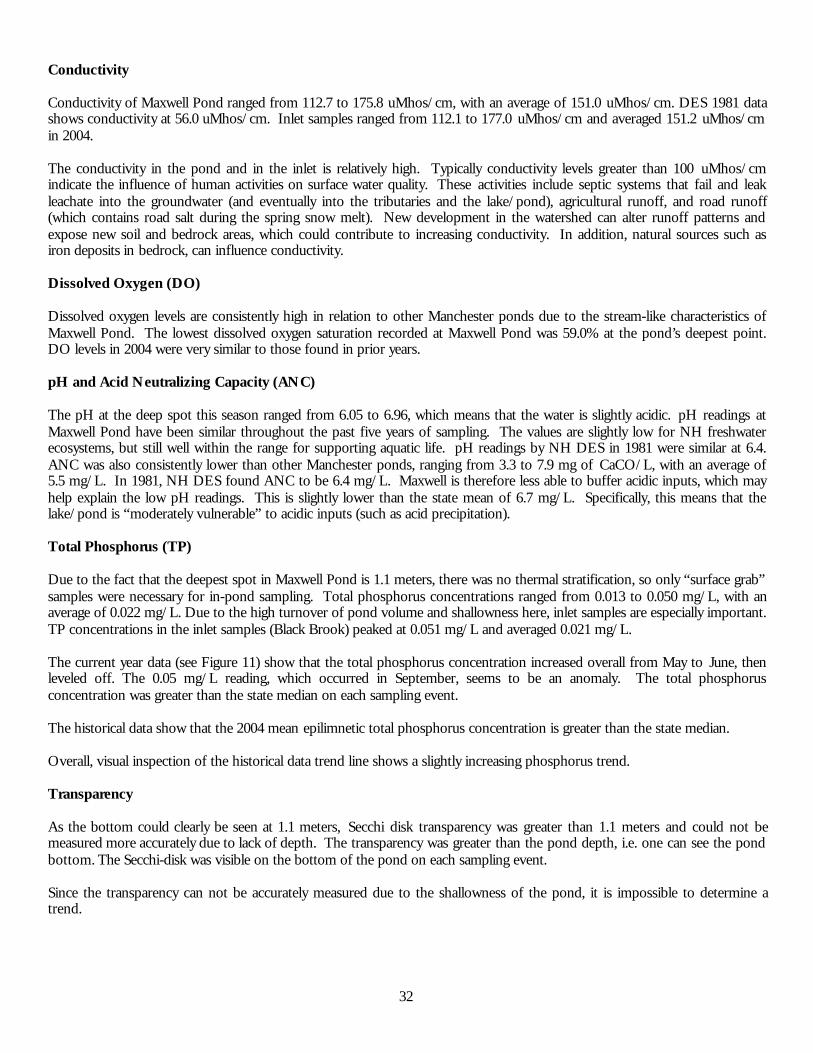
MAXWELL POND
Ø Namesake: Named after A.H. Maxwell, who ownedManchester Coal & Ice Company
Ø Location: Front Street at the intersection of DunbartonRoad, in northwest Manchester
Ø Type of Waterbody: Artificial Pond created byimpoundment on Black Brook in 1900
Ø Inlet/Outlet: Black Brook, beginning in Dunbarton andemptying into the Merrimack River under I293 innorthwest Manchester
Ø Watershed Area: 1,502 acres (608 hectares)
Ø Waterbody Size: 5.5 acres (2.22 hectares)
Ø Volume of Water: 12,900 m3
Ø Mean Water Depth: 4 feet (1.2 meters)
Ø Maximum Water Depth: 13.12 feet (4.0 meters)
Ø Shoreline Length: 10,168 feet (3,100 meters)
Ø Elevation: 235 feet
Ø Flushing Rate: 217 times/year
Ø Uses: Fishing, passive recreation, environmental education
Ø Amenities: Blodget Park playground
Water Quality
The water quality of Maxwell Pond is better than anyother Manchester Pond. Maxwell Pond has a very highturnover rate and relatively little urban development inthe watershed. Its stream-like characteristics allowmost nutrients to wash downstream. However, rapidsedimentation (due to the dam) and vegetation growthis occurring in some parts of the pond.
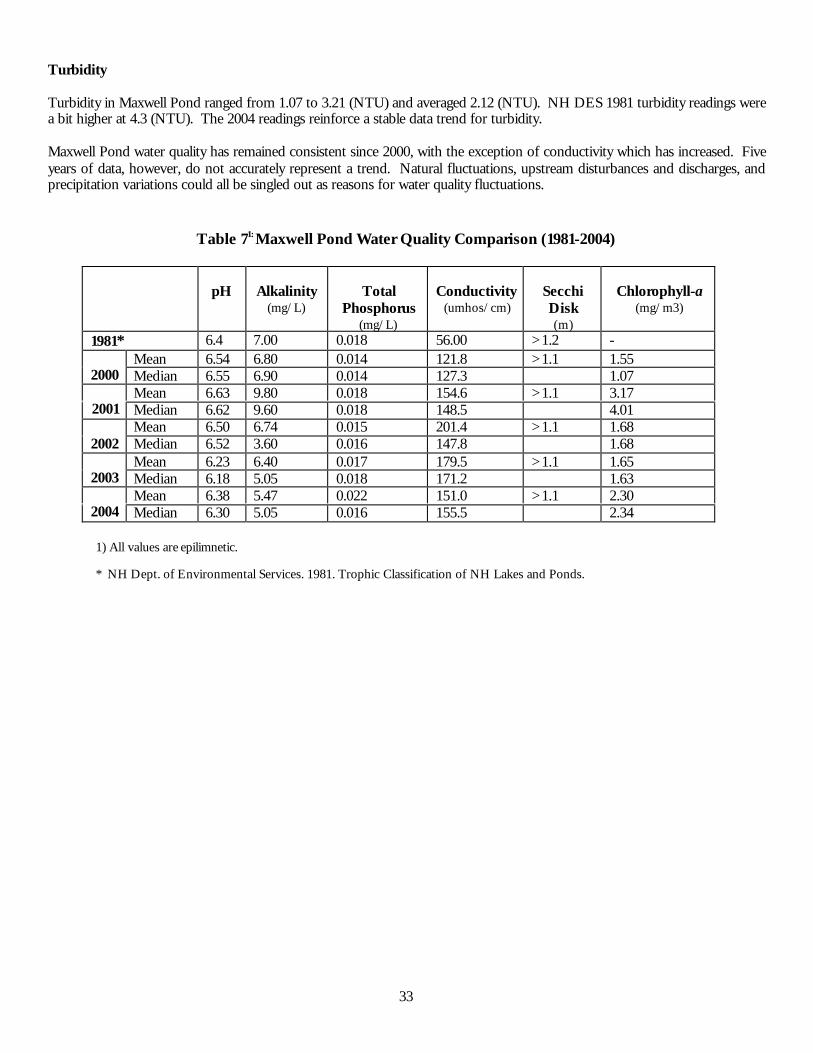
Chlorophyll-a
Chlorophyll-a concentrations were low, ranging from1.40 to 3.04 mg/m3, and averaging 2.30 mg/m3. Theselow readings are most likely due to the pond’s highflushing rate.The current year data (see Figure 9) show that thechlorophyll-a concentration fluctuated only slightlythroughout the season. The historical data show thatthe 2004 chlorophyll-a mean is less than the state mean.
Overall, visual inspection of the historical data trendline shows a stable in-lake chlorophyll a trend, meaningthat the concentration has remained approximately the same since monitoring began in 2000.
Maxwell Pond. Photo by Jen Drociak
32
Conductivity
Conductivity of Maxwell Pond ranged from 112.7 to 175.8 uMhos/cm, with an average of 151.0 uMhos/cm. DES 1981 datashows conductivity at 56.0 uMhos/cm. Inlet samples ranged from 112.1 to 177.0 uMhos/cm and averaged 151.2 uMhos/cmin 2004.
The conductivity in the pond and in the inlet is relatively high. Typically conductivity levels greater than 100 uMhos/cmindicate the influence of human activities on surface water quality. These activities include septic systems that fail and leakleachate into the groundwater (and eventually into the tributaries and the lake/pond), agricultural runoff, and road runoff(which contains road salt during the spring snow melt). New development in the watershed can alter runoff patterns andexpose new soil and bedrock areas, which could contribute to increasing conductivity. In addition, natural sources such asiron deposits in bedrock, can influence conductivity.
Dissolved Oxygen (DO)
Dissolved oxygen levels are consistently high in relation to other Manchester ponds due to the stream-like characteristics ofMaxwell Pond. The lowest dissolved oxygen saturation recorded at Maxwell Pond was 59.0% at the pond’s deepest point.DO levels in 2004 were very similar to those found in prior years.
pH and Acid Neutralizing Capacity (ANC)
The pH at the deep spot this season ranged from 6.05 to 6.96, which means that the water is slightly acidic. pH readings atMaxwell Pond have been similar throughout the past five years of sampling. The values are slightly low for NH freshwaterecosystems, but still well within the range for supporting aquatic life. pH readings by NH DES in 1981 were similar at 6.4.ANC was also consistently lower than other Manchester ponds, ranging from 3.3 to 7.9 mg of CaCO/L, with an average of5.5 mg/L. In 1981, NH DES found ANC to be 6.4 mg/L. Maxwell is therefore less able to buffer acidic inputs, which mayhelp explain the low pH readings. This is slightly lower than the state mean of 6.7 mg/L. Specifically, this means that thelake/pond is “moderately vulnerable” to acidic inputs (such as acid precipitation).
Total Phosphorus (TP)
Due to the fact that the deepest spot in Maxwell Pond is 1.1 meters, there was no thermal stratification, so only “surface grab”samples were necessary for in-pond sampling. Total phosphorus concentrations ranged from 0.013 to 0.050 mg/L, with anaverage of 0.022 mg/L. Due to the high turnover of pond volume and shallowness here, inlet samples are especially important.TP concentrations in the inlet samples (Black Brook) peaked at 0.051 mg/L and averaged 0.021 mg/L.
The current year data (see Figure 11) show that the total phosphorus concentration increased overall from May to June, thenleveled off. The 0.05 mg/L reading, which occurred in September, seems to be an anomaly. The total phosphorusconcentration was greater than the state median on each sampling event.
The historical data show that the 2004 mean epilimnetic total phosphorus concentration is greater than the state median.
Overall, visual inspection of the historical data trend line shows a slightly increasing phosphorus trend.
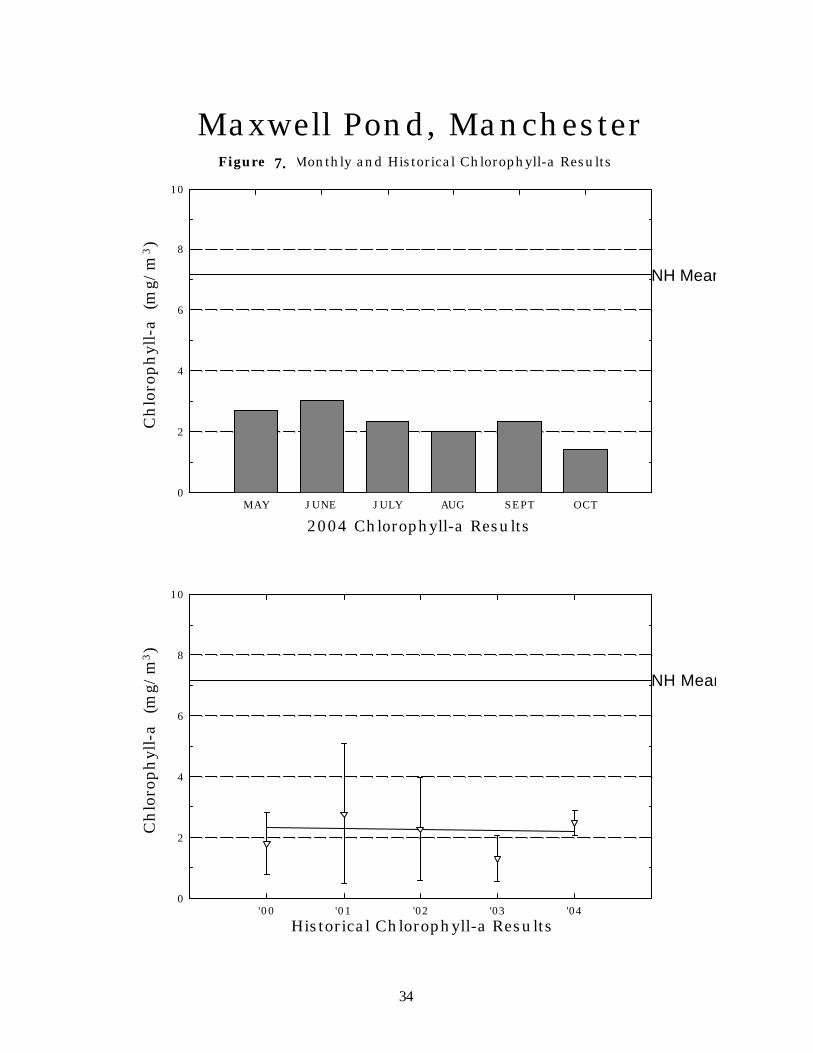
Transparency
As the bottom could clearly be seen at 1.1 meters, Secchi disk transparency was greater than 1.1 meters and could not bemeasured more accurately due to lack of depth. The transparency was greater than the pond depth, i.e. one can see the pondbottom. The Secchi-disk was visible on the bottom of the pond on each sampling event.
Since the transparency can not be accurately measured due to the shallowness of the pond, it is impossible to determine atrend.
33
Turbidity
Turbidity in Maxwell Pond ranged from 1.07 to 3.21 (NTU) and averaged 2.12 (NTU). NH DES 1981 turbidity readings werea bit higher at 4.3 (NTU). The 2004 readings reinforce a stable data trend for turbidity.
Maxwell Pond water quality has remained consistent since 2000, with the exception of conductivity which has increased. Fiveyears of data, however, do not accurately represent a trend. Natural fluctuations, upstream disturbances and discharges, andprecipitation variations could all be singled out as reasons for water quality fluctuations.
Table 71: Maxwell Pond Water Quality Comparison (1981-2004)
pH Alkalinity(mg/L)
TotalPhosphorus
(mg/L)
Conductivity(umhos/cm)
SecchiDisk(m)
Chlorophyll-a(mg/m3)
1981* 6.4 7.00 0.018 56.00 >1.2 -Mean 6.54 6.80 0.014 121.8 >1.1 1.55
2000 Median 6.55 6.90 0.014 127.3 1.07Mean 6.63 9.80 0.018 154.6 >1.1 3.17
2001 Median 6.62 9.60 0.018 148.5 4.01Mean 6.50 6.74 0.015 201.4 >1.1 1.68
2002 Median 6.52 3.60 0.016 147.8 1.68Mean 6.23 6.40 0.017 179.5 >1.1 1.65
2003 Median 6.18 5.05 0.018 171.2 1.63Mean 6.38 5.47 0.022 151.0 >1.1 2.30
2004 Median 6.30 5.05 0.016 155.5 2.34
1) All values are epilimnetic.
* NH Dept. of Environmental Services. 1981. Trophic Classification of NH Lakes and Ponds.
34
2004 Chlorophyll-a Results
Maxwell Pond, ManchesterC
hlo
roph
yll-
a (m
g/m
3)
Ch
loro
ph
yll-
a (m
g/m
3)
MAY JUNE JULY AUG SEPT OCT0
2
4
6
8
10
NH Mean
'00 '01 '02 '03 '040
2
4
6
8
10
NH Mean
Figure 1. Monthly and Historical Chlorophyll-a Results
Historical Chlorophyll-a Results
7.
35
Tran
spar
ency
(m
eter
s)
2004 Transparency Results
Tra
nsp
aren
cy (m
eter
s)Maxwell Pond, Manchester
MAY JUNE JULY AUG. SEPT. OCT.0
2
4
6
8
NH Mean
'00 '01 '02 '03 '040
2
4
6
8
NH Mean
Figure 2. Monthly and Historical Transparency Results
Historical Transparency Results
8.

36
'00 '01 '02 '03 '040
10
20
30
40
50
60
Median
May June July Aug Sept Oct0
10
20
30
40
50
60
Median
Maxwell Pond, ManchesterTot
al P
hos
ph
oru
s C
once
ntr
atio
n (u
g/L)
2004 Monthly Results
Figure 3. Monthly and Historical Total Phosphorus Data.
Epilimnion (Upper Water Layer)
9.

37
MCQUESTEN POND
Pond Location and Description
McQuesten Pond is located behind the businesses of Second Street to theeast and Wolfe Park to the north. It is used for birdwatching and wetlandseducation. At less than two feet deep, it is barely able to be classified as apond at all. The McQuesten wetland area is very rich in life, featuringmore than twenty bird species.
Water Quality
McQuesten Pond is little more than a flooded wetland. It’s highbiologically productivity is partly due to its shallow depth and rich sourcesof organic debris. Therefore, it is inappropriate to compare this waterbody to other typical New Hampshire lakes and ponds. The water qualityat McQuesten Pond remains consistent after five years of data collection.
McQuesten Pond is less than 18 inches deep in any spot, therefore in-pond sampling was atypical here. The flushing rate ofthe ponded area of the McQuesten wetland complex is high. Outlet sample results were very similar to in-pond sample results.
Chlorophyll-a
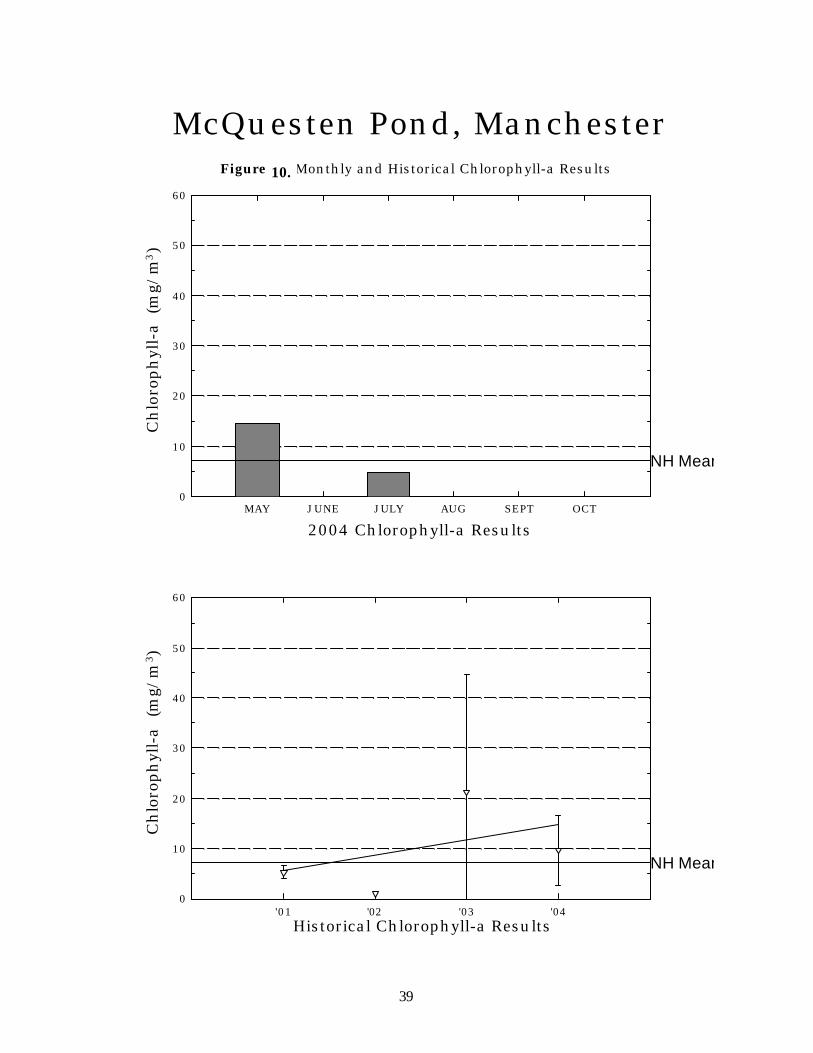
Overall, visual inspection of the historical data trend line (see Figure 13)shows a decreasing in-lake chlorophyll-a trend, meaning that theconcentration has improved since monitoring began in 2000. However,please keep in mind that this trend is based on an extremely limited dataset, and may not be representative of actual conditions.
Conductivity
In-pond conductivity was high, averaging 642.0 uMhos/cm. Outletconductivity levels were similar at 621.8 uMhos/cm.
The conductivity continues to be very high in this pond. Typically,sources of elevated conductivity are due to human activity. Theseactivities include road and parking lot runoff (which contains road saltduring the spring snow melt) and organic debris.
Dissolved Oxygen (DO)
Dissolved oxygen levels in McQuesten Pond indicate a very highlyproductive system. When DO levels could be discerned, they showed thepond to be supersaturated during the majority of sampling events.
pH and Acid Neutralizing Capacity (ANC)
McQuesten Pond had an average pH of 6.64. Acid neutralizing capacity was relatively high at 31.4 mg/L of CaCO.
The pH this season ranged from 6.46 to 6.85. Unlike previous seasons, the pH remained slightly acidic all season.
The Acid Neutralizing Capacity (ANC) of the pond continue to remain high, with the mean (31.4 mg/L as CaCO3) beingmuch greater than the state mean. This indicates that the pond is “not vulnerable” to acidic inputs (such as acid precipitation)and has a greater ability than most lakes and ponds in the state to buffer against acidic inputs. While this may seem like apositive condition in the pond, the high ANC is likely due to the degraded conditions of the pond. We suspect that there is ahigh concentration of pollutants and ions (such as salts) that account for the elevated ANC in the pond.
McQuesten Pond. Photo by Jen Drociak
= Sampling Station
#*
#*
N
38
Phosphorus (TP)
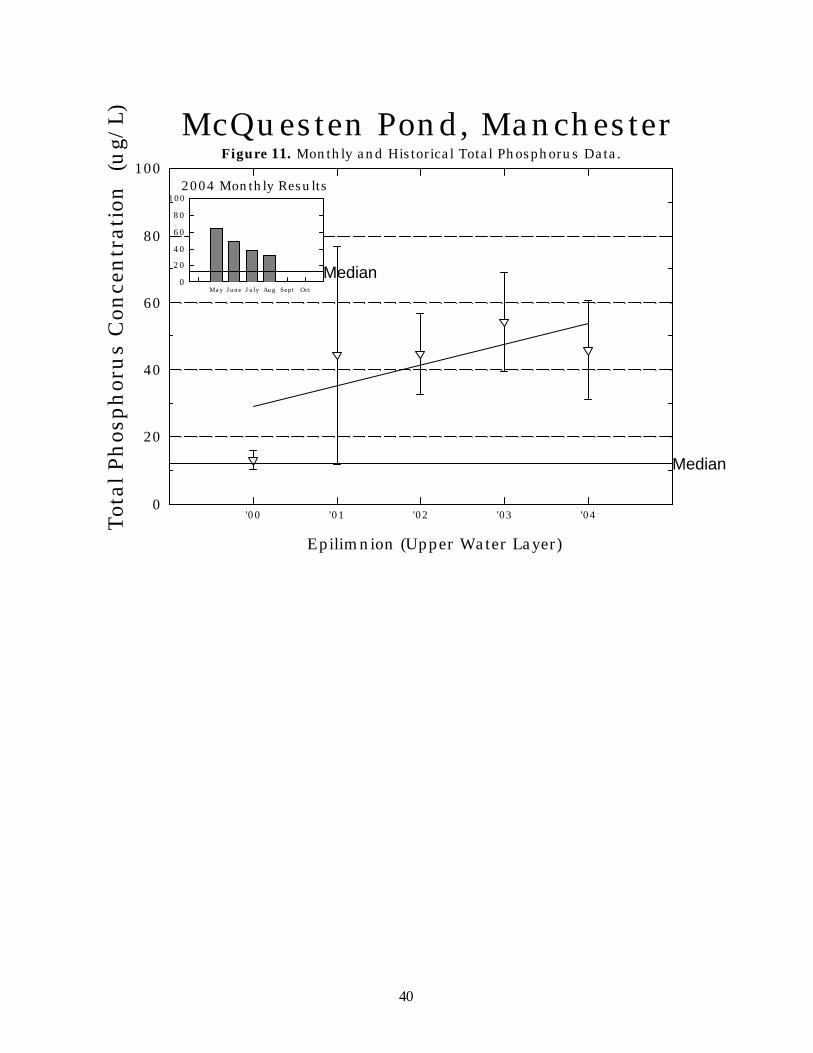
Total phosphorus concentrations in the pond ranged from 0.031 to 0.065 mg/L, averaging 0.046 mg/L. Outlet TPconcentrations ranged from .028 to .044 mg/L.
The current year data (see Figure 14) show that the total phosphorus concentration fluctuated throughout the season.
The historical data show that the 2004 mean total phosphorus concentration is much greater than the state median.
Overall, visual inspection of the historical data trend line show an increasing total phosphorus trend, which means that theconcentration has worsened since monitoring began in 2000.
Transparency
No data are available for transparency, as the pond is too shallow for this test. The bottom of the pond is visible.
Turbidity
Pond turbidity ranged from 3.46 to 4.78 NTU and averaged 4.15 NTU. Outlet turbidity ranged from 2.21 to 6.61 NTU andaveraged 4.12 NTU.
39
2004 Chlorophyll-a Results
McQuesten Pond, ManchesterC
hlo
roph
yll-
a (m
g/m
3 )C
hlo
roph
yll-
a (m
g/m
3)
MAY JUNE JULY AUG SEPT OCT0
10
20
30
40
50
60
NH Mean
'01 '02 '03 '040
10
20
30
40
50
60
NH Mean
Figure 1. Monthly and Historical Chlorophyll-a Results
Historical Chlorophyll-a Results
10.
40
'00 '01 '02 '03 '040
20
40
60
80
100
Median
May June July Aug Sept Oct0
20
40
60
80
100
Median
McQuesten Pond, ManchesterTot
al P
hos
ph
oru
s C
once
ntr
atio
n
(ug/
L)
2004 Monthly Results
Figure 3. Monthly and Historical Total Phosphorus Data.
Epilimnion (Upper Water Layer)
11.
41
NUTTS POND
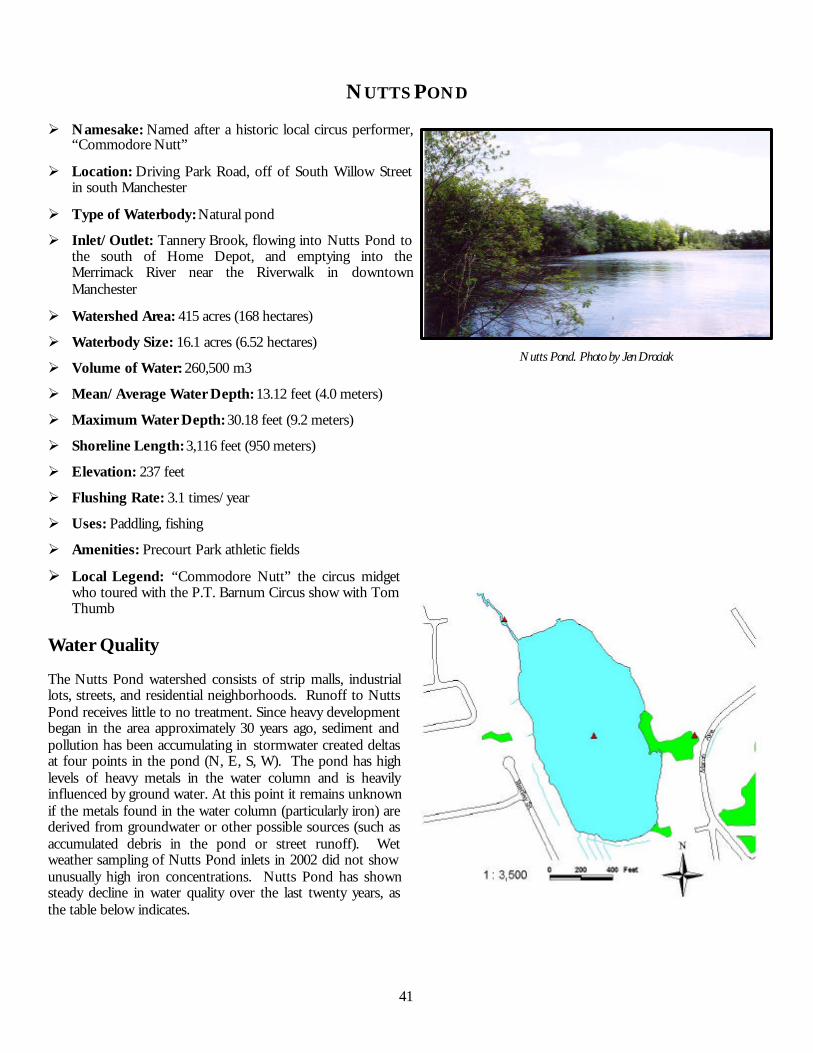
Ø Namesake: Named after a historic local circus performer,“Commodore Nutt”
Ø Location: Driving Park Road, off of South Willow Streetin south Manchester
Ø Type of Waterbody: Natural pond
Ø Inlet/Outlet: Tannery Brook, flowing into Nutts Pond tothe south of Home Depot, and emptying into theMerrimack River near the Riverwalk in downtownManchester
Ø Watershed Area: 415 acres (168 hectares)
Ø Waterbody Size: 16.1 acres (6.52 hectares)
Ø Volume of Water: 260,500 m3
Ø Mean/Average Water Depth: 13.12 feet (4.0 meters)
Ø Maximum Water Depth: 30.18 feet (9.2 meters)
Ø Shoreline Length: 3,116 feet (950 meters)
Ø Elevation: 237 feet
Ø Flushing Rate: 3.1 times/year
Ø Uses: Paddling, fishing
Ø Amenities: Precourt Park athletic fields
Ø Local Legend: “Commodore Nutt” the circus midgetwho toured with the P.T. Barnum Circus show with TomThumb
Water Quality
The Nutts Pond watershed consists of strip malls, industriallots, streets, and residential neighborhoods. Runoff to NuttsPond receives little to no treatment. Since heavy developmentbegan in the area approximately 30 years ago, sediment andpollution has been accumulating in stormwater created deltasat four points in the pond (N, E, S, W). The pond has highlevels of heavy metals in the water column and is heavilyinfluenced by ground water. At this point it remains unknownif the metals found in the water column (particularly iron) arederived from groundwater or other possible sources (such asaccumulated debris in the pond or street runoff). Wetweather sampling of Nutts Pond inlets in 2002 did not showunusually high iron concentrations. Nutts Pond has shownsteady decline in water quality over the last twenty years, asthe table below indicates.
Nutts Pond. Photo by Jen Drociak

42
Chlorophyll-a
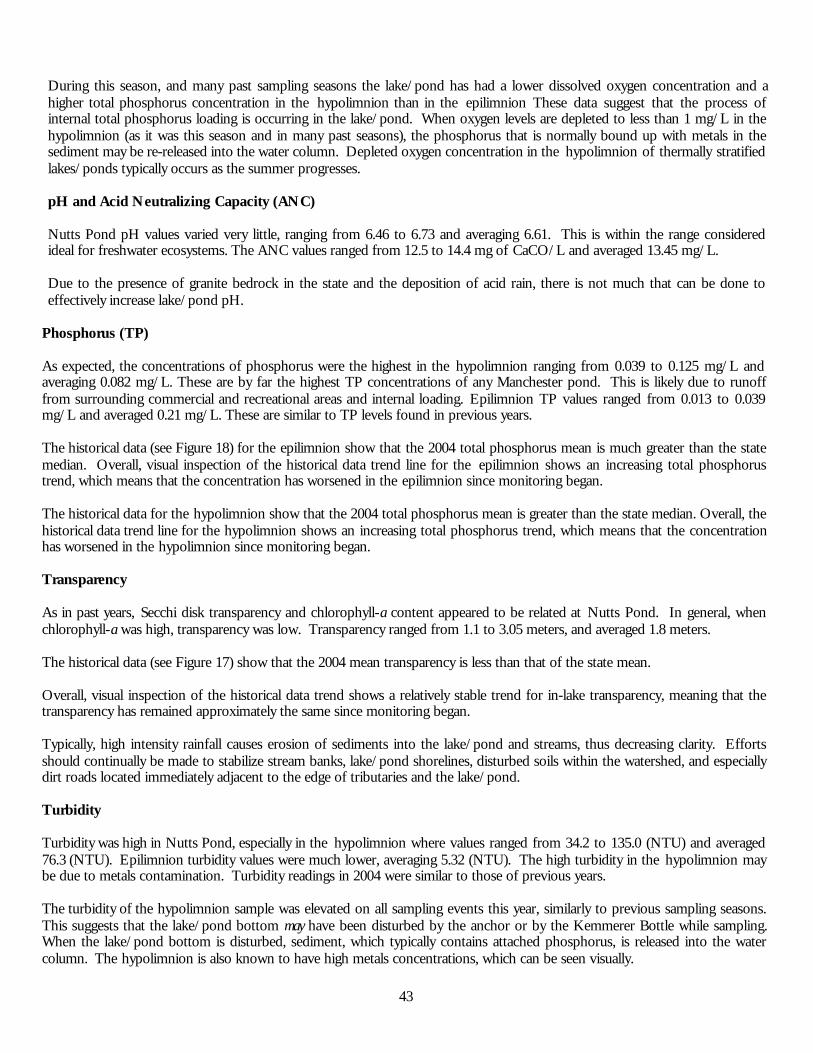
Composite chlorophyll-a concentrations for the upper metalimnion and epilimnion ranged from 10.24 to 26.93 mg/m3 andaveraged 19.31 mg/m3. This is a high concentration considering the “typical” value for a NH lake is 3.9 mg/m3. Chlorophyll-aconcentration varied greatly throughout the season. Compared to 2001 through 2003, the 2004 mean has worsened, but is stillbetter than the mean chlorophyll-a concentration in 2000 (27.42 mg/m3). Keep in mind that this is a limited data set.
The current year data (see Figure 16) shows that 2004 chlorophyll-a levels were variable, but never dropped below the statemean. Overall, visual inspection of the historical data trend also shows a variable but consistently high chlorophyll-a mean.
After 10 consecutive years of sample collection from the lake/pond, we could conduct a statistical analysis of the data. Thiswill allow us to objectively determine if there has been a significant change in the annual mean chlorophyll-a concentrationsince monitoring began. For data less than 10 years, it is difficult to definitively say whether a trend exists.
Chloride
This year was the third year that the chloride concentration was measured at the deep spot of the pond. In New Hampshire,the median chloride concentration for lakes/ponds is 5.0 mg/l. The average epilimnetic chloride level in Nutts Pond was 147mg/L. The hypolimnetic average was 611 mg/L. These readings are similar to the levels found in 2002 and 2003.
Conductivity
Conductivity levels were very high, especially in the hypolimnion, where readings ranged from 1980 to 2360 uMhos/cm, andaveraged 2193.3 uMhos/cm. This is related to metals contamination in the water column. Epilimnion conductivity rangedfrom 439 to 877 uMhos/cm, and averaged 598.8 uMhos/cm. These numbers represent the highest average hypolimnionconductivity readings ever recorded at Nutts Pond.
Dissolved Oxygen (DO)
Nutts Pond was stratified before sampling began in April of 2004. Each sampling session identified a clearly definedepilimnion, metalimnion, and hypolimnion. Hypolimnion dissolved oxygen was at its lowest in the April. These anoxic (verylow oxygen) conditions are causing internal phosphorus loading in Nutts Pond. In other words, the low oxygen is causingorganisms in the pond to release phosphorus from the sediments.
The dissolved oxygen concentration was greater than 100% saturation in the upper layers at the deep spot on the April, Juneand August sampling events. In September, supersaturation extended through the hypolimnion, to the pond bottom. Thisoccurrence is believed to have been caused by seasonal turnover. High amounts of oxygen in the upper layers of the watercolumn can be the result of two different conditions.
Layers of algae can raise the dissolved oxygen in the water column, since oxygen is a by-product of photosynthesis.Considering that the depth of the photic zone (depth to which sunlight can penetrate into the water column) wasapproximately 1.1 to 2.3 meters on these sampling dates (as shown by the Secchi-disk transparency), and that the metalimnion(layer of rapid decrease in water temperature and increase in density – a place where algae are often found) was locatedbetween approximately 2 and 5 meters, we suspect that an abundance of algae may have contributed to the oxygen supersaturation.
Wave action from wind can also dissolve atmospheric oxygen into the upper layers of the water column. Considering thatwindy conditions were indicated on these dates, wave action may have also contributed to the oxygen super saturation.
The dissolved oxygen concentration was very low in the metalimnion and hypolimnion at the deep spot of the lake/pond earlyin the season, but improved as the season progressed. As stratified lakes/ponds age, oxygen becomes depleted in thehypolimnion (the lower layer) by the process of decomposition. Specifically, the loss of oxygen in the hypolimnion resultsprimarily from the process of biological breakdown of organic matter both in the water column and particularly at the bottomof the lake/pond where the water meets the sediment. When oxygen levels are depleted to less than 1 mg/L in thehypolimnion (as it was this season and in past seasons), the phosphorus that is normally bound up in the sediment may be re-released into the water column.
43
During this season, and many past sampling seasons the lake/pond has had a lower dissolved oxygen concentration and ahigher total phosphorus concentration in the hypolimnion than in the epilimnion These data suggest that the process ofinternal total phosphorus loading is occurring in the lake/pond. When oxygen levels are depleted to less than 1 mg/L in thehypolimnion (as it was this season and in many past seasons), the phosphorus that is normally bound up with metals in thesediment may be re-released into the water column. Depleted oxygen concentration in the hypolimnion of thermally stratifiedlakes/ponds typically occurs as the summer progresses.
pH and Acid Neutralizing Capacity (ANC)
Nutts Pond pH values varied very little, ranging from 6.46 to 6.73 and averaging 6.61. This is within the range consideredideal for freshwater ecosystems. The ANC values ranged from 12.5 to 14.4 mg of CaCO/L and averaged 13.45 mg/L.
Due to the presence of granite bedrock in the state and the deposition of acid rain, there is not much that can be done toeffectively increase lake/pond pH.
Phosphorus (TP)
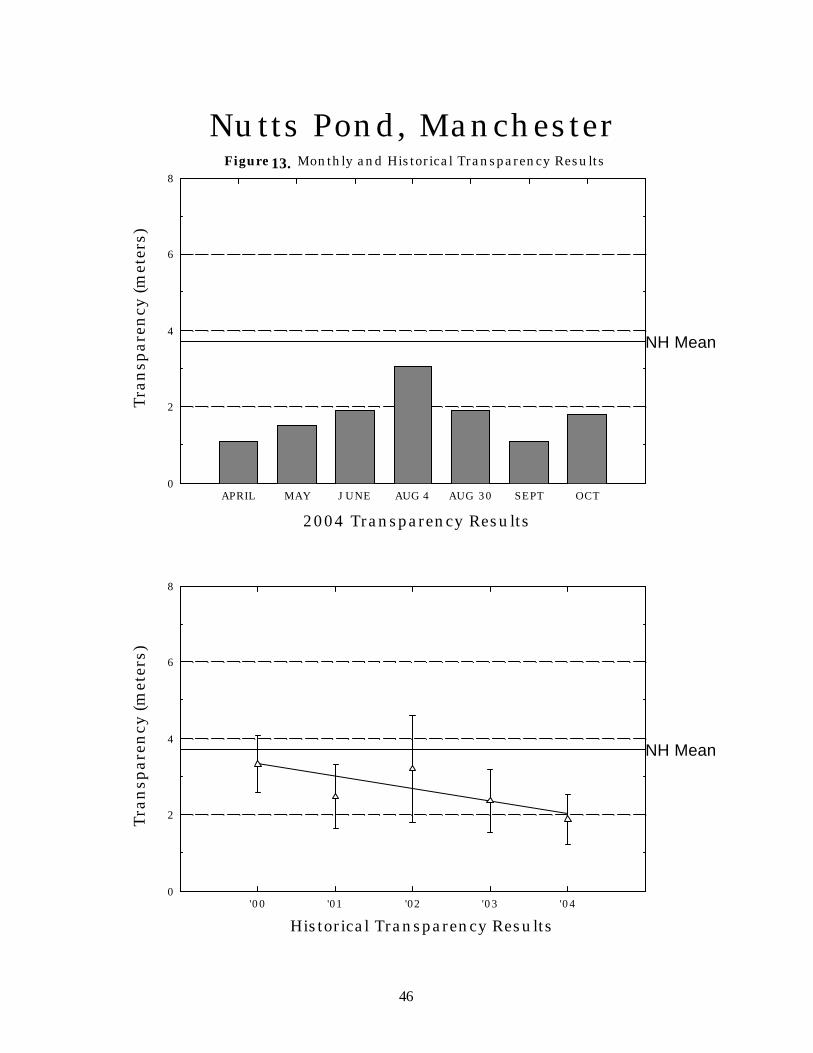
As expected, the concentrations of phosphorus were the highest in the hypolimnion ranging from 0.039 to 0.125 mg/L andaveraging 0.082 mg/L. These are by far the highest TP concentrations of any Manchester pond. This is likely due to runofffrom surrounding commercial and recreational areas and internal loading. Epilimnion TP values ranged from 0.013 to 0.039mg/L and averaged 0.21 mg/L. These are similar to TP levels found in previous years.
The historical data (see Figure 18) for the epilimnion show that the 2004 total phosphorus mean is much greater than the statemedian. Overall, visual inspection of the historical data trend line for the epilimnion shows an increasing total phosphorustrend, which means that the concentration has worsened in the epilimnion since monitoring began.
The historical data for the hypolimnion show that the 2004 total phosphorus mean is greater than the state median. Overall, thehistorical data trend line for the hypolimnion shows an increasing total phosphorus trend, which means that the concentrationhas worsened in the hypolimnion since monitoring began.
Transparency
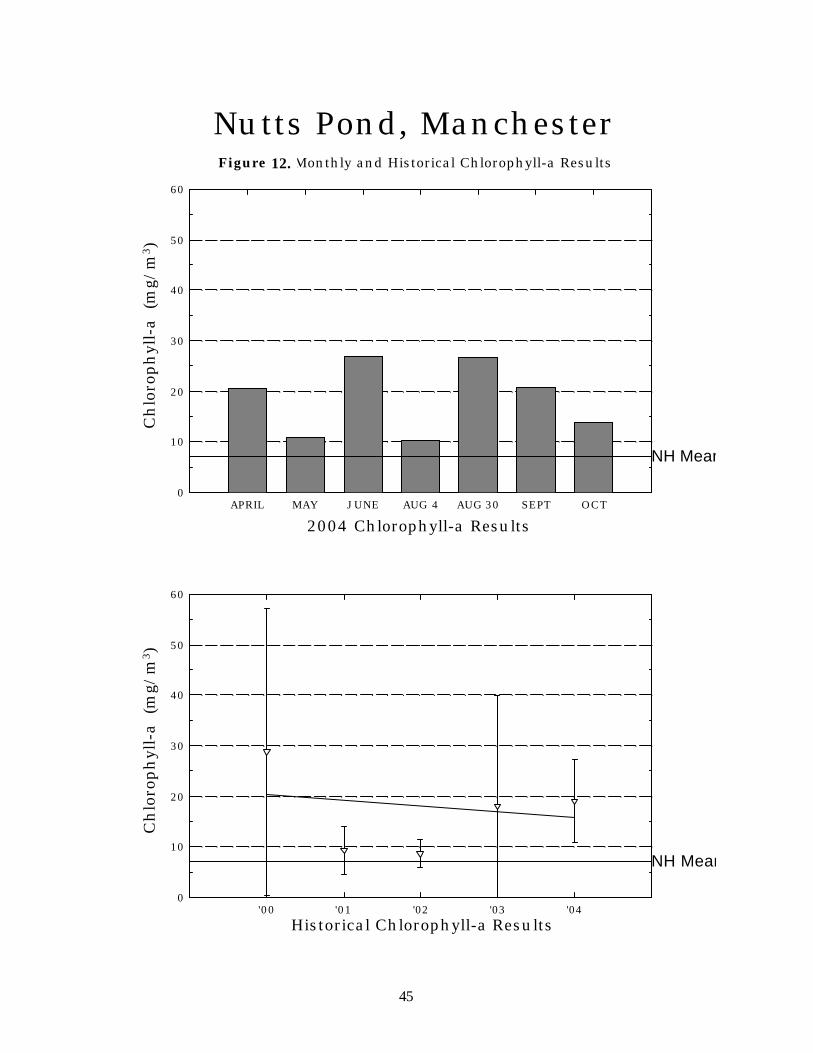
As in past years, Secchi disk transparency and chlorophyll-a content appeared to be related at Nutts Pond. In general, whenchlorophyll-a was high, transparency was low. Transparency ranged from 1.1 to 3.05 meters, and averaged 1.8 meters.
The historical data (see Figure 17) show that the 2004 mean transparency is less than that of the state mean.
Overall, visual inspection of the historical data trend shows a relatively stable trend for in-lake transparency, meaning that thetransparency has remained approximately the same since monitoring began.
Typically, high intensity rainfall causes erosion of sediments into the lake/pond and streams, thus decreasing clarity. Effortsshould continually be made to stabilize stream banks, lake/pond shorelines, disturbed soils within the watershed, and especiallydirt roads located immediately adjacent to the edge of tributaries and the lake/pond.
Turbidity
Turbidity was high in Nutts Pond, especially in the hypolimnion where values ranged from 34.2 to 135.0 (NTU) and averaged76.3 (NTU). Epilimnion turbidity values were much lower, averaging 5.32 (NTU). The high turbidity in the hypolimnion maybe due to metals contamination. Turbidity readings in 2004 were similar to those of previous years.
The turbidity of the hypolimnion sample was elevated on all sampling events this year, similarly to previous sampling seasons.This suggests that the lake/pond bottom may have been disturbed by the anchor or by the Kemmerer Bottle while sampling.When the lake/pond bottom is disturbed, sediment, which typically contains attached phosphorus, is released into the watercolumn. The hypolimnion is also known to have high metals concentrations, which can be seen visually.

44
Table 81: Nutts Pond Water Quality Comparison (1981-2004)
pH Alkalinity(mg/L)
TotalPhosphorus
(mg/L)
Conductivity(uMhos/cm)
Secchi Disk(m)
Chlorophyll a(mg/m3)
1981* 7.10 12.0 0.025 194.0 2.5 -1995** 8.90 15.8 0.025 567.0 2.5 -
Mean 6.77 13.9 0.015 488.0 3.1 27.422000 Median 6.79 14.1 0.013 454.0 3.3 21.12
Mean 6.82 17.3 0.023 714.2 2.4 14.012001 Median 6.83 17.0 0.019 630.5 2.6 10.94
Mean 6.77 15.4 0.024 580.4 2.9 10.812002 Median 6.77 15.4 0.024 546.0 2.9 7.73
Mean 6.68 17.0 0.030 786.0 2.3 17.132003 Median 6.68 17.5 0.029 790.0 2.3 11.56
Mean 6.61 13.5 0.021 598.8 1.8 19.312004 Median 6.60 13.4 0.017 574.5 1.7 20.66
1) All values are epilimnetic.
* NH Dept. of Environmental Services. 1981. Trophic Classification of NH Lakes and Ponds.
** NH Dept. of Environmental Services. 1996. Lake Trophic Data.
45
2004 Chlorophyll-a Results
Nutts Pond, ManchesterC
hlo
roph
yll-
a (m
g/m
3 )C
hlo
roph
yll-
a (m
g/m
3 )
APRIL MAY JUNE AUG 4 AUG 30 SEPT OCT0
10
20
30
40
50
60
NH Mean
'00 '01 '02 '03 '040
10
20
30
40
50
60
NH Mean
Figure 1. Monthly and Historical Chlorophyll-a Results
Historical Chlorophyll-a Results
12.
46
Tran
spar
ency
(met
ers)
2004 Transparency Results
Tra
nsp
aren
cy (m
eter
s)Nutts Pond, Manchester
APRIL MAY JUNE AUG 4 AUG 30 SEPT OCT0
2
4
6
8
NH Mean
'00 '01 '02 '03 '040
2
4
6
8
NH Mean
Figure 2. Monthly and Historical Transparency Results
Historical Transparency Results
13.
47
'00 '01 '02 '03 '040
80
160
240
320
400
Median
Apr May Jun Aug4Aug30 Sep0
80
160
240
320
400
Median
'00 '01 '02 '03 '040
20
40
60
80
100
Median
Apr May Jun Aug4Aug30 Sep0
20
40
60
80
100
Median
Nutts Pond, ManchesterTot
al P
hos
ph
oru
s C
once
ntr
atio
n (
ug/
L)
2004 Monthly Results
2004 Monthly Results
Hypolimnion (Lower Water Layer)
Figure 3. Monthly and Historical Total Phosphorus Data.
Epilimnion (Upper Water Layer)
14.

48
49
PINE ISLAND POND
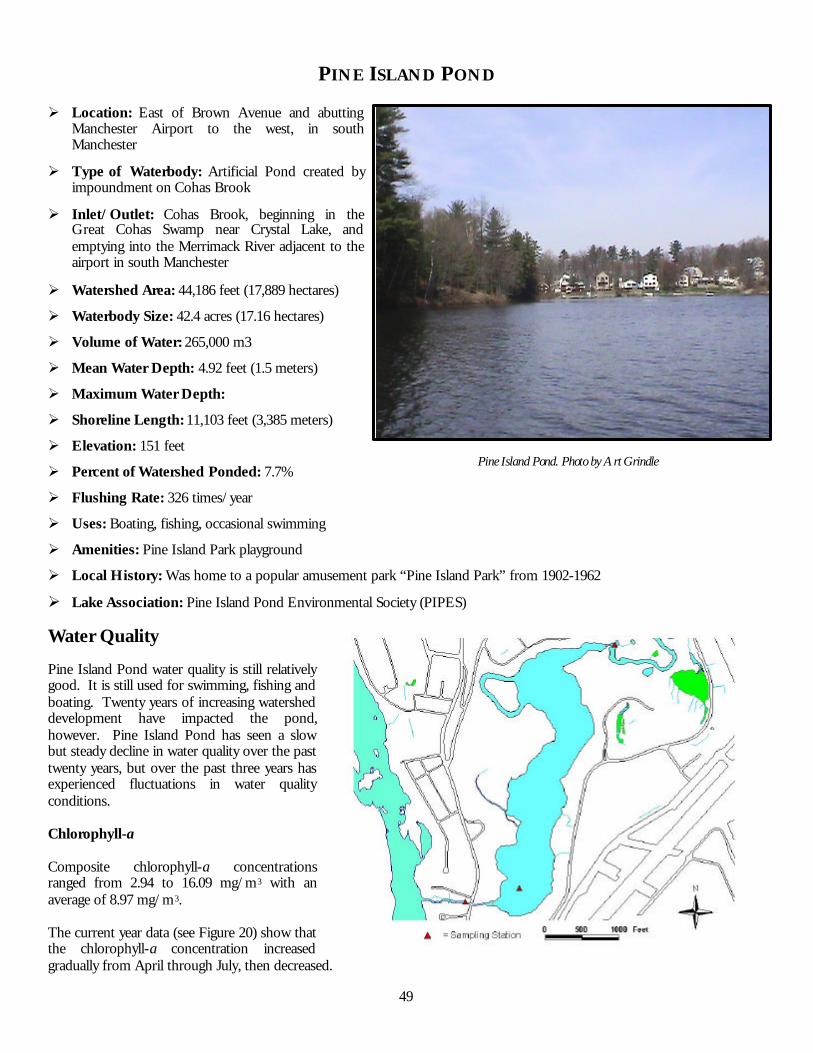
Ø Location: East of Brown Avenue and abuttingManchester Airport to the west, in southManchester
Ø Type of Waterbody: Artificial Pond created byimpoundment on Cohas Brook
Ø Inlet/Outlet: Cohas Brook, beginning in theGreat Cohas Swamp near Crystal Lake, andemptying into the Merrimack River adjacent to theairport in south Manchester
Ø Watershed Area: 44,186 feet (17,889 hectares)
Ø Waterbody Size: 42.4 acres (17.16 hectares)
Ø Volume of Water: 265,000 m3
Ø Mean Water Depth: 4.92 feet (1.5 meters)
Ø Maximum Water Depth:
Ø Shoreline Length: 11,103 feet (3,385 meters)
Ø Elevation: 151 feet
Ø Percent of Watershed Ponded: 7.7%
Ø Flushing Rate: 326 times/year
Ø Uses: Boating, fishing, occasional swimming
Ø Amenities: Pine Island Park playground
Ø Local History: Was home to a popular amusement park “Pine Island Park” from 1902-1962
Ø Lake Association: Pine Island Pond Environmental Society (PIPES)
Water Quality
Pine Island Pond water quality is still relativelygood. It is still used for swimming, fishing andboating. Twenty years of increasing watersheddevelopment have impacted the pond,however. Pine Island Pond has seen a slowbut steady decline in water quality over the pasttwenty years, but over the past three years hasexperienced fluctuations in water qualityconditions.
Chlorophyll-a
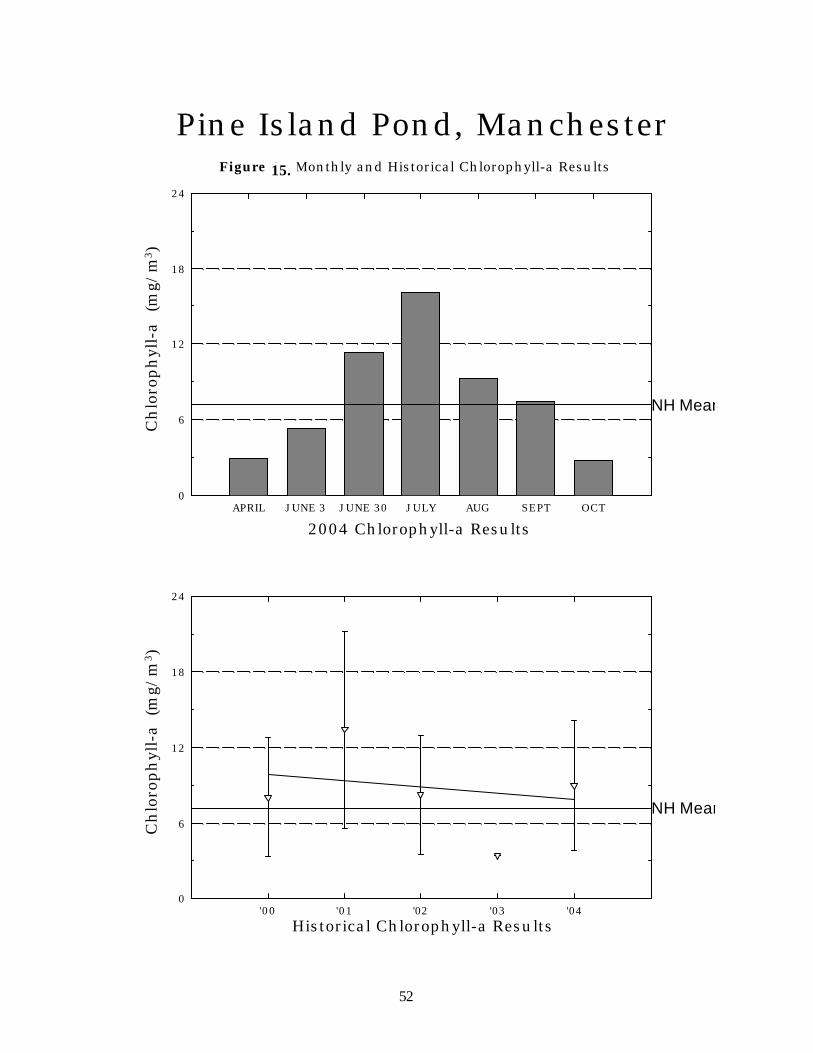
Composite chlorophyll-a concentrationsranged from 2.94 to 16.09 mg/m3 with anaverage of 8.97 mg/m3.
The current year data (see Figure 20) show thatthe chlorophyll-a concentration increasedgradually from April through July, then decreased.
Pine Island Pond. Photo by Art Grindle
50
The historical data show that the 2004 chlorophyll-a mean is slightly above the state mean. Overall, visual inspection of thehistorical data trend shows a decreasing in-lake chlorophyll-a trend, meaning that the concentration has improved sincemonitoring began. Please note that this trend is based on only five years of data.
After 10 consecutive years of sample collection for the pond, we will conduct a statistical analysis of the data. This will allowus to objectively determine if there has been a significant change in the annual mean chlorophyll-a concentration sincemonitoring began.
Conductivity
Conductivity values were also relatively uniform throughout the water column. The epilimnion averaged 256.1 uMhos/cm.The hypolimnion averaged 268.1 uMhos/cm. All conductivity values are high when compared to a “natural, undisturbedlake”, but have not changed drastically since 1981.
Dissolved Oxygen (DO)
Dissolved oxygen concentrations were fairly stable in 2004. The lowest DO readings were recorded in June.
The loss of oxygen in the hypolimnion results primarily from the process of biological breakdown of organic matter (i.e.;biological organisms use oxygen to break down organic matter), both in the water column and particularly at the bottom of thepond where the water meets the sediment.
pH and Acid Neutralizing Capacity (ANC)
Pine Island Pond pH values ranged from 6.27 to 6.73 and averaged 6.58. This is similar to pH values recorded in previousyears. ANC values ranged from 5.0 to 17.5, and averaged 11.53 mg of CaCO/L. These readings indicate that Pine IslandPond has substantial buffering capacity. ANC, like pH, seems to remain steady year after year.
Phosphorus (TP)
As discussed above with low dissolved oxygen, an internal source of phosphorus in the pond may be present. Therefore, it iseven more important that watershed residents act proactively to minimize external phosphorus loading from the watershed.For instance, picking up after pets, minimizing fertilizers on lawns, etc.
Pine Island Pond total phosphorus readings were relatively uniform throughout the water column, with the epilimnionaveraging .024 mg/L and hypolimnion averaging .036 mg/L. These values are higher than those recorded in any previousyear.
The historical data (see Figure 22) for the epilimnion show that the 2004 total phosphorus median is greater than the statemedian. Overall, visual inspection of the historical data trend for the epilimnion shows a variable, but increasing, totalphosphorus trend, which means that the concentration has fluctuated in the epilimnion since monitoring began.
The historical data for the hypolimnion show that the 2004 total phosphorus median is also greater than the state median.Overall, visual inspection of the historical data trend for the hypolimnion shows a relatively stable, but increasing totalphosphorus trend. As discussed previously, these trends are based on a limited data set.
Transparency
Secchi disk transparency dropped steadily as chlorophyll-a concentration increased, though there was some variability betweenthese two parameters. Transparency ranged from 1.45 to 2.7 meters and averaged 1.8 meters. Pine Island Pond has a naturaltea color caused by the presence of tannins (plant pigments). This condition limits water transparency. Average Secchi disktransparency has remained consistent near 1.9 meters for the past 4 years.

51
The historical data (see Figure 21) show that the 2004 mean transparency is less than the state mean. Overall, visual inspectionof the historical data trend shows a steady trend for in-lake transparency, meaning that the transparency has remained similarsince monitoring began.
Typically, high intensity rainfall causes erosion of sediments into the pond and streams, thus decreasing clarity. Efforts shouldcontinually be made to stabilize stream banks, pond shorelines, disturbed soils within the watershed, and especially dirt roadslocated immediately adjacent to the edge of tributaries and the pond.
Turbidity
Turbidity ranged from 1.85 to 4.62 (NTU) in the epilimnion and averaged 3.01 (NTU). Hypolimnion turbidity ranged from2.95 to 16.10 (NTU). The peak turbidity was recorded in August, coinciding with high TP readings. This pattern alsooccurred in 2003, 2002 and 2001 at the end of the summer season.
Pine Island Pond experiences high turbidity levels as a natural condition of its tannic waters.
Table 91: Pine Island Pond Water Quality Comparison (1980-2004)
PH Alkalinity(mg/L)
TotalPhosphorus
(mg/L)
Conductivity(uMhos/cm)
Secchi Disk(m)
Chlorophyll a(mg/m3)
8/5/80* 7.10 15.20 0.015 142.8 2.0 -7/24/97** 7.20 20.60 0.018 290.4 1.4 -
Mean 6.97 17.10 0.024 287.1 1.9 8.02000 Median 7.07 19.50 0.024 308.0 1.9 8.6
Mean 7.00 20.10 0.016 383.3 1.9 13.22001 Median 7.04 21.00 0.017 412.5 1.7 11.4
Mean 6.86 21.20 0.023 316.1 1.9 8.232002 Median 6.93 24.50 0.026 357.5 2.0 7.38
Mean 6.65 14.60 0.029 338.5 1.9 2.212003 Median 6.64 16.00 0.033 364.5 1.8 2.63
Mean 6.58 11.53 0.024 256.1 1.8 8.972004 Median 6.64 11.75 0.026 241.0 1.6 9.22
1) All values are epilimnetic.
* NH Dept. of Environmental Services. 1980. Trophic Classification of NH Lakes and Pond.
** NH Dept. of Environmental Services. 1998. Lake Trophic Data.
52
2004 Chlorophyll-a Results
Pine Island Pond, ManchesterC
hlo
roph
yll-
a (m
g/m
3 )C
hlo
roph
yll-
a (m
g/m
3 )
APRIL JUNE 3 JUNE 30 JULY AUG SEPT OCT0
6
12
18
24
NH Mean
'00 '01 '02 '03 '040
6
12
18
24
NH Mean
Figure 1. Monthly and Historical Chlorophyll-a Results
Historical Chlorophyll-a Results
15.

53
Tra
nsp
aren
cy (m
eter
s)
2004 Transparency Results
Tra
nsp
aren
cy (
met
ers)
Pine Island Pond, Manchester
APRIL JUNE 3 JUNE 30 JULY AUG. SEPT. OCT0
2
4
6
8
NH Mean
'00 '01 '02 '03 '040
2
4
6
8
NH Mean
Figure 2. Monthly and Historical Transparency Results
Historical Transparency Results
16.
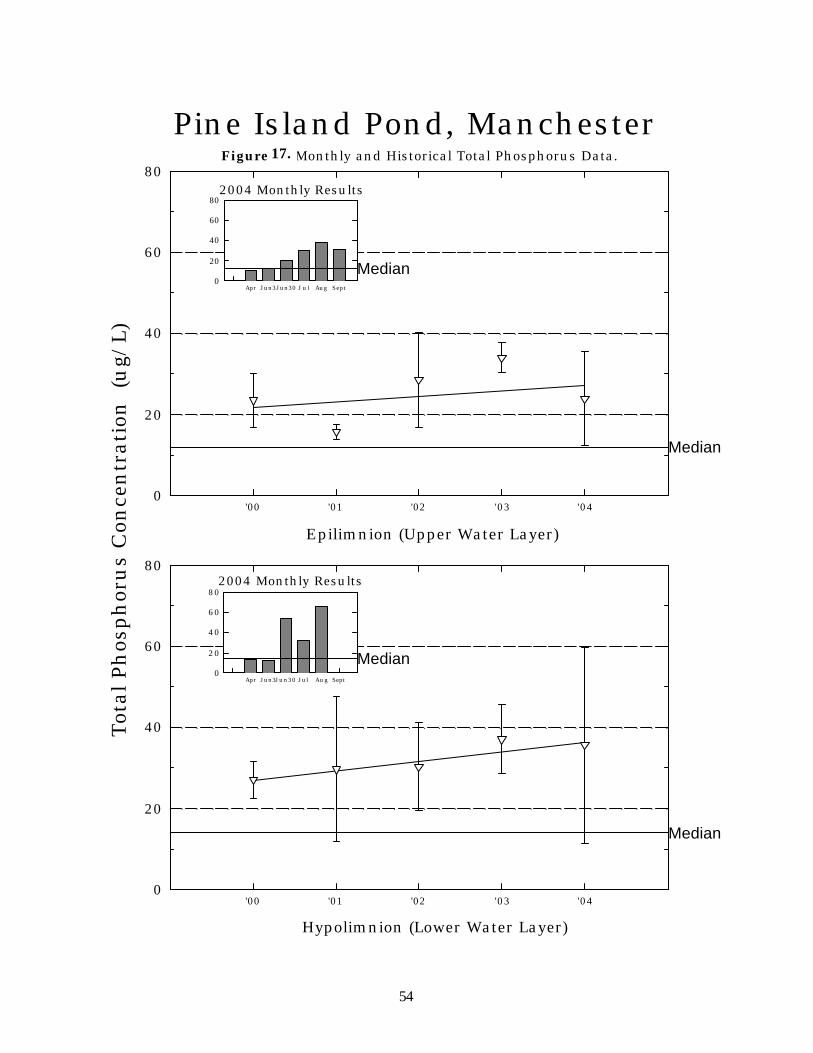
54
'00 '01 '02 '03 '040
20
40
60
80
Median
Apr Jun3Jun30 Jul Aug Sept0
20
40
60
80
Median
'00 '01 '02 '03 '040
20
40
60
80
Median
Apr Jun3Jun30 Jul Aug Sept0
20
40
60
80
Median
Pine Island Pond, ManchesterTot
al P
hos
ph
oru
s C
once
ntr
atio
n (u
g/L)
2004 Monthly Results
2004 Monthly Results
Hypolimnion (Lower Water Layer)
Figure 3. Monthly and Historical Total Phosphorus Data.
Epilimnion (Upper Water Layer)
17.
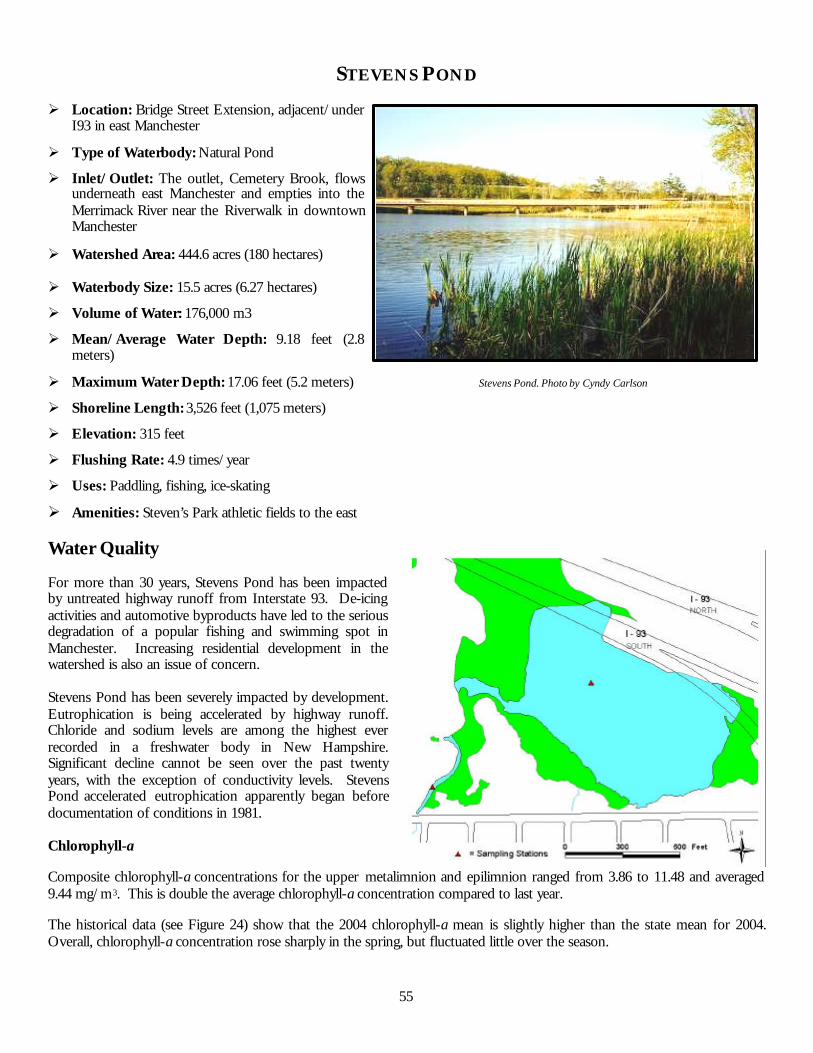
55
STEVENS POND
Ø Location: Bridge Street Extension, adjacent/underI93 in east Manchester
Ø Type of Waterbody: Natural Pond
Ø Inlet/Outlet: The outlet, Cemetery Brook, flowsunderneath east Manchester and empties into theMerrimack River near the Riverwalk in downtownManchester
Ø Watershed Area: 444.6 acres (180 hectares)
Ø Waterbody Size: 15.5 acres (6.27 hectares)
Ø Volume of Water: 176,000 m3
Ø Mean/Average Water Depth: 9.18 feet (2.8meters)
Ø Maximum Water Depth: 17.06 feet (5.2 meters)
Ø Shoreline Length: 3,526 feet (1,075 meters)
Ø Elevation: 315 feet
Ø Flushing Rate: 4.9 times/year
Ø Uses: Paddling, fishing, ice-skating
Ø Amenities: Steven’s Park athletic fields to the east
Water Quality
For more than 30 years, Stevens Pond has been impactedby untreated highway runoff from Interstate 93. De-icingactivities and automotive byproducts have led to the seriousdegradation of a popular fishing and swimming spot inManchester. Increasing residential development in thewatershed is also an issue of concern.
Stevens Pond has been severely impacted by development.Eutrophication is being accelerated by highway runoff.Chloride and sodium levels are among the highest everrecorded in a freshwater body in New Hampshire.Significant decline cannot be seen over the past twentyyears, with the exception of conductivity levels. StevensPond accelerated eutrophication apparently began beforedocumentation of conditions in 1981.
Chlorophyll-a
Composite chlorophyll-a concentrations for the upper metalimnion and epilimnion ranged from 3.86 to 11.48 and averaged9.44 mg/m3. This is double the average chlorophyll-a concentration compared to last year.
The historical data (see Figure 24) show that the 2004 chlorophyll-a mean is slightly higher than the state mean for 2004.Overall, chlorophyll-a concentration rose sharply in the spring, but fluctuated little over the season.
Stevens Pond. Photo by Cyndy Carlson
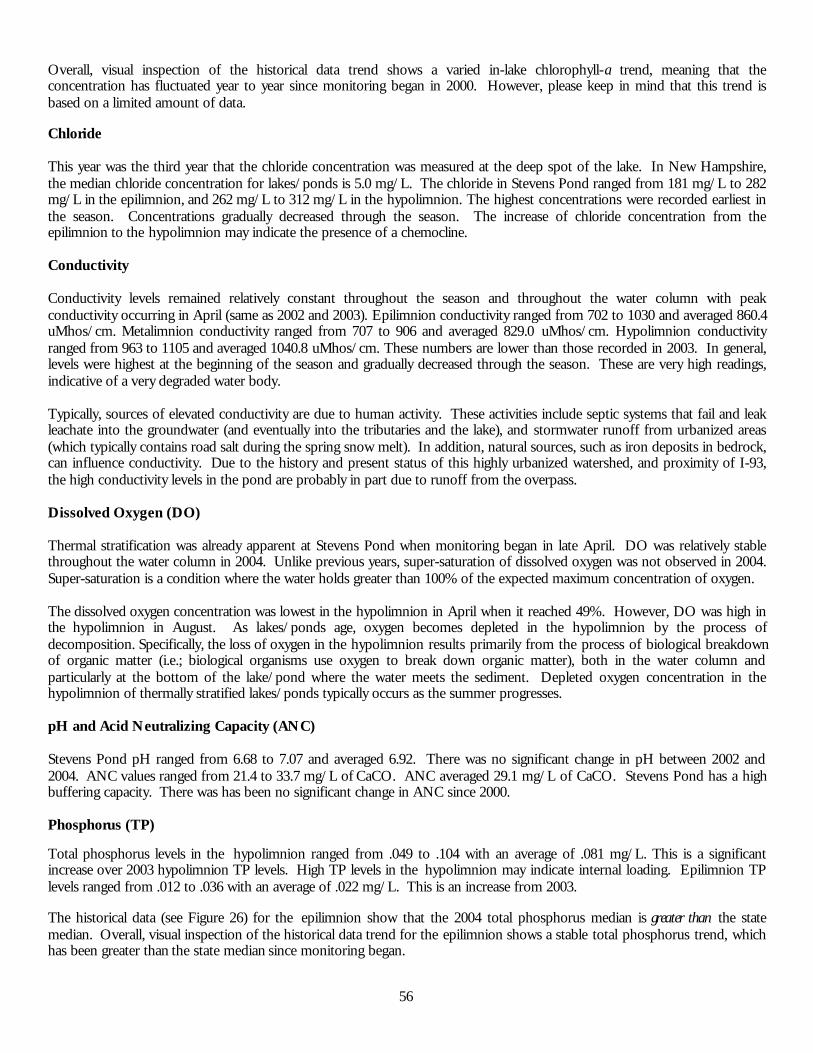
56
Overall, visual inspection of the historical data trend shows a varied in-lake chlorophyll-a trend, meaning that theconcentration has fluctuated year to year since monitoring began in 2000. However, please keep in mind that this trend isbased on a limited amount of data.
Chloride
This year was the third year that the chloride concentration was measured at the deep spot of the lake. In New Hampshire,the median chloride concentration for lakes/ponds is 5.0 mg/L. The chloride in Stevens Pond ranged from 181 mg/L to 282mg/L in the epilimnion, and 262 mg/L to 312 mg/L in the hypolimnion. The highest concentrations were recorded earliest inthe season. Concentrations gradually decreased through the season. The increase of chloride concentration from theepilimnion to the hypolimnion may indicate the presence of a chemocline.
Conductivity
Conductivity levels remained relatively constant throughout the season and throughout the water column with peakconductivity occurring in April (same as 2002 and 2003). Epilimnion conductivity ranged from 702 to 1030 and averaged 860.4uMhos/cm. Metalimnion conductivity ranged from 707 to 906 and averaged 829.0 uMhos/cm. Hypolimnion conductivityranged from 963 to 1105 and averaged 1040.8 uMhos/cm. These numbers are lower than those recorded in 2003. In general,levels were highest at the beginning of the season and gradually decreased through the season. These are very high readings,indicative of a very degraded water body.
Typically, sources of elevated conductivity are due to human activity. These activities include septic systems that fail and leakleachate into the groundwater (and eventually into the tributaries and the lake), and stormwater runoff from urbanized areas(which typically contains road salt during the spring snow melt). In addition, natural sources, such as iron deposits in bedrock,can influence conductivity. Due to the history and present status of this highly urbanized watershed, and proximity of I-93,the high conductivity levels in the pond are probably in part due to runoff from the overpass.
Dissolved Oxygen (DO)
Thermal stratification was already apparent at Stevens Pond when monitoring began in late April. DO was relatively stablethroughout the water column in 2004. Unlike previous years, super-saturation of dissolved oxygen was not observed in 2004.Super-saturation is a condition where the water holds greater than 100% of the expected maximum concentration of oxygen.
The dissolved oxygen concentration was lowest in the hypolimnion in April when it reached 49%. However, DO was high inthe hypolimnion in August. As lakes/ponds age, oxygen becomes depleted in the hypolimnion by the process ofdecomposition. Specifically, the loss of oxygen in the hypolimnion results primarily from the process of biological breakdownof organic matter (i.e.; biological organisms use oxygen to break down organic matter), both in the water column andparticularly at the bottom of the lake/pond where the water meets the sediment. Depleted oxygen concentration in thehypolimnion of thermally stratified lakes/ponds typically occurs as the summer progresses.
pH and Acid Neutralizing Capacity (ANC)
Stevens Pond pH ranged from 6.68 to 7.07 and averaged 6.92. There was no significant change in pH between 2002 and2004. ANC values ranged from 21.4 to 33.7 mg/L of CaCO. ANC averaged 29.1 mg/L of CaCO. Stevens Pond has a highbuffering capacity. There was has been no significant change in ANC since 2000.
Phosphorus (TP)
Total phosphorus levels in the hypolimnion ranged from .049 to .104 with an average of .081 mg/L. This is a significantincrease over 2003 hypolimnion TP levels. High TP levels in the hypolimnion may indicate internal loading. Epilimnion TPlevels ranged from .012 to .036 with an average of .022 mg/L. This is an increase from 2003.
The historical data (see Figure 26) for the epilimnion show that the 2004 total phosphorus median is greater than the statemedian. Overall, visual inspection of the historical data trend for the epilimnion shows a stable total phosphorus trend, whichhas been greater than the state median since monitoring began.

57
The historical data for the hypolimnion show that the 2004 total phosphorus median is much greater than the state median.Total phosphorus concentration in the hypolimnion peaked in late June then declined gradually.
Overall, visual inspection of the historical data trend for the hypolimnion shows a stable total phosphorus trend, which hasbeen much greater than the state median since monitoring began.
Transparency
Secchi disk readings ranged from 2.1 to 3.0 and averaged 2.6 meters. As in past years, transparency did not appear to bedirectly affected by chlorophyll-a content.
Overall, visual inspection of the historical data trend (see Figure 25) shows a steady trend for in-lake transparency sincemonitoring began in 2000.
As discussed previously, after at least 10 consecutive years of sample collection, we will conduct a statistical analysis of the datato objectively determine long-term trends in lake quality.
Turbidity
As expected, Stevens Pond turbidity values were highest in the hypolimnion. This may be caused by high levels of sodium andchloride in the bottom sediments. Hypolimnion turbidity ranged from 3.63 to 35.20 with an average of 22.87 (NTU).Epilimnion and metalimnion turbidity values averaged 2.30 and 3.84 respectively. These turbidity levels represent an overallincrease from 2003.
Table 101: Stevens Pond Water Quality Comparison (1981-2004)
pH Alkalinity(mg/L)
TotalPhosphorus
(mg/L)
Conductivity(uMhos/cm)
Secchi Disk(m)
Chlorophyll-a(mg/m3)
7/29/81* 7.20 33.0 0.028 301.00 2.0 -7/23/97** 7.70 31.8 0.028 696.00 1.3 -
Mean 7.11 34.2 0.019 769.00 2.6 8.682000 Median 7.15 34.8 0.019 765.50 2.6 4.08
Mean 7.14 31.0 0.025 1148.8 2.5 6.262001 Median 7.20 32.7 0.028 1128.0 2.6 4.60
Mean 7.03 30.8 0.018 1140.0 3.0 10.322002 Median 7.10 31.4 0.018 1102.0 2.9 3.20
Mean 7.01 29.2 0.017 1257.8 1.7 4.282003 Median 7.08 31.6 0.017 1229.5 1.3 3.65
Mean 6.92 29.1 0.022 860.40 2.6 9.442004 Median 6.93 30.3 0.018 876.00 2.7 11.21
1) All values are epilimnetic.
* NH Dept. of Environmental Services. 1981. Trophic Classification of NH Lakes and Ponds.
** NH Dept. of Environmental Services. 1998. Lake Trophic Data.
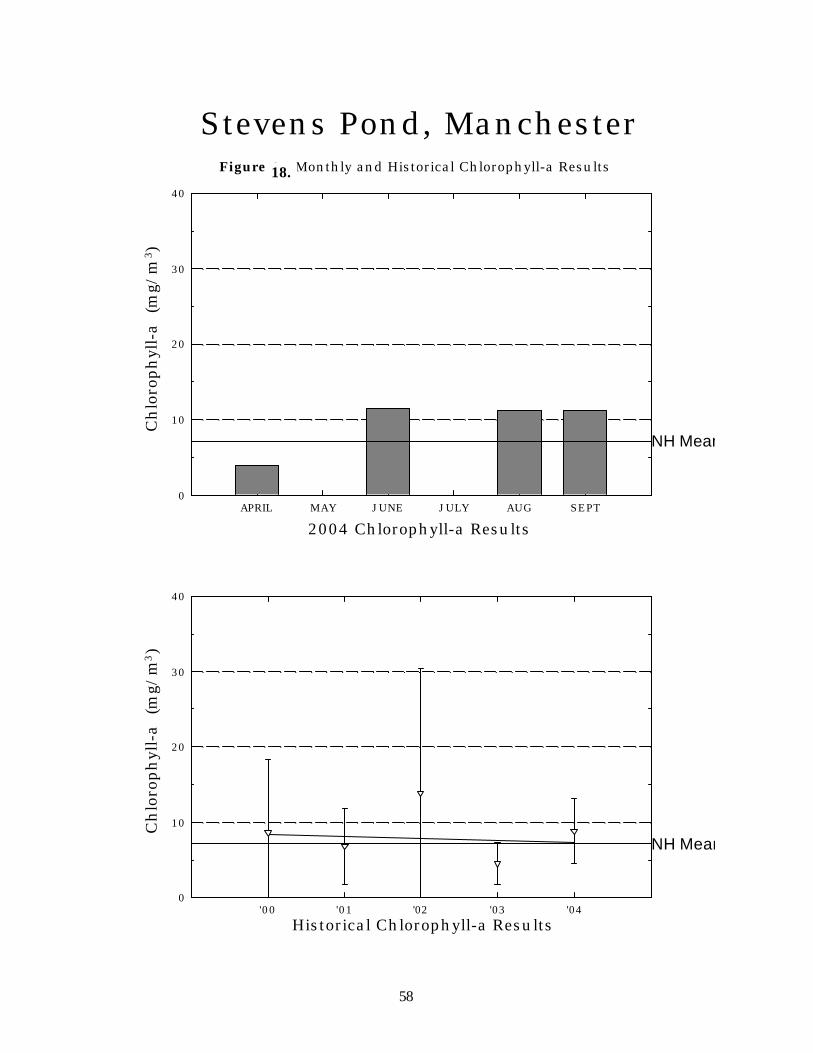
58
2004 Chlorophyll-a Results
Stevens Pond, ManchesterC
hlo
roph
yll-
a (m
g/m
3)
Ch
loro
ph
yll-
a (m
g/m
3 )
APRIL MAY JUNE JULY AUG SEPT0
10
20
30
40
NH Mean
'00 '01 '02 '03 '040
10
20
30
40
NH Mean
Figure 1. Monthly and Historical Chlorophyll-a Results
Historical Chlorophyll-a Results
18.
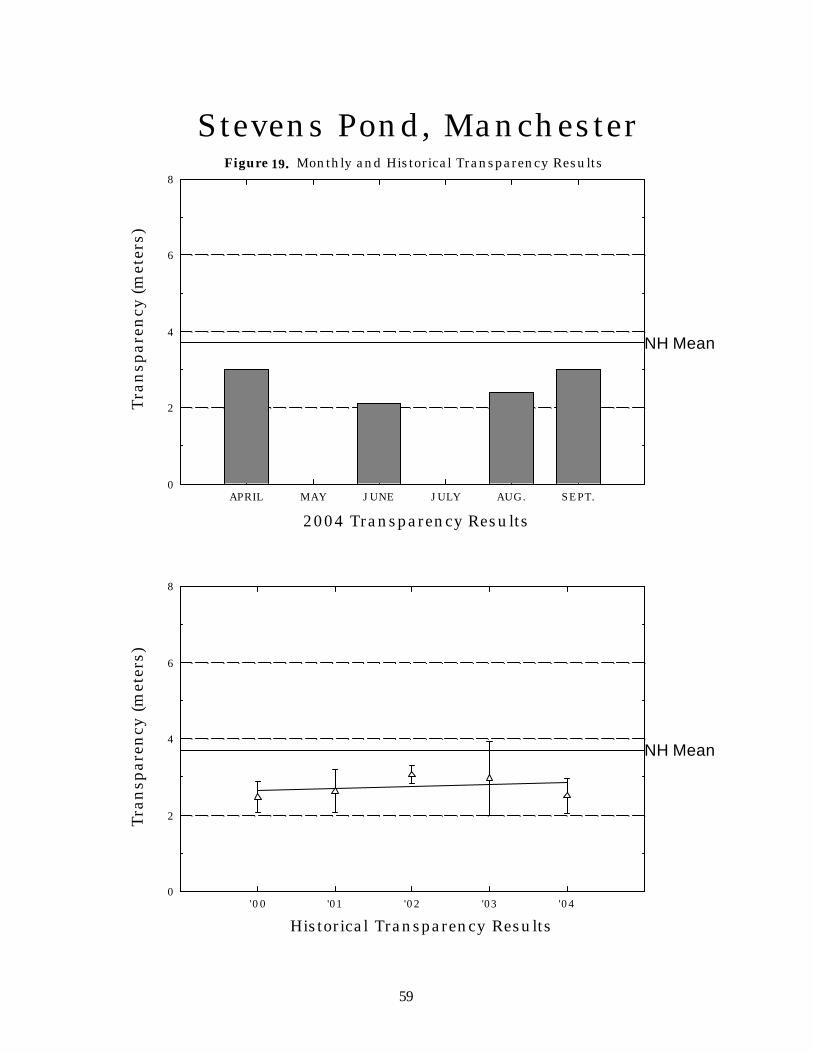
59
Tra
nsp
aren
cy (m
eter
s)
2004 Transparency Results
Tran
spar
ency
(m
eter
s)Stevens Pond, Manchester
APRIL MAY JUNE JULY AUG. SEPT.0
2
4
6
8
NH Mean
'00 '01 '02 '03 '040
2
4
6
8
NH Mean
Figure 2. Monthly and Historical Transparency Results
Historical Transparency Results
19.

60
'00 '01 '02 '03 '040
20
40
60
80
100
120
Median
April May June July Aug Sept0
2040
60
80100
120
Median
'00 '01 '02 '03 '040
10
20
30
40
50
60
Median
April May June July Aug Sept0
10
2030
40
5060
Median
Stevens Pond, ManchesterTot
al P
hos
ph
oru
s C
once
ntr
atio
n (u
g/L)
2004 Monthly Results
2004 Monthly Results
Hypolimnion (Lower Water Layer)
Figure 3. Monthly and Historical Total Phosphorus Data.
Epilimnion (Upper Water Layer)
20.

61
SECTION V. POND PROJECT PRIORITIZATION STATUS
Crystal LakeGoal(s): To maintain fishable and swimmable water quality standards
Water Quality:
1) Address beach parking lot runoff/drainage issues.
2) Address Corning Rd runoff/drainage issues.
1994-1999: The health of Crystal Lake has been the focus of the efforts of the Crystal Lake Preservation Association(CLPA) since their inception in 1994. In 1999, the CLPA was awarded a grant from DES to install a new stormwatertreatment system – the StormTreat system. This system now treats runoff from Bodwell Road and adjacent parkingareas before it enters the lake. With this installation, one of only three surface water inlets is now being treated.
2002-2004: Comprehensive Environmental, Inc (CEI) was contracted through the SEPP to design plans to addressitems 1 & 2 above. The final design plans were completed and the projects were put out to bid in 2003. These projectsincluded installation of best management practices (BMPs) at the two remaining outfalls that impacted Crystal Lake.
Best management practices (BMPs) were installed at the City beach on Bodwell Road. Prior to this project,stormwater runoff (contaminated with sediment and other constituents) would flow down gradient from the entranceroad to the storm drain network and straight into the lake. To prevent this, the sides of the entrance road werestabilized with filter fabric and crushed stone with perforated pipe drainage systems under them. Deep sump catchbasins replaced the existing catch basins and the underground stormwater pipe leading from the parking area to thelakeshore was removed to be replaced by a grassed drainage swale. These measures combined have greatly reduced tovolume of runoff that reaches the catch basin network under the parking area and cleaned up any runoff that reachesthe lake.
The outfall that drains part of Corning Road is directly adjacent to a highly erodable steep slope. This slopecontributed sediment that washed down Corning Road and into the drainage system. The slope also results in thenecessity for intensive salt/sand treatment during winter months because of the high occurrence of icing on thissection of road. These combined factors had formed a nutrient-rich sediment delta in the Lake at the point of theoutfall. At this location, a velocity-reducing device was installed in the form of a baffle box. Due to the steep slope ofthe area between Corning Road and the shoreline, a baffle tank is called for at the top of the drainage line. The two-baffle system will allow sediment to settle before continuing to the outfall. Installation of curbing along the south sideof Corning Road will help prevent sediment eroding from the steep hillside from entering the drainage system.
3) Address Phragmites stand by chemical and mechanical treatments.
2004: On September 13th, Municipal Pest Management Services appliedan herbicide treatment (Glyphosate, trade name Rodeo) on the infestedareas of Crystal Lake. Rodeo is similar to the household herbicideRoundup and is comprised of a concentrated salt. Rodeo quickly breaksdown to its raw constituents (carbon dioxide, nitrogen, phosphorus andwater) as soon as it contacts water, making it safe for plant eradication inaquatic situations. The Crystal Lake Preservation Association performedthe same type of treatment around the lake in 1997.
Even though the herbicide was only sprayed on Phragmites stems, asecond treatment may be required in 2005. A 2005 permit application tothe N.H. Department of Agriculture is being written. That treatmentmanaged the infestation from spreading for about 5 years. A long-termtreatment plan should be developed and implemented with thecooperation of the Crystal Lake Preservation Association, with the goal of complete Phragmites eradication.
Mike Morrison applies an herbicide treatment onan invasive Phragmites stand at Crystal Lake.
Photo by Art Grindle
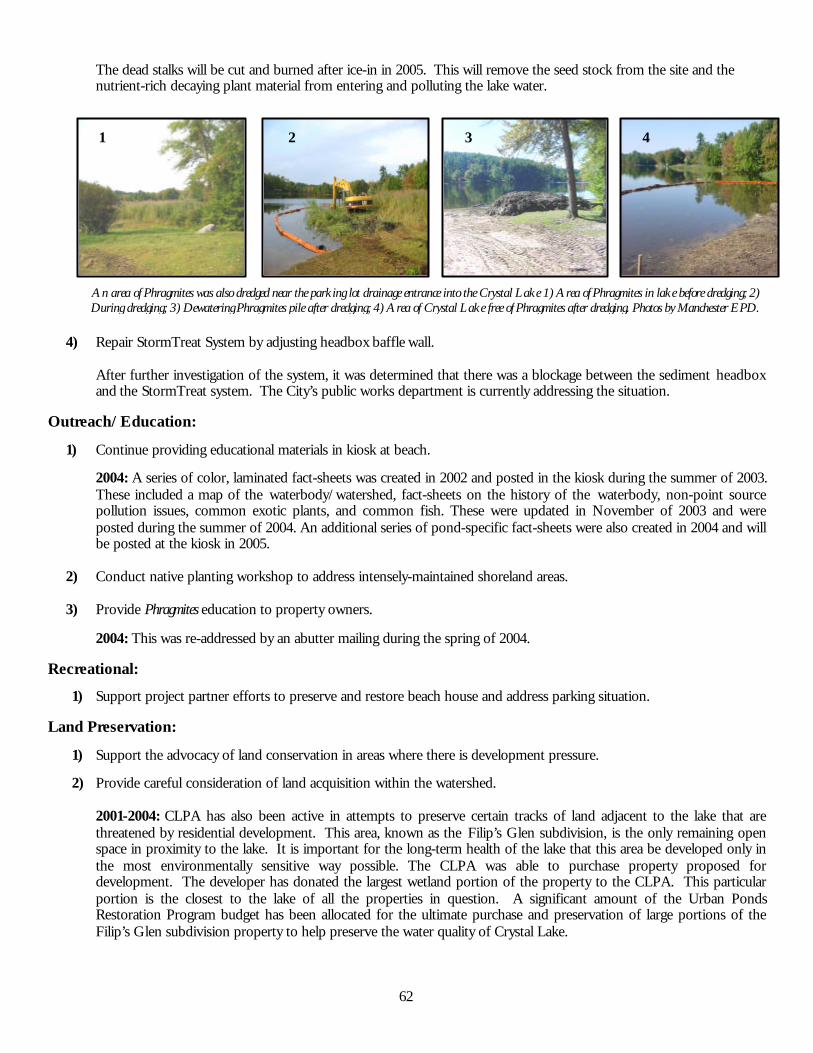
62
The dead stalks will be cut and burned after ice-in in 2005. This will remove the seed stock from the site and thenutrient-rich decaying plant material from entering and polluting the lake water.
4) Repair StormTreat System by adjusting headbox baffle wall.
After further investigation of the system, it was determined that there was a blockage between the sediment headboxand the StormTreat system. The City’s public works department is currently addressing the situation.
Outreach/Education:
1) Continue providing educational materials in kiosk at beach.
2004: A series of color, laminated fact-sheets was created in 2002 and posted in the kiosk during the summer of 2003.These included a map of the waterbody/watershed, fact-sheets on the history of the waterbody, non-point sourcepollution issues, common exotic plants, and common fish. These were updated in November of 2003 and wereposted during the summer of 2004. An additional series of pond-specific fact-sheets were also created in 2004 and willbe posted at the kiosk in 2005.
2) Conduct native planting workshop to address intensely-maintained shoreland areas.
3) Provide Phragmites education to property owners.
2004: This was re-addressed by an abutter mailing during the spring of 2004.
Recreational:
1) Support project partner efforts to preserve and restore beach house and address parking situation.
Land Preservation:
1) Support the advocacy of land conservation in areas where there is development pressure.
2) Provide careful consideration of land acquisition within the watershed.
2001-2004: CLPA has also been active in attempts to preserve certain tracks of land adjacent to the lake that arethreatened by residential development. This area, known as the Filip’s Glen subdivision, is the only remaining openspace in proximity to the lake. It is important for the long-term health of the lake that this area be developed only inthe most environmentally sensitive way possible. The CLPA was able to purchase property proposed fordevelopment. The developer has donated the largest wetland portion of the property to the CLPA. This particularportion is the closest to the lake of all the properties in question. A significant amount of the Urban PondsRestoration Program budget has been allocated for the ultimate purchase and preservation of large portions of theFilip’s Glen subdivision property to help preserve the water quality of Crystal Lake.
An area of Phragmites was also dredged near the parking lot drainage entrance into the Crystal Lake 1) Area of Phragmites in lake before dredging; 2)During dredging; 3) Dewatering Phragmites pile after dredging; 4) Area of Crystal Lake free of Phragmites after dredging. Photos by Manchester EPD.
1 2 3 4
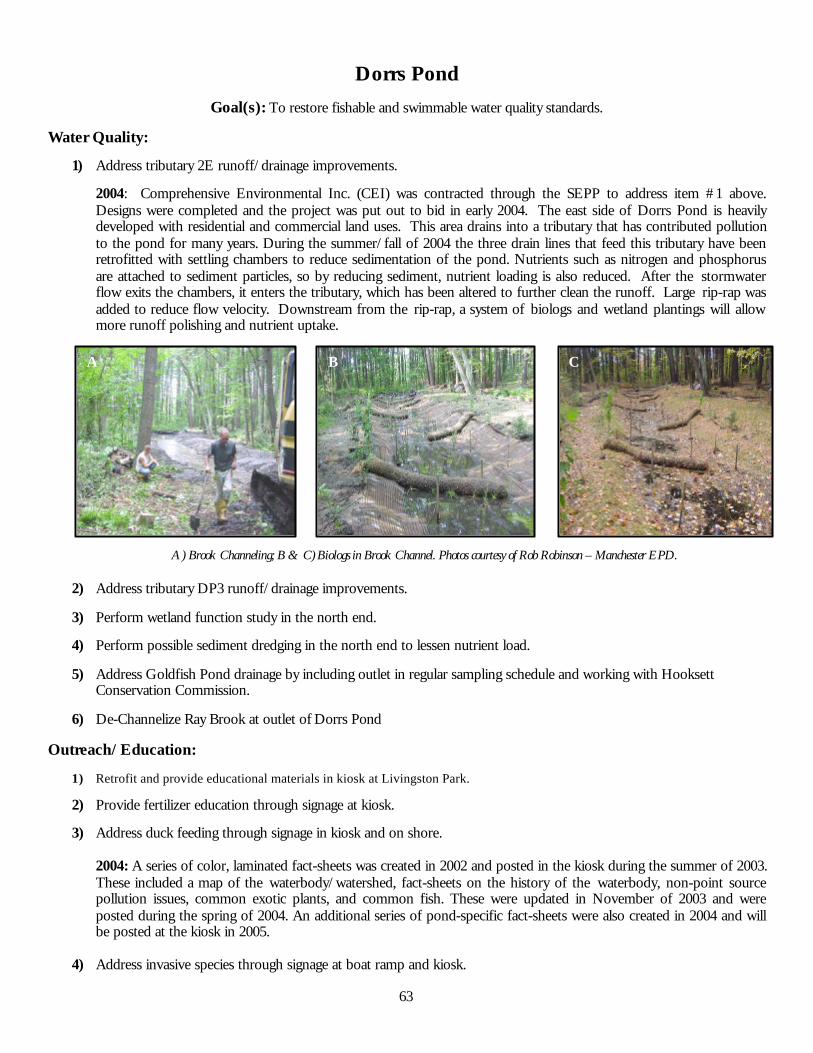
63
Dorrs PondGoal(s): To restore fishable and swimmable water quality standards.
Water Quality:
1) Address tributary 2E runoff/drainage improvements.
2004: Comprehensive Environmental Inc. (CEI) was contracted through the SEPP to address item #1 above.Designs were completed and the project was put out to bid in early 2004. The east side of Dorrs Pond is heavilydeveloped with residential and commercial land uses. This area drains into a tributary that has contributed pollutionto the pond for many years. During the summer/fall of 2004 the three drain lines that feed this tributary have beenretrofitted with settling chambers to reduce sedimentation of the pond. Nutrients such as nitrogen and phosphorusare attached to sediment particles, so by reducing sediment, nutrient loading is also reduced. After the stormwaterflow exits the chambers, it enters the tributary, which has been altered to further clean the runoff. Large rip-rap wasadded to reduce flow velocity. Downstream from the rip-rap, a system of biologs and wetland plantings will allowmore runoff polishing and nutrient uptake.
2) Address tributary DP3 runoff/drainage improvements.
3) Perform wetland function study in the north end.
4) Perform possible sediment dredging in the north end to lessen nutrient load.
5) Address Goldfish Pond drainage by including outlet in regular sampling schedule and working with HooksettConservation Commission.
6) De-Channelize Ray Brook at outlet of Dorrs Pond
Outreach/Education:
1) Retrofit and provide educational materials in kiosk at Livingston Park.
2) Provide fertilizer education through signage at kiosk.
3) Address duck feeding through signage in kiosk and on shore.
2004: A series of color, laminated fact-sheets was created in 2002 and posted in the kiosk during the summer of 2003.These included a map of the waterbody/watershed, fact-sheets on the history of the waterbody, non-point sourcepollution issues, common exotic plants, and common fish. These were updated in November of 2003 and wereposted during the spring of 2004. An additional series of pond-specific fact-sheets were also created in 2004 and willbe posted at the kiosk in 2005.
4) Address invasive species through signage at boat ramp and kiosk.
A B C
A) Brook Channeling; B & C) Biologs in Brook Channel. Photos courtesy of Rob Robinson – Manchester EPD.
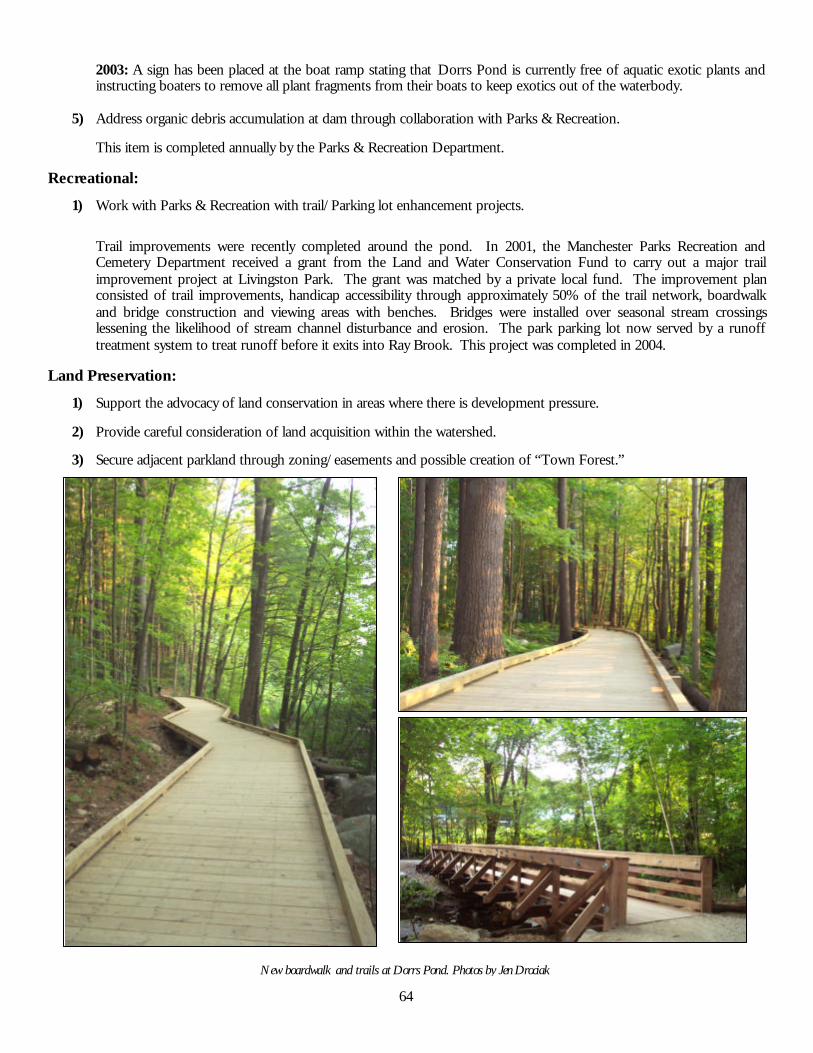
64
2003: A sign has been placed at the boat ramp stating that Dorrs Pond is currently free of aquatic exotic plants andinstructing boaters to remove all plant fragments from their boats to keep exotics out of the waterbody.
5) Address organic debris accumulation at dam through collaboration with Parks & Recreation.
This item is completed annually by the Parks & Recreation Department.
Recreational:
1) Work with Parks & Recreation with trail/Parking lot enhancement projects.
Trail improvements were recently completed around the pond. In 2001, the Manchester Parks Recreation andCemetery Department received a grant from the Land and Water Conservation Fund to carry out a major trailimprovement project at Livingston Park. The grant was matched by a private local fund. The improvement planconsisted of trail improvements, handicap accessibility through approximately 50% of the trail network, boardwalkand bridge construction and viewing areas with benches. Bridges were installed over seasonal stream crossingslessening the likelihood of stream channel disturbance and erosion. The park parking lot now served by a runofftreatment system to treat runoff before it exits into Ray Brook. This project was completed in 2004.
Land Preservation:
1) Support the advocacy of land conservation in areas where there is development pressure.
2) Provide careful consideration of land acquisition within the watershed.
3) Secure adjacent parkland through zoning/easements and possible creation of “Town Forest.”
New boardwalk and trails at Dorrs Pond. Photos by Jen Drociak
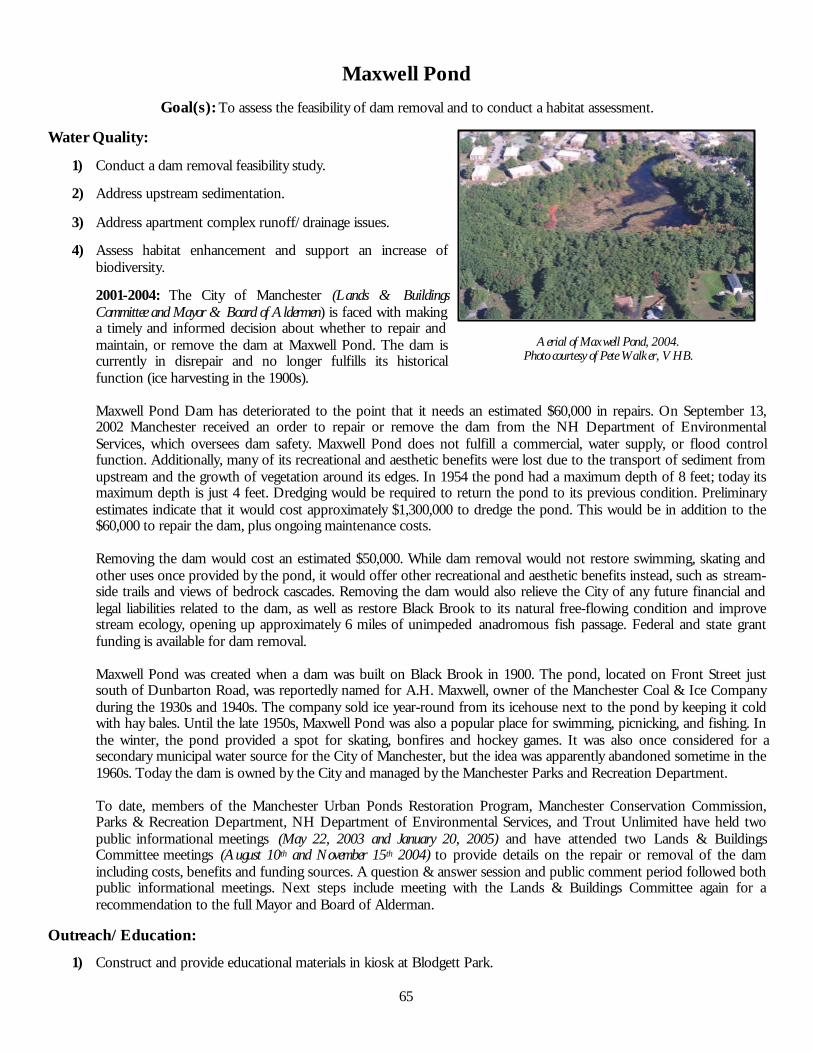
65
Maxwell PondGoal(s): To assess the feasibility of dam removal and to conduct a habitat assessment.
Water Quality:
1) Conduct a dam removal feasibility study.
2) Address upstream sedimentation.
3) Address apartment complex runoff/drainage issues.
4) Assess habitat enhancement and support an increase ofbiodiversity.
2001-2004: The City of Manchester (Lands & BuildingsCommittee and Mayor & Board of Aldermen) is faced with makinga timely and informed decision about whether to repair andmaintain, or remove the dam at Maxwell Pond. The dam iscurrently in disrepair and no longer fulfills its historicalfunction (ice harvesting in the 1900s).
Maxwell Pond Dam has deteriorated to the point that it needs an estimated $60,000 in repairs. On September 13,2002 Manchester received an order to repair or remove the dam from the NH Department of EnvironmentalServices, which oversees dam safety. Maxwell Pond does not fulfill a commercial, water supply, or flood controlfunction. Additionally, many of its recreational and aesthetic benefits were lost due to the transport of sediment fromupstream and the growth of vegetation around its edges. In 1954 the pond had a maximum depth of 8 feet; today itsmaximum depth is just 4 feet. Dredging would be required to return the pond to its previous condition. Preliminaryestimates indicate that it would cost approximately $1,300,000 to dredge the pond. This would be in addition to the$60,000 to repair the dam, plus ongoing maintenance costs.
Removing the dam would cost an estimated $50,000. While dam removal would not restore swimming, skating andother uses once provided by the pond, it would offer other recreational and aesthetic benefits instead, such as stream-side trails and views of bedrock cascades. Removing the dam would also relieve the City of any future financial andlegal liabilities related to the dam, as well as restore Black Brook to its natural free-flowing condition and improvestream ecology, opening up approximately 6 miles of unimpeded anadromous fish passage. Federal and state grantfunding is available for dam removal.
Maxwell Pond was created when a dam was built on Black Brook in 1900. The pond, located on Front Street justsouth of Dunbarton Road, was reportedly named for A.H. Maxwell, owner of the Manchester Coal & Ice Companyduring the 1930s and 1940s. The company sold ice year-round from its icehouse next to the pond by keeping it coldwith hay bales. Until the late 1950s, Maxwell Pond was also a popular place for swimming, picnicking, and fishing. Inthe winter, the pond provided a spot for skating, bonfires and hockey games. It was also once considered for asecondary municipal water source for the City of Manchester, but the idea was apparently abandoned sometime in the1960s. Today the dam is owned by the City and managed by the Manchester Parks and Recreation Department.
To date, members of the Manchester Urban Ponds Restoration Program, Manchester Conservation Commission,Parks & Recreation Department, NH Department of Environmental Services, and Trout Unlimited have held twopublic informational meetings (May 22, 2003 and January 20, 2005) and have attended two Lands & BuildingsCommittee meetings (August 10th and November 15th 2004) to provide details on the repair or removal of the damincluding costs, benefits and funding sources. A question & answer session and public comment period followed bothpublic informational meetings. Next steps include meeting with the Lands & Buildings Committee again for arecommendation to the full Mayor and Board of Alderman.
Outreach/Education:
1) Construct and provide educational materials in kiosk at Blodgett Park.
Aerial of Maxwell Pond, 2004.Photo courtesy of Pete Walker, VHB.

66
2003: An Eagle-Scout constructed a kiosk at Blodgett Park in May 2003. A series of color, laminated fact-sheets wascreated in 2002 and posted in the kiosk during the summer of 2003. These included a map of thewaterbody/watershed, fact-sheets on the history of the waterbody, non-point source pollution issues, common exoticplants, and common fish. These were updated in November of 2003 and were posted during the early summer of2004. An additional series of pond-specific fact-sheets were also created in 2004 and will be posted at the kiosk in2005.
2) Examine and address the threat of invasive species.
2004: A partnership between the UPRP, National Park Service (NPS), and the New England Wildflower Society(NEWFS) was developed in 2003 to address invasive species management options on Maxwell Pond’s southeast side.NEWFS has drafted a brief work-plan for the field season 2005.
Recreational:
1) Work with Parks & Recreation to construct a boardwalk and loop-trail around Maxwell Pond. This includes a smallbridge over Black Brook.
Land Preservation:
1) Secure adjacent parkland through zoning/easements.
1A) Maxwell Pond Dam; 1B) Photo rendering post dam removal; 2A) Maxwell Pond; 2B) Photo rendering post dam removal.Photos courtesty of Jim MacCartney, Trout Unlimited.
1A 1B
2A
2B
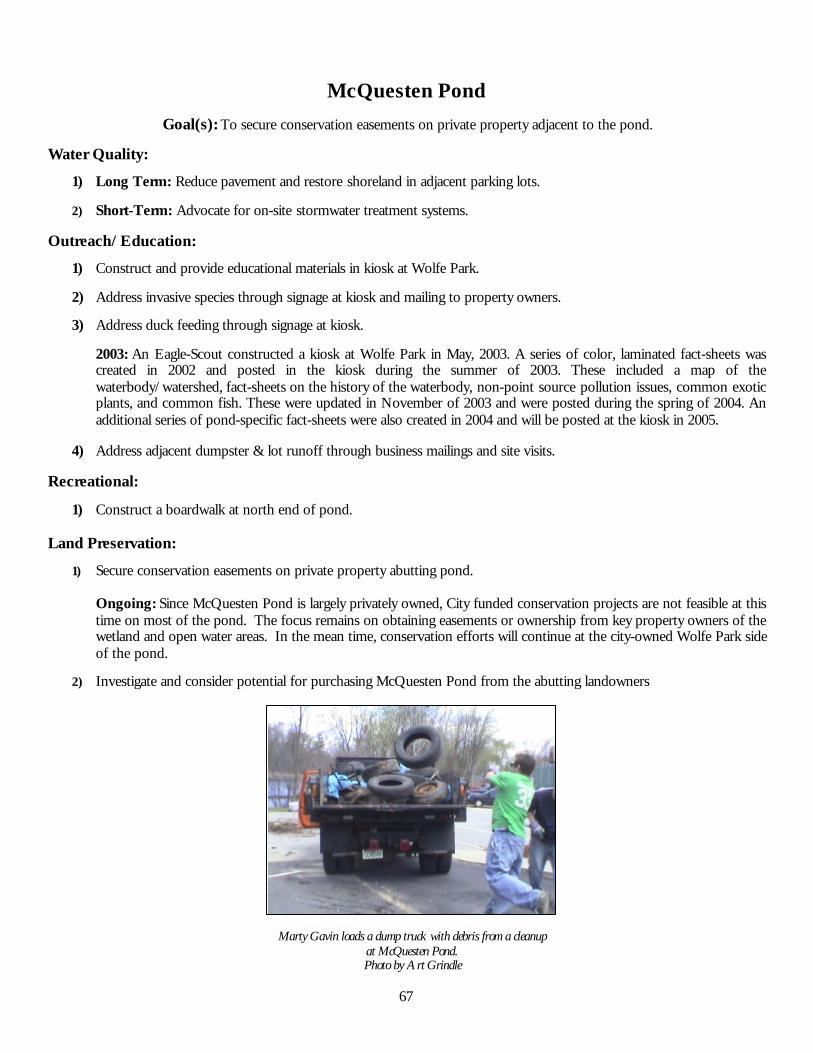
67
McQuesten PondGoal(s): To secure conservation easements on private property adjacent to the pond.
Water Quality:
1) Long Term: Reduce pavement and restore shoreland in adjacent parking lots.
2) Short-Term: Advocate for on-site stormwater treatment systems.
Outreach/Education:
1) Construct and provide educational materials in kiosk at Wolfe Park.
2) Address invasive species through signage at kiosk and mailing to property owners.
3) Address duck feeding through signage at kiosk.
2003: An Eagle-Scout constructed a kiosk at Wolfe Park in May, 2003. A series of color, laminated fact-sheets wascreated in 2002 and posted in the kiosk during the summer of 2003. These included a map of thewaterbody/watershed, fact-sheets on the history of the waterbody, non-point source pollution issues, common exoticplants, and common fish. These were updated in November of 2003 and were posted during the spring of 2004. Anadditional series of pond-specific fact-sheets were also created in 2004 and will be posted at the kiosk in 2005.
4) Address adjacent dumpster & lot runoff through business mailings and site visits.
Recreational:
1) Construct a boardwalk at north end of pond.
Land Preservation:
1) Secure conservation easements on private property abutting pond.
Ongoing: Since McQuesten Pond is largely privately owned, City funded conservation projects are not feasible at thistime on most of the pond. The focus remains on obtaining easements or ownership from key property owners of thewetland and open water areas. In the mean time, conservation efforts will continue at the city-owned Wolfe Park sideof the pond.
2) Investigate and consider potential for purchasing McQuesten Pond from the abutting landowners
Marty Gavin loads a dump truck with debris from a cleanupat McQuesten Pond.Photo by Art Grindle

68

69
Nutts Pond
Goal(s): To improve sport fishing and non-motorized/recreational boating opportunities. To improve water quality.
Water Quality:
1) Address urban runoff at four outfalls by completing a drainage study.
2) Investigate opportunities for NPS reduction in upper watershed areas.
3) Investigate opportunities to stabilize shoreline with native plantings.
2002-2004: During the winter of 2002 and 2003, Comprehensive Environmental Inc (CEI) conducted a nutrientbudget study for the Nutts Pond watershed to help identify the worst pollution sources. The watershed was separatedinto five subwatersheds and nutrient inputs were calculated according to land use types in each subwatershed. EastInlet subwatershed, the largest subwatershed area (more the 13 million square feet) was found to be the largestcontributor of nutrients to the pond (58%). This subwatershed contains extensive athletic fields, large heavily usedpaved lots, extensive residential neighborhoods, and several strip malls. This area could be the focus for the firstBMP installations at Nutts Pond. Recommendations for possible treatment measures were included in amemorandum report by CEI.
Currently, CEI is working on designs for BMP installation in the Precourt Park area. Since the Parks & RecreationDepartment is planning on improving Precourt Park in 2005, it seemed timely to concurrently address water qualityimprovements on the pond’s north end. Incorporating BMPs into the original park facelift design will saveunnecessary duplication of destruction and construction. The BMP design will attempt to divide stormwater volumeand infiltrate as much flow as the site allows.
CEI is also working on BMP designs for the north and south inlets. Based on the large drainage areas and anticipatedflows, the most cost-effective method to prevent pond sedimentation seems to be to build forebay structures aroundthe inlet structures. This will allow for containment of the sediment to a specific area, which can be cleanedperiodically. The accumulated sediment deltas at the north and south inlets will be dredged to remove the nutrientrich material. These projects are scheduled to be constructed in 2005.
Outreach/Education:
1) Retrofit and provide educational materials in kiosk at Precourt Park.
2003 - 2004: An Eagle-Scout retrofitted the kiosk at Precourt Park with corkboard during May, 2003. A series ofcolor, laminated fact-sheets was created in 2002 and posted in the kiosk during the summer of 2003. These included amap of the waterbody/watershed, fact-sheets on the history of the waterbody, non-point source pollution issues,common exotic plants, and common fish. These fact-sheets were updated in November of 2003 and were postedduring the spring of 2004. An additional series of pond-specific fact-sheets were also created in 2004 and will beposted at the kiosk in 2005.
2) Provide outreach/education to area businesses through mailings and on-site pollution prevention assessments.
2002-2003: In 2002, the UPRP also created a pollution prevention business survey for facilities within the Nutts Pondwatershed. From July through December 2003, 37 (out of 84) businesses in the Nutts Pond watershed were visited.These sites were chosen based on their proximity to Tannery Brook and Nutts Pond.
A few weeks prior to the visits, the businesses were mailed a letter explaining the project. During the visits, the storemanager or facilities maintenance person was interviewed. Most businesses visited assessed on general information(whether they were aware of their proximity to Nutts Pond), solid waste/dumpster maintenance, floor drains,stormwater management, use oil, and use and/or storage of any other hazardous materials.
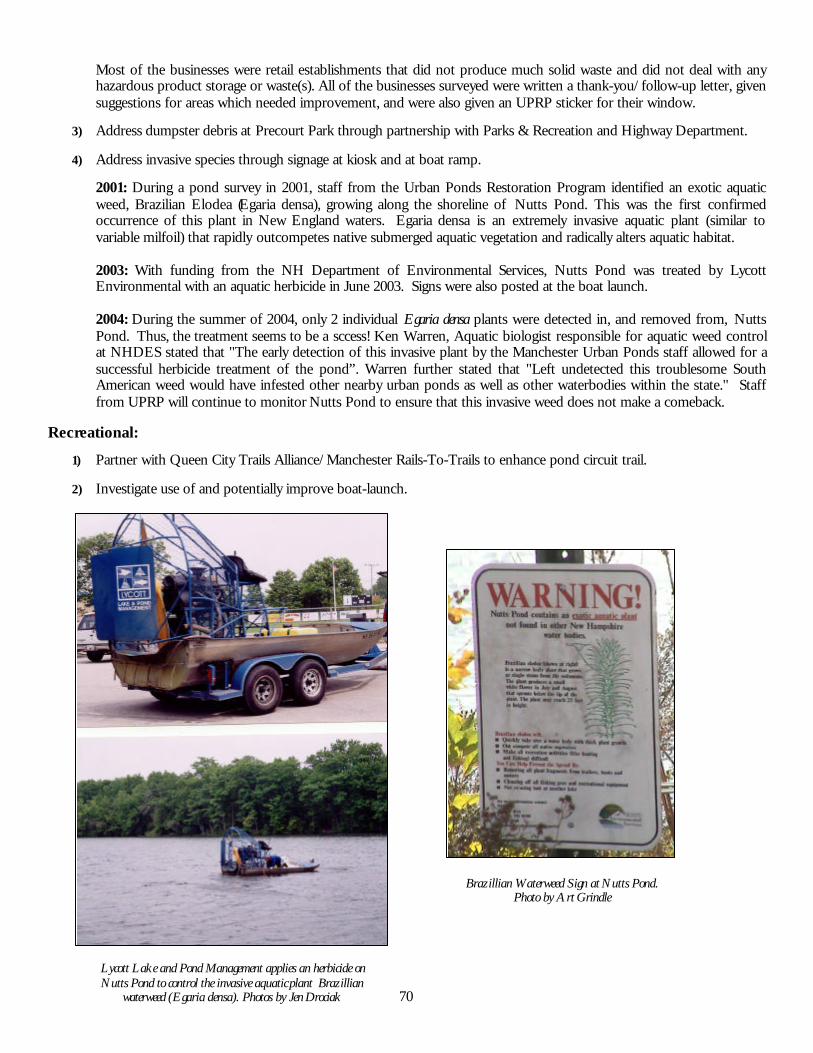
70
Most of the businesses were retail establishments that did not produce much solid waste and did not deal with anyhazardous product storage or waste(s). All of the businesses surveyed were written a thank-you/follow-up letter, givensuggestions for areas which needed improvement, and were also given an UPRP sticker for their window.
3) Address dumpster debris at Precourt Park through partnership with Parks & Recreation and Highway Department.
4) Address invasive species through signage at kiosk and at boat ramp.
2001: During a pond survey in 2001, staff from the Urban Ponds Restoration Program identified an exotic aquaticweed, Brazilian Elodea (Egaria densa), growing along the shoreline of Nutts Pond. This was the first confirmedoccurrence of this plant in New England waters. Egaria densa is an extremely invasive aquatic plant (similar tovariable milfoil) that rapidly outcompetes native submerged aquatic vegetation and radically alters aquatic habitat.
2003: With funding from the NH Department of Environmental Services, Nutts Pond was treated by LycottEnvironmental with an aquatic herbicide in June 2003. Signs were also posted at the boat launch.
2004: During the summer of 2004, only 2 individual Egaria densa plants were detected in, and removed from, NuttsPond. Thus, the treatment seems to be a sccess! Ken Warren, Aquatic biologist responsible for aquatic weed controlat NHDES stated that "The early detection of this invasive plant by the Manchester Urban Ponds staff allowed for asuccessful herbicide treatment of the pond”. Warren further stated that "Left undetected this troublesome SouthAmerican weed would have infested other nearby urban ponds as well as other waterbodies within the state." Stafffrom UPRP will continue to monitor Nutts Pond to ensure that this invasive weed does not make a comeback.
Recreational:
1) Partner with Queen City Trails Alliance/Manchester Rails-To-Trails to enhance pond circuit trail.
2) Investigate use of and potentially improve boat-launch.
Lycott Lake and Pond Management applies an herbicide onNutts Pond to control the invasive aquatic plant Brazillian
waterweed (Egaria densa). Photos by Jen Drociak
Brazillian Waterweed Sign at Nutts Pond.Photo by Art Grindle
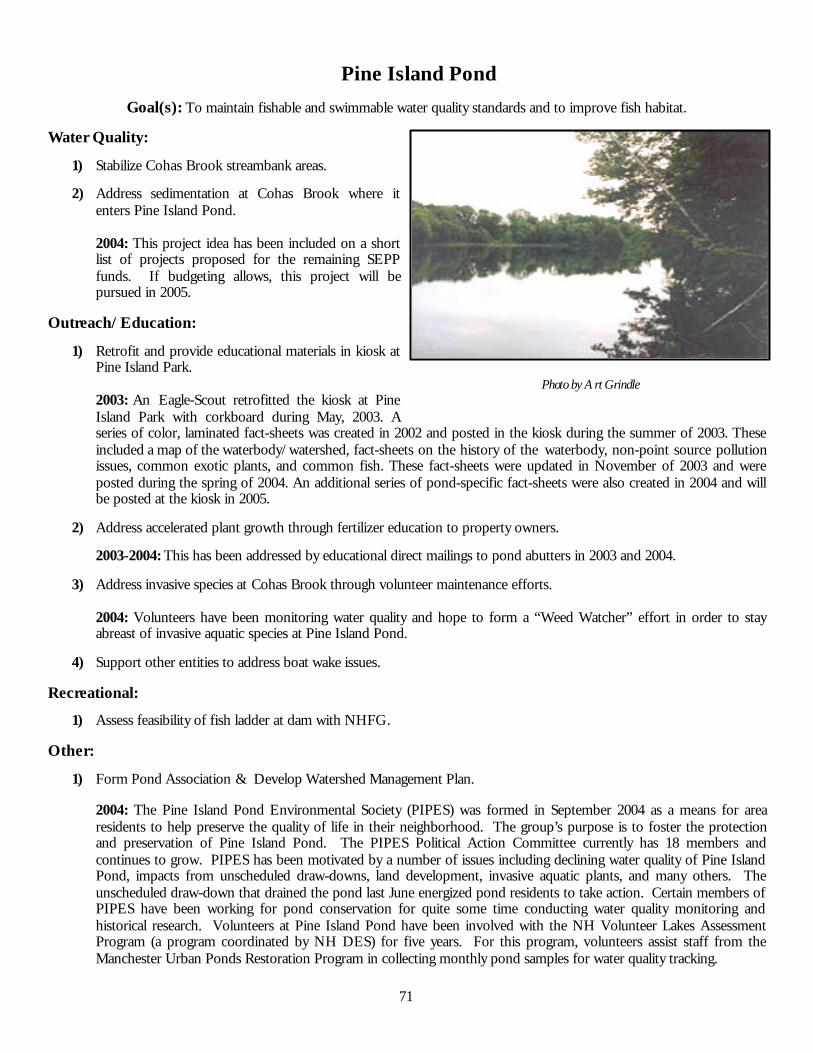
71
Pine Island PondGoal(s): To maintain fishable and swimmable water quality standards and to improve fish habitat.
Water Quality:
1) Stabilize Cohas Brook streambank areas.
2) Address sedimentation at Cohas Brook where itenters Pine Island Pond.
2004: This project idea has been included on a shortlist of projects proposed for the remaining SEPPfunds. If budgeting allows, this project will bepursued in 2005.
Outreach/Education:
1) Retrofit and provide educational materials in kiosk atPine Island Park.
2003: An Eagle-Scout retrofitted the kiosk at PineIsland Park with corkboard during May, 2003. Aseries of color, laminated fact-sheets was created in 2002 and posted in the kiosk during the summer of 2003. Theseincluded a map of the waterbody/watershed, fact-sheets on the history of the waterbody, non-point source pollutionissues, common exotic plants, and common fish. These fact-sheets were updated in November of 2003 and wereposted during the spring of 2004. An additional series of pond-specific fact-sheets were also created in 2004 and willbe posted at the kiosk in 2005.
2) Address accelerated plant growth through fertilizer education to property owners.
2003-2004: This has been addressed by educational direct mailings to pond abutters in 2003 and 2004.
3) Address invasive species at Cohas Brook through volunteer maintenance efforts.
2004: Volunteers have been monitoring water quality and hope to form a “Weed Watcher” effort in order to stayabreast of invasive aquatic species at Pine Island Pond.
4) Support other entities to address boat wake issues.
Recreational:
1) Assess feasibility of fish ladder at dam with NHFG.
Other:
1) Form Pond Association & Develop Watershed Management Plan.
2004: The Pine Island Pond Environmental Society (PIPES) was formed in September 2004 as a means for arearesidents to help preserve the quality of life in their neighborhood. The group’s purpose is to foster the protectionand preservation of Pine Island Pond. The PIPES Political Action Committee currently has 18 members andcontinues to grow. PIPES has been motivated by a number of issues including declining water quality of Pine IslandPond, impacts from unscheduled draw-downs, land development, invasive aquatic plants, and many others. Theunscheduled draw-down that drained the pond last June energized pond residents to take action. Certain members ofPIPES have been working for pond conservation for quite some time conducting water quality monitoring andhistorical research. Volunteers at Pine Island Pond have been involved with the NH Volunteer Lakes AssessmentProgram (a program coordinated by NH DES) for five years. For this program, volunteers assist staff from theManchester Urban Ponds Restoration Program in collecting monthly pond samples for water quality tracking.
Photo by Art Grindle

72

73
Stevens PondGoal(s): To improve water quality through a partnership with the New Hampshire Department of Transportation
to address highway runoff.
Water Quality:
1) Address and remedy I-93 runoff issues.
2001-2004: Since 2001, several agencies havebeen working on a solution to the highwayrunoff issue at Stevens Pond. The NHDepartment of Transportation has expressedwillingness to work with DES and the UPRP totreat the highway runoff that is drasticallyaffecting the water quality of Stevens Pond.Proposed solutions include a closed drainagesystem to divert stormwater to where adequatetreatment can be attained, or a berm diversionsystem to separate the stormwater from StevensPond. Discussions with NH DOT are stillongoing.
2) Address headwater erosion at EJ Roy Drive and other developed areas.
Outreach/Education:
1) Construct and provide educational materials in kiosk at boat launch.
2) Address invasive species with proper signage at kiosk and boat launch.
2003: An Eagle-Scout constructed a kiosk at the Stevens Pond boat ramp during May, 2003. A series of color,laminated fact-sheets was created in 2002 and posted in the kiosk during the summer of 2003. These included a mapof the waterbody/watershed, fact-sheets on the history of the waterbody, non-point source pollution issues, commonexotic plants, and common fish. These fact-sheets were updated in November of 2003 and were posted during thespring of 2004.
2003: A sign has been placed at the boat ramp stating that Stevens Pond is currently free of aquatic exotic plants andinstructing boaters to remove all plant fragments from their boats to keep exotics out of the waterbody.
Recreational:
1) Improve boat-launch.
2) Work with Parks & Recreational Department to create a wetland boardwalk.
3) Improve adjacent trails.
2004: These project ideas have been included on a short list of projects proposed for the remaining SEPP funds. Ifbudgeting allows, these projects will be pursued in 2005.
Land Preservation:
1) Secure adjacent parkland through zoning/easements.
Fishermen on Stevens Pond. Photo by Art Grindle

74

APPENDIX A. NEWSLETTERS , FACT-SHEETS & PUZZLES

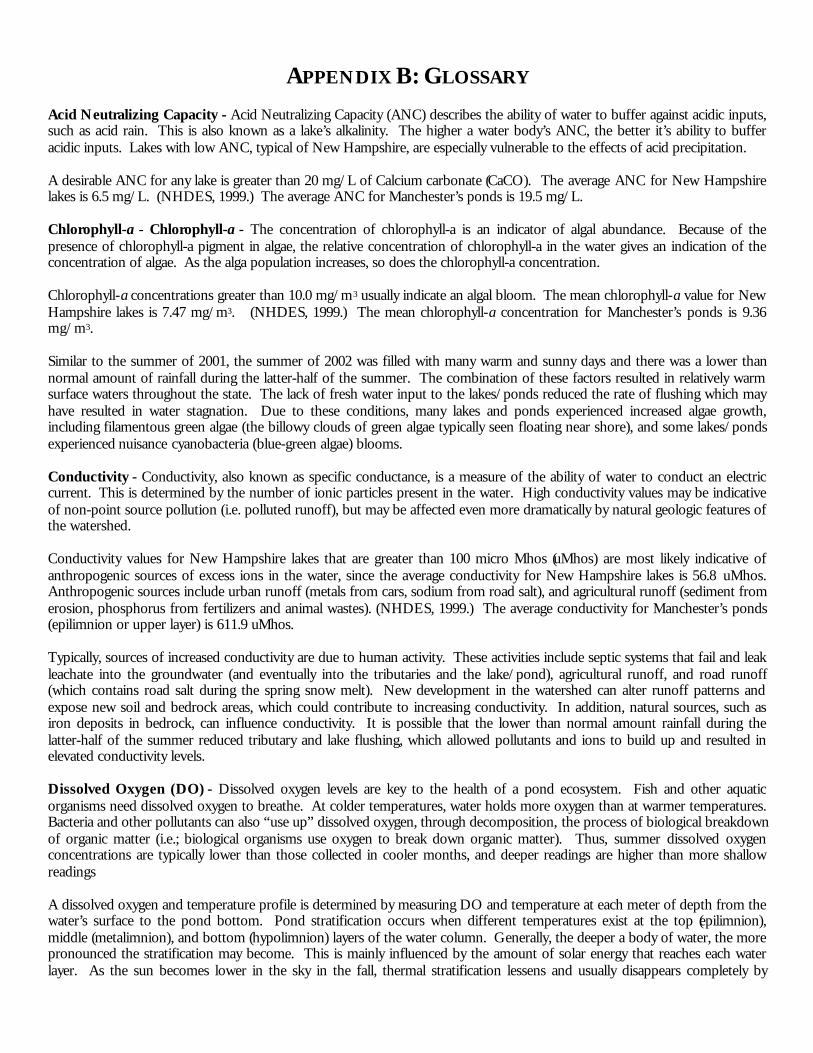
APPENDIX B: GLOSSARY
Acid Neutralizing Capacity - Acid Neutralizing Capacity (ANC) describes the ability of water to buffer against acidic inputs,such as acid rain. This is also known as a lake’s alkalinity. The higher a water body’s ANC, the better it’s ability to bufferacidic inputs. Lakes with low ANC, typical of New Hampshire, are especially vulnerable to the effects of acid precipitation.
A desirable ANC for any lake is greater than 20 mg/L of Calcium carbonate (CaCO). The average ANC for New Hampshirelakes is 6.5 mg/L. (NHDES, 1999.) The average ANC for Manchester’s ponds is 19.5 mg/L.
Chlorophyll-a - Chlorophyll-a - The concentration of chlorophyll-a is an indicator of algal abundance. Because of thepresence of chlorophyll-a pigment in algae, the relative concentration of chlorophyll-a in the water gives an indication of theconcentration of algae. As the alga population increases, so does the chlorophyll-a concentration.
Chlorophyll-a concentrations greater than 10.0 mg/m3 usually indicate an algal bloom. The mean chlorophyll-a value for NewHampshire lakes is 7.47 mg/m3. (NHDES, 1999.) The mean chlorophyll-a concentration for Manchester’s ponds is 9.36mg/m3.
Similar to the summer of 2001, the summer of 2002 was filled with many warm and sunny days and there was a lower thannormal amount of rainfall during the latter-half of the summer. The combination of these factors resulted in relatively warmsurface waters throughout the state. The lack of fresh water input to the lakes/ponds reduced the rate of flushing which mayhave resulted in water stagnation. Due to these conditions, many lakes and ponds experienced increased algae growth,including filamentous green algae (the billowy clouds of green algae typically seen floating near shore), and some lakes/pondsexperienced nuisance cyanobacteria (blue-green algae) blooms.
Conductivity - Conductivity, also known as specific conductance, is a measure of the ability of water to conduct an electriccurrent. This is determined by the number of ionic particles present in the water. High conductivity values may be indicativeof non-point source pollution (i.e. polluted runoff), but may be affected even more dramatically by natural geologic features ofthe watershed.
Conductivity values for New Hampshire lakes that are greater than 100 micro Mhos (uMhos) are most likely indicative ofanthropogenic sources of excess ions in the water, since the average conductivity for New Hampshire lakes is 56.8 uMhos.Anthropogenic sources include urban runoff (metals from cars, sodium from road salt), and agricultural runoff (sediment fromerosion, phosphorus from fertilizers and animal wastes). (NHDES, 1999.) The average conductivity for Manchester’s ponds(epilimnion or upper layer) is 611.9 uMhos.
Typically, sources of increased conductivity are due to human activity. These activities include septic systems that fail and leakleachate into the groundwater (and eventually into the tributaries and the lake/pond), agricultural runoff, and road runoff(which contains road salt during the spring snow melt). New development in the watershed can alter runoff patterns andexpose new soil and bedrock areas, which could contribute to increasing conductivity. In addition, natural sources, such asiron deposits in bedrock, can influence conductivity. It is possible that the lower than normal amount rainfall during thelatter-half of the summer reduced tributary and lake flushing, which allowed pollutants and ions to build up and resulted inelevated conductivity levels.
Dissolved Oxygen (DO) - Dissolved oxygen levels are key to the health of a pond ecosystem. Fish and other aquaticorganisms need dissolved oxygen to breathe. At colder temperatures, water holds more oxygen than at warmer temperatures.Bacteria and other pollutants can also “use up” dissolved oxygen, through decomposition, the process of biological breakdownof organic matter (i.e.; biological organisms use oxygen to break down organic matter). Thus, summer dissolved oxygenconcentrations are typically lower than those collected in cooler months, and deeper readings are higher than more shallowreadings
A dissolved oxygen and temperature profile is determined by measuring DO and temperature at each meter of depth from thewater’s surface to the pond bottom. Pond stratification occurs when different temperatures exist at the top (epilimnion),middle (metalimnion), and bottom (hypolimnion) layers of the water column. Generally, the deeper a body of water, the morepronounced the stratification may become. This is mainly influenced by the amount of solar energy that reaches each waterlayer. As the sun becomes lower in the sky in the fall, thermal stratification lessens and usually disappears completely by
winter. Deeper ponds experience pronounced thermal stratification, while in shallower ponds stratification is subtler, if presentat all. Due to biological processes that consume oxygen at the pond bottom, some ponds incur a dissolved oxygen deficit inthe hypolimnion (bottom layer).
“Typically, the deeper the reading, the lower the percent saturation of oxygen. Colder waters are generally able to hold moredissolved oxygen than warmer waters, and generally, the deeper the water, the colder the temperature. As a result, a reading of9 milligrams/Liter (mg/L) of oxygen at the surface will yield a higher percent saturation than a reading of 9 mg/L at 25meters, because of the difference in water temperature.” (NH DES, 1999).
Epilimnion (Epilimnetic) – Top layers of a lake (having to do with the top layers of a lake).
Hypolimnion (Hypolimnetic) – Bottom layers of a lake (having to do with the bottom layers of a lake).
Mean – The value directly in the middle. The value for which there are equal values above and below. For instance, the meanChlorophyll a concentration for NH lakes is the concentration for which there is an equal number of lakes with greaterconcentration and lakes with a lower concentration.
Metalimnion (Metalimnetic) – Middle layers of a lake (having to do with the middle layers of a lake).
pH - The lower the pH of water, the more acidic the water. The higher the pH of water, the more alkaline the water. PondpH is crucial to the well being of pond dwelling organisms. A pH of less than 5.5 (acidic) has detrimental effects on fishgrowth and reproduction. A pH between 6.5 and 7.0 is considered ideal for freshwater ecosystems. The median pH for NewHampshire lakes is 6.7. (NHDES, 1999). The median pH for Manchester’s ponds is 7.07.
Phosphorus - Phosphorus is a necessary nutrient for plant and algae growth. It is generally “limiting” in New Hampshirewaters, meaning that plants have plenty of everything else, and only the amount of phosphorus present keeps their growth incheck. Too much phosphorus in a lake/pond can therefore lead to unhealthy increases in plant and algal growth. The mediansummer total phosphorus concentration in the epilimnion (upper layer) of New Hampshire’s lakes and ponds is 11 ug/L. Themedian summer phosphorus concentration in the hypolimnion (lower layer) is 14 ug/L.
Phosphorus exists as a natural element, but becomes a problem when inputs from such sources as septic systems, erosion,animal wastes, and fertilizer load the water body with excess amounts. One of the most important approaches to reducingphosphorus loading to a waterbody is to continually educate watershed residents about its sources and how excessive amountscan adversely impact the ecology and value of lakes and ponds. Phosphorus sources within a lake or pond’s watershedtypically include septic systems, animal waste, lawn fertilizer, road and construction erosion, and natural wetlands.
Secchi Disk Transparency - A Secchi disk measures the depth that one can see into the water, and so the depth that sunlightcan reach into the water. Although a low Secchi disk transparency is not necessarily “bad”, a change in transparency over timeis undesirable, because it may cause plants and animals currently living in the pond to die off or may cause a change in thepond life diversity. To measure Secchi disk transparency, a black and white patterned disk is lowered into the water, and thedepth at which it is no longer visible is recorded. This indicates water clarity, which is affected by the amount of algae andparticulate matter (turbidity) in the water column. Secchi disk readings are somewhat subjective, but generally correlate withchlorophyll-a concentrations and turbidity levels.
The mean transparency for New Hampshire lakes is 3.7 meters. (NHDES, 1999.) The mean transparency for Manchester’sponds is 2.1 meters. If we assume that Manchester’s ponds were originally more typical of New Hampshire lakes, then wewould estimate that they are more “cloudy” than they should be. Steps to decrease turbidity and increase transparency/clarity(i.e. reducing polluted runoff entering the ponds, and stabilizing banks) are therefore being planned.
Two different weather-related patterns occurred during the spring and summer of 2002 that influenced lake quality during thesummer season. In late May and early June, numerous rainstorms occurred. Stormwater runoff associated with theserainstorms may have increased phosphorus loading, and the amount of soil particles washed into waterbodies throughout thestate. Some lakes and ponds experienced lower than typical transparency readings during late May and early June.

However, similar to the 2001 sampling season, the lower than average amount of rainfall and the warmer temperatures duringthe latter-half of the summer resulted in a few lakes/ponds reporting their greatest-ever Secchi-disk readings in July andAugust (a time when we often observe reduced clarity due to increased algal growth)!
Typically, high intensity rainfall causes erosion of sediments into lakes/ponds and streams, thus decreasing transparency andclarity. Efforts should continually be made to stabilize stream banks, lake/pond shorelines, disturbed soils within thewatershed, and especially dirt roads located immediately adjacent to the edge of tributaries and the lake/pond. Guides to BestManagement Practices designed to reduce, and possibly even eliminate, nonpoint source pollutants, such as sediment loading,are available from NHDES upon request
Turbidity - Turbidity is a measure of suspended matter in the water. The more material (clay, silt, algae) suspended in thewater, the higher the turbidity. These materials cause light to be scattered and absorbed, instead of transmitted in straightlines, leading to decreased water transparency/clarity. High turbidity readings are often found in water adjacent toconstruction sites, or waters otherwise polluted. (NHDES, 1999.)
The median turbidity for New Hampshire lakes is 1.0 NTU. (NHDES, 1999.) The median turbidity for Manchester’s pondsis 1.55 NTU.

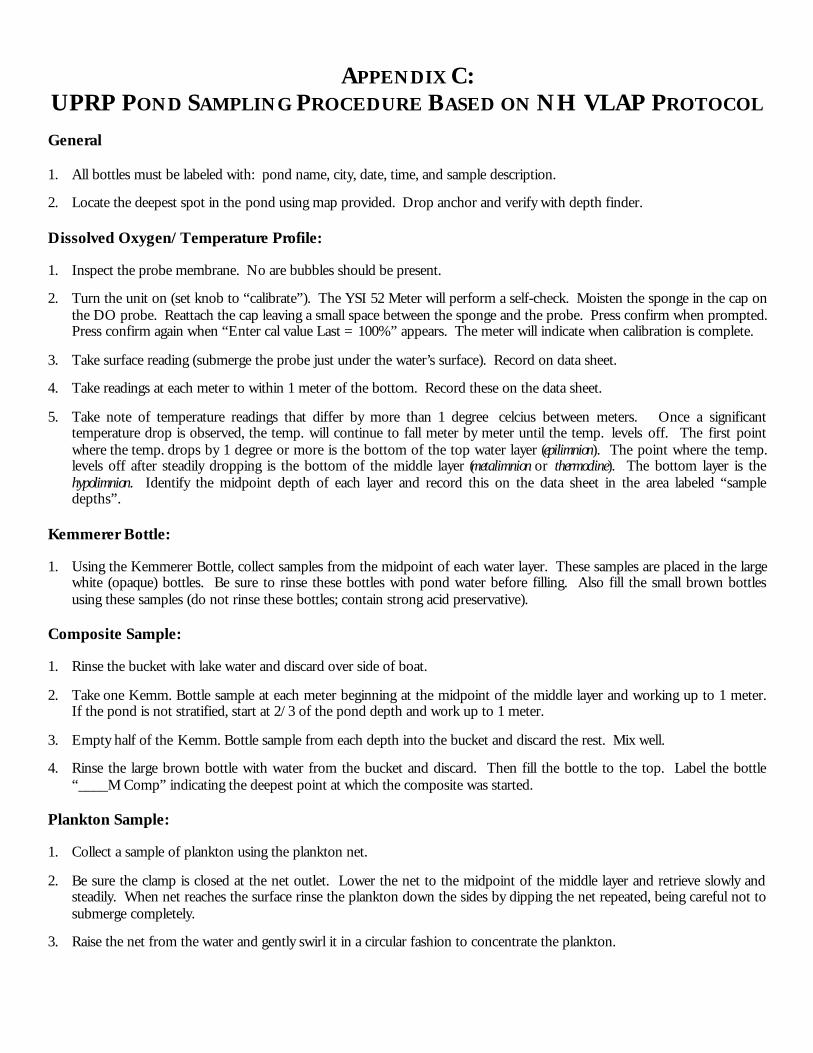
APPENDIX C:UPRP POND SAMPLING PROCEDURE BASED ON NH VLAP PROTOCOL
General
1. All bottles must be labeled with: pond name, city, date, time, and sample description.
2. Locate the deepest spot in the pond using map provided. Drop anchor and verify with depth finder.
Dissolved Oxygen/Temperature Profile:
1. Inspect the probe membrane. No are bubbles should be present.
2. Turn the unit on (set knob to “calibrate”). The YSI 52 Meter will perform a self-check. Moisten the sponge in the cap onthe DO probe. Reattach the cap leaving a small space between the sponge and the probe. Press confirm when prompted.Press confirm again when “Enter cal value Last = 100%” appears. The meter will indicate when calibration is complete.
3. Take surface reading (submerge the probe just under the water’s surface). Record on data sheet.
4. Take readings at each meter to within 1 meter of the bottom. Record these on the data sheet.
5. Take note of temperature readings that differ by more than 1 degree celcius between meters. Once a significanttemperature drop is observed, the temp. will continue to fall meter by meter until the temp. levels off. The first pointwhere the temp. drops by 1 degree or more is the bottom of the top water layer (epilimnion). The point where the temp.levels off after steadily dropping is the bottom of the middle layer (metalimnion or thermocline). The bottom layer is thehypolimnion. Identify the midpoint depth of each layer and record this on the data sheet in the area labeled “sampledepths”.
Kemmerer Bottle:
1. Using the Kemmerer Bottle, collect samples from the midpoint of each water layer. These samples are placed in the largewhite (opaque) bottles. Be sure to rinse these bottles with pond water before filling. Also fill the small brown bottlesusing these samples (do not rinse these bottles; contain strong acid preservative).
Composite Sample:
1. Rinse the bucket with lake water and discard over side of boat.
2. Take one Kemm. Bottle sample at each meter beginning at the midpoint of the middle layer and working up to 1 meter.If the pond is not stratified, start at 2/3 of the pond depth and work up to 1 meter.
3. Empty half of the Kemm. Bottle sample from each depth into the bucket and discard the rest. Mix well.
4. Rinse the large brown bottle with water from the bucket and discard. Then fill the bottle to the top. Label the bottle“____M Comp” indicating the deepest point at which the composite was started.
Plankton Sample:
1. Collect a sample of plankton using the plankton net.
2. Be sure the clamp is closed at the net outlet. Lower the net to the midpoint of the middle layer and retrieve slowly andsteadily. When net reaches the surface rinse the plankton down the sides by dipping the net repeated, being careful not tosubmerge completely.
3. Raise the net from the water and gently swirl it in a circular fashion to concentrate the plankton.
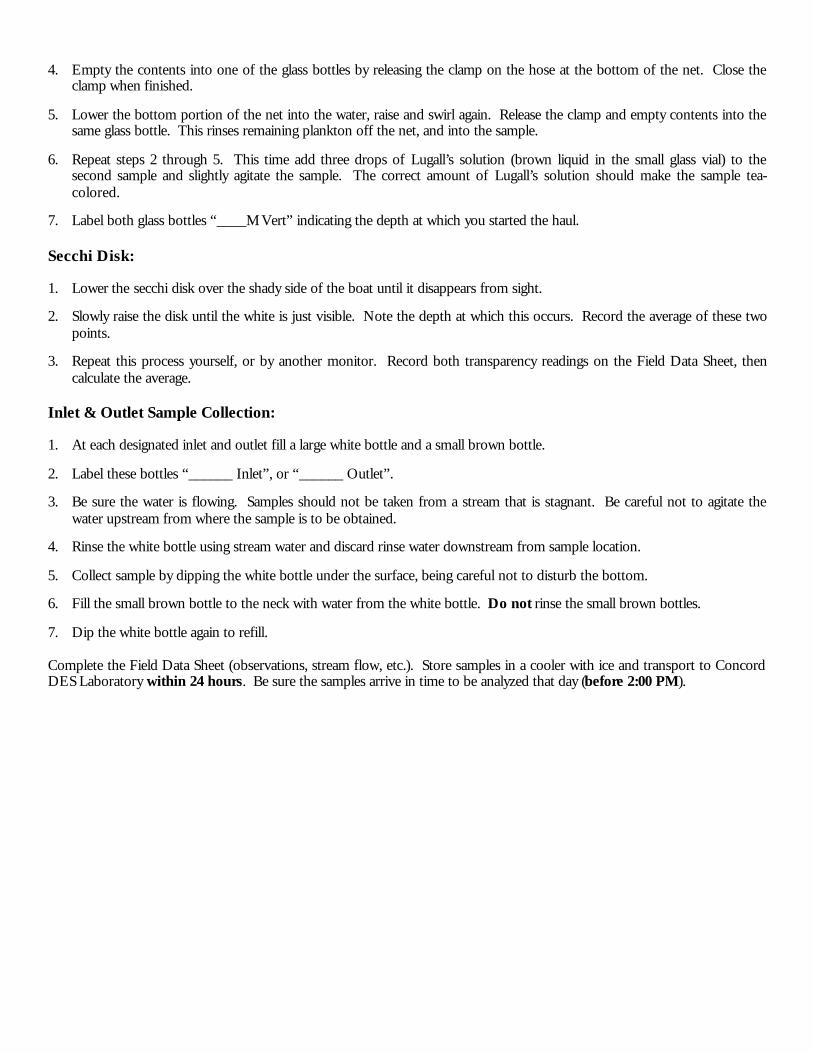
4. Empty the contents into one of the glass bottles by releasing the clamp on the hose at the bottom of the net. Close theclamp when finished.
5. Lower the bottom portion of the net into the water, raise and swirl again. Release the clamp and empty contents into thesame glass bottle. This rinses remaining plankton off the net, and into the sample.
6. Repeat steps 2 through 5. This time add three drops of Lugall’s solution (brown liquid in the small glass vial) to thesecond sample and slightly agitate the sample. The correct amount of Lugall’s solution should make the sample tea-colored.
7. Label both glass bottles “____M Vert” indicating the depth at which you started the haul.
Secchi Disk:
1. Lower the secchi disk over the shady side of the boat until it disappears from sight.
2. Slowly raise the disk until the white is just visible. Note the depth at which this occurs. Record the average of these twopoints.
3. Repeat this process yourself, or by another monitor. Record both transparency readings on the Field Data Sheet, thencalculate the average.
Inlet & Outlet Sample Collection:
1. At each designated inlet and outlet fill a large white bottle and a small brown bottle.
2. Label these bottles “______ Inlet”, or “______ Outlet”.
3. Be sure the water is flowing. Samples should not be taken from a stream that is stagnant. Be careful not to agitate thewater upstream from where the sample is to be obtained.
4. Rinse the white bottle using stream water and discard rinse water downstream from sample location.
5. Collect sample by dipping the white bottle under the surface, being careful not to disturb the bottom.
6. Fill the small brown bottle to the neck with water from the white bottle. Do not rinse the small brown bottles.
7. Dip the white bottle again to refill.
Complete the Field Data Sheet (observations, stream flow, etc.). Store samples in a cooler with ice and transport to ConcordDES Laboratory within 24 hours. Be sure the samples arrive in time to be analyzed that day (before 2:00 PM).
APPENDIX D: WATER QUALITY DATA SPREADSHEETS