Managing Suburban Growth in China’s Metropolitan...
35
1 0. intro slide Managing Suburban Growth in China’s Metropolitan Regions: Trends and Options Edward Leman, President, Chreod Group Inc. Fourth World Bank Urban Research Symposium Washington, D.C. 16 May 2007
Transcript of Managing Suburban Growth in China’s Metropolitan...

1
0. intro slide
Managing Suburban Growth in China’s Metropolitan Regions:
Trends and Options
Edward Leman,President, Chreod Group Inc.
Fourth World Bank Urban Research SymposiumWashington, D.C.
16 May 2007

2
Outline
1.Context1. China’s Metropolitan Regions2. Shanghai as Case Study
2.Research Issue + Methodologies3. Key (interim) Findings
1. Drivers of suburbanization in China2. Emerging Outcomes3. Institutional Causes
4.Consequences5.Further Analytical and Policy Work

3
1. Context – national urbanization trends
0
100,000
200,000
300,000
400,000
500,000
600,000
700,000
800,000
900,000
1,000,000
1950 1955 1960 1965 1970 1975 1980 1985 1990 1995 2000 2005 2010 2015 2020 2025 2030
urba
n po
pula
tion
(thou
sand
s)
China India United States of America BrazilIndonesia Pakistan Nigeria MexicoRussian Federation Japan Philippines BangladeshIran (Islamic Republic of) Germany Turkey United KingdomEgypt Dem. Rep. of the Congo France Colombia
China
India
USA
Brazil
Indonesia
from 1975 - 2010, China's urbanpopulation will have grown by 281 %
168 %
60 %
153 %
388 %
0
10
20
30
40
50
60
70
80
90
100
1950 1955 1960 1965 1970 1975 1980 1985 1990 1995 2000 2005 2010 2015 2020 2025 2030
urba
n as
per
cen
t of t
otal
pop
ulat
ion
China India Indonesia Brazil USA
Brazil
USA
Indonesia
China
India
United States
United Kingdom
Russian Federation
Korea, Rep.
Japan
India
Germany France
China
Canada
Burundi
Brazil
0
5,000
10,000
15,000
20,000
25,000
30,000
35,000
40,000
45,000
0 10 20 30 40 50 60 70 80 90 100urban pop (% of total)
GD
P pe
r cap
ita, U
S $
PPP,
cur
rent
by 2030?

4
1. Context – Yangtze Delta Megalopolis

5
1. Context – Largest Metropolitan Regions in 2015
0.0
5.0
10.0
15.0
20.0
25.0
30.0
35.0
40.0
1950 1955 1960 1965 1970 1975 1980 1985 1990 1995 2000 2005 2010 2015
popu
latio
n (m
illio
ns)
Shanghai Tokyo Mexico City New York-Newark Mumbai Delhi Buenos Aires Sao Paolo
Tokyo: 36.2
Mumbai: 22.6Shanghai: 21.3Delhi: 20.9Mexico: 20.6Sao Paolo: 20New York: 19.7
Buenos Aires:14.6

6
1. Context – Shanghai’s Existing Metropolitan Structure

7
Shanghai MR Population Densities, 2000 (inh/km2)
0
5,000
10,000
15,000
20,000
25,000
30,000
35,000
40,000
45,000
50,000
80 77 74 71 68 65 62 59 56 53 50 47 44 41 38 35 32 29 26 23 20 17 14 11 8 5 2 1 4 7 10 13 16 19 22 25 28 31 34 37 40 43 46 49 52 55 58 61 64 67 70 73 76 79
kilometers
resi
dent
s/km
2
People's Square
JiadingChuansha
Huinan
Taicang
Kunshan
Outer Ring RoadOuter Ring Road
KUNSHANCORRIDOR
TAICANG CLUSTER
JIADING CORRIDOR
CHUANSHA CLUSTER
SOUTHEASTERN CORRIDOR

8
Guangzhou MR Population Densities, 2000 (inh/km2)
0
5,000
10,000
15,000
20,000
25,000
30,000
35,000
40,000
45,000
50,000
80 77 74 71 68 65 62 59 56 53 50 47 44 41 38 35 32 29 26 23 20 17 14 11 8 5 2 1 4 7 10 13 16 19 22 25 28 31 34 37 40 43 46 49 52 55 58 61 64 67 70 73 76 79
kilometers
resi
dent
s/km
2
Guangzhou
Inner Ring Road
ShundeCity
Ronggui T.
Xiaolan T.
JiangmenCity
ConghuaCity
Inner Ring Road

9
Tokyo MR Population Densities, 2000 (inh/km2)
0
5,000
10,000
15,000
20,000
25,000
30,000
35,000
40,000
45,000
50,000
80 77 74 71 68 65 62 59 56 53 50 47 44 41 38 35 32 29 26 23 20 17 14 11 8 5 2 1 4 7 10 13 16 19 22 25 28 31 34 37 40 43 46 49 52 55 58 61 64 67 70 73 76 79
kilometers
resi
dent
s/km
2
Hatogaya Saitama
Hiratsuka
Fujisawa Minami Kohuku
Setagaya
Adachi
Gyoda
Kumagaya

10
London MR Population Densities, 1999 (inh/km2)
0
5,000
10,000
15,000
20,000
25,000
30,000
35,000
40,000
45,000
50,000
80 77 74 71 68 65 62 59 56 53 50 47 44 41 38 35 32 29 26 23 20 17 14 11 8 5 2 1 4 7 10 13 16 19 22 25 28 31 34 37 40 43 46 49 52 55 58 61 64 67 70 73 76 79
kilometers
resi
dent
s/km
2
ReadingRichmond
Upon Thames
NewhamKensington
Tower
Basildon
Southend-on-Sea

11
New York MR Population Densities, 1999 (inh/km2)
0
5,000
10,000
15,000
20,000
25,000
30,000
35,000
40,000
45,000
50,000
80 77 74 71 68 65 62 59 56 53 50 47 44 41 38 35 32 29 26 23 20 17 14 11 8 5 2 1 4 7 10 13 16 19 22 25 28 31 34 37 40 43 46 49 52 55 58 61 64 67 70 73 76 79
kilometers
resi
dent
s/km
2
NorwalkStamford
NewBrunswick Elizabeth
Manhattan

12
Toronto MR Population Densities, 2000 (inh/km2)
0
5,000
10,000
15,000
20,000
25,000
30,000
35,000
40,000
45,000
50,000
80 77 74 71 68 65 62 59 56 53 50 47 44 41 38 35 32 29 26 23 20 17 14 11 8 5 2 1 4 7 10 13 16 19 22 25 28 31 34 37 40 43 46 49 52 55 58 61 64 67 70 73 76 79
kilometers
resi
dent
s/km
2
Toronto
Hamilton
Burlington Oakville
Mississauga
OshawaPickering

13
2. Research Issue + Methodologies
Patterns of both structured and unstructured suburbanization are constraining the emergence of potential agglomeration benefits across China’s metropolitan regions.
• Not a systematic program of research (yet).• Analytic work on consulting projects in 9 MRs in China
for World Bank: investment projects and AAA• GIS-based spatial analysis of demographic and
economic trends• Satellite image-based, change analysis of builtup land• Fiscal and institutional assessments * Caveat: big danger in making generalizations in China
given huge regional differences

14
2. Research Issue + Methodologies
Maximizing potential agglomerationbenefits requires:
1. (almost) sufficient serviced land and building stock to affordably meet locational, quantitative, and qualitative demands of all households (including the poor and near-poor)
2. transport systems to affordably, safely, and predictably meet household and worker demands for accessibility to services and places of work
3. infrastructure services to affordably, safely, and predictably meet quantitative and qualitative demands of households and firms for power, communication, water, sanitation where needed
4. affordable options to facilitate the proximate location of firms, service providers, and innovation partners
5. least-effort (time and cost), safe, and predictable accessibility to firms’ supply and output markets, and to innovation partners
6. minimum of agglomeration diseconomies

15
3. Findings: Patterns of Suburbanization

16
Intensity of Land Use Change, 1987-2002

17
Emergence of Suburban Corridors and Clusters

18
Growing at Varying Speeds
Chuansha Cluster
Zhoupu Cluster
Duhang Corridor
Baoshan Corridor
Luodian CorridorJiading CorridorAnting Corridor
Qingpu Corridor
Minhang Cluster
Songjiang Corridor
Southeastern Corridor
Nanqiao Corridor
Jinshanwei Cluster
Chongming Corridor
Kunshan Corridor
Taicang Cluster
R2 = 0.5616
0
50
100
150
200
250
300
350
400
0 10 20 30 40 50 60growth in urban land (km2), 1988-2002
per c
ent c
hang
e in
urb
an la
nd u
se, 1
988-
2002

19
3. Findings - Key Drivers of Suburbanization
Key Drivers of Suburbanization:1. Economic restructuring:
• Shift of manufacturing to suburbs• Strong growth in consumer and producer services in
high-density core area• Global trade hub function for central China and
Yangze Basin2. In-migration: 5 million migrants in Shanghai 3. Land Values:
• Price incentives for enterprises• Forced industrial and residential relocations• Housing inflation in core areas• Subsidization of suburban industrial land
4. Physical Accessibility Improvements (for firms, not households)5. Competition for investment among governments: municipal and
district; between districts

20
3. Key Drivers of Suburbanization – economic restructuring
0
10
20
30
40
50
60
70
80
47 45 43 41 39 37 35 33 31 29 27 25 23 21 19 17 15 13 11 9 7 5 3 1 1 3 5 7 9 11 13 15 17 19 21 23 25 27 29 31 33 35 37 39 41 43 45 47 49 51 53 55 57 59 61 63 65 67 69 71 73
kilometers
per c
ent
within Outer Ring Road
People's SquareJiading Chuansha Huinan

21
3. Key Drivers of Suburbanization – inmigration
1,300,700 1,302,600
2,570,500
3,685,300
-
500,000
1,000,000
1,500,000
2,000,000
2,500,000
3,000,000
3,500,000
4,000,000
2000 2003
9 urban districts suburban districts + county

22
3. Key Drivers - inmigration
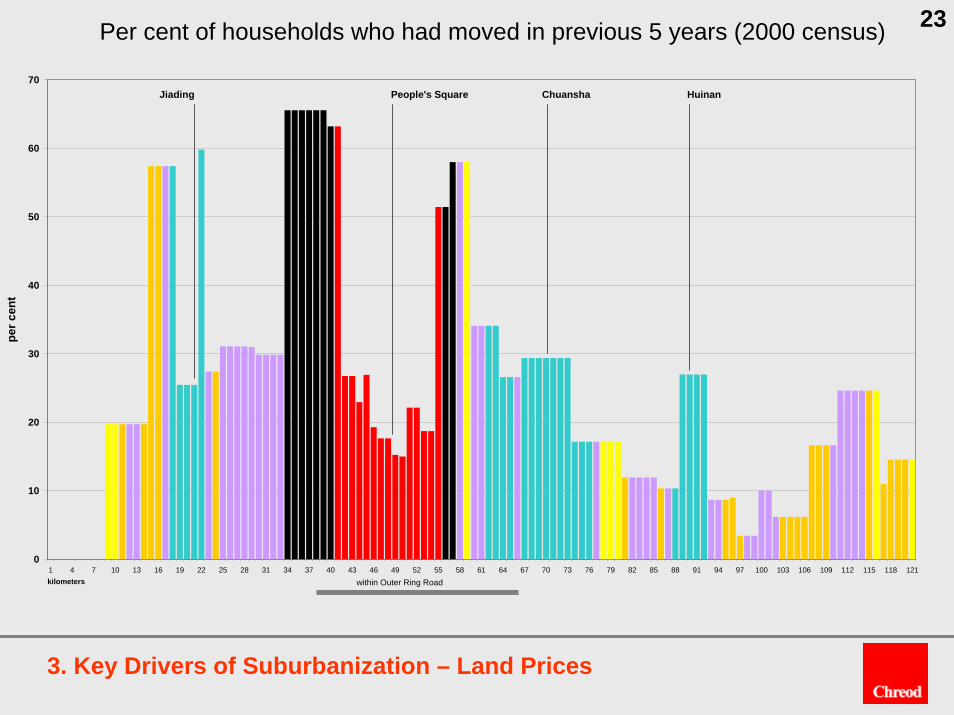
23
3. Key Drivers of Suburbanization – Land Prices
0
10
20
30
40
50
60
70
1 4 7 10 13 16 19 22 25 28 31 34 37 40 43 46 49 52 55 58 61 64 67 70 73 76 79 82 85 88 91 94 97 100 103 106 109 112 115 118 121kilometers
per c
ent
within Outer Ring Road
People's SquareJiading Chuansha Huinan
Per cent of households who had moved in previous 5 years (2000 census)

24
3. Key Drivers of Suburbanization – Land Prices [apartment sale prices]
5000/m2
15000/m2 40000/m2
7500/m2

25
3. Drivers: Physical Accessibility Improvements (for firms)

26
3. Drivers: Physical Accessibility Improvements (for firms)

27
3. Drivers: Physical Accessibility Improvements (for firms)

28
3. Drivers: Physical Accessibility Improvements (for firms)

29
3. Key Drivers – competition for investment among governments

30
4. Policy Consequences – emerging outcomes
Emerging Outcomes:1. Over-consumption of agricultural land2. Shortage of serviced land to required standards in
demand locations3. Growing core-area -- and inner suburban – traffic
congestion, increasing transactions costs 4. Misalignment between metropolitan transport and
residential land use patterns increasing travel costs to households
5. Inaccessibility of suburban residents to metropolitan labour markets
6. Dissipation of pollution sources across the metropolitan region

31
4. Policy Consequences: Institutional Causes
Causes are Institutional:1. Mis-alignment of functional responsibilities, revenue
assignments, and expenditure responsibilities among municipal, district, and town governments
2. Perverse fiscal incentives: declining fiscal capacities of sub-municipal governments forces one-time sales of land use lease rights; no land-based recurring revenues
3. Subsidization and land conversion controls distort real estate markets
4. System of Property Rights mitigates economies of scale and constricts land supply
5. Planning processes cannot keep up with pace of change6. No explicit, codified mandates for metropolitan
management, including suburban areas

32
4. Causes – master plan and actual development

33
5. Analytic and Policy Priorities
Central challenge: how to get governments to better manage land, transport, infrastructure, and environmental protection across metropolitan regions, including through inter-jurisdictional cooperation?• Top-down, command and control not sustainable• Incentives needed:
• Career: performance appraisals…not sustainable
• Equity: ‘do good’…not likely• Effectiveness: ‘do more, better…save farms, save
the environment’…dubious• Efficiencies: ‘do it at less cost’…maybe
• …ECONOMIC RETURNS to governments: job creation, inward investment, fiscal returns from taxes on economic activity
34
5. Analytic and Policy Priorities…
DEMONSTRATING ECONOMIC RETURNS OF METROPOLITAN AGGLOMERATION:• How can we quantify improvements to agglomeration
benefits from better management of land, transport, infrastructure, and environmental protection across jurisdictions, including in suburban areas (ie. spatially disaggregated analysis)?
• How can we quantify returns to governments, including fiscal returns, of maximizing metropolitan agglomeration benefits across jurisdictions, including in suburban areas? (from abstract to concrete)?
• How can we communicate the above in terms that local stakeholders – especially governments – can easily and fully understand?
• Institutional modalities will follow; should not be the core focus.

35
ChreodSuite 200,111 Sparks Street.Ottawa, Ontario,CANADA K1P 5B5
Shanghai 200030, China
www.Chreod.com
Shanghai Representative Office1301Suite A , Building A
527 Huai Hai Zhong Road
Tel: (86-21) 5306-3477Fax: (86-21) 5306-1358