Managing India’s Air Quality Through an Eye in the Sky
26
Managing India’s Air Quality Through an Eye in the Sky 1 Managing India’s Air Quality Through an Eye in the Sky L. S. Kurinji and Tanushree Ganguly Issue Brief | January 2020
Transcript of Managing India’s Air Quality Through an Eye in the Sky

Managing India’s Air Quality Through an Eye in the Sky 1
Managing India’s Air Quality Through an Eye in the SkyL. S. Kurinji and Tanushree Ganguly
Issue Brief | January 2020
Centre forEnergy Finance

Managing India’s Air Quality Through an Eye in the Sky2
Image: iStock

L. S. Kurinji and Tanushree Ganguly
Issue BriefJanuary 2020
ceew.in
Managing India’s Air Quality Through an Eye in the Sky
Centre forEnergy Finance

Copyright © 2020 Council on Energy, Environment and Water (CEEW).
Open access. Some rights reserved. This report is licensed under the Creative Commons Attribution-Noncommercial 4.0. International (CC BY-NC 4.0) license. To view the full license, visit: www.creativecommons.org/licenses/ by-nc/4.0/legalcode.
Suggested Citation: Kurinji, S.L., and Tanushree Ganguly. 2020. Managing India’s Air Quality Through an Eye in the Sky. New Delhi: Council on Energy, Environment and Water.
Disclaimer: The views expressed in this report are those of the authors and do not necessarily reflect the views and policies of the Council onEnergy, Environment and Water. The views/analysis expressed in this report/document also do not necessarily reflect the views of Shakti Sustainable Energy Foundation. The Foundation also does not guarantee the accuracy of any data included in this publication nor does it accept any responsibility for the consequences of its use. The opinions expressed also do not necessarily reflect those of the supporters and funders, nor should they be attributed to them.
Cover image: iStock.
Peer reviewers: Dr Sarath Guttikunda, Director, Urbanemissions.info; Dr Sagnik Dey, Associate Professor, Centre for Atmospheric Sciences, Indian Institute of Technology, Delhi; Dr Balaji Kannan, Associate Professor, Department of Soil and Water Conservation Engineering, Tamil Nadu Agricultural University, Coimbatore; Tirtha Biswas and Neeraj Kuldeep, both Programme Leads at CEEW.
Publication team: Alina Sen (CEEW), Mihir Shah (CEEW), The Clean Copy, Aspire Design, and Friends Digital. Acknowledgments: The authors of this study would like to thank Bloomberg Philanthropies and Shakti Sustainable
Energy Foundation (SSEF) for their support to carry out this study. We would like to thank Dr Sarath Guttikunda, Dr Sagnik Dey, Dr Balaji Kannan, Tirtha Biswas, and Neeraj Kuldeep for their critical comments and feedback which helped them improve the report. We thank our colleagues at CEEW—Karthik Ganesan, Dr Hem Dholakia, and Mihir Shah—for their valuable inputs in the writing of the report. Finally, we would like to acknowledge the National Aeronautical and Space Administration (NASA) and the European Space Agency (ESA) for free use of their data shared in the public domain as per their information policy.
Organisations: The Council on Energy, Environment and Water (www.ceew.in) is one of South Asia’s leading not-for-profit policy research institutions. The Council uses data, integrated analysis, and strategic outreach to explain—and change—the use, reuse, and misuse of resources. It prides itself on the independence of its high-quality research, develops partnerships with public and private institutions, and engages with the wider public. In 2019, CEEW was once again featured across nine categories in the 2018 Global Go To Think Tank Index Report. CEEW has also been consistently ranked among the world’s top climate change think tanks. Follow us on Twitter @CEEWIndia for the latest updates.
Shakti Sustainable Energy Foundation seeks to facilitate India’s transition to a sustainable energy
future by aiding the design and implementation of policies in the following areas: clean power, energy efficiency, sustainable urban transport, climate change mitigation and clean energy finance.
Council on Energy, Environment and WaterSanskrit Bhawan A-10, Qutab Institutional Area,Aruna Asaf Ali Marg New Delhi – 110067, India

About CEEW
The Council on Energy, Environment and Water (CEEW) is one of South Asia’s leading not-for-profit policy research institutions. The Council uses data, integrated analysis, and strategic outreach to explain – and change – the use, reuse, and misuse of resources. The Council addresses pressing global challenges through an integrated and internationally focused approach. It prides itself on the independence of its high-quality research; develops partnerships with public and private institutions; and engages with the wider public.
In 2020, CEEW once again featured extensively across nine categories in the 2019 Global Go To Think Tank Index Report, including being ranked as South Asia’s top think tank (15th globally) with an annual operating budget of less than USD 5 million for the seventh year in a row. CEEW has also been ranked as South Asia’s top energy and resource policy think tank in these rankings for the second year running. Further, it has consistently featured among the world’s best managed and independent think tanks. In 2013, 2014 and 2016 CEEW was ranked among the world’s 20 best climate think tanks.
In over nine years of operations, The Council has engaged in over 230 research projects, published over 160 peer-reviewed books, policy reports and papers, advised governments around the world nearly 530 times, promoted bilateral and multilateral initiatives between governments on 80 occasions, and organised nearly 300 seminars and conferences. In July 2019, the CEEW Centre for Energy Finance was launched by H.E. Mr Dharmendra Pradhan and H.E. Dr Fatih Birol.
The Council’s major completed projects and contributions include the 584-page National Water Resources Framework Study for India’s 12th Five Year Plan; the first independent evaluation of the National Solar Mission; India’s first report on global governance, submitted to the National Security Adviser; irrigation reform for Bihar; the birth of the Clean Energy Access Network; policy briefs submitted to the PMO on accelerated targets for renewables, power sector reforms, environmental clearances, Swachh Bharat; pathbreaking work for the Paris Agreement, the HFC deal, the aviation emissions agreement, and international climate technology cooperation; developing the strategy for and supporting activities related to the International Solar Alliance (ISA); designing the Common Risk Mitigation Mechanism (CRMM); critical minerals crucial for Make in India; modelling 222 scenarios for India’s low-carbon pathways; India’s largest multidimensional energy access survey (ACCESS); climate geoengineering governance; circular economy of water and waste; and the flagship event, Energy Horizons.
The Council’s current research focus includes launching a go-to-market programme to promote decentralised renewable energy-powered livelihood appliances; examining country-wide residential energy consumption patterns; raising consumer awareness and engagement on power issues; piloting business models for solar rooftop adoption; developing a renewable energy project performance dashboard; green hydrogen for industry decarbonisation; state-level modelling for energy and climate policy; reallocating water for growth; creating a democratic demand for clean air; raising consumer awareness on best AC servicing practices; and supporting India’s electric vehicle ambitions.
The Council has a footprint in 19 Indian states, working extensively with state governments and grassroots NGOs. Our key ongoing research and engagements at the state-level include supporting power sector reforms in Uttar Pradesh and Tamil Nadu, scaling up solar-powered irrigation in Chhattisgarh, supporting climate action plans in Gujarat and Madhya Pradesh, evaluating community-based natural farming in Andhra Pradesh, examining crop residue burning in Punjab, and promoting solar rooftops in Delhi and Bihar.
The Council’s Board is currently chaired by Mr Jamshyd Godrej. Some of our other illustrious board members include Mr Tarun Das, Dr Anil Kakodkar, Mr S. Ramadorai, Mr Montek Singh Ahluwalia and Dr Naushad Forbes. The nearly 80-member strong executive team is led by Dr Arunabha Ghosh.


v
Kurinji [email protected]
Kurinji is a Research Analyst at CEEW. At The Council, her research revolves around air pollution studying crop residue burning using technologies like remote sensing in northern India, and addressing the regulatory challenges in the implementation of mitigation measures. She holds a bachelor’s degree in Energy and Environmental Engineering from Tamil Nadu Agricultural University, Coimbatore. She is an Indian Green Building Council (IGBC) Accredited Professional.
“Much of the satellite observations on pollution over the Indian landmass comes from overseas satellites that are temporally inconsistent. As satellites enable us to get a wider view of pollution, it is time for India to consider having a geostationary satellite to keep a constant watch.”
Tanushree [email protected]
Tanushree Ganguly is a Programme Associate at CEEW. Her work focuses on assessing the potential of alternative methods of monitoring air quality, and understanding and addressing current regulatory challenges for the effective implementation of clean air policies. She has a master’s degree in Environmental Engineering from Georgia Institute of Technology and is a certified Engineer-in-training under California law.
“Fires, dust storms, aerosols – satellites see it all. The air quality management framework in India would remain incomplete without the integration of satellite-based observations.”
The authors

Managing India’s Air Quality Through an Eye in the Skyvi
Image: iStock

Managing India’s Air Quality Through an Eye in the Sky vii
Contents
Abstract 1
1. Introduction 1
2. Atmospheric products from satellites 2
3. Satellite applications in air quality management: the Indian context 3■ Forest Fire Alerts System 4■ Monitoring agricultural fires 4■ Estimating the health burden due to air pollution 5
4. India’s proposed plan for the application of satellites in air quality management 6
5. Primary challenges in using satellite measurements 8■ Technical and computational capabilities 8■ Data interpretation and validation 9
6. Driving policies: what is needed? 10■ Build capacities for the potential use of satellite data on air quality 10■ Satellite data–based inspection trigger mechanism 10■ Identification of emission hotspots to drive local area interventions 10■ Envision launching a geostationary satellite to specifically monitor air quality 10
■ Make indigenous satellite–derived products easily accessible for public use 10
7. Conclusion 10
References 12
Annexure 14

Abbreviations
AOD aerosol optical depthCAAQMS Continuous Ambient Air Quality Monitoring SystemCPCB Central Pollution Control BoardCALIPSO Cloud-Aerosol Lidar and Infrared Pathfinder Satellite ObservationsCEEW Council on Energy, Environment and WaterCEMS Continuous Emission Monitoring SystemCREAMS Consortium for Research on Agroecosystem Monitoring and Modelling from SpaceDPCC Delhi Pollution Control CommitteeESA European Space AgencyFAST Forest Fire Alerts SystemFIRMS Fire Information for Resource Management SystemFSI Forest Survey of IndiaGEE Google Earth EngineHCHO formaldehydeIITM Indian Institute of Tropical MeteorologyINSAT Indian National Satellite System ISRO Indian Space Research OrganisationMoEFCC Ministry of Environment, Forest and Climate ChangeMoES Ministry of Earth SciencesMOPITT Measurements Of Pollution In The TroposphereMODIS Moderate Resolution Imaging SpectroradiometerNASA National Aeronautics and Space AdministrationNCAP National Clean Air ProgrammeNCTPS North Chennai Thermal Power StationNO2 nitrogen dioxideNOAA National Oceanic and Atmospheric AdministrationO3 ozoneOMI Ozone Monitoring Instrument PM particulate matterSAC Space Applications CentreSPCB State Pollution Control BoardVCD vertical column density VIIRS Visible Infrared Imaging Radiometer SuiteUSA United States of AmericaUS EPA United States Environmental Protection Agency SO2 sulphur dioxide

Managing India’s Air Quality Through an Eye in the Sky 1
AbstractToxic air has emerged as a high-mortality environmental risk resulting in over 4.2 million deaths annually (WHO 2016). The indiscriminate use of dirty fuels for power generation and transportation, in combination with unscientific combustion practices, have led to dangerous levels of air pollution. Effective air quality management calls for identifying polluting sources, estimating the relative contributions of these sources, setting pollution reduction targets, designing cost-effective pollution control strategies, and constantly monitoring the implementation progress of these strategies.
The National Clean Air Programme (NCAP)—launched by the Ministry of Environment, Forest and Climate Change (MoEFCC) in January 2019 has stipulated a target of 20-30 per cent reduction in particulate matter (PM) concentration by 2024. The NCAP sets out an air pollution mitigation strategy for the country and acknowledges the need for extensive monitoring infrastructure which would integrate both ground-based and satellite observations. The heavy infrastructural investment required to set up Continuous Ambient Air Quality Stations (CAAQMS) will hinder the scaling up of the number of CAAQMS in the country. In the absence of adequate ground monitoring facilities, effective utilisation of satellite data would help in tracking air quality.
Applications of satellite data can be put to uses that go beyond just complementing ground monitoring. This brief examines how satellite observations are currently aiding air quality management in India and identifies possible applications of satellite data to enhance the process. Possible applications include identifying airsheds, demonstrating episodic pollution, and carrying out inspections of consistently non-compliant sources.
The brief identifies challenges associated with the utilisation of satellite data, the most important being the lack of technical capacity to accurately interpret satellite observations in order to derive insights. The lack of adequate infrastructure to store and process such large volumes of data is also a major bottleneck in scaling up the utilisation of satellite data. Also, all insights drawn from satellite observations need to be evaluated and appropriately validated with ground information to ensure that they are accurate and suitable for the purpose.
Finally, the brief recommends that India should envision launching its own satellite mission to monitor air quality. National space agencies must ensure that the remotely captured information is made easily accessible to the public through online platforms. The MoEFCC should design and conduct training programmes to develop and upgrade the necessary skill-set among air quality practitioners, both regulators and researchers in the country.
1. IntroductionDue to recent technological advances and their versatility, satellite observations have found several applications in environmental monitoring. Satellites provide visual evidence of every major environmental occurrence, including rapidly changing land use and land cover patterns (Alam, Bhat, and Maheen 2019), settlement patterns, the acute water crisis in Chennai (Radhakrishnan 2019), and the massive forest fires in the Amazon (Lai, Lu, and Migliozzi 2019).
Globally, atmospheric scientists have started using satellite data to derive valuable findings on air pollution. This ranges from analysing long-term trends in particulate matter (PM) concentration (Chowdhury et al. 2019) to tracking pollutant plumes from large industrial units. Particulate concentrations derived from satellite-measured aerosol optical depth (AOD) readings find application in global health studies that estimate the mortality and morbidity burden attributable to air pollution (Donkelaar et al. 2010); (Balakrishnan et al. 2018). Scientists from National Aeronautics and Space Administration (NASA) have used information collected by the Ozone Monitoring Instrument (OMI) aboard the NASA Aura satellite to develop bottom-up SO2 emission inventories and estimate the long-term sulphur dioxide (SO2) emission trends from large anthropogenic sources across the globe (Fioletov et al. 2015; Zheng et al. 2018).
Regulatory agencies in countries like China and the USA have also identified ways to employ satellite measurements in air quality forecasting, thereby aiding the process of air quality management and enabling accurate early warnings. The National Oceanic and Atmospheric Administration (NOAA), in partnership with the United States Environmental Protection Agency (US EPA), issues daily air quality forecast guidance. These forecasts incorporate AOD observations made by Moderate Resolution Imaging Spectroradiometers (MODIS) Aqua and Terra satellites. Indeed, since the incorporation of satellite data in 2018, the accuracy of forecasts has improved by approximately 38 per cent (Poteet 2019).
Possible applications of satellite monitoring include identifying airsheds, demonstrating episodic pollution, and carrying out inspections of consistently non-compliant sources.

Managing India’s Air Quality Through an Eye in the Sky2
Need for satellite monitoring
Studies have shown that India’s monitoring network has a density of ~0.14 monitors/million persons (one monitor for every 6.8 million people), which is well below that of other highly populated countries, as shown in Table 1.
Table 1: Density of air quality monitoring networks across different countries
Country Air quality monitoring network density
(no. of monitors/million persons)
India 0.14
China 1.2
USA 3.4
Japan 0.5
Brazil 1.8
Most European countries
2–3
Source: Brauer, Michael, Sarath K. Guttikunda, K A Nishad, Sagnik Dey, Sachchida N. Tripathi, Crystal Weagle, and Randall V. Martin. 2019. “Examination of monitoring approaches for ambient air pollution: A case study for India.” Atmospheric Environment.
As of September 2019, the Central Pollution Control Board (CPCB) operates 779 manual and 200 Continuous Ambient Air Quality Monitoring Systems (CAAQMS) in India; most of these stations are located in urban areas (CPCB 2019). The National Clean Air Programme (NCAP), launched by the Indian Government in January 2019, plans to increase the coverage to 1,500 manual systems and add 150 CAAQMS by 2024 (MoEFCC 2019). However, even with this proposed increase, the number of monitoring stations would still be inadequate. More than 4,000 monitoring stations (2,800 in urban areas and 1,200 in rural areas, as per a 2011 census) are required to spatially, temporally, and statistically represent the PM2.5 (particulate matter) pollution in urban and rural areas in India as per the thumb rule proposed by the CPCB, which computes the required number of monitoring stations on the basis of the population of an area (Brauer et al. 2019).
While manual monitoring stations under the National Ambient Monitoring Programme generate two observations per week, CAAQMS generate more instantaneous data. Given the higher frequency of data generation, installing CAAQMS would aid in the constant surveillance of air quality. However, CAAQMS require heavy capital investment, to the tune of
approximately INR 1.5 crore each (Brauer et al. 2019), and they have limited spatial coverage. The wide spatial coverage of satellite remote sensing can help to fill the data gaps that exist due to the vast geography; it would also give clear information on the spatial distribution of air pollution across the country. Satellite monitoring can also help in understanding the columnar profile of the pollutant and its possible long-range transport, which is not feasible with traditional ground monitoring.
While the academic and research community in India has been using satellite measurements of atmospheric products to develop insights on India’s air pollution crisis, regulatory agencies are yet to identify and tap the potential of remote sensing use for air quality management. The fact that NCAP recognises the need to augment India’s air quality monitoring network with satellite monitoring is definitely a step in the right direction. However, applications of satellite data should not just be confined to using satellite-based measurements to augment the monitoring network and to aid air quality forecasting. Satellite data could be used as an effective tool to monitor episodic pollution, estimate emissions from large point sources, and understand the contribution of outside sources to local air pollution. This brief identifies these potential applications of remote sensing.
2. Atmospheric products from satellites
Satellite data can primarily be used to complement air quality monitoring and support air quality forecasting. Monitoring refers to the measurement of parameters like AOD and gaseous columnar volume densities, which are then translated into particulate concentration (Chowdhury et al. 2019) and gaseous emissions, respectively. Monitoring products can be used to estimate long-term trends in pollutant concentrations and to derive the emission inventories of major pollution sources in a region.
Air quality forecasting predicts the concentration of pollutants, which involves combining satellite-derived measurements; meteorological parameters like relative humidity, wind speed, and height of the planetary
The wide spatial coverage of satellite remote sensing can help to fill the data gaps that exist due to the vast geography.
Managing India’s Air Quality Through an Eye in the Sky 3
boundary layer; external contributions from dust storms and forest and crop fires; and land use parameters into a chemical transport model. A chemical transport model uses emissions and meteorological parameters as inputs, simulates the physical processes and chemical transformations occurring in the atmosphere, and generates estimates of pollutant concentrations. Table 2 itemises the atmospheric products related to pollution monitoring from satellites that are currently active. It is worth noting that most satellite data listed as being used to draw inferences on India’s air quality come from satellites that were not launched in the country.
Table 2: List of pollution monitoring products provided by satellites
Domain Data product Time period Satellite Space agencies
Data source
Air quality Aerosol optical depth
2014–present INSAT 3D ISRO (Mishra, Rastogi, and Chauhan 2014)
2002–present MODIS Aqua NASA (Giovanni 2019)
2000–present MODIS Terra NASA (Giovanni 2019)
UV aerosol optical depth
2004–present Aura OMI NASA (Giovanni 2019)
UV aerosol index 2004–present Aura OMI NASA (Giovanni 2019)
2018–present Sentinel 5P ESA (ESA Sentinel online 2019)
Aerosol layer height 2006–present CALIPSO NASA (NASA 2019)
2019–present Sentinel 5P ESA (ESA Sentinel online 2019)
Aerosol profile 2006–present CALIPSO NASA (NASA 2019)
Carbon monoxide total column
2019–present Sentinel 5P ESA (ESA Sentinel online 2019)
2000–present MOPITT NASA (Giovanni 2019)
Carbon monoxide vertical profile
2000–present MOPITT NASA (Giovanni 2019)
Nitrogen dioxide total column
2018–present Sentinel 5P ESA (ESA Sentinel online 2019)
2006–present Aura OMI NASA (Giovanni 2019)
Sulphur dioxide total column
2018–present Sentinel 5P ESA (ESA Sentinel online 2019)
2006–present Aura OMI NASA (Giovanni 2019)
Formaldehyde total column
2007–present Aura OMI NASA (Giovanni 2019)
Formaldehyde total column
2018–present Sentinel 5P ESA (ESA Sentinel online 2019)
Ozone tropospheric column
2019–present Sentinel 5P ESA (ESA Sentinel online 2019)
Ozone tropospheric profile
2019–present Sentinel 5P ESA (ESA Sentinel online 2019)
Open fires, such as
forest fires and biomass
burning
Thermal anomalies and fire
2002–present MODIS Aqua NASA (Earth Data 2019)
2000–present MODIS Terra NASA (Earth Data 2019)
2012–present SNPP-VIIRS NASA/NOAA
(Earth Data 2019)
Source: Authors’ compilationNote: The list considers products only from satellites that are currently active.
3. Satellite application in air quality management: the Indian context
As mentioned earlier, satellite observations have found application in monitoring and measuring pollution and polluting activities across the globe. At a small scale, regulatory agencies in India have started making note of possible applications of satellite data in pollution monitoring.
Managing India’s Air Quality Through an Eye in the Sky4
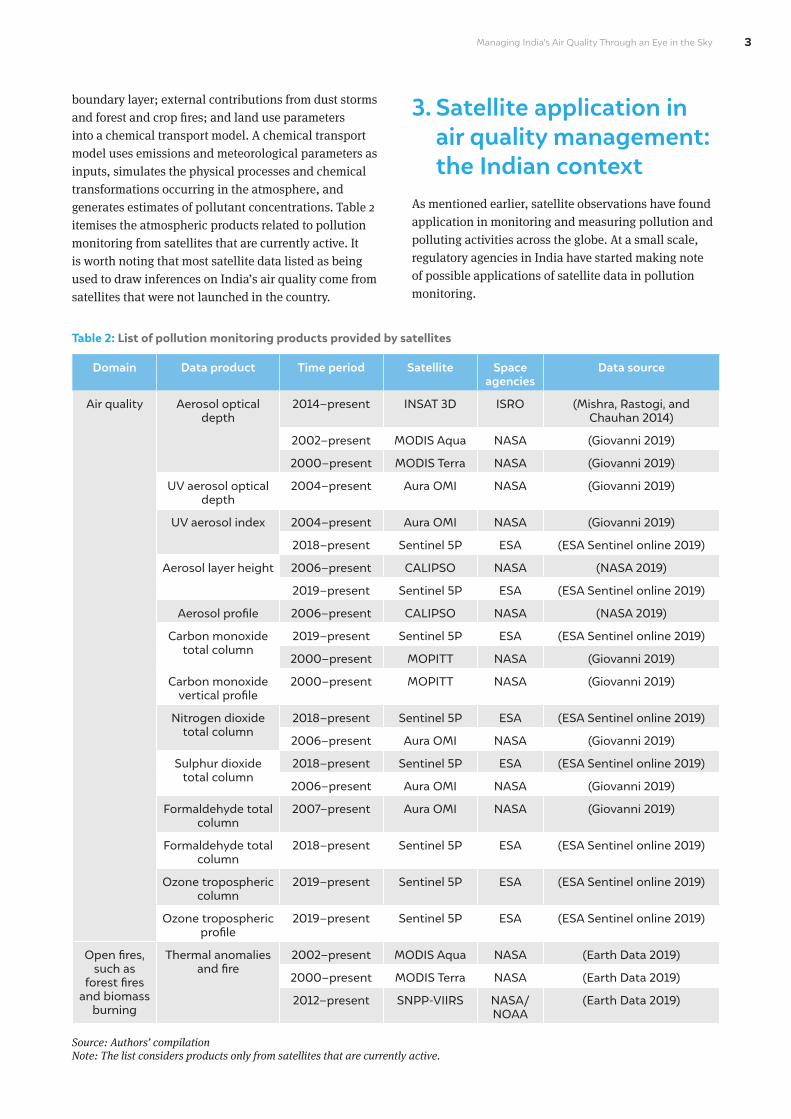
Forest Fire Alerts System
Forests in India are vulnerable to forest fire outbreaks, especially during the summer. Forest fires cause great damage to biodiversity and emit a large amount of carbon monoxide, carbon dioxide, and black carbon. The Forest Survey of India (FSI), under MoEFCC, has been tracking forest fire episodes using satellite data since 2004.
The Fire Alerts System (FAST) launched by FSI tracks forest fire events on a near real-time basis using MODIS and SNPP–VIIRS satellite data, and generates timely fire alerts that are sent to the respective nodal officers (FSI 2019). These timely fire alerts help forest officials seek assistance with suppressing and mitigating forest fires; this could potentially reduce the damage caused by large forest fires. FAST has an improved feedback system to enable nodal officers to provide feedback on aspects such as the causes for fires and the extent of the area affected. Continuously tracking these fire events could offer deeper insights into the pattern, intensity, and duration of forest fires in a given area; this information can then be used to devise working plans.
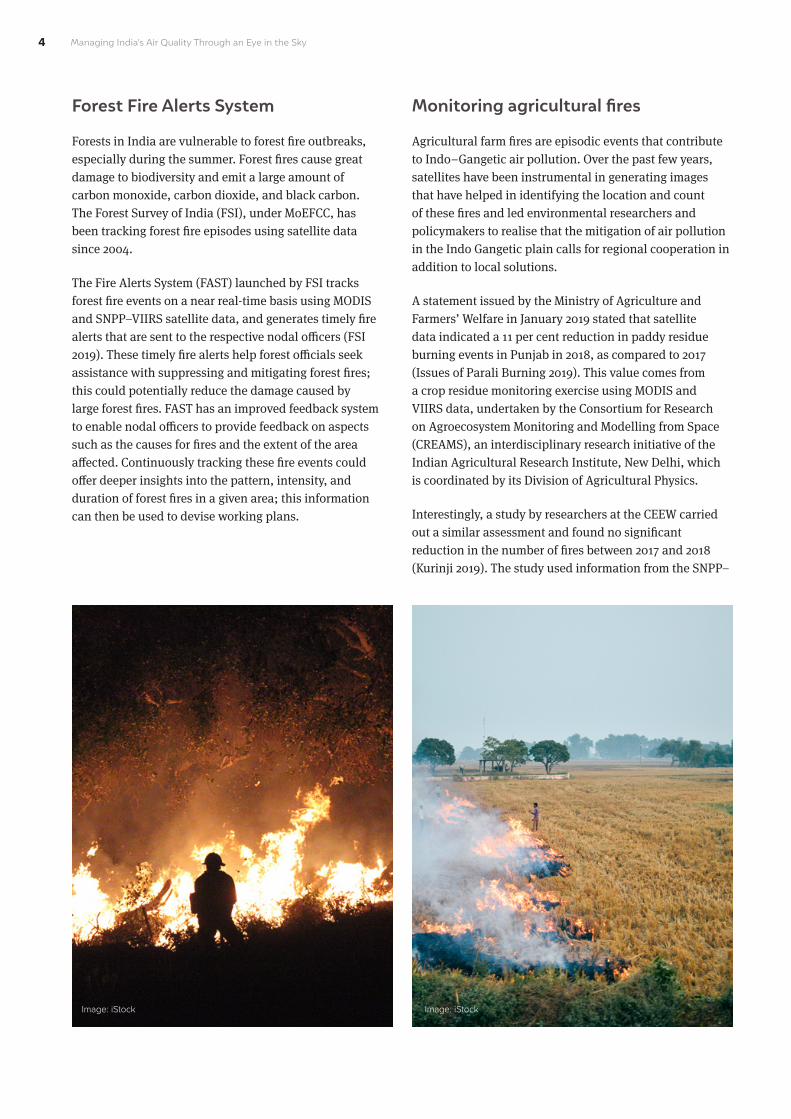
Monitoring agricultural fires
Agricultural farm fires are episodic events that contribute to Indo–Gangetic air pollution. Over the past few years, satellites have been instrumental in generating images that have helped in identifying the location and count of these fires and led environmental researchers and policymakers to realise that the mitigation of air pollution in the Indo Gangetic plain calls for regional cooperation in addition to local solutions.
A statement issued by the Ministry of Agriculture and Farmers’ Welfare in January 2019 stated that satellite data indicated a 11 per cent reduction in paddy residue burning events in Punjab in 2018, as compared to 2017 (Issues of Parali Burning 2019). This value comes from a crop residue monitoring exercise using MODIS and VIIRS data, undertaken by the Consortium for Research on Agroecosystem Monitoring and Modelling from Space (CREAMS), an interdisciplinary research initiative of the Indian Agricultural Research Institute, New Delhi, which is coordinated by its Division of Agricultural Physics.
Interestingly, a study by researchers at the CEEW carried out a similar assessment and found no significant reduction in the number of fires between 2017 and 2018 (Kurinji 2019). The study used information from the SNPP–
Image: iStock Image: iStock

Managing India’s Air Quality Through an Eye in the Sky 5
VIIRS satellite, maintained by the Fire Information for Resource Management System (FIRMS). Figure 1 illustrates the historical trends in open fires detected by VIIRS during the paddy and wheat residue burning season in Punjab between 2012 and 2018—the data are from the study.
The incongruency between the findings of the two studies could stem from difficulties in determining the right data set and a suitable methodology that accurately represents ground realities. There are multiple satellites that collect the same data—fire counts, in this case—albeit with different spatial resolutions. Despite the varying results, in the absence of remote surveillance, it would be difficult to assess the impact of policy interventions on crop residue burning; ground monitoring is limited in most parts of the country and satellites have a much wider coverage area and can provide spatially continuous data. Additionally, satellite images help in identifying regions where government-supported initiatives have succeeded and where they have failed. In other words, using these data, the government could strategise region-specific approaches and track the progress systematically and transparently.
Estimating the health burden due to air pollution
It is pertinent to study the impact of air pollution on health as India has disproportionately high mortality and disease burdens due to air pollution. To inform and initiate action at the sub-national level in India, scientists through the Global Burden of Disease India Study estimated the population’s exposure to air pollution and its impact on mortality, disease burden, and life expectancy in every state in India in 2017. The PM2.5 exposure estimates used in the study use satellite-derived aerosol optical depth and chemical transport models to compute district-level particulate concentrations (Balakrishnan et al. 2018). The study found that the annual population-weighted mean exposure to ambient PM2.5 in India was 89.9 μg/m³ in 2017, and that 76.8 per cent of the Indian population was exposed to an annual population-weighted mean PM2.5 greater than the National Ambient Air Quality Standards of 40 μg/m³. With limited ground monitoring, which is mostly concentrated in urban areas, determining particulate exposure concentrations at such a granular spatial resolution would have been impossible without satellite data.
Figure 1: No significant reduction in the number of open fires in Punjab in 2018 as compared to 2017
Source: L.S. Kurinji, 2019. Alternative Methods to Monitor Air Pollution: A Study of Crop Residue Burning in Punjab. New Delhi: Council on Energy, Environment and Water. Accessed September 15, 2019.
0
20,000
40,000
60,000
80,000
1,00,000
Open fires observed during wheat residue burning season (Apr-May)
Open fires observed during paddy residue burning season (Oct-Nov)
2012 2013 2014 2015 2016 2017 2018
Num
ber
of o
pen
fire
s

Managing India’s Air Quality Through an Eye in the Sky6
4. India’s proposed plan for the applications of satellites in air quality management
The NCAP intends to incorporate satellite data into both air quality monitoring and forecasting. Table 3 lists the planned action points for satellite application and the corresponding timelines.
Table 3: Planned applications of satellite data as listed under NCAP
Domain Action point Agencies involved
Timeline
Monitoring of crop residue burning
Coordination with ISRO for a regular availability of remote sensing monitoring data for crop residue burning by the farmers
MoEFCC, CPCB
2019
Air quality monitoring network
Capacities will be strengthened to develop indigenous satellite-based products and techniques for estimating particulate and gaseous concentration.
CPCB, state pollution control boards (SP-CBs), Space Application Centre (SAC), ISRO
2024
Air quality forecasting system
Satellite data available through the satellite network of ISRO to be integrated for monitoring and forecasting
Indian Institute of Tropical Meteorol-ogy (IITM), Pune, un-der MoES, CPCB
2022
Source: MoEFCC. 2019. “National Clean Air Programme.” Ministry of Environment, Forest & CLimate Change, Government of India. Accessed September 15, 2019.
It is noteworthy that the plan proposes strengthening capacities to develop indigenous satellite-based products and techniques to derive useful air quality information. It also states that the required algorithms to correlate AOD values with ground-level PM concentrations over the Indian regions would be derived from an indigenous database. However, currently, the only indigenously developed satellite product available is AOD from the INSAT 3D satellite. Unlike other satellites like Sentinel 5P and MODIS that specifically monitor air quality, the INSAT 3D/3DR Imager was launched to enhance the country’s capabilities in weather forecasting and disaster warning systems (PTI
2013). Therefore, this system has certain limitations when it comes to AOD estimation. Generally, the contrast between aerosols and the surface can only be well detected in the 0.412 µm band, as aerosol signals tend to be brighter than the Earth’s surface at that wavelength (Chen, Howl, and Sidel 2019). But, INSAT 3D measures aerosol signals at a wavelength channels – Visible (0.55 – 0.75 µm), Thermal infrared - 1 (10.2 – 11.3 µm), and Thermal infrared - 2 (11.5 – 12.5 µm), in which case the aerosol signals may not get captured entirely.
The current indigenous AOD retrieval algorithm, which uses measurements from a wavelength of 650 nm, has an uncertainty of ±30–45 per cent (Mishra 2018). With this high degree of uncertainty present in the current AOD product , there is a higher chance of this uncertainty getting translated into the quantification of PM2.5 and PM10 derived from AOD.
The NCAP also proposes exploring other satellite products for retrieving information on gaseous products. While there is at least one indigenous satellite measuring AOD, as of now, there exists no indigenously developed satellite-based products to measure gaseous pollutants such as sulphur dioxide (SO2) and nitrogen dioxide (NO2).
In order to overcome the aforementioned issues and achieve the NCAP objectives, India must consider launching a geostationary satellite that would specifically measure atmospheric properties. As geostationary satellites give out information every 15–30 minutes, they are better suited to study temporal variations in particulates and mesoscale atmospheric phenomena like dust transport. They can also help to keep a check on emissions from various anthropogenic sources like thermal power plants.
How could satellite data be used?
CEEW’s recent review of the online pollution monitoring portals (see Table A1 in the Annexure) of SPCBs revealed that only 8 out of the 29 SPCBs and Delhi Pollution Control Committee (DPCC) in the country have made Continuous Emissions Monitoring Systems (CEMS) data publicly available as of September 2019. Directions on installation of CEMS devices in the 17 categories of highly polluting industries were first issued by the CPCB in February 2014. This was done to regulate compliance by industries with minimal inspection and to bring discipline in the industries to exercise self-monitoring and compliance. Data reported by CEMS help in tracking the quantum of emissions being released by an industrial unit and the unit’s compliance with emission standards.

Managing India’s Air Quality Through an Eye in the Sky 7
However, experts are highly sceptical about the use of CEMS data as there is a high possibility of data and equipment being manipulated (Aggarwal 2018).
The government can use satellite data to independently verify the credibility of measurements reported by CEMS and other on-ground audits. For example, while evaluating the impact of China’s stringent SO2 emission standards by comparing data reported by CEMS with satellite measures, experts spotted a very low correspondence between SO2 emissions reported by the power plants and by independent satellite measures after the announcement of stringent emission standards. They then questioned the reliability of the CEMS data, which is susceptible to manipulation (Karplus, Zhang, and Almond 2018). Applications like these can help in monitoring industries’ interference with CEMS data—from incomplete reporting to the manipulation of sensors. The existing legal framework does not consider data from alternate monitoring systems such as low-cost sensors and satellites as permissible evidence. But
sudden variations in satellite observations, if identified during regular monitoring and found to correspond with the location of large industries or power plants, could initiate an inspection.
Regional and continental air circulation patterns frequently carry pollution from one area to another. Experts have used satellite data to communicate that emissions from crop residue burning regions and industries spread in all directions and are often carried to the cities present downwind through long-range transport mechanisms, depending upon meteorological conditions, thus making them non-attainment cities (Sarkar, Singh, and Chauhan 2018). In such cases, mitigation measures focussed only on cities and not on emissions from the nearby regions may not have a considerable impact on air quality. The government can use satellite data to identify the air shed covering all the air pollution sources that influence a city’s air quality and can devise regional air quality management strategies to mitigate the impact of air pollution drift.
Satellite data can also be used as evidence to demonstrate the negative impact on air quality caused by exceptional events like forest fires and dust storms, as the impact of these cannot be captured by traditional ground monitoring systems. In early October 2017, regulatory monitors in Delhi measured a sudden upsurge in pollution levels, which triggered an
Sudden variations in satellite observations, if identified during regular monitoring and found to correspond with the location of large industries or power plants, could initiate an inspection.
Image: Authors’ compilation

Managing India’s Air Quality Through an Eye in the Sky8
emergency warning in Delhi. Experts then investigated the mechanisms leading to this severe event using satellite data and identified the cause as long-range transport of dust emerging from Gulf countries (Beig et al. 2019). Another study used MODIS data to explain that a major fire incident had taken place in the northern Himalayas in Uttarakhand in April 2016, which had a significant impact on air quality in neighbouring areas such as Delhi (Singh 2016). Applications like these help in understanding the impact of exceptional events on air quality, which may or may not be reasonably controlled. It can also lead to the devising of preventable actions like increasing vegetation cover to reduce the impact of dust storms (UNEP, WMO, and UNCCD 2016).
5. Primary challenges in using satellite measurements
Notwithstanding the dearth of geostationary satellites that provide near-continuous coverage of the Indian landmass, the lack of technical skills and computation capabilities needed to translate satellite observations into ground measurements of pollutants is one of the primary impediments in scaling up the application of remote sensing in air quality management. This section
highlights the challenges associated with applications of satellite data.
Technical and computational capabilities
With the increase in the availability of satellite-derived atmospheric products as a result of more satellite launches, assessing the storage and computational capability to store and process the available data becomes pertinent. For instance, the Copernicus Sentinel-5P satellite launched by the European Space Agency (ESA) in October 2017 alone currently produces 1,096 Gbits of data volume per day, which is equivalent to 84,118 photos of 1.5 MB average size (ESA 2013; ESA 2015). The Sentinel-5P helps in mapping a multitude of air pollutants like NO2, SO2, O3, CO, and HCHO and in identifying emission hotspots around the globe. Traditional storage and computing methods are inadequate for the quick processing of such large volumes of data from earth-orbiting satellites.
Fortunately, with tools like Google Earth Engine (GEE) and other cloud computing platforms (remote servers accessed via Internet connection) to manage and process data, handling and interpreting data from these sources is made much easier. They enable non-
Figure 2(a): Copernicus Sentinel5P SO2 VCD data illustrates the SO2 emission hotspots in India
Figure 2(b): Copernicus Sentinel5P Tropospheric NO2 VCD data illustrates the NO2 emission hotspots in India
Source: Authors’ analysis
0 11 23 35 48 59Total vertical column density of sulphur dioxide [x1015 molecules / cm2]
0 1 4 8 12 16 22Tropospheric vertical column density of nitrogen dioxide [x1015 molecules / cm2]

Managing India’s Air Quality Through an Eye in the Sky 9
traditional users and non-experts to access and make use of satellite data using intuitive scripting languages and also help visualise the results.
Using GEE, we processed and visualised SO2 and NO2 vertical column density (VCD) data from Copernicus Sentinel 5P over the Indian subcontinent, which are shown in Figures 2(a) and 2(b), respectively. The SO2 and NO2 emission hotspots in the country in most cases coincide with the location of power-generating units and vehicle-congested cities, respectively, and are clearly visible in the visualisation generated. One can then go on to attribute the high levels of these pollutants to these sources. However, this is where the use of satellite monitoring enters a murky space. While it can be helpful to point out a dominant source, it cannot differentiate it from other small sources without the help of atmospheric models.
Data interpretation and validation
The major challenge associated with using satellite measurements to draw inferences on air quality is arriving at the right method to translate the satellite data, i.e., converting AOD into ground particulate concentrations or columnar volume densities into emissions. Given the inadequacy of ground monitoring data in our country, the results obtained by the translation process will have large uncertainties.
For instance, a recently released study (Dahiya and Myllyvirta 2019) used the SO2 source emission catalogue put out by NASA Global Sulfur Dioxide Monitoring to rank SO2 emission hotspots across the globe. The SO2 source emission catalogue lists the annual SO2 emission from large anthropogenic sources across the globe (NASA 2019). Some media outlets used the ranking to infer that Chennai was the most polluted Indian megacity in 2018, with 215 kilotons (kt) of SO2 emissions (Chatterjee 2019). We reviewed the emission figures listed in NASA’s SO2 emission catalogue and found that the entire 215 kilotons of SO2 has been attributed to the North Chennai Thermal Power station (NCTPS). Given that the catalogue reports SO2 emissions at a unit level, it would be erroneous to attribute the emissions stemming from a plant to an entire city.
The SO2 database uses information from the Ozone Monitoring Instrument (OMI) sensor aboard the NASA Aura satellite, which has a coarse spatial resolution of 13 * 24 km (NASA 2012). Unfortunately, the sensor does not have the sensitivity to detect small or area sources. Hence, the catalogue attributes all the emissions
observed from OMI within a defined area to the single large point source within that area.
Ideally, emissions from power plants can be measured directly at the stack level. According to Tamil Nadu Pollution Control Board’s online pollution monitoring platform, the SO2 emissions from the NCTPS are well within limits. But a compliant power plant could still be generating significantly high emissions. In order to compute emissions from the NCTPS, we have used a crude methodology that takes into account the plant’s annual coal consumption and the sulphur content of coal, which has been assumed to be 0.5 per cent (Guttikunda and Jawahar 2014).
Table 4: Annual estimated and reported SO2 emissions for NCTPS in 2018
North Chennai Thermal Power station (NCTPS)
Generation capacity 1,830 MW*
Coal requirement for 2018–2019 8,472,000 tonnes**
Sulphur content in Indian coal 0.5 per cent
Estimated annual emission in 2018 82.6 kt
Annual emission reported in NASA OMI SO2 catalogue
215 kt
Difference between the estimated and the reported SO2 emission
132.4 kt
Source: Authors’ analysis
* List of thermal power plants and their capacities accessed from Lok Sabha reply to unstarred question on pollution emanating from thermal power plants (Lok Sabha Unstarred Question No. 532 2018)
** Coal requirement accessed from Rajya Sabha reply to unstarred question on pollution emanating from thermal power plants (Rajya Sabha Starred Question No. 201 2019)
While NASA’s OMI SO2 catalogue puts the emission figures at 215 kt for 2018, authors’ estimated emissions are significantly lower and stand at 82.6 kt (as seen in Table 4). As explained earlier, this significant difference could potentially stem from the fact that the sensor does not have the sensitivity to detect small area sources and attributes all the emissions observed within a defined area to the single large point source.
The above inconsistency in emission estimates reinforces the fact that in the absence of ground-based measurements, satellite observations remain vulnerable to erroneous interpretations. Thus, the best way to

Managing India’s Air Quality Through an Eye in the Sky10
utilise satellite data would be to integrate it with ground monitoring and chemical transport models (Brauer et al. 2019).
6. Driving policies: what is needed?
The brief provides insights on the scope of use of satellite data for air quality applications that can serve key stakeholders, policymakers, and researchers. Based on these insights, this brief has the following recommendations.
Build capacities for the potential use of satellite data on air quality
India should focus on developing computational capacities and infrastructure facilities along with trained human resources (air quality modellers and atmospheric chemists) to generate meaningful insights from the monitored geospatial data. The technical capacity needed to integrate satellite data with air quality management and support policymakers to enable an early response system and put in place suitable mitigating or precautionary measures when pollution spikes should be imparted to air quality professionals working across pollution control boards in the country. Training programmes built around utilising existing satellite datasets should also be imparted to these air quality professionals.
Satellite data-based inspection trigger mechanism
As mentioned earlier, while CEMS data and manual stack measurements can be manipulated, satellite observations cannot be tampered with. Pollution control boards generally get alerts when emissions from an industrial unit as tracked by CEMS devices exceed emission standards. If manipulated with, CEMS devices may not send these alerts. Under such circumstances, tracking satellite imagery on a regular basis could help keeping track of exceedances and help detect the possible tampering of CEMS devices.
Identification of emission hotspots to drive local area interventions
Most regions in the country, both urban and rural, are not adequately equipped with ground monitoring stations. Given the limited number of monitoring
stations, a series of satellite images over a period of time could be used to identify pollution hotspots. Both pollution hotspots and the pollutants of concern can be identified by tracking satellite observations. This could help pollution control agencies design area- and pollutant-specific interventions.
Envision launching a geostationary satellite to specifically monitor air quality
India cannot solely rely on data made available by NASA and ESA from existing earth-orbiting satellites, as they are polar-orbiting and can only provide 1–2 observations per day for a given place. Deriving more representative inferences with lesser uncertainties would need more frequent observations. India should thus envision launching its own high-resolution geostationary satellite that focuses specifically on monitoring atmospheric parameters.
Make indigenous satellite-derived products easily accessible for public use
Remotely captured information should be made easily accessible for public use through online platforms to support various applications. Making the data freely accessible promotes innovation in its application, and allows academics and research communities to utilise it to its full potential. The functioning of India’s premiere (and only) space research organisation, ISRO, is supported by public financing. There is no reason why the data that these satellites gather (except for security-related matters) should not be made public.
7. ConclusionIndia’s ambitious target of reducing PM concentration by 20-30 per cent by 2024 calls for extensive monitoring infrastructure and an effective air pollution mitigation strategy for the country. There is a strong need for a whole range of innovative approaches that facilitate active monitoring and inspection mechanisms to identify what the pollutants are and where, why, and how they should be managed. The setting up of CAAQMS requires heavy infrastructural investment, which is a barrier to scaling up ground monitoring in the country. With frugal budgets and a tight schedule for achieving the air quality improvement target, there is a
Managing India’s Air Quality Through an Eye in the Sky 11
pressing need to effectively utilise satellite data to help track air quality.
We have evaluated the potential for remote sensing in air quality management. Remote sensing can augment ground monitoring and air quality forecasting, which mirrors findings from earlier studies both at global and national levels. However, satellite observations should not be limited to just supplementing ground monitoring. They can be used to identify airsheds, demonstrate episodic pollution, and inspect consistently non-compliant sources.
These potential applications, however, come with associated challenges. The foremost being the lack of technical capacity to accurately interpret satellite observations to derive meaningful insights. There are a limited number of researchers who are able to link satellite-based observations with modelled estimates, which is important to fill gaps and to add value to satellite observations. Without this, the credibility of satellite data often lies on shaky ground. A smaller but still significant challenge lies in acquiring and processing the data that is produced by satellites. India should target the aforementioned challenges with concerted efforts involving credible international and institutional collaborations.
As Indian cities and rural areas experience high pollution for most of the year, continuous data providing useful insights and leading to focussed efforts
are needed. This would support regulatory agencies and policymakers and encourage prompt responses. India cannot solely rely on data made available by overseas agencies like NASA and ESA from existing earth-orbiting satellites as they are temporally limited; it needs to have its own mechanism in place to operate independently. India should thus envision launching satellites dedicated to monitoring air quality. More importantly, the relevant space agency must ensure that the information so captured is made freely accessible to the wider public and must allow the scientific and research communities to innovate and find new use cases for the data.
While the introduction of satellite applications in air quality management is gaining momentum in India, a systematic framework integrating both scientific institutions and regulatory agencies to actively incorporate the insights derived into the mitigation measures is the need of the hour.
The Ministry of Environment, Forest and Climate Change, CPCB, and space agencies should design and conduct specialised training programmes to develop and upgrade the necessary skill sets among environmental professionals in pollution control boards.

Managing India’s Air Quality Through an Eye in the Sky12
References
Aggarwal, Mayank. 2018. CPCB Pushes for Broader Adoption of Emissions Monitoring Systems. September 11. Accessed September 26, 2019. https://india.mongabay.com/2018/09/cpcb-pushes-for-broader-adoption-of-emissions-monitoring-systems/.
Alam, Akhtar, M. Sultan Bhat, and Maheen. 2019. “Using Landsat Satellite data for Assessing the Land Use and Land Cover Change in Kashmir Valley.” GeoJournal 1-15. Accessed September 14, 2019. https://link.springer.com/article/10.1007/s10708-019-10037-x.
Balakrishnan, Kalpana, Sagnik Dey, Tarun Gupta, R Dhaliwal, Michael Brauer, Aaron Cohen, Jeffrey Stanaway, et al. 2018. The Impact of Air Pollution on Deaths, Disease Burden, and Life Expectancy Across the States of India: The Global Burden of Disease Study 2017.” The Lancet. Accessed September 15, 2019. https://www.thelancet.com/action/showPdf?pii=S2542-5196%2818%2930261-4.
Beig, Gufran, Reka Srinivas, Neha S Parkhi, G.R. Carmichael, Siddhartha Singh, Saroj K. Sahu, Aditi Rathod, and Sujit Maji. 2019. “Anatomy of the Winter 2017 Air Quality Emergency in Delhi.” Science of the Total Environment 305-311. Accessed September 26, 2019. doi: 10.1016/j.scitotenv.2019.04.347.
Brauer, Michael, Sarath K. Guttikunda, K A Nishad, Sagnik Dey, Sachchida N. Tripathi, Crystal Weagle, and Randall V. Martin. 2019. “Examination of Monitoring Approaches for Ambient Air Pollution: A Case Study for India.” Atmospheric Environment. Accessed September 26, 2019. https://www.sciencedirect.com/science/article/pii/S1352231019305795?via%3Dihub.
Chatterjee, Badri . 2019. “Mumbai was the Second Largest Emitter of SO2 in 2018: Study.” Hindustan Times. August 20. Accessed September 15, 2019. https://www.hindustantimes.com/mumbai-news/mumbai-was-the-second-largest-emitter-of-so2-in-2018-study/story-TrW9GVqPvPLRsCYNV7IHcJ.html.
Chen, A, B Howl, and A Sidel. 2019. How Aerosols Are Measured: The Science of Deep Blue. May. Accessed September 15, 2019. https://deepblue.gsfc.nasa.gov/science.
Chowdhury, Sourangsu, Sagnik Dey, Larry Di Girolamo, Kirk R Smith, Ajay Pillarisett, and Alexei Lyapustin. 2019. “Tracking Ambient PM2.5 build-up in Delhi National Capital Region during the dry season over 15 years using a High-resolution (1 km) Satellite Aerosol Dataset.” Atmospheric Environment 142 - 150. Accessed September 15, 2019. https://www.researchgate.net/profile/Sourangsu_Chowdhury/publication/331298482_Tracking_ambient_PM25_build-up_in_Delhi_National_Capital_Region_during_the_dry_season_over_15_years_using_a_
high-resolution_1_km_satellite_aerosol_dataset/links/5c7fc841299bf12.
CPCB. 2019. Central Control Room for Air Quality Management - All India. Central Pollution Control Board. Accessed October 16, 2019. https://app.cpcbccr.com/ccr/#/caaqm-dashboard-all/caaqm-landing.
Dahiya, Sunil, and Lauri Myllyvirta. 2019. “Global SO2 Emission Hotspot Database - Ranking the World’s Worst Sources of SO2 Pollution.” (Greenpeace Environment Trust). Accessed September 14, 2019. https://storage.googleapis.com/planet4-india-stateless/2019/08/204126d3-global-hotspot-and-emission-sources-for-so2_19th_august-2019.pdf.
Donkelaar, Aaron van, Randall V. Martin, Michael Brauer, Ralph Kahn, Robert Levy, and Carolyn, Villeneuve, Paul J. Verduzco. 2010. “Global Estimates of Ambient Fine Particulate Matter Concentrations from Satellite-Based Aerosol Optical Depth: Development and Application.” Environ Health Perspect. 847–855. Accessed October 10, 2019. https://www.ncbi.nlm.nih.gov/pmc/articles/PMC2898863/.
Earth Data. 2019. Fire Information for Resource Management System. Accessed September 15, 2019. https://earthdata.nasa.gov/earth-observation-data/near-real-time/firms.
ESA. 2013. Sentinel 5 Precursor. Accessed September 15, 2019. http://esamultimedia.esa.int/docs/S5-prec_Data_Sheet.pdf.
ESA. 2015. Sentinel 5 Precursor. Accessed September 15, 2019. https://sentinel.esa.int/documents/247904/1848259/Sentinel-5P_Data_Access_and_Products.
ESA Sentinel online. 2019. Accessed September 15, 2019. https://sentinel.esa.int/web/sentinel/technical-guides/sentinel-5p/products-algorithms.
Fioletov, V E, C A McLinden, N Krotkov, and C Li. 2015. “Lifetimes and Emissions of SO2 from Point Sources estimated from OMI.” Geophysical Research Letters 42 (6). Accessed September 17, 2019. https://agupubs.onlinelibrary.wiley.com/doi/full/10.1002/2015GL063148.
FSI. 2019. “FSI Forest Fire Alert System.” Forest Survey of India, Ministry of Environment, Forest & Climate Change, Government of India. Accessed September 2019. http://fsi.nic.in/uploads/documents/technical_information_series_vol1_no2.pdf.
Giovanni. 2019. Giovanni: The Bridge Between Data and Science. Accessed September 15, 2019. https://giovanni.gsfc.nasa.gov/giovanni/.
Guttikunda, Sarath K, and Puja Jawahar. 2014. “Atmospheric Emissions and Pollution from the Coal-fired Thermal Power Plants in India.” Atmospheric Environment 449 - 460. Accessed September 15, 2019. http://www.indiaairquality.info/

Managing India’s Air Quality Through an Eye in the Sky 13
wp-content/uploads/docs/2014-08-AE-Emissions-Health-Coal-PPs-India.pdf.
2019. Issues of Parali Burning. January 02. Accessed September 15, 2019. https://pib.gov.in/newsite/PrintRelease.aspx?relid=187102.
Karplus, Valerie Jean, Shuang Zhang, and Douglas V. Almond. 2018. “Quantifying Coal Power Plant responses to tighter SO2 Emissions Standards in China.” Accessed September 26, 2019. doi:10.1073/pnas.1800605115.
Kurinji, L S. 2019. “Alternative Methods to Monitor Air Pollution: A Study of Crop Residue Burning in Punjab.” (Council on Energy, Environment and Water (CEEW)). Accessed September 15, 2019. https://www.ceew.in/sites/default/files/CEEW-Pollution-Monitoring-Methods-Punjab-Issue-Brief-08Apr19.pdf.
Lai, K.K. Rebecca, Denise Lu, and Black Migliozzi. 2019. “What Satellite Imagery Tells Us About the Amazon Rain Forest Fires.” The New York Times. August 24. Accessed September 14, 2019. https://www.nytimes.com/interactive/2019/08/24/world/americas/amazon-rain-forest-fire-maps.html.
2018. “Lok Sabha Unstarred Question No. 532.” Ministry of Environment, Forest and Climate Change, Government of India. Accessed September 15, 2019. http://www.indiaenvironmentportal.org.in/files/file/Pollution%20Emanated%20from%20Thermal%20Power%20Plants.pdf.
Mishra, Manoj K. 2018. “Retrieval of Aerosol Optical Depth From INSAT-3D Imager Over Asian Landmass and Adjoining Ocean: Retrieval Uncertainty and Validation.” Advancing Earth and Space Science. Accessed September 26, 2019. https://agupubs.onlinelibrary.wiley.com/doi/abs/10.1029/2017J D028116%4010.1002/%28ISSN%292169-8996.EASTAIRCP.
Mishra, Manoj, Gunjan Rastogi, and Prakash Chauhan. 2014. “Operational Retriveal of Aerosol Optical Depth over Indian subcontinent and Indian Ocean using Insat-3D/Imager and Product Validation.” The International Archives of the Photogrammetry, Remote Sensing and Spatial Information Sciences. Accessed September 15, 2019. https://vedas.sac.gov.in/vstatic/AQ/aod_insat3d.pdf.
MoEFCC. 2019. “National Clean Air Programme.” Ministry of Environment, Forest & Climate Change, Government of India. Accessed September 15, 2019. http://cerca.iitd.ac.in/files/reports/NCAP%20Report%20Full.pdf.
NASA. 2019. Cloud-Aerosol Lidar and Infrared Pathfinder Satellite Observation. August 29. Accessed September 15, 2019. https://www-calipso.larc.nasa.gov/.
NASA. 2019. “Global Sulfur Dioxide Monitoring.” National Aeronautics and Space Administration. Accessed September 2019. https://so2.gsfc.nasa.gov/.
NASA. 2012. “Ozone Monitoring Instrument (OMI) Data User’s Guide.” Accessed September 2019. https://docserver.gesdisc.eosdis.nasa.gov/public/project/OMI/README.OMI_DUG.pdf.
Poteet, Lia. 2019. NASA Data Strengthens U.S. Air Quality Warnings. August 27. Accessed September 15, 2019. https://www.nasa.gov/feature/nasa-data-strengthens-us-air-quality-warnings.
PTI. 2013. “Weather Satellite INSAT-3D Launched Successfully.” The Hindu, July 26. Accessed September 26, 2019. https://www.thehindu.com/news/national/Weather-satellite-INSAT-3D-launched-successfully/article12025093.ece.
Radhakrishnan, Vignesh. 2019. Here’s How the Water In Chennai’s Reservoirs Has Shrunk Over The Years.” The Hindu. June 30. Accessed September 14, 2019. https://www.thehindu.com/sci-tech/energy-and-environment/the-shrinking-shape-of-water-heres-how-chennais-lakes-have-shrunk-over-the-years/article28233573.ece.
2019. “Rajya Sabha Starred Question No. 201.” Ministry of Power, Government of India. Accessed September 15, 2019. https://powermin.nic.in/sites/default/files/uploads/RS_01012019_Eng.pdf.
Sarkar, S, R P Singh, and A Chauhan. 2018. “Crop Residue Burning in Northern India: Increasing Threat to Greater India.” Advancing Earth and Space Sciences. Accessed September 26, 2019. https://agupubs.onlinelibrary.wiley.com/doi/abs/10.1029/2018JD028428.
Singh, Surya. 2016. “Implications of Forest Fires on Air Quality – A Perspective.” Bulletin of Environmental and Scientific Research. Accessed September 26, 2019. https://www.researchgate.net/publication/317357743_Implications_of_forest_fires_on_air_quality_-_a_perspective.
UNEP, WMO, and UNCCD. 2016. Global Assessment of Sand and Dust Storms. Nairobi: United Nations Environment Programme. Accessed September 26, 2019. http://uneplive.unep.org/redesign/media/docs/assessments/global_assessment_of_sand_and_dust_storms.pdf.
WHO. 2016. World Health Organization. April. Accessed October 16, 2019. https://www.who.int/airpollution/en/.
Zheng, Caiwang, Chuanfeng Zhao, Yanping Li, Xiaolin Wu, Kaiyang Zhang, and Jing Gao. 2018. “Spatial and Temporal Distribution of NO2 and SO2 in Inner Mongolia Urban Agglomeration obtained from Satellite Remote Sensing and Ground Observations.” Atmospheric Environment. Accessed September 15, 2019. https://authors.library.caltech.edu/87214/1/1-s2.0-S1352231018304126-main.pdf.

Managing India’s Air Quality Through an Eye in the Sky14
AnnexureTable A1: Details on the accessibility of the online pollution monitoring portals of SPCBs as of September, 2019
State Accessibility Link Comments
Andhra Pradesh
Yes http://aprtpms.ap.gov.in/dashboard.html Public access
Arunachal Pradesh
- - -
Assam No - -
Bihar No http://bpcbcems.nic.in/login Password protected
Chattigarh Yes http://enviscecb.org/Industry_list_CEMS_Stations.htm Public access
Delhi No https://www.dpcc.delhigovt.nic.in/waste_to_energy_and_ther-mal_power_plant.html
Password protected
Goa Yes http://gspcb.glensserver.com/GSPCB_ONLINE/index.html Public access
Gujarat No - -
Haryana Yes http://www.hspcbcems.nic.in/industry-public-view?industry_id=22 Public access
Himachal Pradesh
Yes http://hppcb.glensserver.com/public/ Couldn’t access website
Jammu & Kashmir
Yes http://jkspcb.glensweb.com/public/index.html Public access
Jharkhand Yes http://jsac.jharkhand.gov.in/pollution/ Public access
Karnataka Yes https://kspcb.gov.in/caaqm.html Couldn’t access website
Kerala No https://keralapcb.glensserver.com/public/ Couldn’t access website
Madhya Pradesh
Yes https://erc.mp.gov.in/SMSOpen/emission Hidden
Manipur No - -
Meghalaya Yes http://megspcb.glensserver.com/public/ Public access
Mizoram No - -
Nagaland No - -
Odisha No http://ospcbrtdas.com/ Password protected
Punjab No http://cpcbrtdms.nic.in/# Password protected
Rajasthan No http://environment.rajasthan.gov.in/content/environment/en/rajasthan-state-pollution-control-board.html#main
Tickr on home screen
Sikkim - -
Tamil Nadu Yes http://117.232.97.121/RealTime_tnpcb_cac/index.html Public access
Telangana Yes http://183.82.41.227:8080/enviroconnect/aqms Public access
Tripura No - -
Uttar Pradesh
No - -
Uttarakhand No - -
West Bengal Partial https://www.wbpcb.gov.in/cmsdata.php Limited access
Source: Authors’ compilation

Managing India’s Air Quality Through an Eye in the Sky
As of Sep 2019, the CPCB operates 200 Continuous Ambient Air Quality Monitoring Systems (CAAQMS) in India; most of these stations are located in urban areas (CPCB 2019). Installation of CAAQMS require heavy capital investment of approximately INR 1.5 crore each.
Image: CEEW/Milan JacobImages: CEEW/Milan Jacob

Managing India’s Air Quality Through an Eye in the Sky16
COUNCIL ON ENERGY, ENVIRONMENT AND WATER (CEEW)
Sanskrit Bhawan, A-10, Aruna Asaf Ali Marg Qutab Institutional Area New Delhi 110 067, India T: +91 11 4073 3300
[email protected] | ceew.in | @CEEWIndia