Managing Finance and Budgets Lecture 2 Financial Statements (1)
Upload
kory-pittsCategory
view
217download
0
Managing Finance and Budgets
Lecture 7
Investment Appraisal

Session 7 - Investment Appraisal
LEARNING OUTCOMES
Understand and choose relevant investment decision techniques to critically analyse situations typically found in SMEs and VCOs and to inform decision making.

Session 7 - Investment Appraisal
KEY CONCEPTS Purpose of Investment Appraisal Accounting Rate of Return Payback Discounted Cash Flow Internal Rate of Return Cost-benefit analysis

What is Investment?

Investment Decisions
In this lecture we look at how businesses make investments in new plant, machinery and other long-term assets.
Part of this will be to look at financial measures which can guide a manager in their decision-making
A further element will be the ways in which Capital Investment Projects can be monitored and controlled.

Investment Decisions - Example
A Hotel Group which has seen a downturn in its profitability has carried out market research that would suggest that turning one or more of its hotels into ‘theme hotels’ offering a ‘turn back the clock’ experience to particular age groups (e.g. the complete feel of being in the 1960’s or 1970’s –with décor, TV images, newspapers etc.) would have great appeal.
To convert one hotel (60 guests capacity) would cost £150,000. Annual maintenance would cost a further £5,000 p.a.
The Directors need to decide whether or not such an investment would be worthwhile. What factors should they take into consideration?

Investment Decisions - Example
The Directors would need to consider: The current level of profitability of the hotel The expected increase in occupancy (or possibly
decrease!) that would arise from the conversion The pricing structure for this ‘experience’; possibly guests
would be willing to pay more for this. Altogether we would need to look at the increase in profit
that could be expected over , say, a five year period. If this proved to be greater than the £175,000 (i.e. £150K +
£5K p.a.), then the direction would probably be to proceed. NB Given that there has been a downturn in profits, we might
proceed even if the expected increase in profits does not exceed £175,000

The Nature of Investment Decisions
Investment means sacrificing wealth (or consumption) now for promise of future returns
Time – this is an important feature of all investment decision-making, as we are outlaying now (cash or resources) something which will potentially give us benefits in the future.
Size of the Investment - Large Amounts of Resources are often involved; if the wrong decision is made, the effect could be catastrophic.
Irreversibility – Once the decision has been made to invest (for example in new premises), it is very difficult, without significant loss to reverse the decision.

Investment Appraisal (1)
Therefore, investments need to be carefully appraised because of their: potential impact on the organisation strategic importance comparative size of the expenditure difficulty of reversing them potential risk to the existence of the
organisation.
Investment Appraisal (2)
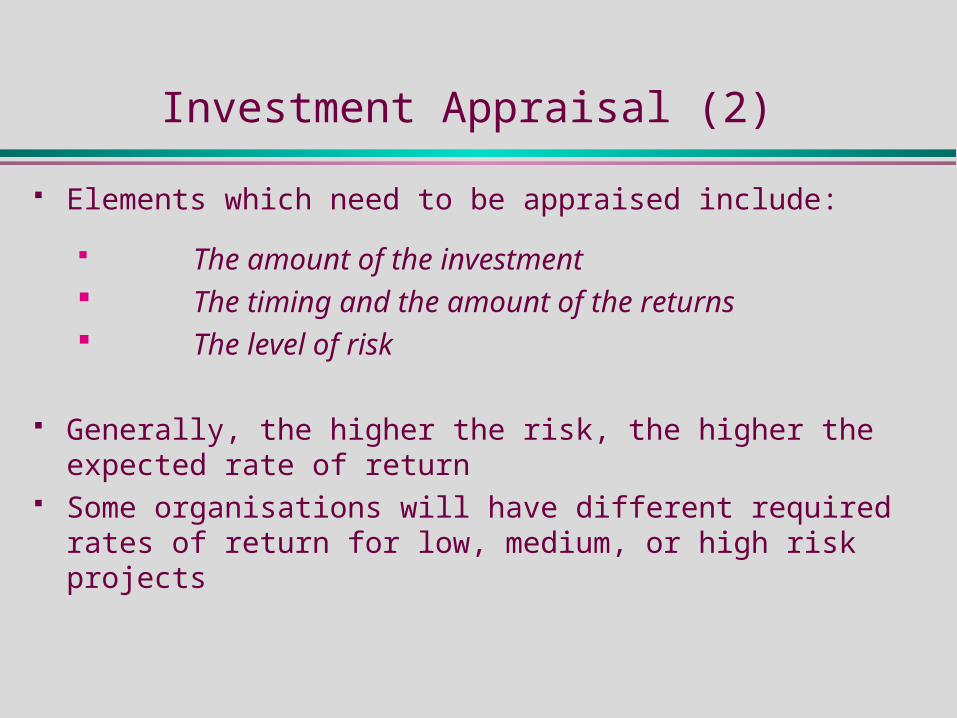
Elements which need to be appraised include:
The amount of the investment The timing and the amount of the returns The level of risk
Generally, the higher the risk, the higher the expected rate of return
Some organisations will have different required rates of return for low, medium, or high risk projects

Types of Investment
Replacement of existing facilities - relatively low risk Expansion of existing facilities - relatively low risk New project - higher risk because of unknowns Research & development - highly risk and uncertain Welfare projects - benefits difficult to measure

Investment Appraisal Tools

Investment Appraisal
Organisations use some or all of a range of tools to identify the nature of projects and their likely return:
Accounting rate of return (ARR)
Payback Period (PP)
Net present value (NPV)
Internal rate of return (IRR)
Accounting Rate of Return
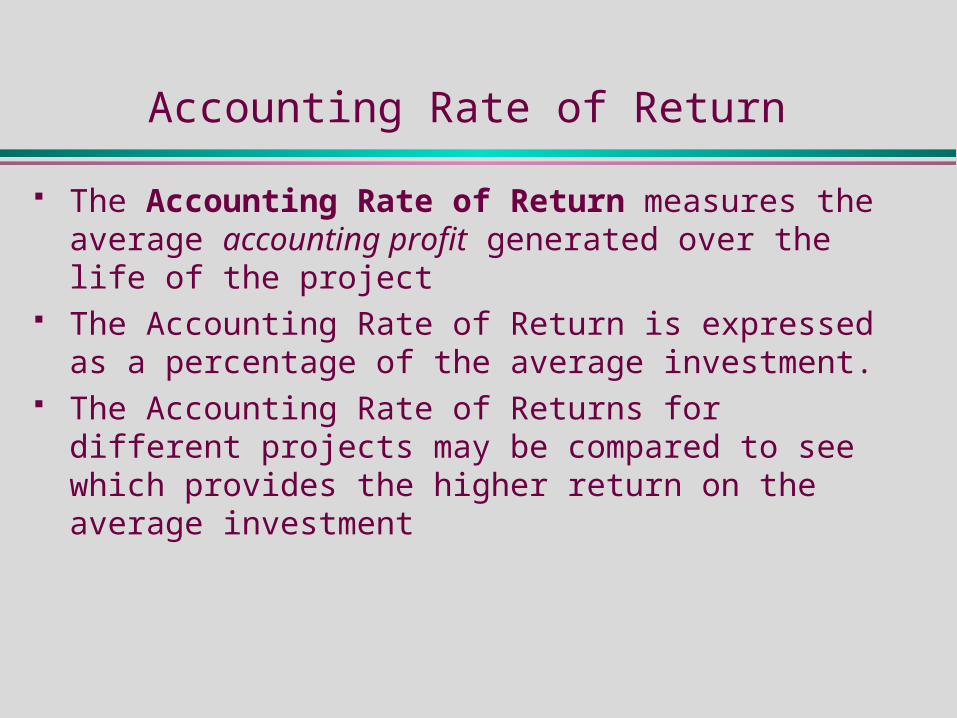
The Accounting Rate of Return measures the average accounting profit generated over the life of the project
The Accounting Rate of Return is expressed as a percentage of the average investment.
The Accounting Rate of Returns for different projects may be compared to see which provides the higher return on the average investment

Accounting Rate of Return (ARR)
The formula for ARR is:
Average Annual Profit x 100%
Average Investment to earn the Profit.
The Average Annual Profit will normally be :
(Total Profit – Total Depreciation) / Number of years
The Average Investment will normally be:
(Initial Cost + Disposal Value) / 2.

Accounting Rate of Return (ARR)
For example: A machine which was originally bought for £100, 000 is sold five years
later for £20, 000. Over the five years in the machine made profits before depreciation of: £20,000, £40,000, £60,000, £60,000 and £20,000.
Average Annual Profit = (Total profit – Total Depreciation)/ Years= [(20000+40000+60000+60000+20000) – (100000-20000)] / 5= £24,000
Average Investment = (Initial Investment + Disposal Value) / 2= (100000 + 20000) / 2 = £60000
ARR = 24000 x 100% = 40%60000
This means that the machine has produced 40% of its value (on average) during each of its five years
This means that the machine has produced 40% of its value (on average) during each of its five years

Accounting Rate of Return – Further Example
PROJECT ONE PROJECT TWOInvestment £300,000 £ 500,000
Cashflow Dep’n Net Profit Cashflow Dep’n Net ProfitYear 1: 90,000 60,000 30,000 120,000 100,000 20,000Year 2: 160,000 60,000 100,000 140,000 100,000 40,000Year 3: 120,000 60,000 60,000 160,000 100,000 60,000Year 4: 70,000 60,000 10,000 240,000 100,000 140,000Year 5: 70,000 60,000 10,000 320,000 100,000 220,000Totals: 510,000 300,000 210,000 980,000 500,000 480,000
ARR = Average profit/Average investment = (210,000/5)/ (300,000/2) = 28% (480,000/5)/(500,000)/2 = 38.4%
In this case, the depreciation has been included as part of the Net Profit calculation
In this case, the depreciation has been included as part of the Net Profit calculation

Accounting Rate of Return
It is simple to understand:
“What percentage profit has been generated on the item?” Parallels “Return on Capital Employed” calculation Produces a “%” return
BUT Ignores time factor Focuses on Accounting Profit - ignores cash-flow Does not distinguish between projects of different size

Payback Period (PP)
The Payback Period calculates how long before the investment is repaid
This is calculated by: Comparing initial investment to cash-flow Finding the year in which the total of cash received so
far exceeds investment. The proportion of year needed can be calculated as
follows:Balance outstanding at start of year
Cash received during the year

Payback Period –an Example
A machine which was originally bought for £100, 000 is sold five years later for £20, 000. Over the five years in the machine made profits before
depreciation of: £20,000, £40,000, £60,000, £60,000 and £20,000.
The total for the first three years = £120,000. This exceeds the original investment, so that the Payback period is between 2 and 3 years.
In fact for the third year:
Balance outstanding at start of year = 40000 = 2/3 (i.e 8 months)
Cash received during the year 60000
So the Payback Period is 2 years and 8 months.

Payback Period – Further Examples
PROJECT ONE PROJECT TWOInvestment £300,000 £ 500,000
Cashflow Dep’n Profit Cashflow Dep’n ProfitYear 1: 90,000 60,000 30,000 120,000 100,000 20,000Year 2: 160,000 60,000 100,000 140,000 100,000 40,000Year 3: 120,000 60,000 60,000 160,000 100,000 60,000Year 4: 70,000 60,000 10,000 240,000 100,000 140,000Year 5: 70,000 60,000 10,000 320,000 100,000 220,000Totals: 510,000 300,000 210,000 980,000 500,000 480,000
PAYBACK = 2 years + 50,000/120,000 = 3 years + 80,000/240,000 = 2 years and 5 months = 3 years and 4 months

Payback Period
Simple to understand Focuses on Cash-flow
BUT Ignores time factor Ignores what happens AFTER project has been paid back;
for example if a £500K machine produced increasing profits over its 5-year life of £100K, £200K, £300K, £400K and £500K, PP = 2 years 8 months, but the full cost of the machine is covered by the profits in the final year.
Does not distinguish between projects of different size

Activity One
A company is considering investing in either of two new machines which will help to increase its production. The first machine will cost £240,000, and the company estimates that it will have a working life of 5 years. The second machine will cost £360,000 and have a working life of 6 years. The net positive cash-flows as a result of cost savings from the new machine are shown below. Calculate the payback period and Accounting Rate of returns for each of the machines.
Machine 1: Net Cash-flows: £ 90,000/yr for first 3 years£ 50,000/yr for remaining 2 years
Machine 2: Net Cash-flows: £100,000 Year 1£110,000 Years 2 £120,000 Years 3 and 4£ 90,000 Years 5 and 6

Activity One –Solution Part 1
Machine 1:
Cost £240K Life 5 years
Net Cash-flows: £ 90K /yr for first 3 years
£ 50K /yr for remaining 2 years
ARR Average Profit = [ (3 x 90000) + (2 x 50000) - 240000 ] 5 = 26000
Average Investment = (240000 + 0) 5 = 48000
ARR = 26000/48000 = 54.2%
PPIn the first two years, Total Cash flow = £180000,
so the PP will occur sometime in year three
Proportion of year three = (240000-180000)/90000 = 8 months
PP = 2 years and 8 months

Activity One –Solution Part 2
Machine 2: Cost £360K Life 6 years Net Cash-flows: £100K, £110K, £120K, £120K, £90K, £90K
ARR Average Profit = [ (100000+110000+ 120000x2 +90000x2) - 360000 ]
6 = 45000Average Investment = (360000 + 0) 6 = 60000
ARR = 45000/60000 = 75%
PPIn the first three years, Total Cash flow = £330000,so the PP will occur sometime in year fourProportion of year four = (360000-330000)/120000 = 3 months
PP = 3 years and 3 months

Activity One -Summary
Machine 1: ARR = 54.2% PP = 2 years 8 months
Machine 2: ARR = 75% PP = 3 years 3 months
Analysis:
If we opt for the Machine 1, it will cost less, and we will recoup our initial expenditure 7 months sooner. However the second machine promises greater return on our investment in the long run.
Decision:
If the company can secure the finances (e.g. long term loan over 4 years ), then Machine 2 represents a much better investment. If finances are a problem, then we may have to settle for Machine 1.

The Value of Money (1)
The methods used so far have only taken into consideration the profits made and the cost incurred through depreciation
We have assumed that the future value of the money is equal to its present value.
However, this may not be true: If we invest £100K in a machine, we risk our money, we are losing interest on it (we could have put it in a
Building Society), through inflation £100K in a year’s time will buy less
than it can today.

The Value of Money (2)
Making some broad assumptions, we can put a figure to the losses that are incurred through the three elements of risk, loss of interest and inflation – for example 10% per year This is called the Discount Rate.
This allows us to calculate what the value of £1 would be in: 1 year’s time 90.1p 2 year’s time 82.6p 3 year’s time 75.1p 4 year’s time 68.3p
The formula for the calculation is:
Amount of Cash in Year N
(1 + rate)N
The formula for the calculation is:
Amount of Cash in Year N
(1 + rate)N

The Value of Money (2)
Making some broad assumptions, we can put a figure to the losses that are incurred through the three elements of risk, loss of interest and inflation – for example 10% per year This is called the Discount Rate.
This allows us to calculate what the value of £1 would be in: 1 year’s time 90.1p 2 year’s time 82.6p 3 year’s time 75.1p 4 year’s time 68.3p
Sample Calculation Details:
1.00 = 1.00 = 0.683
(1 + 0.10)4 1.461
Sample Calculation Details:
1.00 = 1.00 = 0.683
(1 + 0.10)4 1.461

Net Present Value (1)
This Method allows us to calculate the current value of the project’s returns at a given discount rate to allow for the time value of money, i.e. the fact that money received in several years’ time will actually be worth less than it is now.
These discount factors may be found in tables, or from spreadsheets, or by using the formula as in the the previous slide.

Net Present Value (2)
The calculation involves: The initial cost of the Project (negative cash flow) The values of the incoming Cash flows (positive) for the
project in each in each subsequent year at the discounted rate.
Example: Machine costs £900 -900.00Year 1 Cash-flow £500 (@ .901) 450.50Year 2 Cash-flow £500 (@ .826) 413.00Year 3 Cash-flow £500 (@ .751) 375.50
These discount rates (10% per annum) are taken from the previous calculation
These discount rates (10% per annum) are taken from the previous calculation

Net Present Value (3)
Example:
Machine costs £900 -900.00
Year 1 Cash-flow £500 (@ .901) 450.50
Year 2 Cash-flow £500 (@ .826) 413.00
Year 3 Cash-flow £500 (@ .751) 375.50
Without the discounting, we would claim that we recoup the cost (and more) in two years, as the machine costs £900 and our returns are £1000
Without the discounting, we would claim that we recoup the cost (and more) in two years, as the machine costs £900 and our returns are £1000
With the discounting, we can see that the actual value that we recoup in two years (discounted to present value) is only £863.50. This is less than the £900 paid out.
With the discounting, we can see that the actual value that we recoup in two years (discounted to present value) is only £863.50. This is less than the £900 paid out.

Net Present Value (4)
The figures are totalled for: The initial cost (negative) The discounted values of the subsequent Cash- flows (positive) This gives the Net Present Value
If the Net Present Value (NPV) is positive at a particular discount rate (e.g.) then it means the project will return more than that rate
If the NPV is negative then it will return less than that rate An organisation may choose a rate equivalent to its required
return or equivalent to its Weighted Average Cost of Capital (WACC)

Net Present Value - Examples
PROJECT ONE PROJECT TWO Discount Discount Cashflow Factor DCF Cashflow Factor DCF
Inv’mnt -300,000 1 -300,000 500,000- 1 500,000- Year 1: 90,000 0.909 81,810 120,000 0.909 109,080Year 2: 160,000 0.826 132,160 140,000 0.826 115,640Year 3: 120,000 0.751 90,120 160,000 0.751 120,160Year 4: 70,000 0.683 47,810 240,000 0.683 163,920Year 5: 70,000 0.621 43,470 320,000 0.621 198,720Totals: 95,570 207,520
The above figures use a Discount Rate of 10%
DCF=
Discounted Cash Flow
DCF=
Discounted Cash Flow

Net Present Value
Allows for time value of money Produces a figure which also allows you distinguish
between projects of different size Considers the full life of the project
BUT More complicated to use and understand

Activity Two
For the scenario described in Activity One, calculate a Net Present Value for each of the two machines, using a Discount Rate of 10% and a Discount Rate of 20%. The Discount Factors at the two rates are shown below:
10% 20%
Year 1 0.909 0.833
Year 2 0.826 0.694
Year 3 0.751 0.579
Year 4 0.683 0.482
Year 5 0.621 0.402
Year 6 0.565 0.335

Activity Two – Solution (1)
MACHINE ONE MACHINE TWO Discount Discount Cashflow Factor DCF Cashflow Factor DCF
Inv’mnt -240,000 1 -240,000 360,000- 1 360,000- Year 1: 90,000 0.909 81,810 100,000 0.909 90,900Year 2: 90,000 0.826 74,340 110,000 0.826 90,860Year 3: 90,000 0.751 67,590 120,000 0.751 90,120Year 4: 50,000 0.683 34,150 120,000 0.683 81,960Year 5: 50,000 0.621 31,050 90,000 0.621 55,890Year 6: 90,000 0.565 50,850 Totals: 48,940 100,580
The above figures use a Discount Rate of 10%
NOTE: This calculation is highly sensitive to rounding errors. Note how the calculations on the spreadsheet using 4dp give slightly different answers of £49,013 and £100,623
NOTE: This calculation is highly sensitive to rounding errors. Note how the calculations on the spreadsheet using 4dp give slightly different answers of £49,013 and £100,623

Activity Two – Solution (2)
MACHINE ONE MACHINE TWO Discount Discount Cashflow Factor DCF Cashflow Factor DCF
Inv’mnt -240,000 1 -240,000 360,000- 1 360,000- Year 1: 90,000 0.833 74,970 100,000 0.833 83,300Year 2: 90,000 0.694 62,460 110,000 0.694 76,340Year 3: 90,000 0.579 52,110 120,000 0.579 69,480Year 4: 50,000 0.482 24,100 120,000 0.482 57,840Year 5: 50,000 0.402 20,100 90,000 0.402 36,180Year 6: 90,000 0.335 30,150 Totals: -6,260 -6,710
The above figures use a Discount Rate of 20%
NOTE: Spreadsheet answers this time (using 4dp) give -£6,210 and -£6,653NOTE: Spreadsheet answers this time (using 4dp) give -£6,210 and -£6,653

Activity Two – Solution Summary
DF = 10% DF = 20%NPV of Machine 1 £48,940 -£6,260NPV of Machine 2 £100,580 -£6,710
Analysis: If the value of money is decreasing at 10% per annum (low
risk, low inflation, low interest), then Machine 2 is a much better proposition, earning over £50K more.
However, if the value of money is decreasing at 20% per annum (high risk, high inflation, high interest) then Machine 1 is a slightly better proposition, as its loss is somewhat less. However, the value of purchasing any machine under these circumstances is questionable.

Internal Rate of Return (IRR)
In the previous example, we can see that at a discounting rate of somewhere between 10% and 20% the NPV=0
At this rate, the project would simply break even, that is, the returns would exactly match the investment.
This discount rate which would give a Net Present Value of Zero is called the Internal Rate of Return
The IRR (Internal Rate of Return) is the project’s net rate of return allowing for time factors.

Internal Rate of Return (IRR)
This can be calculated using spreadsheet functions, or by calculation using one discount rate which produces a negative NPV (Higher Discount Rate) , and one discount rate which produces a positive NPV (Lower Discount Rate)
Calculation Formula: IRR = Lower Discount Rate +
NPV of Lower Discount Rate_____ x Difference in
NPV of lower rate - NPV of higher rate discount rates

Internal Rate of Return – Example
IRR = Lower Discount Rate +
NPV of lower discount rate x Difference in NPV of lower rate - NPV of higher rate discount rates
For Machine 1: Lower Discount (10%) Higher Discount (20%)Net Present Value £48,940 -£6,260
IRR of Machine 1 = 10 + ( 48940 ) x (20-10) 48940- (-6260)
= 10 + (0.8865 x 10) = 18.87%

Internal Rate of Return – Example
IRR = Lower Discount Rate +
NPV of lower discount rate x Difference in NPV of lower rate - NPV of higher rate discount rates
For Machine 2: Lower Discount (10%) Higher Discount (20%)Net Present Value £100,623 -£6,653
IRR of Machine 2 = 10 + ( 100623 ) x (20-10) 100623- (-6653)
= 10 + (0.9374 x 10) = 19.37%

Internal Rate of Return
Allows for time value of money Produces a percentage return which can be compared to
an organisational benchmark Considers the full life of the project
BUT Does not distinguish between projects of different size Seen as complicated to use and understand

Cost-Benefit Analysis
Criticisms of Conventional Analysis Tools
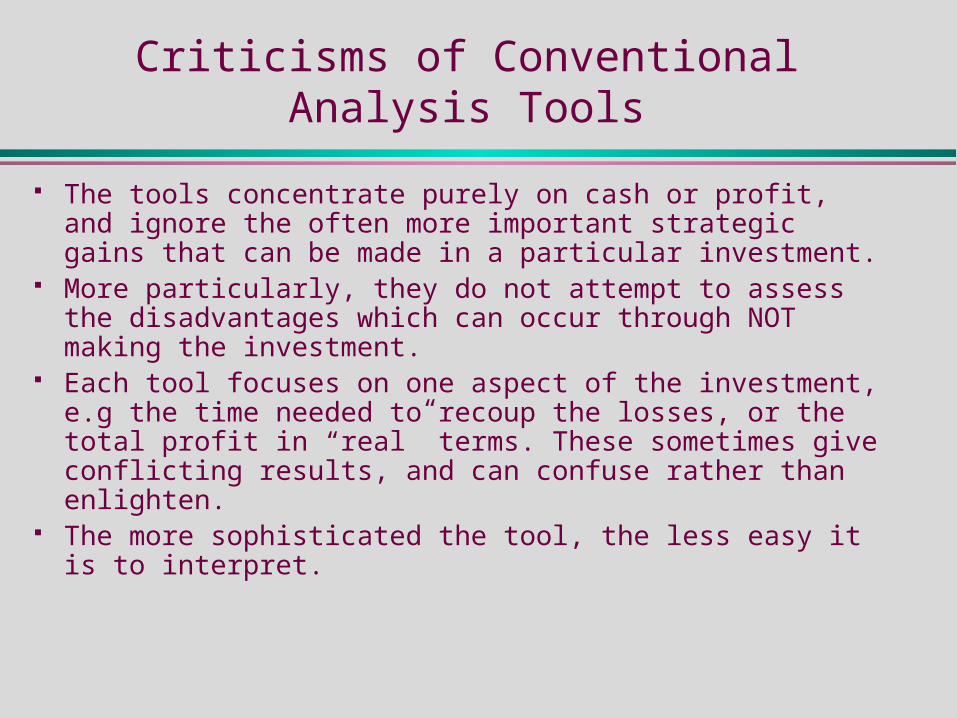
The tools concentrate purely on cash or profit, and ignore the often more important strategic gains that can be made in a particular investment.
More particularly, they do not attempt to assess the disadvantages which can occur through NOT making the investment.
Each tool focuses on one aspect of the investment, e.g the time needed to recoup the losses, or the total profit in “real” terms. These sometimes give conflicting results, and can confuse rather than enlighten.
The more sophisticated the tool, the less easy it is to interpret.

Cost Benefit Analysis
For large, complex projects whose effects can be far-reaching, it is often better to use a Cost-Benefit Analysis
This is broader than simply a cash or profit based analysis It seeks to assess economic and social advantages
(benefits) and disadvantages (costs) of project by quantifying them in monetary terms
It can be relevant where economic or market factors provide insufficient information for decision-making

Cost Benefit Analysis – some difficulties
It is sometimes very difficult to estimate the value of social costs, For example: Siting a factory near to a housing estate.
It is difficult to allow for changes in levels of costs and benefits over time, either through inflation or through social changes.. For example: in times of low employment, siting a factory
near to a housing estate might be seen as a benefit; in times of high employment it would be seen as a cost.
It is an imprecise procedure – different assumptions produce different results. There is a need to specify assumptions clearly.
In an ideal form, the analysis should show range of results under different assumptions and different criteria.

Cost Benefit Analysis - Example
Victoria Line extensionCosts: Capital expenditure. Running Costs. Disruption during
construction. Additional traffic near new stations.Benefits: Time saved on underground journeys, BR journeys and
bus journeys. Comfort/convenience. Time saved on car journeys. Reduced car running costs. Fare savings. Costs saved on road repairs. Reduced road accidents. Reduced pollution. Reduced traffic and noise.
Each of these can (with some ingenuity) be costed in monetary terms. A ‘balance sheet’ is then drawn up to weigh the total benefits against the total costs, and showing the contribution of each item.

Follow-up Activities
Read Chapter 14 (including EPNV) Describe key concepts:
Purpose of Investment Appraisal
Accounting Rate of Return
Payback Period
Discounted Cash Flow
Internal Rate of Return
Cost-benefit analysis Exercises 14.1 and 14.2
Internal Rate of return – Example 1
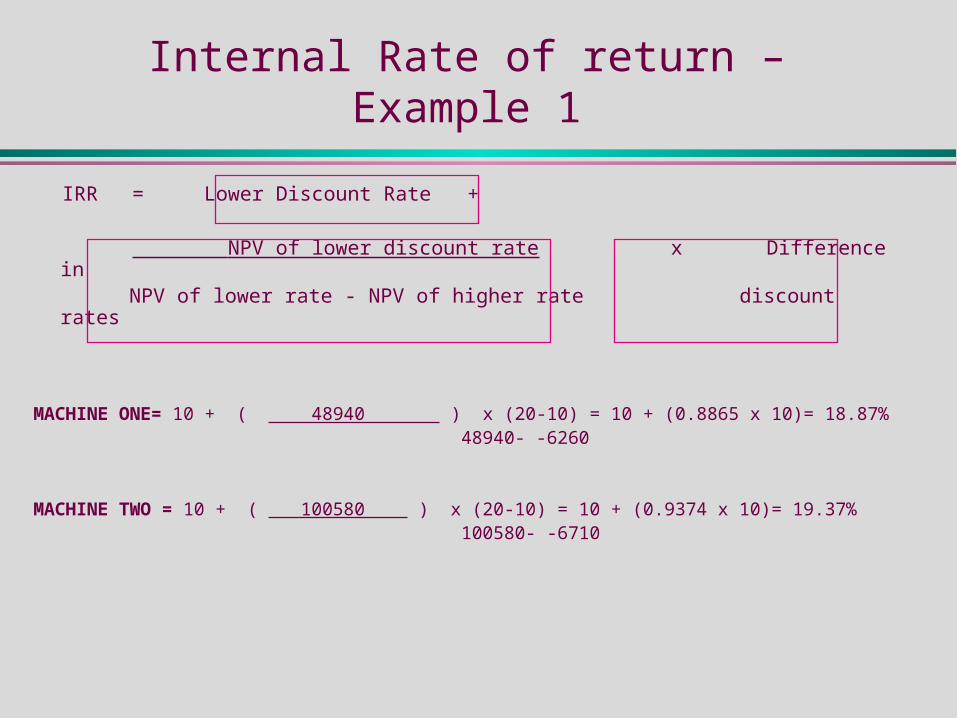
IRR = Lower Discount Rate +
NPV of lower discount rate x Difference in NPV of lower rate - NPV of higher rate discount rates
MACHINE ONE= 10 + ( 48940 ) x (20-10) = 10 + (0.8865 x 10)= 18.87% 48940- -6260
MACHINE TWO = 10 + ( 100580 ) x (20-10) = 10 + (0.9374 x 10)= 19.37% 100580- -6710