Managing Finance and Budgets
23
Managing Finance and Budgets Seminar 4
-
Upload
chester-lott -
Category
Documents
-
view
30 -
download
0
description
Managing Finance and Budgets. Seminar 4. Seminar Four - Activities. Preparation: read Chapter 7 (M & A 2 nd Edition) Or Chapter 6 (M & A 1 st Edition) Describe key concepts: Analysing accounts Ratios Exercises: - PowerPoint PPT Presentation
Transcript of Managing Finance and Budgets

Managing Finance and Budgets
Seminar 4
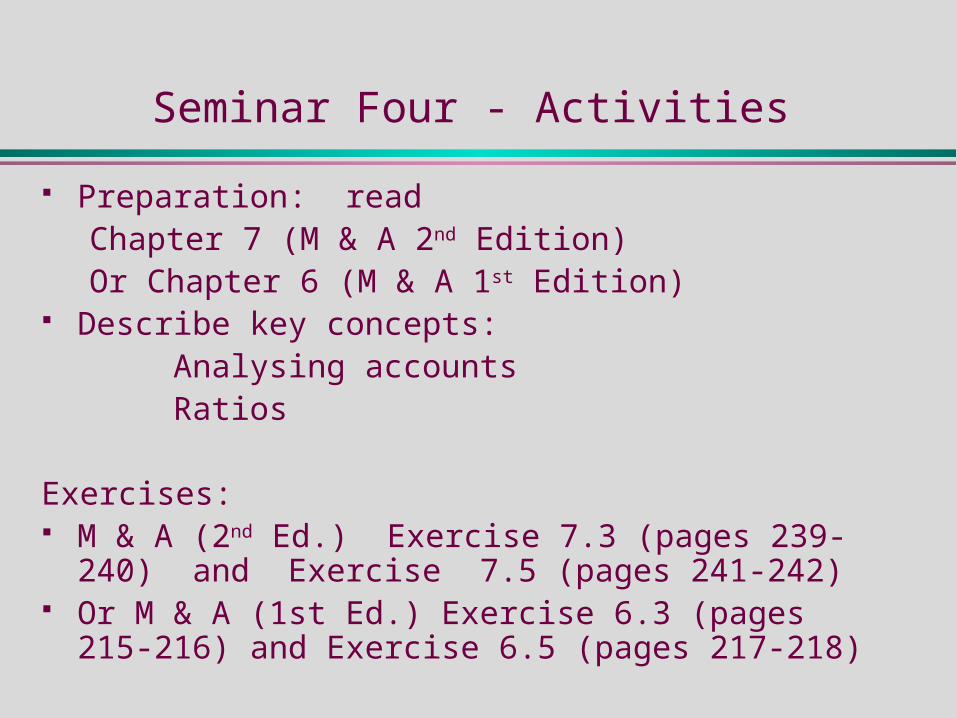
Seminar Four - Activities
Preparation: readChapter 7 (M & A 2nd Edition) Or Chapter 6 (M & A 1st Edition)
Describe key concepts:Analysing accounts Ratios
Exercises: M & A (2nd Ed.) Exercise 7.3 (pages 239-240) and
Exercise 7.5 (pages 241-242) Or M & A (1st Ed.) Exercise 6.3 (pages 215-216) and
Exercise 6.5 (pages 217-218)
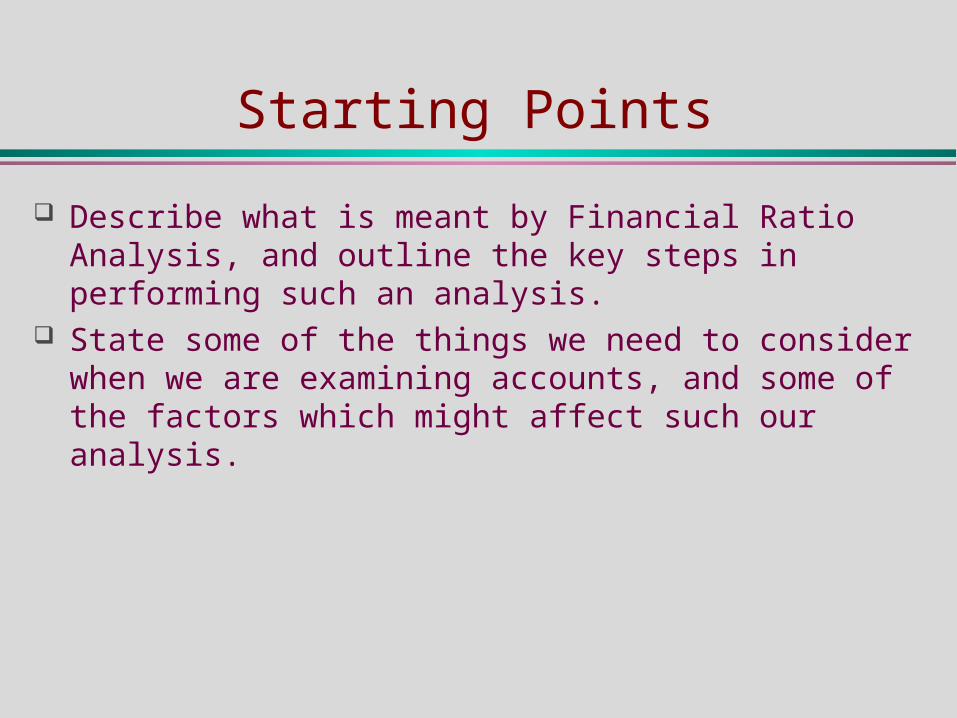
Starting Points
Describe what is meant by Financial Ratio Analysis, and outline the key steps in performing such an analysis.
State some of the things we need to consider when we are examining accounts, and some of the factors which might affect such our analysis.
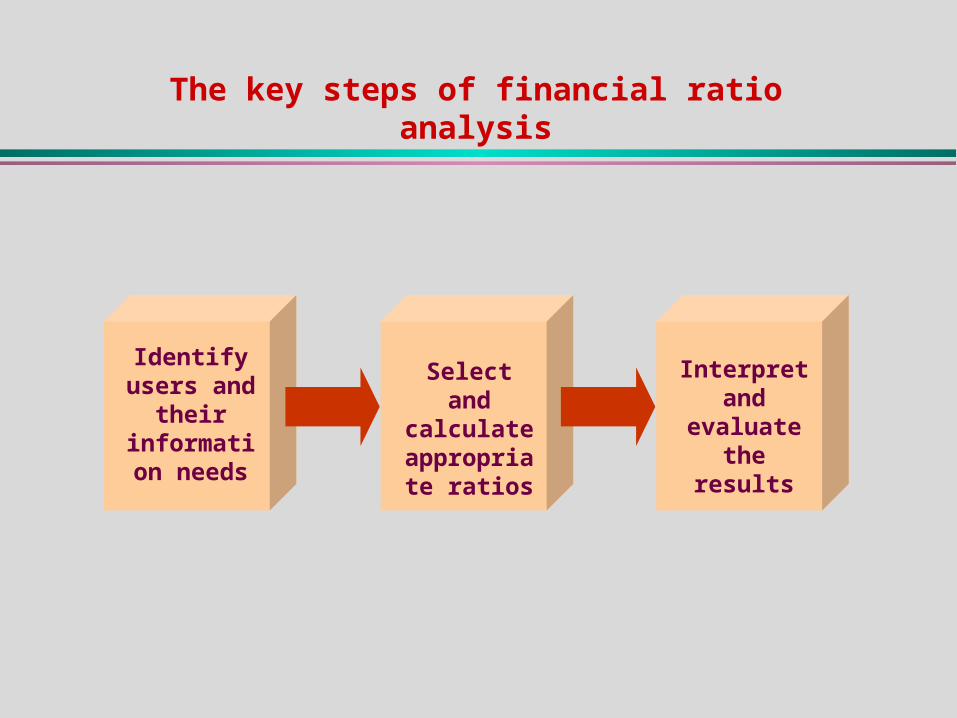
Select and calculate
appropriate ratios
Identify users and
their information
needs
Interpret and
evaluate the results
The key steps of financial ratio analysis
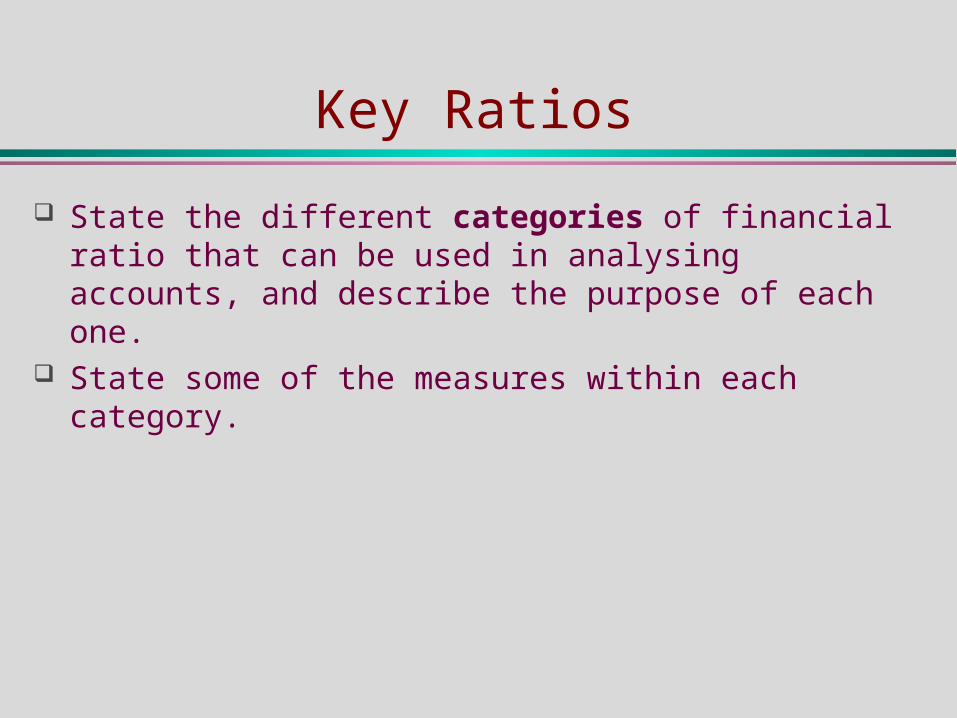
Key Ratios
State the different categories of financial ratio that can be used in analysing accounts, and describe the purpose of each one.
State some of the measures within each category.
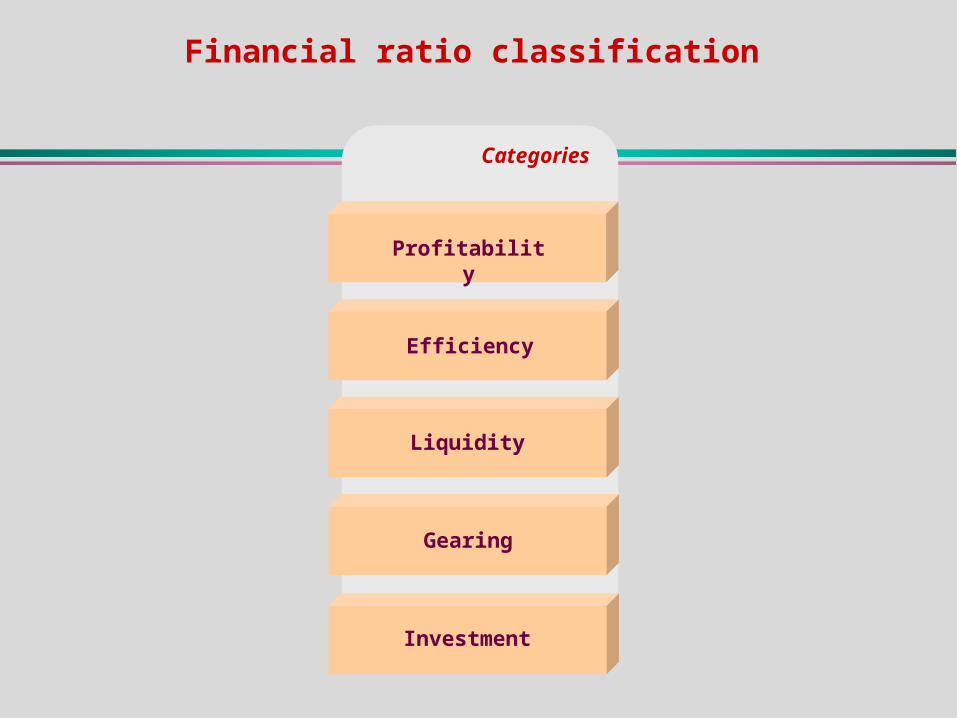
Financial ratio classification
Categories
Profitability
Efficiency
Liquidity
Gearing
Investment
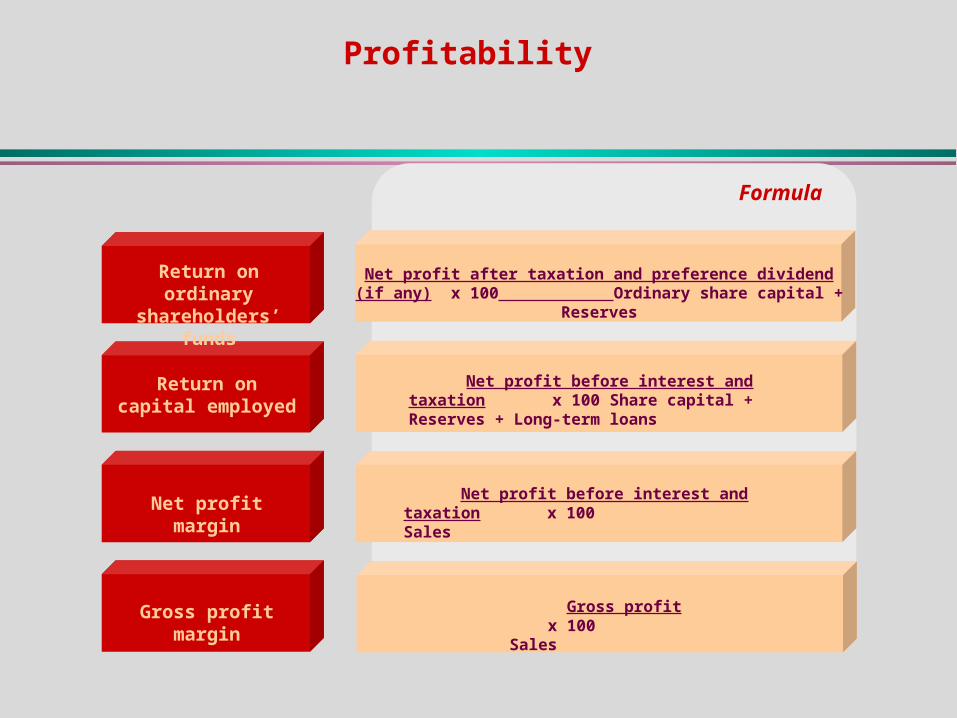
Profitability
Return on ordinary shareholders’ funds
Return on capital employed
Net profit margin
Gross profit margin
Formula
Net profit after taxation and preference dividend (if any) x 100 Ordinary share capital + Reserves
Net profit before interest and taxation x 100 Share capital + Reserves + Long-term loans
Net profit before interest and taxation x 100 Sales
Gross profit x 100 Sales Sales
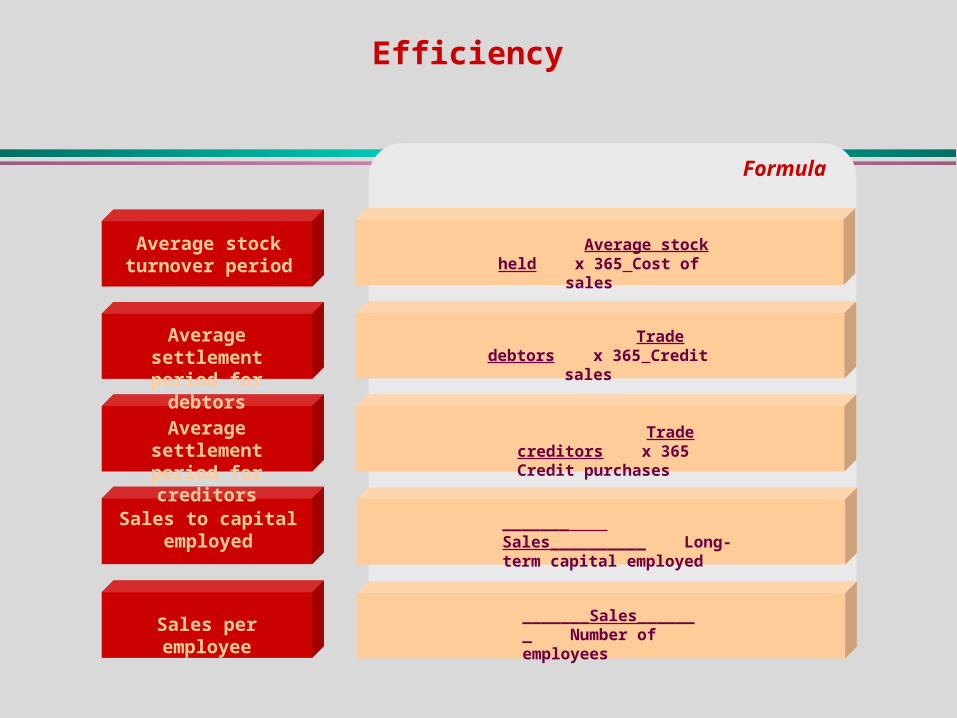
Efficiency
Average stock turnover period
Average settlement period for debtors
Average settlement period for creditors
Sales to capital employed
Formula
Average stock held x 365 Cost of sales
Sales per employee
Trade debtors x 365 Credit sales
Trade creditors x 365 Credit purchases
_______Sales_______ Number of employees
_______ Sales__________ Long-term capital employed
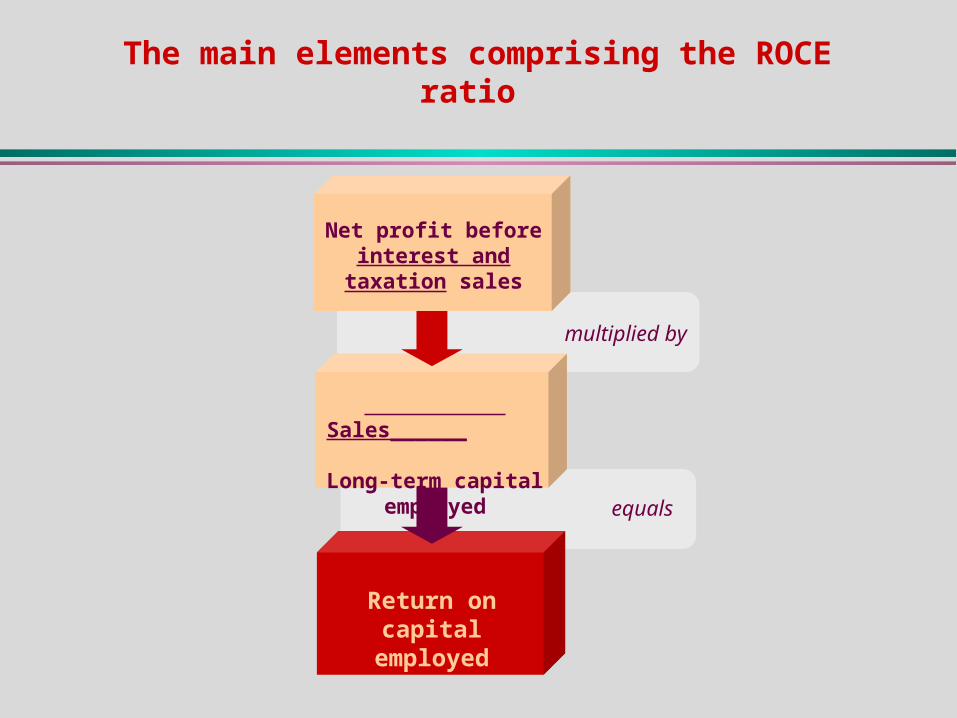
The main elements comprising the ROCE ratio
Sales______ Long-term
capital employed
Return on capital employed
multiplied by
equals
Net profit before interest and taxation
sales
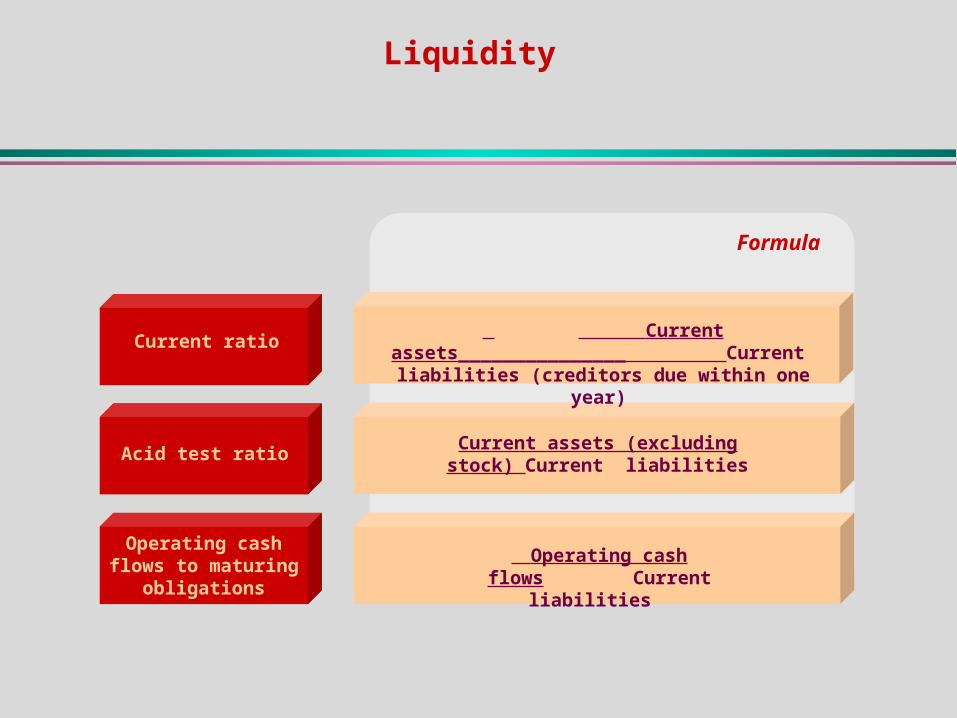
Liquidity
Current ratio
Acid test ratio
Operating cash flows to maturing obligations
Formula
Current assets_______________ Current liabilities (creditors due within one
year)
Operating cash flows Current liabilities
Current assets (excluding stock) Current liabilities
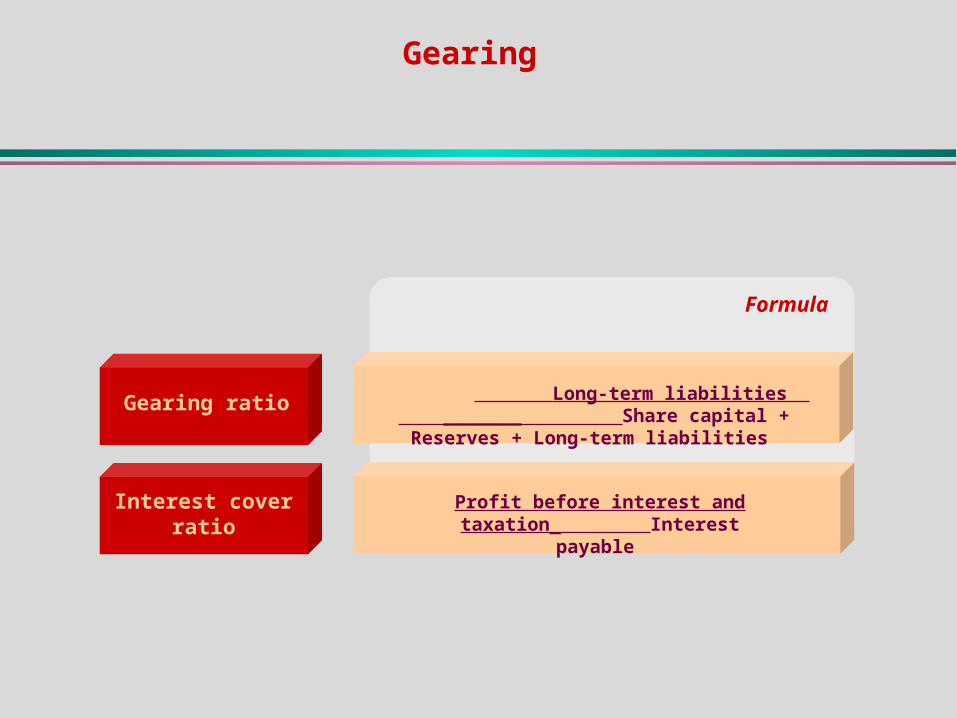
Gearing ratio
Interest cover ratio
Formula
Profit before interest and taxation_ Interest payable
Long-term liabilities _______ Share capital + Reserves + Long-term
liabilities
Gearing
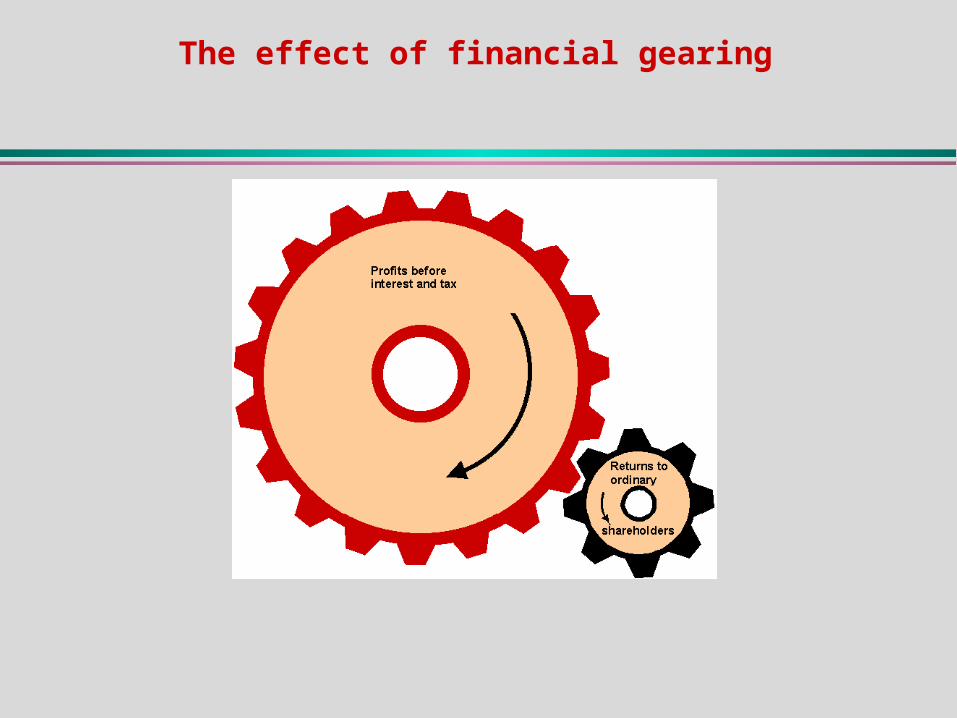
The effect of financial gearing
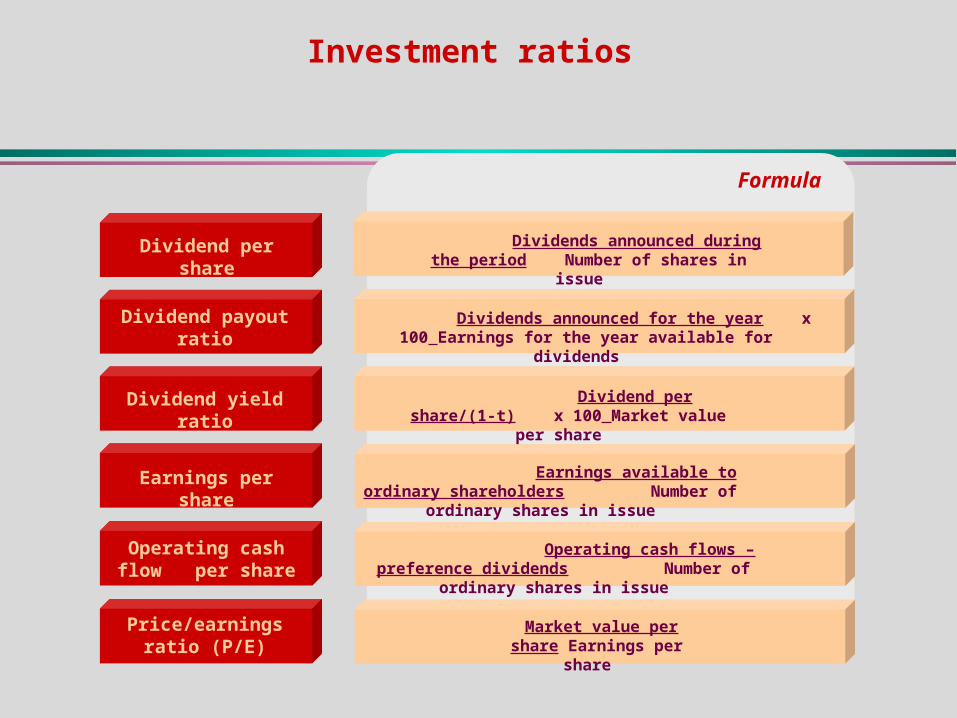
Investment ratios
Dividend per share
Dividend payout ratio
Dividend yield ratio
Earnings per share
Formula
Dividends announced during the period Number of shares in issue
Operating cash flow per share
Dividends announced for the year x 100 Earnings for the year available for dividends
Dividend per share/(1-t) x 100 Market value per share
Price/earnings ratio (P/E)
Earnings available to ordinary shareholders Number of ordinary shares in issue
Operating cash flows – preference dividends Number of ordinary shares in issue
Market value per share Earnings per share
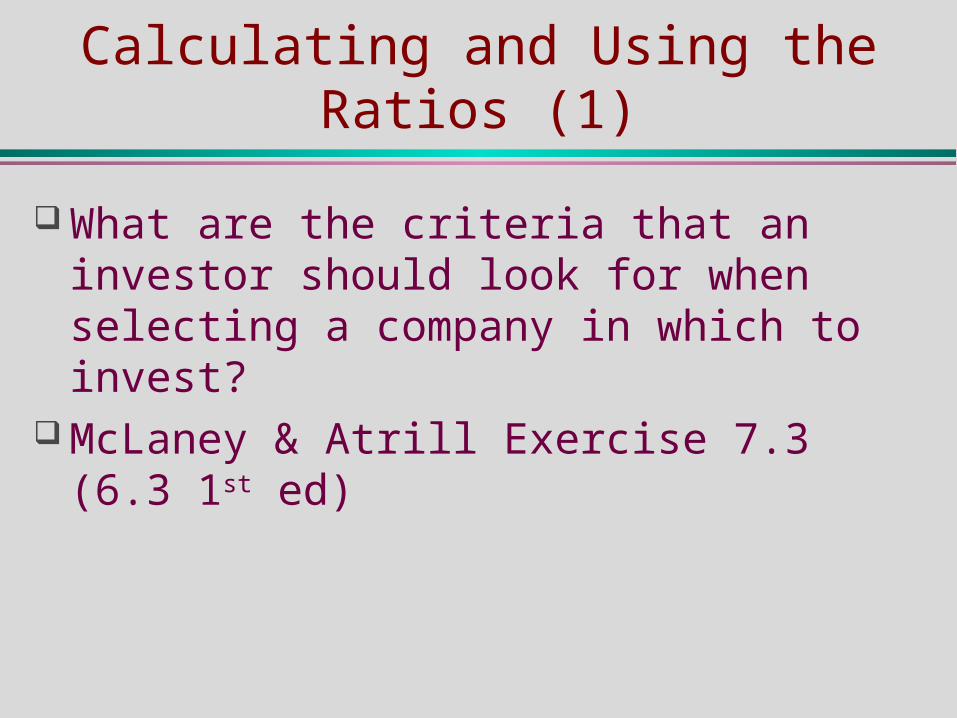
Calculating and Using the Ratios (1)
What are the criteria that an investor should look for when selecting a company in which to invest?
McLaney & Atrill Exercise 7.3 (6.3 1st ed)
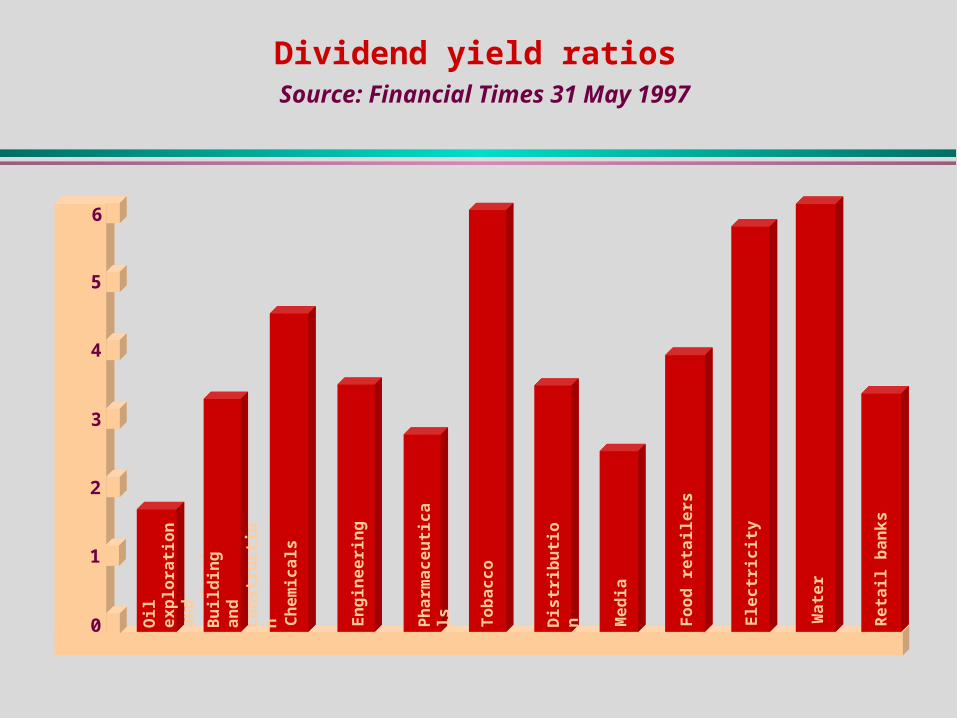
Dividend yield ratios Source: Financial Times 31 May 1997
0
1
2
6
5
4
3
Oil
ex
plo
rati
on
a
nd
pro
du
cti
on
Bu
ild
ing
an
d
co
ns
tru
cti
on
Ch
em
ica
ls
En
gin
ee
rin
g
Ph
arm
ac
eu
tic
als
To
ba
cc
o
Fo
od
re
tail
ers
Ele
ctr
icit
y
Wa
ter
Dis
trib
uti
on
Me
dia
Re
tail
ba
nk
s
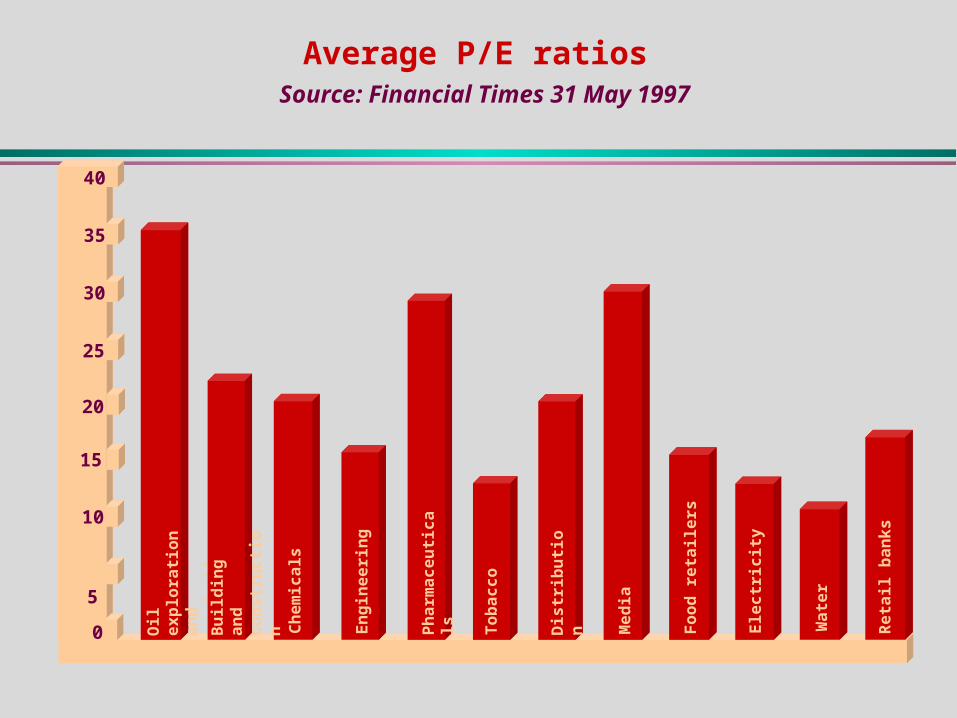
Average P/E ratios Source: Financial Times 31 May 1997
Oil
ex
plo
rati
on
a
nd
pro
du
cti
on
Bu
ild
ing
an
d
co
ns
tru
cti
on
Ch
em
ica
ls
En
gin
ee
rin
g
Ph
arm
ac
eu
tic
als
To
ba
cc
o
Fo
od
re
tail
ers
Ele
ctr
icit
y
Wa
ter
Dis
trib
uti
on
Me
dia
Re
tail
ba
nk
s
0
25
30
35
20
15
10
5
40
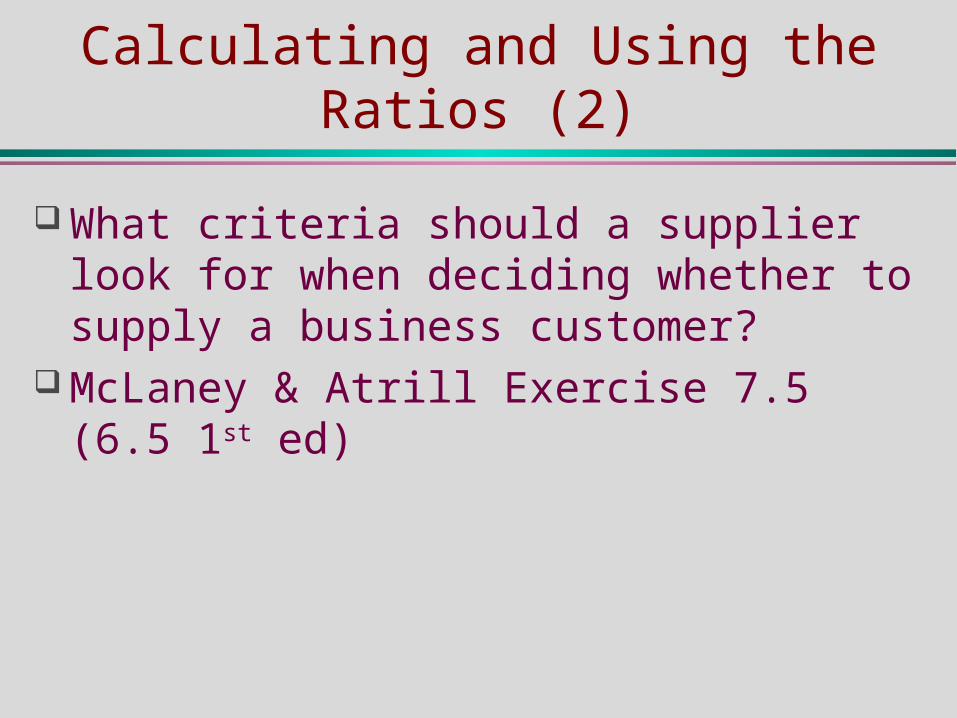
Calculating and Using the Ratios (2)
What criteria should a supplier look for when deciding whether to supply a business customer?
McLaney & Atrill Exercise 7.5 (6.5 1st ed)
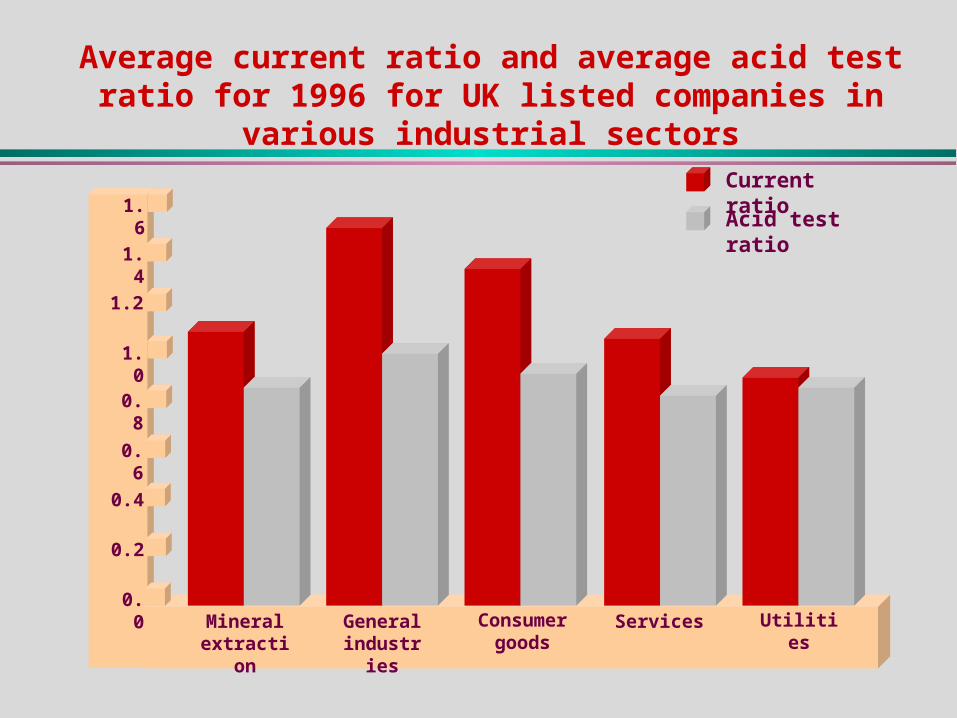
Average current ratio and average acid test ratio for 1996 for UK listed companies in various industrial sectors
Mineralextraction
0.0Generalindustrie
s
Consumergoods
Services
0.2
0.4
0.6
0.8
1.0
1.6
1.2
1.4
Utilities
Current ratio
Acid test ratio
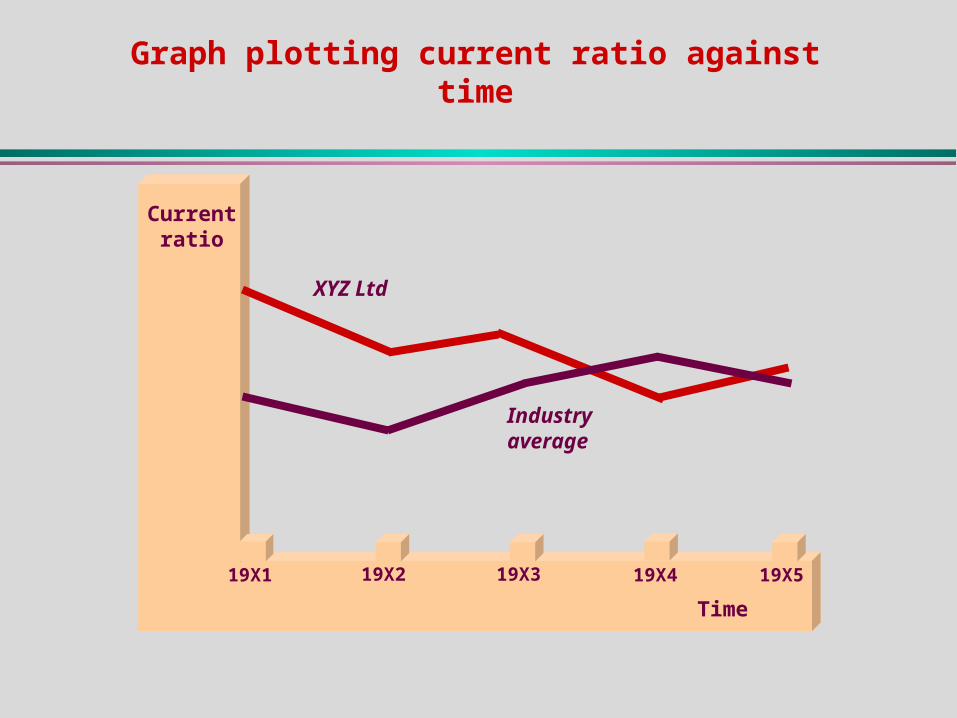
Current ratio
Time
19X1 19X419X319X2 19X5
XYZ Ltd
Industry average
Graph plotting current ratio against time
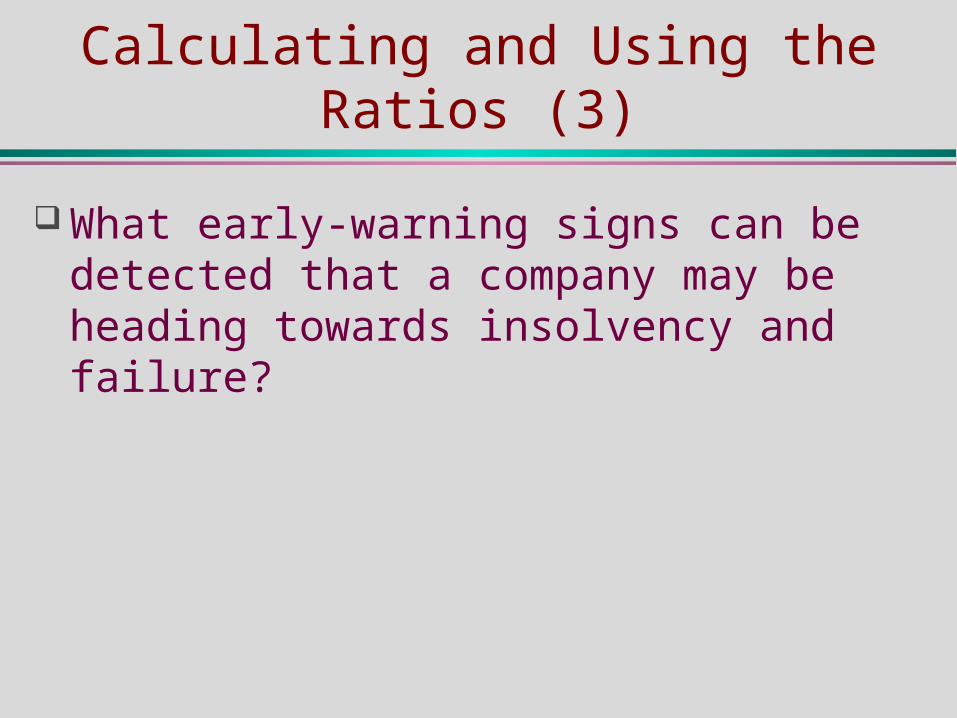
Calculating and Using the Ratios (3)
What early-warning signs can be detected that a company may be heading towards insolvency and failure?
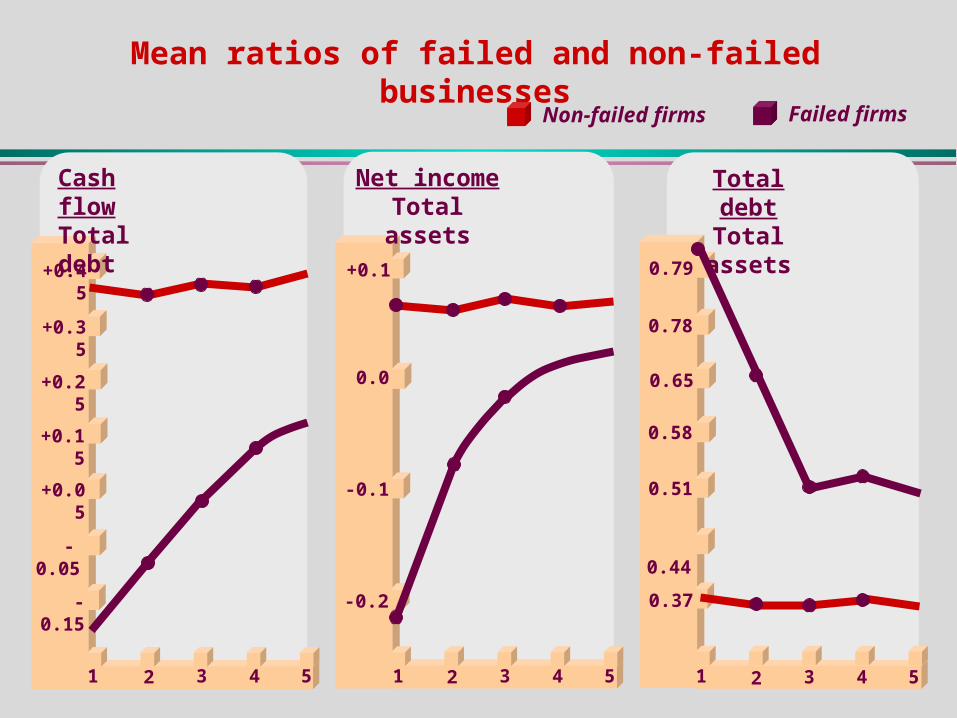
Mean ratios of failed and non-failed businesses
+0.35
+0.45
+0.25
+0.15
+0.05
-0.15
-0.05
+0.1
-0.1
-0.2
0.78
0.79
0.65
0.58
0.51
0.37
0.44
0.0
1 2 3 4 5 2 3 4 51 1 2 3 4 5
Cash flow Total debt
Net income Total assets
Total debt Total assets
Non-failed firms Failed firms
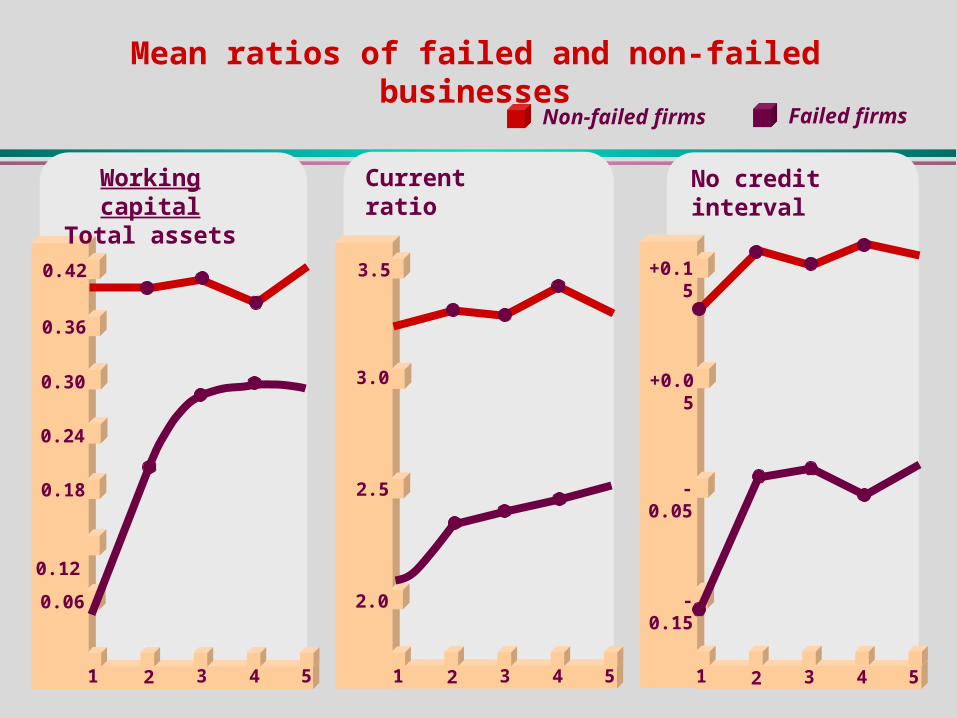
Mean ratios of failed and non-failed businesses
0.36
0.42
0.30
0.24
0.18
0.06
0.12
3.5
2.5
2.0
+0.15
+0.05
-0.05
-0.15
3.0
1 2 3 4 5 2 3 4 51 1 2 3 4 5
Working capital Total assets
Current ratio
No credit interval
Non-failed firms Failed firms
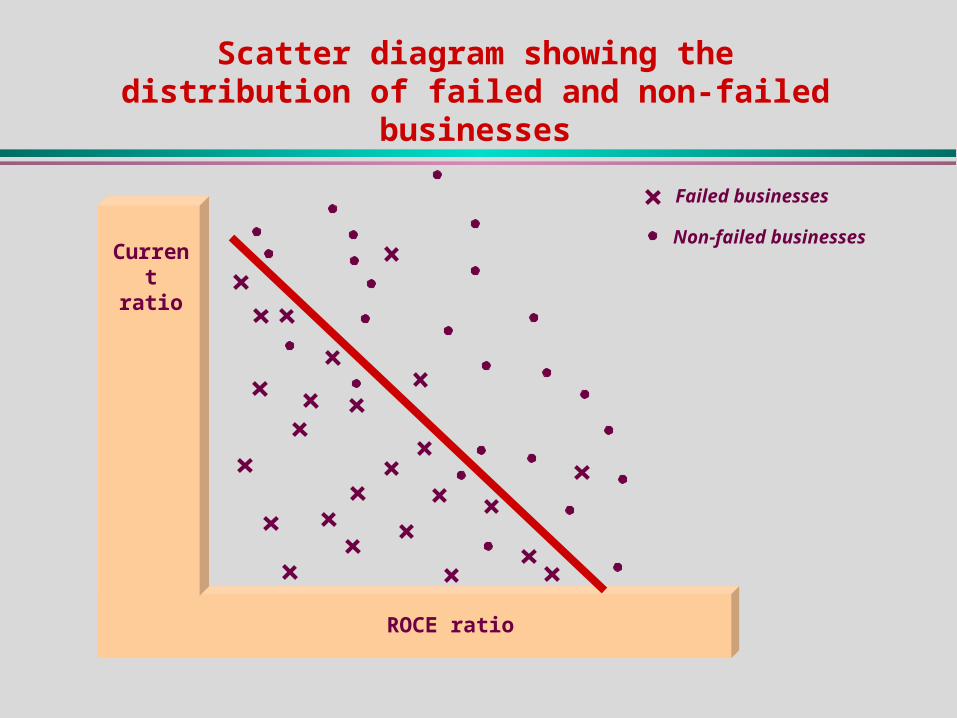
Scatter diagram showing the distribution of failed and non-failed businesses
Current ratio
ROCE ratio
Failed businessesNon-failed businesses