Managerial Accounting - BrainMass · PDF filechapter 1 managerial accounting basics ......
86
Managerial Accounting 2nd Edition J. O'Callaghan
Transcript of Managerial Accounting - BrainMass · PDF filechapter 1 managerial accounting basics ......

Managerial Accounting2nd Edition
J. O'Callaghan

Managerial Accounting
by:J. O'Callaghan
Copyright © 2002 John Wiley & Sons, Inc. All rights reserved.
John Wiley & Sons, Inc.New York
0471413658
Due to electronic permissions issues, some material may have been removed from this chapter,though reference to it may occur in the text. The University of Phoenix has determined that thecontent presented herein satisfies the requirements for this course.
ii

Table of Contents
CHAPTER 1MANAGERIAL ACCOUNTING BASICS............................................................................. 5
COMPARING MANAGERIAL AND FINANCIAL ACCOUNTING........................... 6ETHICAL STANDARDS FOR MANAGERIAL ACCOUNTANTS............................... 7MANAGEMENT FUNCTIONS........................................................................................... 7
MANAGERIAL COST CONCEPTS....................................................................................... 9MANUFACTURING COSTS............................................................................................... 9PRODUCT VERSUS PERIOD COSTS............................................................................... 11
MANUFACTURING COSTS IN FINANCIAL STATEMENTS..................................... 13INCOME STATEMENT...................................................................................................... 13BALANCE SHEET............................................................................................................... 16COST CONCEPTS‐A REVIEW.......................................................................................... 18
CONTEMPORARY DEVELOPMENTS IN MANAGERIAL ACCOUNTING............. 20SERVICE INDUSTRY TRENDS......................................................................................... 20VALUE CHAIN MANAGEMENT.................................................................................... 22
APPENDIX 1A ACCOUNTING CYCLE FOR A MANUFACTURING COMPANY... 27WORK SHEET........................................................................................................................... 28CLOSING ENTRIES................................................................................................................ 30SUMMARY OF STUDY OBJECTIVE FOR APPENDIX 1A............................................. 32GLOSSARYū 67
CHAPTER 2COST ACCOUNTING SYSTEMS......................................................................................... 72
JOB ORDER COST SYSTEM.............................................................................................. 73PROCESS COST SYSTEM................................................................................................... 73
JOB ORDER COST FLOW...................................................................................................... 75ACCUMULATING MANUFACTURING COSTS.......................................................... 76ASSIGNING MANUFACTURING COSTS TO WORK IN PROCESS......................... 78ASSIGNING COSTS TO FINISHED GOODS.................................................................. 89ASSIGNING COSTS TO COST OF GOODS SOLD........................................................ 90SUMMARY OF JOB ORDER COST FLOWS.................................................................... 90
REPORTING JOB COST DATA............................................................................................ 92UNDER‐ OR OVERAPPLIED MANUFACTURING OVERHEAD................................ 93
INTERIM BALANCES........................................................................................................ 93YEAR‐END BALANCE....................................................................................................... 94
GLOSSARY.............................................................................................................................. 130CHAPTER 3
THE NATURE OF PROCESS COST SYSTEMS............................................................... 136USES OF PROCESS COST SYSTEMS............................................................................. 136
Managerial AccountingTable of Contents
iii

SIMILARITIES AND DIFFERENCES BETWEEN JOB ORDER COST AND PROCESSCOST SYSTEMS................................................................................................................. 138PROCESS COST FLOW.................................................................................................... 140ASSIGNMENT OF MANUFACTURING COSTS—JOURNAL ENTRIES................ 140
EQUIVALENT UNITS........................................................................................................... 145WEIGHTED‐AVERAGE METHOD................................................................................ 145REFINEMENTS ON THE WEIGHTED‐AVERAGE METHOD.................................. 146PRODUCTION COST REPORT....................................................................................... 148
COMPREHENSIVE EXAMPLE OF PROCESS COSTING............................................. 149COMPUTE THE PHYSICAL UNIT FLOW (STEP 1).................................................... 149COMPUTE EQUIVALENT UNITS OF PRODUCTION (STEP 2).............................. 150COMPUTE UNIT PRODUCTION COSTS (STEP 3)..................................................... 151PREPARE A COST RECONCILIATION SCHEDULE (STEP 4)................................. 152PREPARING THE PRODUCTION COST REPORT..................................................... 153
FINAL COMMENTS.............................................................................................................. 155APPENDIX 3A FIFO METHOD........................................................................................... 162EQUIVALENT UNITS UNDERFIFO................................................................................. 162
ILLUSTRATION................................................................................................................. 163COMPREHENSIVE EXAMPLE........................................................................................... 164
COMPUTE THE PHYSICAL UNIT FLOW (STEP 1).................................................... 165COMPUTE EQUIVALENT UNITS OF PRODUCTION (STEP 2).............................. 166COMPUTE UNIT PRODUCTION COSTS (STEP 3)..................................................... 167PREPARE A COST RECONCILIATION SCHEDULE (STEP 4)................................. 168PREPARING THE PRODUCTION COST REPORT..................................................... 169
FIFO AND WEIGHTED‐AVERAGE................................................................................... 171SUMMARY OF STUDY OBJECTIVE FOR APPENDIX 3A........................................... 171GLOSSARY.............................................................................................................................. 207
CHAPTER 4ACTIVITY‐BASED COSTING VERSUS TRADITIONAL COSTING........................ 213
TRADITIONAL COSTING SYSTEMS............................................................................ 213THE NEED FOR A NEW COSTING SYSTEM.............................................................. 214ACTIVITY‐BASED COSTING.......................................................................................... 215
ILLUSTRATION OF TRADITIONAL COSTING VERSUS ABC................................ 217UNIT COSTS UNDER TRADITIONAL COSTING...................................................... 217UNIT COSTS UNDER ABC.............................................................................................. 217COMPARING UNIT COSTS............................................................................................ 221
ACTIVITY‐BASED COSTING: A CLOSER LOOK......................................................... 224BENEFITS OF ABC............................................................................................................ 224LIMITATIONS OF ABC.................................................................................................... 225WHEN TO SWITCH TO ABC.......................................................................................... 226VALUE‐ADDED VERSUS NONVALUE‐ADDED ACTIVITIES................................ 226
ACTIVITY‐BASED COSTING IN SERVICE INDUSTRIES......................................... 228
Managerial AccountingTable of Contents
iv

TRADITIONAL COSTING EXAMPLE.......................................................................... 229ACTIVITY‐BASED COSTING EXAMPLE..................................................................... 230
JUST‐IN‐TIME PROCESSING............................................................................................ 232OBJECTIVE OF JIT PROCESSING.................................................................................. 233ELEMENTS OF JIT PROCESSING.................................................................................. 233BENEFITS OF JIT PROCESSING..................................................................................... 234
APPENDIX 4A HIERARCHY OF ACTIVITY LEVELS................................................... 238SUMMARY OF STUDY OBJECTIVE FOR APPENDIX 4A........................................... 241GLOSSARY.............................................................................................................................. 280
CHAPTER 5COST BEHAVIOR ANALYSIS............................................................................................ 287
VARIABLE COSTS............................................................................................................ 288FIXED COSTS..................................................................................................................... 289RELEVANT RANGE......................................................................................................... 290MIXED COSTS.................................................................................................................... 292IMPORTANCE OF IDENTIFYING VARIABLE AND FIXED COSTS....................... 295
COST‐VOLUME‐PROFIT ANALYSIS............................................................................... 296BASIC COMPONENTS..................................................................................................... 297CVP INCOME STATEMENT........................................................................................... 297BREAK‐EVEN ANALYSIS............................................................................................... 301MARGIN OF SAFETY....................................................................................................... 307TARGET NET INCOME................................................................................................... 308CVP AND CHANGES IN THE BUSINESS ENVIRONMENT.................................... 310CVP INCOME STATEMENT REVISITED..................................................................... 313
APPENDIX 5A VARIABLE COSTING.............................................................................. 317EFFECTS OF VARIABLE COSTING ON INCOME........................................................ 318RATIONALE FOR VARIABLE COSTING....................................................................... 320SUMMARY OF STUDY OBJECTIVE FOR APPENDIX 5A........................................... 321GLOSSARY.............................................................................................................................. 344
CHAPTER 6BUDGETING BASICS........................................................................................................... 350
BUDGETING AND ACCOUNTING.............................................................................. 351THE BENEFITS OF BUDGETING................................................................................... 351ESSENTIALS OF EFFECTIVE BUDGETING................................................................. 352LENGTH OF THE BUDGET PERIOD............................................................................ 352THE BUDGETING PROCESS.......................................................................................... 352BUDGETING AND HUMAN BEHAVIOR.................................................................... 353BUDGETING AND LONG‐RANGE PLANNING....................................................... 354THE MASTER BUDGET................................................................................................... 355
PREPARING THE OPERATING BUDGETS.................................................................... 356SALES BUDGET................................................................................................................. 356PRODUCTION BUDGET................................................................................................. 357
Managerial AccountingTable of Contents
v

DIRECT MATERIALS BUDGET...................................................................................... 358DIRECT LABOR BUDGET............................................................................................... 360MANUFACTURING OVERHEAD BUDGET............................................................... 360SELLING AND ADMINISTRATIVE EXPENSE BUDGET.......................................... 361BUDGETED INCOME STATEMENT............................................................................. 363
PREPARING THE FINANCIAL BUDGETS..................................................................... 364CASH BUDGET.................................................................................................................. 364BUDGETED BALANCE SHEET...................................................................................... 368
BUDGETING IN NONMANUFACTURING COMPANIES......................................... 370MERCHANDISERS........................................................................................................... 370SERVICE ENTERPRISES.................................................................................................. 372NOT‐FOR‐PROFIT ORGANIZATIONS......................................................................... 373
GLOSSARY.............................................................................................................................. 407CHAPTER 7
CONCEPT OF BUDGETARY CONTROL......................................................................... 413STATIC BUDGET REPORTS............................................................................................... 414
ILLUSTRATIONS.............................................................................................................. 415USES AND LIMITATIONS.............................................................................................. 416
FLEXIBLE BUDGETS............................................................................................................. 417WHY FLEXIBLE BUDGETS?............................................................................................ 418DEVELOPING THE FLEXIBLE BUDGET...................................................................... 421FLEXIBLE BUDGET—A CASE STUDY......................................................................... 421FLEXIBLE BUDGET REPORTS........................................................................................ 424MANAGEMENT BY EXCEPTION................................................................................. 425
THE CONCEPT OF RESPONSIBILITY ACCOUNTING............................................... 427CONTROLLABLE VERSUS NONCONTROLLABLE REVENUES AND COSTS.... 429RESPONSIBILITY REPORTING SYSTEM..................................................................... 430
TYPES OF RESPONSIBILITY CENTERS.......................................................................... 432RESPONSIBILITY ACCOUNTING FOR COST CENTERS......................................... 433RESPONSIBILITY ACCOUNTING FOR PROFIT CENTERS..................................... 434RESPONSIBILITY ACCOUNTING FOR INVESTMENT CENTERS......................... 437PRINCIPLES OF PERFORMANCE EVALUATION.................................................... 440
APPENDIX 7A RESIDUAL INCOME—ANOTHER PERFORMANCEMEASUREMENT.................................................................................................................... 446RESIDUAL INCOME COMPARED TOROI..................................................................... 447RESIDUAL INCOME WEAKNESS.................................................................................... 448SUMMARY OF STUDY OBJECTIVE FOR APPENDIX 7A........................................... 449GLOSSARY.............................................................................................................................. 485
CHAPTER 8THE NEED FOR STANDARDS........................................................................................... 490
DISTINGUISHING BETWEEN STANDARDS AND BUDGETS............................... 491WHY STANDARD COSTS?............................................................................................. 491
Managerial AccountingTable of Contents
vi

SETTING STANDARD COSTS—A DIFFICULT TASK................................................ 492IDEAL VERSUS NORMAL STANDARDS.................................................................... 493A CASE STUDY................................................................................................................. 493
VARIANCES FROM STANDARDS................................................................................... 498ANALYZING VARIANCES............................................................................................. 499REPORTING VARIANCES.............................................................................................. 513STATEMENT PRESENTATION OF VARIANCES....................................................... 514
APPENDIX 8A STANDARD COST ACCOUNTING SYSTEM................................... 519JOURNAL ENTRIES.............................................................................................................. 520LEDGER ACCOUNTS........................................................................................................... 522SUMMARY OF STUDY OBJECTIVE FOR APPENDIX 8A........................................... 523GLOSSARY.............................................................................................................................. 551
CHAPTER 9MANAGEMENT'S DECISION‐MAKING PROCESS.................................................... 557
INCREMENTAL ANALYSIS APPROACH................................................................... 557HOW INCREMENTAL ANALYSIS WORKS................................................................ 558
TYPES OF INCREMENTAL ANALYSIS........................................................................... 559ACCEPT AN ORDER AT A SPECIAL PRICE............................................................... 560MAKE OR BUY.................................................................................................................. 560SELL OR PROCESS FURTHER........................................................................................ 563RETAIN OR REPLACE EQUIPMENT........................................................................... 566ELIMINATE AN UNPROFITABLE SEGMENT............................................................ 567
SALES MIX.............................................................................................................................. 570BREAK‐EVEN SALES....................................................................................................... 570LIMITED RESOURCES..................................................................................................... 572
OTHER CONSIDERATIONS IN DECISION MAKING............................................... 574QUALITATIVE FACTORS............................................................................................... 574RELATIONSHIP OF INCREMENTAL ANALYSIS AND ACTIVITY‐BASED COSTING.5 7 5
GLOSSARY.............................................................................................................................. 604CHAPTER 10
THE CAPITAL BUDGETING EVALUATION PROCESS............................................. 611CASH FLOW INFORMATION....................................................................................... 612ILLUSTRATIVE DATA..................................................................................................... 613
CASH PAYBACK.................................................................................................................... 614NET PRESENT VALUE METHOD..................................................................................... 615
EQUAL ANNUAL CASH FLOWS.................................................................................. 616UNEQUAL ANNUAL CASH FLOWS........................................................................... 617CHOOSING A DISCOUNT RATE.................................................................................. 618SIMPLIFYING ASSUMPTIONS...................................................................................... 619COMPREHENSIVE EXAMPLE....................................................................................... 621
ADDITIONAL CONSIDERATIONS................................................................................. 622
Managerial AccountingTable of Contents
vii

INTANGIBLE BENEFITS................................................................................................. 622MUTUALLY EXCLUSIVE PROJECTS............................................................................ 624RISK ANALYSIS................................................................................................................ 626POST‐AUDIT OF INVESTMENT PROJECTS................................................................ 627
OTHER CAPITAL BUDGETING TECHNIQUES........................................................... 628INTERNAL RATE OF RETURN METHOD.................................................................. 628COMPARING DISCOUNTED CASH FLOW METHODS.......................................... 630ANNUAL RATE OF RETURN METHOD..................................................................... 631
GLOSSARY.............................................................................................................................. 660CHAPTER 11
SECTION 1 EXTERNAL SALES.......................................................................................... 666PRICING IN A COMPETITIVE MARKET....................................................................... 668COST‐PLUS PRICING.......................................................................................................... 669
LIMITATIONS OF COST‐PLUS PRICING.................................................................... 671TIME AND MATERIAL PRICING..................................................................................... 674SECTION 2 INTERNAL SALES.......................................................................................... 678NEGOTIATED TRANSFER PRICES.................................................................................. 680
NO EXCESS CAPACITY................................................................................................... 680EXCESS CAPACITY.......................................................................................................... 681VARIABLE COSTS............................................................................................................ 682SPECIAL ORDER............................................................................................................... 683SUMMARY OF NEGOTIATED TRANSFER PRICING APPROACH....................... 683
COST‐BASED TRANSFER PRICES................................................................................... 684MARKET‐BASED TRANSFER PRICES............................................................................. 685EFFECT OF OUTSOURCING ON TRANSFER PRICING............................................. 686TRANSFERS BETWEEN DIVISIONS IN DIFFERENT COUNTRIES........................ 686APPENDIX 11A OTHER COST APPROACHES TO PRICING.................................... 691ABSORPTION COST APPROACH.................................................................................... 691CONTRIBUTION (VARIABLE COST) APPROACH..................................................... 694SUMMARY OF STUDY OBJECTIVE FOR APPENDIX 11A......................................... 696COMPREHENSIVE PROBLEM: CHAPTERS 1–11.......................................................... 723GLOSSARY.............................................................................................................................. 730
CHAPTER 12THE STATEMENT OF CASH FLOWS: PURPOSE AND FORMAT............................ 735
PURPOSE OF THE STATEMENT OF CASH FLOWS................................................. 736MEANING OF “CASH FLOWS”.................................................................................... 736CLASSIFICATION OF CASH FLOWS........................................................................... 737SIGNIFICANT NONCASH ACTIVITIES....................................................................... 738FORMAT OF THE STATEMENT OF CASH FLOWS.................................................. 740THE CORPORATE LIFE CYCLE..................................................................................... 741USEFULNESS OF THE STATEMENT OF CASH FLOWS.......................................... 743PREPARING THE STATEMENT OF CASH FLOWS................................................... 744
Managerial AccountingTable of Contents
viii

INDIRECT AND DIRECT METHODS........................................................................... 745SECTION 1 STATEMENT OF CASH FLOWS—INDIRECT METHOD..................... 747FIRST YEAR OF OPERATIONS—2002.............................................................................. 747
STEP 1: DETERMINE THE NET INCREASE/DECREASE IN CASH........................ 748STEP 2: DETERMINE NET CASH PROVIDED/USED BY OPERATINGACTIVITIES........................................................................................................................ 749STEP 3: DETERMINE NET CASH PROVIDED/USED BY INVESTING ANDFINANCING ACTIVITIES............................................................................................... 751STATEMENT OF CASH FLOWS—2002........................................................................ 752
SECOND YEAR OF OPERATIONS—2003........................................................................ 753STEP 1: DETERMINE THE NET INCREASE/DECREASE IN CASH........................ 754STEP 2: DETERMINE NET CASH PROVIDED/USED BY OPERATINGACTIVITIES........................................................................................................................ 754STEP 3: DETERMINE NET CASH PROVIDED/USED BY INVESTING ANDFINANCING ACTIVITIES............................................................................................... 756STATEMENT OF CASH FLOWS—2003........................................................................ 758SUMMARY OF CONVERSION TO NET CASH PROVIDED BY OPERATINGACTIVITIES—INDIRECT METHOD............................................................................. 758
SECTION 1 STATEMENT OF CASH FLOWS—DIRECT METHOD.......................... 762FIRST YEAR OF OPERATIONS—2002.............................................................................. 762
STEP 1: DETERMINE THE NET INCREASE/DECREASE IN CASH........................ 764STEP 2: DETERMINE NET CASH PROVIDED/USED BY OPERATINGACTIVITIES........................................................................................................................ 764STEP 3: DETERMINE NET CASH PROVIDED/USED BY INVESTING ANDFINANCING ACTIVITIES............................................................................................... 769STATEMENT OF CASH FLOWS—2002........................................................................ 770
SECOND YEAR OF OPERATIONS—2003........................................................................ 771STEP 1: DETERMINE THE NET INCREASE/DECREASE IN CASH........................ 772STEP 2: DETERMINE NET CASH PROVIDED/USED BY OPERATINGACTIVITIES........................................................................................................................ 772STEP 3: DETERMINE NET CASH PROVIDED/USED BY INVESTING ANDFINANCING ACTIVITIES............................................................................................... 775STATEMENT OF CASH FLOWS—2003........................................................................ 776
USING CASH FLOWS TO EVALUATE A COMPANY................................................. 779FREE CASH FLOW............................................................................................................ 779CAPITAL EXPENDITURE RATIO.................................................................................. 781ASSESSING LIQUIDITY, SOLVENCY, AND PROFITABILITY USINGCASH FLOWS.................................................................................................................... 782
GLOSSARY.............................................................................................................................. 836CHAPTER 13
EARNING POWER AND IRREGULAR ITEMS.............................................................. 842DISCONTINUED OPERATIONS.................................................................................... 843
Managerial AccountingTable of Contents
ix

EXTRAORDINARY ITEMS.............................................................................................. 844CHANGES IN ACCOUNTING PRINCIPLE................................................................. 847COMPREHENSIVE INCOME......................................................................................... 849
COMPARATIVE ANALYSIS............................................................................................... 849HORIZONTAL ANALYSIS.............................................................................................. 851VERTICAL ANALYSIS..................................................................................................... 855
RATIO ANALYSIS................................................................................................................. 859LIQUIDITY RATIOS.......................................................................................................... 862SOLVENCY RATIOS......................................................................................................... 867PROFITABILITY RATIOS................................................................................................. 870
LIMITATIONS OF FINANCIAL ANALYSIS................................................................... 878ESTIMATES........................................................................................................................ 878COST....ū 878ALTERNATIVE ACCOUNTING METHODS............................................................... 879ATYPICAL DATA............................................................................................................. 879DIVERSIFICATION........................................................................................................... 879
GLOSSARY.............................................................................................................................. 931APPENDIX A
THE ANNUAL REPORT....................................................................................................... 935FINANCIAL HIGHLIGHTS................................................................................................. 936
Corporate Principles ......................................................................................................... 936Corporate Profile ............................................................................................................... 937
LETTER TO THE STOCKHOLDERS................................................................................. 937To Our Shareholders ........................................................................................................ 937Operating Report .............................................................................................................. 939
MANAGEMENT DISCUSSION AND ANALYSIS........................................................ 942Management's Discussion and Analysis of Financial Condition and Results ofOperations .......................................................................................................................... 942
FINANCIAL STATEMENTS AND ACCOMPANYING NOTES................................. 948Notes to Consolidated Financial Statements ................................................................ 953
AUDITOR'S REPORT............................................................................................................ 966Report of Independent Accountants .............................................................................. 967
SUPPLEMENTARY FINANCIAL INFORMATION....................................................... 967APPENDIX BAPPENDIX C
NATURE OF INTEREST....................................................................................................... 977SIMPLE INTEREST............................................................................................................ 978COMPOUND INTEREST................................................................................................. 978
SECTION 1 FUTURE VALUE CONCEPTS....................................................................... 979FUTURE VALUE OF A SINGLE AMOUNT..................................................................... 979FUTURE VALUE OF AN ANNUITY.................................................................................. 982SECTION 2 PRESENT VALUE CONCEPTS..................................................................... 985
Managerial AccountingTable of Contents
x

PRESENT VALUE VARIABLES.......................................................................................... 985PRESENT VALUE OF A SINGLE AMOUNT................................................................... 985PRESENT VALUE OF AN ANNUITY................................................................................ 988TIME PERIODS AND DISCOUNTING............................................................................ 991COMPUTING THE PRESENT VALUES IN A CAPITAL BUDGETINGDECISIONū 991GLOSSARY............................................................................................................................ 1000
APPENDIX DETHICAL BEHAVIOR FOR PRACTITIONERS OF MANAGEMENT ACCOUNTINGAND FINANCIAL MANAGEMENT............................................................................... 1001STANDARDS OF ETHICAL CONDUCT FOR PRACTITIONERS OF MANAGEMENTACCOUNTING AND FINANCIAL MANAGEMENT................................................. 1002
COMPETENCE................................................................................................................ 1002CONFIDENTIALITY....................................................................................................... 1002INTEGRITY....................................................................................................................... 1003OBJECTIVITY................................................................................................................... 1003RESOLUTION OF ETHICAL CONFLICT................................................................... 1003
AFTERWORDCASE‐1....ū 1007CARD‐MART SWIMS IN THE DOT‐COM SEA: JOB ORDER COSTING............. 1007
THE BUSINESS SITUATION......................................................................................... 1007CASE‐2....ū 1010CARD‐MART SWIMS IN THE DOT‐COM SEA: ACTIVITY‐BASED COSTING.. 1010
THE BUSINESS SITUATION......................................................................................... 1011CASE‐3....ū 1016CARD‐MART SWIMS IN THE DOT‐COM SEA: CAPITAL BUDGETING............ 1016
THE BUSINESS SITUATION......................................................................................... 1016CASE‐4....ū 1019CARD‐MART SWIMS IN THE DOT‐COM SEA: TRANSFER PRICING ISSUES. 1019
THE BUSINESS SITUATION......................................................................................... 1019CASE‐5....ū 1022RICHLAND CIRCULAR CLUB PRO RODEO ROUNDUP......................................... 1022
THE BUSINESS SITUATION......................................................................................... 1022
Managerial AccountingTable of Contents
xi

Managerial AccountingTable of Contents
xii

Chapter 4
Activity-Based Costing
Navigator
• Scan Study Objectives
• Read Feature Story
• Read Preview
• Read text and answer Before You Go On
p. 148 □ p. 156 □ p. 160 □
• Work Using the Decision Toolkit
• Review Summary of Study Objectives
• Work Demonstration Problem
• Answer Self‐Study Questions
• Complete Assignments
Managerial AccountingChapter 4
Page 209

STUDY OBJECTIVES
After studying this chapter, you should be able to:
1. Recognize the difference between traditional costing and activity‐based costing.
2. Identify the steps in the development of an activity‐based costing system.
3. Know how companies identify the activity cost pools used in activity‐based costing.
4. Know how companies identify and use the activity cost drivers in activity‐basedcosting.
5. Understand the benefits and limitations of activity‐based costing.
6. Differentiate between value‐added and nonvalue‐added activities.
7. Apply activity‐based costing to service industries.
8. Explain just‐in‐time (JIT) processing.
Managerial AccountingChapter 4
Page 210

Feature Story
THE ABCs OF DONUT MAKING—VIRTUAL‐REALITY STYLE
Super Bakery, Inc., created in 1990 by former Pittsburgh Steelers' running back Franco Harris,is a nationwide supplier of mineral‐, vitamin‐, and protein‐ enriched donuts and other bakedgoods to the institutional food market, primarily school systems. Super Bakery is a virtualcorporation, in which only the core, strategic functions of the business are performed insidethe company. The remaining activities—selling, manufacturing, warehousing, andshipping—are outsourced to a network of external companies.
Super Bakery draws these cooperating companies together and organizes the work flow.The goal is to add maximum value to the company while making the minimum investmentin permanent staff, fixed assets, and working capital. The results are notable: Super Bakery'ssales have grown at an average rate of approximately 20 percent during most of its existence.
One of Super Bakery's challenges has been to control the cost of the outsourced activities.Management suspected a wide variation in the cost of serving customers in different partsof the country. Yet its traditional costing methods were spreading costs over the entirecustomer base. Each customer's order appeared to cost the same amount to complete. Inactuality, orders with high profit margins were subsidizing orders with low profit margins.
Managerial AccountingChapter 4
Page 211

Super Bakery desired a system that would more accurately assign the costs of each order.With such a system, pricing could be improved.
The company looked at and eventually changed to a system that could identify the costsassociated with the activities performed in the business—manufacturing, sales, warehousing,and shipping. The new activity‐based costing system showed that the costs and profit marginson each sale vary significantly. Super Bakery is now able to track the profitability of eachcustomer's account and the performance of outsourced activities. This donut maker, as aresult, even knows the cost of the donut holes!Source: Tom R.V. Davis and Bruce L. Darling, “ABC in a Virtual Corporation,” Management Accounting, Oct.1996, pp. 18–26.
PREVIEW OF CHAPTER 4
As indicated in our Feature Story about Super Bakery, Inc., the traditional costing systemsdescribed in earlier chapters are not the best answer for every company. Because SuperBakery suspected that the traditional system was masking significant differences in its realcost structure, it sought a new method of assigning costs. Similar searches by other companiesfor ways to improve operations and gather more accurate data for decision‐making haveresulted in the development of powerful new management tools, including activity‐basedcosting (ABC) and just‐in‐time (JIT) processing. The primary objective of this chapter is toexplain and illustrate activity‐based costing. A brief overview of just‐in‐time processing ispresented at the end of the chapter.
The content and organization of this chapter are as follows.
Managerial AccountingChapter 4
Page 212

ACTIVITY‐BASED COSTING VERSUS TRADITIONAL COSTING
TRADITIONAL COSTING SYSTEMS
It is probably impossible to determine the exact cost of a product or service. However, in orderto achieve improved management decisions, every effort to provide decision makers with thebest possible cost estimates must be made. The best estimate of product cost occurs when thecosts are traceable directly to the product produced or the service provided. Direct material anddirect labor costs are the easiest to trace directly to the product through the use of materialrequisition forms and payroll time sheets. Overhead costs, on the other hand, are an indirect orcommon cost that generally cannot be easily or directly traced to individual products or services.Instead, we use estimates to assign overhead costs to products and services.
Often the most difficult part of computing accurate unit costs is determining the proper amountof overhead cost to assign to each product, service, or job. In our coverage of job order costingin Chapter 2 and of process costing in Chapter 3, we used a single or plantwide overhead ratethroughout the year for the entire factory operation. That rate was called the predeterminedoverhead rate. For job order costing we assumed that direct labor costwas the relevant activitybase for assigning all overhead costs to jobs. For process costing, we assumed that machine hourswas the relevant activity base for assigning all overhead to the process or department.
Those assumptions made sense when overhead cost allocation systems were first developed. Atthat time, direct labor made up a large portion of total manufacturing cost. Therefore, it waswidely accepted that there was a high correlation between direct labor and the incurrence ofoverhead cost. As a result, direct labor became the most popular basis for allocating overhead.
Even in today's increasingly automated environment, direct labor is often the appropriate basisfor assigning overhead cost to products. It is appropriate to use direct labor when (a) direct laborconstitutes a significant part of total product cost, and (b) a high correlation exists between directlabor and changes in the amount of overhead costs. A simplified (one‐stage) traditional costingsystem relying on direct labor to assign overhead is displayed in Illustration 1.
Managerial AccountingChapter 4
Page 213

Traditional one‐stage costing system
THE NEED FOR A NEW COSTING SYSTEM
The last decade brought tremendous change to manufacturers and service providers. Advancesin computerized systems, technological innovation, global competition, and automation havechanged the manufacturing environment drastically. As a result, the amount of direct labor usedin many industries has greatly decreased, and total overhead costs resulting from depreciationon expensive equipment and machinery, utilities, repairs, and maintenance have significantlyincreased. When the correlation between direct labor and overhead no longer exists, it isinappropriate to continue to use plantwide predetermined overhead rates based on direct labor.Companies that continue to use such overhead rates based on direct labor when this correlationdoes not exist experience significant product cost distortions.
Recognizing these distortions, many companies now use machine hours as the basis on whichto allocate overhead in an automated manufacturing environment. But even machine hours maynot suffice as the only plantwide basis for allocating all overhead. If the manufacturing processis complex, then only multiple allocation bases can result in more accurate product‐costcomputations. In such situations, managers need to consider a new overhead cost allocationmethod that uses multiple bases. That method is activity‐based costing.
Managerial AccountingChapter 4
Page 214

ACTIVITY-BASED COSTING
Activities and Cost Drivers
Activity‐based costing (ABC) allocates overhead to multiple activity cost pools, and it thenassigns the activity cost pools to products by means of cost drivers. In activity‐based costing, anactivity is any event, action, transaction, or work sequence that incurs cost when producing aproduct or providing a service. A cost driver is any factor or activity that has a direct cause–effectrelationship with the resources consumed.
ABC first allocates costs to activity cost pools and then to the products based on each product'suse of those activities. The reasoning behind ABC cost allocation is simple: Products consumeactivities; activities consume resources.
ABC allocates overhead in a two‐stage process. In the first stage, overhead costs are allocated toactivity cost pools, rather than to departments. Each cost pool is a distinct type of activity (e.g.,ordering materials, setting up machines, assembling, and inspecting). In the second stage, theoverhead allocated to the activity cost pools is assigned to products using cost drivers. The costdrivers measure the number of individual activities undertaken or performed (e.g., number ofpurchase orders, number of setups, labor hours, or number of inspections) to produce productsor provide services. Examples of activities and the possible cost drivers that measure them areshown in Illustration 2 for a company that manufactures two products—axles and steering wheels.
Activities and related cost drivers
Managerial AccountingChapter 4
Page 215

In the first step (as shown at the top of the illustration), the company's overhead costs are allocatedto activity cost pools. In this simplified example, four activity cost pools have been identified:purchasing, storing, machining, and supervising. After the costs are allocated to the activity costpools, costs are assigned to the individual products (either axles or steering wheels) based oneach product's use of each activity as measured by the cost drivers. For example, if axles requiremore activity by the purchasing department, as measured by the number of required purchaseorders, then more of the overhead cost from the purchasing pool will be allocated to the axles.
As you might imagine, not all products or services share equally in these activities. The morecomplex a product's manufacturing operation, the more activities and cost drivers it is likely tohave. If there is little or no correlation between changes in the cost driver and consumption ofthe overhead cost, inaccurate product costs are inevitable.
The design of a more complex activity‐based costing system with seven activity cost pools isgraphically shown in Illustration 3 for Lift Jack Company. Lift Jack Company manufactures twoautomotive jacks—an automobile scissors jack and a truck hydraulic jack.
ABC system design—Lift Jack Company
The Lift Jack Company illustration contains seven activity cost pools. In some companies thenumber of activities related to a cost pool can be substantial. For example, at Clark‐Hurth (adivision of Clark Equipment Company), a manufacturer of axles and transmissions, over 170activities were identified; at Compumotor (a division of Parker Hannifin) over 80 activities wereidentified in just the procurement function of its Material Control Department.
Managerial AccountingChapter 4
Page 216

ILLUSTRATION OF TRADITIONAL COSTING VERSUS ABC
In this section we present a simple case example that compares traditional costing andactivity‐based costing and illustrates how ABC eliminates the distortion that can occur intraditional overhead cost allocation.
UNIT COSTS UNDER TRADITIONAL COSTING
Atlas Company produces two automobile antitheft devices, The Boot and The Club. The Boot isa high‐volume item totaling 25,000 units annually. The Club is a low‐volume item totaling only5,000 units per year. Each product requires one hour of direct labor for completion. Therefore,total annual direct labor hours are 30,000 (25,000 + 5,000). Expected annual manufacturingoverhead costs are $900,000. Thus, the predetermined overhead rate is $30 ($900,000 ÷ 30,000)per direct labor hour.
The direct materials cost per unit is $40 for The Boot and $30 for The Club. The direct labor costis $12 per unit for each product. The computation of the unit cost for The Boot and The Clubunder traditional costing is shown in Illustration 4.
Computation of unit costs—traditional costing
UNIT COSTS UNDER ABC
Let's now calculate unit costs under ABC, in order to compare activity‐based costing with atraditional costing system. Activity‐based costing involves the following four steps.
1. Identify and classify the major activities involved in the manufacture of specificproducts, and allocate manufacturing overhead costs to the appropriate activity costpools.
2. Identify the cost driver that has a strong correlation to the costs accumulated in theactivity cost pool.
Managerial AccountingChapter 4
Page 217

3. Compute the activity‐based overhead rate per cost driver.
4. Assign manufacturing overhead costs for each activity cost pool to products, usingthe activity‐based overhead rates (cost per driver).
Step 1—Identify and Classify Activities and Allocate Overhead to Cost Pools
A well‐designed activity‐based costing system starts with an analysis of the activities performedto manufacture a product or provide a service. This analysis should identify allresource‐consuming activities. It requires a detailed, step‐by‐step walk‐through of each operation,documenting every activity undertaken to accomplish a task. Atlas Company identified threeactivity‐cost pools: setting up machines, machining, and inspecting.
Next, overhead costs are assigned directly to the appropriate activity cost pool. For example, alloverhead costs directly associated with Atlas Company's machine setups (such as salaries,supplies, and depreciation) would be assigned to the machine setup cost pool. These activity costpools, along with the estimated overhead allocated to each activity cost pool, are shown inIllustration 5.
Activity cost pools and estimated overhead
Step 2—Identify Cost Drivers
After costs are allocated to the activity cost pools, the cost drivers for each activity cost pool mustbe identified. The cost driver must accurately measure the actual consumption of the activity bythe various products. To achieve accurate costing, a high degree of correlationmust exist betweenthe activity cost driver and the actual consumption of the overhead costs in the activity cost pool.
The cost drivers identified by Atlas and their total expected use per activity cost pool are shownin Illustration 6.
Managerial AccountingChapter 4
Page 218

Cost drivers and their expected use
Availability and ease of obtaining data relating to the activity cost driver is an important factorthat must be considered in its selection.
Step 3—Compute Overhead Rates
Next, an activity‐based overhead rate per cost driver is computed by dividing the estimatedoverhead per activity by the number of cost drivers expected to be used per activity. The formulafor this computation is shown in Illustration 7.
Formula for computing activity‐based overhead rate
Atlas Company computes its activity‐based overhead rates by using total estimated overheadper activity cost pool, shown in Illustration 5, and the total expected use of cost drivers peractivity, shown in Illustration 6. The computations are presented in Illustration 8.
Managerial AccountingChapter 4
Page 219

Computation of activity‐based overhead rates
Step 4—Assign Overhead Costs to Products under ABC
In assigning overhead costs, it is necessary to know the expected use of cost drivers for eachproduct. Because of its low volume, The Club requires more setups and inspections than TheBoot. The expected use of cost drivers per product for each of Atlas's products is shown inIllustration 9.
Expected use of cost drivers per product
To assign overhead costs to each product, the activity‐based overhead rates per cost driver(Illustration 8) are multiplied by the number of cost drivers expected to be used per product(Illustration 9). The amount of overhead cost assigned to each product for Atlas Company isshown in Illustration 10.
Managerial AccountingChapter 4
Page 220

Assignment of activity cost pools to products
These data show that under ABC, overhead costs are shifted from the high‐volume product (TheBoot) to the low‐volume product (The Club). This shift results in more accurate costing for tworeasons:
1. Low‐volume products often require more special handling, such as more machinesetups and inspections, than high‐volume products. This is true for Atlas Company.Thus, the low‐volume product frequently is responsible for more overhead costs perunit than is a high‐volume product.1
2. Assigning overhead using ABC will usually increase the cost per unit for low‐volumeproducts. Therefore, a traditional overhead allocation such as direct labor hours isusually a poor cost driver for assigning overhead costs to low‐volume products.
COMPARING UNIT COSTS
A comparison of unit manufacturing costs under traditional costing and ABC shows the followingsignificant differences.
Managerial AccountingChapter 4
Page 221

Comparison of unit product costs
The comparison shows that unit costs under traditional costing are significantly distorted. Thecost of producing The Boot is overstated $13 per unit ($82 − $69), and the cost of producing TheClub is understated $65 per unit ($137 − $72). These differences are attributable entirely to howmanufacturing overhead is assigned. A likely consequence of the differences in assigning overheadis that Atlas Company has been overpricing The Boot and possibly losing market share tocompetitors. Moreover, it has been sacrificing profitability by underpricing The Club.
International Perspective
Activity‐based costing was pioneered in the United States: John Deere Company coined theterm less than 25 years ago. Although ABC has been adopted by numerous well‐known U.S.companies including IBM, AT&T, Hewlett‐Packard, Procter and Gamble, Tektronix, HughesAircraft, Caterpillar, American Express, and Compaq Computer, its use outside the U.S. islimited. The cost of implementation may discourage some foreign companies.
In Japan, where activity‐based costing is less used, companies prefer volume measures suchas direct labor hours to assign overhead cost to products. Japanese managers are convincedthat reducing direct labor is essential to continuous cost reduction. And, using direct laboras the basis for overhead allocation forces Japanese companies to watch direct labor moreclosely. Possibly, labor cost reduction is more of a priority than developing more accurateproduct costs.
Managerial AccountingChapter 4
Page 222

Before You Go On...
Review It
1. Historically, why has direct labor hours been the most popular basis for allocatingoverhead costs to products?
2. What changes have occurred in the industrial environment to diminish the appealof traditional volume‐based overhead allocation systems?
3. What four steps are involved in developing an ABC system?
Do It
1. Lift Jack Company, as shown in Illustration 3, page 143, has seven activity cost poolsand two products. It expects to produce 200,000 units of its automobile scissors jack,and 80,000 units of its truck hydraulic jack. Having identified its activity cost poolsand the cost drivers for each cost pool, Lift Jack Company accumulated the followingdata relative to those activity cost pools and cost drivers.
LIFT JACK COMPANYExpected use of Cost Drivers
per ProductAnnual Overhead Data
HydraulicJacks
ScissorsJacks
Expected Useof Cost
Drivers perActivity
EstimatedOverheadCost Drivers
Activity CostPools
1,5001,0002,500 orders$ 200,000Purchaseorders
Ordering andreceiving
7005001,200 setups600,000SetupsMachine setup500,000300,000800,000 hours2,000,000Machine
hoursMachining
1,200,0001,800,0003,000,000 parts1,800,000PartsAssembling15,00020,00035,000
inspections700,000InspectionsInspecting and
testing1,200,0001,800,0003,000,000 parts300,000PartsPainting
70,000130,000200,000 hours1,200,000Labor hoursSupervising$6,800,000
Using the above data, do the following: (a) Prepare a schedule showing thecomputations of the activity‐based overhead rates per cost driver. (b) Prepare aschedule assigning each activity's overhead cost to the two products. (c) Computethe overhead cost per unit for each product. (d) Comment on the comparativeoverhead cost per unit.
Managerial AccountingChapter 4
Page 223

Action Plan
• Determine the activity‐based overhead rate by dividing the estimated overheadper activity by the expected use of cost drivers per activity.
• Assign the overhead of each activity cost pool to the individual products bymultiplying the expected use of cost driver per product times the activity‐basedoverhead rate.
• Determine overhead cost per unit by dividing the overhead assigned to eachproduct by the number of units of that product.
Related exercise material: BE4‐1, BE4‐2, BE4‐3, BE4‐4, BE4‐5, E4‐1, E4‐2, E4‐3, E4‐4, E4‐5, E4‐6,E4‐7, and E4‐8.
ACTIVITY‐BASED COSTING: A CLOSER LOOK
As the use of activity‐based costing has grown, both its practical benefits and its limitations havenow become apparent.
BENEFITS OF ABC
The primary benefit of ABC is more accurate product costing. Here's why:
1. ABC leads to more cost pools used to assign overhead costs to products. Instead ofone plantwide pool (or even departmental pools) and a single cost driver, numerousactivity cost pools with more relevant cost drivers are utilized. Costs are assigned moredirectly on the basis of the number of cost drivers used to produce each product.
2. ABC leads to enhanced control over overhead costs. Under ABC, many overheadcosts can be traced directly to activities—some indirect costs can instead be identifiedas direct costs. Thus, managers have become more aware of their responsibility tocontrol the activities that generate those costs.
3. ABC leads to better management decisions.More accurate product costing shouldcontribute to setting selling prices that can help achieve desired product profitabilitylevels. In addition, the more accurate cost data could be helpful in deciding whetherto make or buy a product part or component, and sometimes even whether to eliminatea product.
In fact, the determination of what activities drive costs has led to some costs, which werepreviously accounted for as indirect costs, being accounted for as direct costs. This is because,under ABC, these costs are traceable to specific activities.
Managerial AccountingChapter 4
Page 224

Activity‐based costing does not change the amount of overhead costs. What it does do, in certaincircumstances, is to allocate those overhead costs in a more accurate manner. Furthermore, if thescore‐keeping is more realistic, more accurate, and better understood, managers should be ableto better understand cost behavior and overall profitability.
LIMITATIONS OF ABC
Although ABC systems often provide better product cost data than traditional volume‐basedsystems, there are limitations:
1. ABC can be expensive to use.Many companies are discouraged from using ABC bythe increased cost of identifying multiple activities and applying numerous cost drivers.Activity‐based costing systems are more complex than traditional costingsystems—sometimes significantly more complex. So companies must ask, is the costof implementation greater than the benefits of greater accuracy? Sometimes it may be.For some companies there may be no need to consider ABC at all because their existingsystem is sufficient. If the costs of ABC outweigh the benefits, then the company shouldnot implement ABC.
2. Some arbitrary allocations continue.Even though more overhead costs can be assigneddirectly to products through ABC's multiple activity cost pools, certain overhead costsremain to be allocated by means of some arbitrary volume‐based cost driver such aslabor or machine hours.
Service Company Perspective
Although most publicized ABC applications are in manufacturing companies or large servicefirms, ABC can be applied in a very small service business. Mahany Welding Supply, a smallfamily‐run welding service business in Rochester, NY, applied ABC to determine the costof servicing customers and to identify feasible cost reduction opportunities.
Application of ABC at Mahany Welding's operations provided information about the fiveemployees who are involved in different activities of revenue generation—i.e., delivery ofsupplies (rural versus city), welding services, repairs, telephone sales, field or door‐to‐doorsales, repeat business sales, and cold‐call sales. Activity cost pools were assigned to the fiverevenue‐producing employees using relevant cost drivers. ABC revealed annual net income(loss) by employee as follows: Employee #1, $65,431; Employee #2, $35,154; Employee #3,$13,731; Employee #4, ($10,957); Employee #5, ($46,180). This comparative information wasan eye‐opener to the owner of Mahany Welding—who was Employee #5!Source: Michael Krupnicki and Thomas Tyson, “Using ABC to Determine the Cost of Servicing Customers,”Management Accounting, December 31, 1997, pp. 40–46.
Managerial AccountingChapter 4
Page 225

WHEN TO SWITCH TO ABC
Activity‐based costing is a useful tool and under certain conditions is the appropriate costingsystem to use. How does a company know when to switch to ABC? The presence of one or moreof the following factors would point to ABC as the superior costing system:
1. Product lines differ greatly in volume and manufacturing complexity.
2. Product lines are numerous, diverse, and require differing degrees of support services.
3. Overhead costs constitute a significant portion of total costs.
4. The manufacturing process or the number of products has changed significantly—forexample, from labor‐intensive to capital‐intensive due to automation.
5. Production or marketing managers are ignoring data provided by the existing systemand are instead using “bootleg” costing data or other alternative data when pricing ormaking other product decisions.
The redesign and installation of a new product‐costing system is a significant decision thatrequires considerable cost and a major effort to accomplish. Therefore, financial managers needto be very cautious and deliberative when initiating changes in costing systems. A key factor inimplementing a successful ABC system is the support of top management.
VALUE-ADDED VERSUS NONVALUE-ADDED ACTIVITIES
Some companies that have experienced the benefits of activity‐based costing have applied it toa broader range of management activities. Activity‐based management (ABM) is an extensionof ABC from a product costing system to a management function that focuses on reducing costsand improving processes and decision making. A refinement of activity‐based costing used inABM is the classification of activities as either value‐added or nonvalue‐added.
Value‐added activities increase the worth of a product or service to customers; they involveresource usage and related costs that customers are willing to pay for. Value‐added activities arethe functions of actually manufacturing a product or performing a service—they increase theworth of the product or service. Examples of value‐added activities in a manufacturing operationare engineering design, machining, assembly, painting, and packaging. Examples of value‐added
Managerial AccountingChapter 4
Page 226

activities in a service company would be performing surgery, providing legal research for legalservices, or delivering packages by a delivery service.
Nonvalue‐added activities are production‐ or service‐related activities that simply add cost to,or increase the time spent on, a product or service without increasing its market value. Examplesof nonvalue‐added activities in a manufacturing operation include the repair of machines; thestorage of inventory; the moving of raw materials, assemblies, and finished product within thefactory; building maintenance; inspections; and inventory control. Examples of nonvalue‐addedactivities in service enterprises might include taking appointments, reception, bookkeeping,billing, traveling, ordering supplies, advertising, cleaning, and computer repair.
After activities are identified and classified in Step 1 of implementing ABC, it should be determinedwhether the activities are value‐added or nonvalue‐added. Illustration 12 shows an activityflowchart. Activity flowcharts are often used to help identify the activities that will be used inABC costing. In the top part of this flowchart, activities are identified as value‐added ornonvalue‐added. The value‐added activities are highlighted in red, while the nonvalue‐addedactivities are highlighted in blue.
Flowchart showing value‐added and nonvalue‐added activities
In the lower part of the flowchart there are two rows showing the number of days spent on eachactivity. The first row shows the number of days spent on each activity under the currentmanufacturing process. The second row shows the number of days spent on each activity undermanagement's proposed reengineered manufacturing process. The proposed changes wouldreduce time spent on nonvalue‐added activities by 17 days. This 17‐day improvement would bedue entirely to moving inventory more quickly through the nonvalue‐added processes—that is,by reducing inventory time in moving, storage, and waiting.
Not all activities labeled nonvalue‐added are totally wasteful, nor can they be totally eliminated.For example, although inspection time is a nonvalue‐added activity from a customer's perspective,few companies would eliminate their quality control functions. Similarly, moving and waiting
Managerial AccountingChapter 4
Page 227

time is nonvalue‐added, but it would be impossible to completely eliminate. Nevertheless, whenmanagers recognize the nonvalue‐added characteristic of these activities, they are motivated tominimize them as much as possible. Attention to such matters is part of the growing practice ofactivity‐based management which helps managers concentrate on continuous improvement ofoperations and activities.
Management Perspective
Often the best way to improve a process is to learn from observing a different process. Atthe giant food producer General Mills, production line technicians were flown to NorthCarolina to observe first‐hand how race‐car pit crews operate. In a NASCAR car race, thevalue‐added activity is driving toward the finish‐line; any time spent in the pit isnonvalue‐added. Every split second saved in the pit increases the chances of winning. Fromwhat the General Mills technicians learned at the car race, as well as other efforts, they wereable to reduce set‐up time from 5 hours to just 20 minutes.
ACTIVITY‐BASED COSTING IN SERVICE INDUSTRIES
Although initially developed and implemented by manufacturing companies that produceproducts, activity‐based costing has been widely adopted in service industries as well. ABC hasbeen found to be a useful tool in such diverse industries as airlines, railroads, hotels, hospitals,banks, insurance companies, telephone companies, and financial services firms. The overallobjective of installing ABC in service firms is no different than it is in a manufacturing company.That objective is to identify the key activities that generate costs and to keep track of how manyof those activities are performed for each service provided (by job, service, contract, or customer).
The general approach to identifying activities, activity cost pools, and cost drivers is used by aservice company in the same manner as a manufacturing company. Also, the labeling of activitiesas value‐added and nonvalue‐added and the attempt to reduce or eliminate nonvalue‐addedactivities as much as possible is just as valid in service industries as in manufacturing operations.What sometimes makes implementation of activity‐based costing difficult in service industriesis that a larger proportion of overhead costs are company‐wide costs that cannot be directlytraced to specific services provided by the company.
To illustrate the application of activity‐based costing to a service enterprise, contrasted totraditional costing, we use a public accounting firm. This illustration is equally applicable to alaw firm, consulting firm, architect, or any service firm that performs numerous services for aclient as part of a job.
Managerial AccountingChapter 4
Page 228

TRADITIONAL COSTING EXAMPLE
Assume that the public accounting firm of Check and Doublecheck prepares the followingcondensed annual budget (see Illustration 13).
Condensed annual budget of a service firm under traditional costing
Under traditional costing direct labor is the professional service performed, and it is the basisfor overhead application to each audit job. To determine the operating income earned on anyjob, Check and Doublecheck applies overhead at the rate of 200 percent of actual direct professionallabor costs incurred. For example, assume that the firm of Check and Doublecheck records $70,000of actual direct professional labor cost during its audit of Plano Molding Company, which wasbilled an audit fee of $260,000. Under traditional costing, using 200 percent as the rate for applyingoverhead to the job, applied overhead and operating income related to the Plano MoldingCompany audit would be computed as shown in Illustration 14.
Overhead applied under traditional costing system
In this example, only one direct cost item and one overhead application rate are used undertraditional costing.
Managerial AccountingChapter 4
Page 229

ACTIVITY-BASED COSTING EXAMPLE
Under activity‐based costing, Check and Doublecheck's estimated annual overhead costs of$1,200,000 are distributed to several activity cost pools. Activity‐based overhead rates per costdriver are computed by dividing each activity overhead cost pool by the expected number ofcost drivers used per activity. Illustration 15 shows an annual overhead budget using an ABCsystem.
Condensed annual budget of a service firm under activity‐based costing
Note that some of the overhead costs can be directly assigned (see telephone and postage).
The assignment of the individual overhead activity rates to the actual number of activities usedin the performance of the Plano Molding audit results in total overhead assigned of $165,100 asshown in Illustration 16.
Assigning overhead in a service company
Managerial AccountingChapter 4
Page 230

Under activity‐based costing, overhead costs of $165,100 are assigned to the Plano MoldingCompany audit, as compared to $140,000 under traditional costing. A comparison of total costsand operating margins is shown in Illustration 17.
Comparison of traditional costing with ABC in a service company
The comparison shows that the assignment of overhead costs under traditional costing is distorted.The total cost assigned to performing the audit of Plano Molding Company is greater underactivity‐based costing by $25,100, or 18 percent higher, and the profit margin is only half as great.Traditional costing gives the false impression of an operating profit of $50,000. This is more thandouble what it is at $24,900 using ABC.
Before You Go On...
Review It
1. What are the benefits of activity‐based costing?
2. What are the limitations of activity‐based costing?
3. What factors would indicate ABC as the superior costing system?
4. What is the benefit of classifying activities as value‐added and nonvalue‐added?
5. What is the primary barrier to effectively implementing ABC in a service companyenvironment?
Managerial AccountingChapter 4
Page 231

JUST‐IN‐TIME PROCESSING
The benefit of classifying activities as value‐added and nonvalue‐added is that managers knowwhich activities to eliminate or minimize in order to reduce costs without affecting productionefficiency or product quality. The activity analysis flowcharts shown in Illustration 12 revealedlots of inventory storage and waiting time at several places in the operation. These arenonvalue‐added activities. One way to minimize inventory storage and waiting time is toimplement a just‐in‐time processing system.
Traditionally, continuous process manufacturing has been based on a just‐in‐case philosophy:Inventories of raw materials are maintained just in case some items are of poor quality or a keysupplier is shut down by a strike. Similarly, subassembly parts are manufactured and stored justin case they are needed later in the manufacturing process. Finished goods are completed andstored just in case unexpected and rush customer orders are received. This philosophy oftenresults in a push approach in which raw materials and subassembly parts are pushed througheach process. Traditional processing often results in the buildup of extensive manufacturinginventories.
Primarily in response to foreign competition, many U.S. firms have switched to just‐in‐time (JIT)processing. JIT manufacturing is dedicated to having the right amount of materials, products,or parts at the time they are needed. Under JIT processing, raw materials are received just intime for use in production, subassembly parts are completed just in time for use in finishedgoods, and finished goods are completed just in time to be sold. Illustration 18 shows the sequenceof activities in just‐in‐time processing.
Managerial AccountingChapter 4
Page 232

Just‐in‐time processing
OBJECTIVE OF JIT PROCESSING
A primary objective of JIT is to eliminate all manufacturing inventories. Inventories are consideredto have an adverse effect on net income because they tie up funds and storage space that couldbe made available for more productive purposes. JIT strives to eliminate inventories by using ademand‐pull approach in manufacturing. This approach begins with the customer placing anorder with the company. This order, which indicates product demand, starts the process of pullingthe product through the manufacturing process. A signal is sent via a computer to the nextpreceding work station indicating the exact materials (parts and subassemblies) needed for atime period, such as an eight‐hour shift, to complete the production of a specified product. Thepreceding process, in turn, sends its signal to other preceding processes. The goal is a smoothcontinuous flow in the manufacturing process, with no buildup of inventories at any point.
ELEMENTS OF JIT PROCESSING
There are three important elements in JIT processing:
1. A company must have dependable suppliers who are willing to deliver on short noticeexact quantities of raw materials according to precise quality specifications. (This mayeven include multiple deliveries within the same day.) Suppliers must also be willingto deliver the raw materials at specified work stations rather than at a central receivingdepartment. This type of purchasing requires constant and direct communication withsuppliers, which is facilitated by an online computer linkage between the companyand its suppliers.
Managerial AccountingChapter 4
Page 233

2. A multiskilled work force must be developed. Under JIT, machines are oftenstrategically grouped into work cells or centers and much of the work is automated.As a result, one worker may have the responsibility to operate and maintain severaldifferent types of machines.
3. A total quality control system must be established throughout the manufacturingoperations. Total quality control means no defects. Since only required quantities aresignaled by the demand‐pull approach, any defects at a work station will shut downoperations at subsequent work stations. Total quality control requires continuousmonitoring by both employees and supervisors at each work station.
Management Perspective
JIT first hit the USA in the early 1980s when it was adopted by automobile companies tohelp compete with foreign competition. It is now being successfully used in many companies,including General Electric, Caterpillar, and Harley‐Davidson. The effects in most cases havebeen dramatic. For example, after using JIT for two years, a major division of Hewlett‐Packardfound that work‐in‐process inventories (in dollars) were down 82 percent, scrap/reworkcosts were down 30 percent, space utilization was down 40 percent, and labor efficiencyimproved 50 percent. As indicated, JIT not only reduces inventory but also enables amanufacturer to produce a better product faster and with less waste.
BENEFITS OF JIT PROCESSING
The major benefits of implementing JIT processing are:
1. Manufacturing inventories are significantly reduced or eliminated.
2. Product quality is enhanced.
3. Rework costs and inventory storage costs are reduced or eliminated.
4. Production cost savings are realized from the improved flow of goods through theprocesses.
One of the major accounting benefits of JIT is the elimination of separate raw materials andwork‐in‐process inventory accounts. These accounts are replaced by one account called Raw andIn‐Process Inventory. All materials and conversion costs are charged to this account. Due to thereduction (or elimination) of in‐process inventories, the computation of equivalent units ofproduction is simplified.
Managerial AccountingChapter 4
Page 234

Before You Go On...
Review It
1. What is the difference between the push approach and the demand‐pull approachto handling inventories in a manufacturing operation?
2. What are the major benefits of implementing JIT?
3. What are the principal accounting effects of just‐in‐time processing?
Managerial AccountingChapter 4
Page 235

USING THE DECISION TOOLKIT
Precor Company manufactures a line of high‐end exercise equipment of commercial quality.Assume that the chief accountant has proposed changing from a traditional costing systemto an activity‐based costing system. The financial vice‐president is not convinced, so sherequests that the next large order for equipment be costed under both systems for purposesof comparison and analysis. An order from Slim‐Way Salons, Inc., for 150 low‐impacttreadmills is received and is identified as the order to be subjected to dual costing. Thefollowing cost data relate to the Slim‐Way order.
Data relevant to both costing systems$55,500Direct materials
820Direct labor hours$18.00Direct labor rate per hour
Data relevant to the traditional costing systemPredetermined overhead rate is 300% of direct labor cost.
Data relevant to the activity‐based costing system
Expected Use ofCost Drivers per
TreadmillActivity‐BasedOverhead RateCost DriversActivity Cost Pools
330$30 per hourEngineering hoursEngineering design22$200 per setupSetupsMachine setup732$25 per hourMachine hoursMachining
1,450$8 per subassemblyNumber ofsubassemblies
Assembly
152$15 per hoursPackaging/shippinghour
Packaging andshipping
732$6 per hourMachine hoursBuilding occupancy
Instructions
1. Compute the total cost of the Slim‐Way Salons, Inc. order under (a) the traditionalcosting system and (b) the activity‐based costing system. (c) As a result of thiscomparison, which costing system is Precor likely to adopt? Why?
Managerial AccountingChapter 4
Page 236

Summary of Study Objectives
1. Recognize the difference between traditional costing and activity-based costing. Atraditional costing system allocates overhead to products on the basis ofpredetermined plantwide or departmentwide volume of unit‐based output ratessuch as direct labor or machine hours. An ABC system allocates overhead to identifiedactivity cost pools, and costs are then assigned to products using related cost driversthat measure the activities (resources) consumed.
2. Identify the steps in the development of an activity-based costing system. Thedevelopment of an activity‐based costing system involves four steps: (1) Identifyand classify the major activities that pertain to the manufacture of specific products,and allocate manufacturing overhead costs to the appropriate cost pools. (2) Identifythe cost driver that has a strong correlation to the costs accumulated in the activitycost pool. (3) Compute the activity‐based overhead rate per cost driver. (4) Assignoverhead costs for each activity cost pool to products or services using the costdrivers.
3. Know how companies identify the activity cost pools used in activity-based costing.To identify activity cost pools, a company must perform an analysis of each operationor process, documenting and timing every task, action, or transaction.
4. Know how companies identify and use the activity cost drivers in activity-basedcosting. Cost drivers identified for assigning activity cost pools must (a) accuratelymeasure the actual consumption of the activity by the various products, and (b)have related data easily available.
5. Understand the benefits and limitations of activity-based costing. What makesABC a more accurate product costing system is: (1) the increased number of costpools used to assign overhead, (2) the enhanced control over overhead costs, and(3) the better management decisions it makes possible. The limitations of ABC are:(1) the higher analysis and measurement costs that accompany multiple activitycenters and cost drivers, and (2) the necessity still to allocate some costs arbitrarily.
6. Differentiate between value-added and nonvalue-added activities. Value‐addedactivities increase the worth of a product or service. Nonvalue‐added activitiessimply add cost to, or increase the time spent on, a product or service withoutincreasing its market value. Awareness of these classifications encourages managersto reduce or eliminate the time spent on the nonvalue‐added activities.
7. Apply activity-based costing to service industries. The overall objective of usingABC in service industries is no different than for manufacturing industries, that is,improved costing of services provided (by job, service, contract, or customer). Thegeneral approach to costing is the same: analyze operations, identify activities,
Managerial AccountingChapter 4
Page 237

accumulate overhead costs by activity cost pools, and identify and use cost driversto assign the cost pools to the services.
8. Explain just-in-time (JIT) processing. JIT is a processing system that is dedicated tohaving on hand the right materials and products at the time they are needed, therebyreducing the amount of inventory and the time inventory is held. One of the principalaccounting effects is that one account, Raw and In‐Process Inventory, replaces boththe raw materials and work‐in‐process inventory accounts.
APPENDIX 4A HIERARCHY OF ACTIVITY LEVELS
As mentioned in the chapter, traditional costing systems are volume‐driven—driven by unit‐basedcost drivers such as direct labor or machine hours. Some activity costs are strictly variable andare caused by the production or acquisition of a single unit of product or the performance of asingle unit of service. However, the recognition that other activity costs are not driven byunit‐based cost drivers has led to the development of a hierarchy of ABC activities, consistingof four levels. The four levels of activities are classified and defined as follows.
1. Unit‐level activities. These are performed for each unit of production.
2. Batch‐level activities. These are performed for each batch of products rather than eachunit.
3. Product‐level activities. These are performed in support of an entire product line, butare not always performed every time a new unit or batch of products is produced.
Managerial AccountingChapter 4
Page 238

4. Facility‐level activities. These are required to support or sustain an entire productionprocess.
Greater accuracy in overhead cost allocation may be achieved by recognizing these four differentlevels of activities and, from them, developing specific activity cost pools and their related costdrivers. Illustration 4A‐1 graphically displays this four‐level activity hierarchy, along with thetypes of activities and examples of costs traceable to those activities at each level.
Figure 4A‐1 Hierarchy of Activity Levels
This hierarchy provides managers and accountants a structured way of thinking about therelationships between activities and the resources they consume. In contrast, traditionalvolume‐based costing recognizes only unit‐level costs. Failure to recognize this hierarchy ofactivities is one of the reasons that volume‐based cost allocation causes distortions in productcosting.
As indicated earlier, allocating all overhead costs by unit‐based cost drivers can send false signalsto managers: Dividing batch‐, product‐, or facility‐level costs by the number of units produced
Managerial AccountingChapter 4
Page 239

gives the mistaken impression that these costs vary with the number of units. The resourcesconsumed by batch‐, product‐, and facility‐level supporting activities do not vary at the unitlevel, nor can they be controlled at the unit level. The number of activities performed at the batchlevel goes up as the number of batches rises—not as the number of units within the batcheschanges. Similarly, the number of product‐level activities performed depends on the number ofdifferent products—not on how many units or batches are produced. Furthermore,facility‐sustaining activity costs are not dependent upon the number of products, batches, orunits produced. Batch‐, product‐, and facility‐level costs can be controlled only by modifyingbatch‐, product‐, and facility‐level activities.
Before You Go On...
Review It
1. How is the differentiation of activities into unit‐level, batch‐level, product‐level, andfacility‐level important to managers?
Do It
1. Morgan Toy Company manufactures six primary product lines in its Morganvilleplant. As a result of an activity analysis, the accounting department has identifiedeight activity cost pools. Each of the toy products is produced in large batches, withthe whole plant devoted to one product at a time. Classify each of the followingactivities as either unit‐level, batch‐level, product‐level, or facilitylevel: (a) engineeringdesign, (b) machine setup, (c) inventory management, (d) plant cafeteria, (e)inspections after each setup, (f) polishing parts, (g) assembling parts, (h) health andsafety.
Action Plan
• Recall that:
Unit‐level activities are performed for each individual unit of product.
Batch‐level activities are performed each time a batch of a product is produced.
Product‐level activities are performed to support an entire product line.
Facility‐level activities support the production process across the entire rangeof products.
Related exercise material: BE4‐9, BE4‐10, E4‐12, and E4‐13.
Managerial AccountingChapter 4
Page 240

SUMMARY OF STUDY OBJECTIVE FOR APPENDIX 4A
9Understand the value of a hierarchy of activity levels to activity-based costing.Activitiesmay be classified as unit‐level, batch‐level, product‐level, and facility‐level. Unit‐, batch‐,product‐, and facility‐level overhead costs are controlled by modifying unit‐, batch‐, product‐,and facility‐level activities, respectively. Failure to recognize this hierarchy of levels canresult in distorted product costing.
Managerial AccountingChapter 4
Page 241
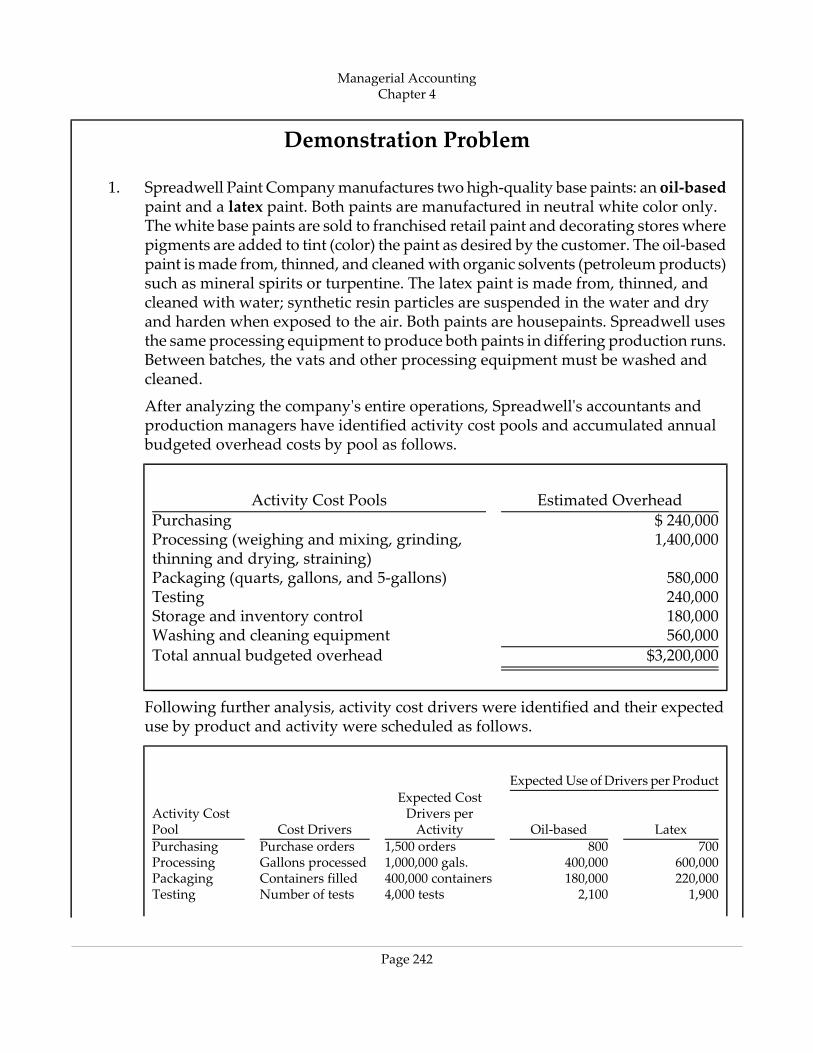
Demonstration Problem
1. Spreadwell Paint Company manufactures two high‐quality base paints: an oil‐basedpaint and a latex paint. Both paints are manufactured in neutral white color only.The white base paints are sold to franchised retail paint and decorating stores wherepigments are added to tint (color) the paint as desired by the customer. The oil‐basedpaint is made from, thinned, and cleaned with organic solvents (petroleum products)such as mineral spirits or turpentine. The latex paint is made from, thinned, andcleaned with water; synthetic resin particles are suspended in the water and dryand harden when exposed to the air. Both paints are housepaints. Spreadwell usesthe same processing equipment to produce both paints in differing production runs.Between batches, the vats and other processing equipment must be washed andcleaned.
After analyzing the company's entire operations, Spreadwell's accountants andproduction managers have identified activity cost pools and accumulated annualbudgeted overhead costs by pool as follows.
Estimated OverheadActivity Cost Pools$ 240,000Purchasing1,400,000Processing (weighing and mixing, grinding,
thinning and drying, straining)580,000Packaging (quarts, gallons, and 5‐gallons)240,000Testing180,000Storage and inventory control560,000Washing and cleaning equipment
$3,200,000Total annual budgeted overhead
Following further analysis, activity cost drivers were identified and their expecteduse by product and activity were scheduled as follows.
Expected Use of Drivers per Product
LatexOil‐based
Expected CostDrivers perActivityCost Drivers
Activity CostPool
7008001,500 ordersPurchase ordersPurchasing600,000400,0001,000,000 gals.Gallons processedProcessing220,000180,000400,000 containersContainers filledPackaging1,9002,1004,000 testsNumber of testsTesting
Managerial AccountingChapter 4
Page 242

Expected Use of Drivers per Product
LatexOil‐based
Expected CostDrivers perActivityCost Drivers
Activity CostPool
7,60010,40018,000 gals.Avg. gals. on handStoring450350800 batchesNumber of batchesWashing
Spreadwell has budgeted 400,000 gallons of oil‐based paint and 600,000 gallons oflatex paint for processing during the year.
Instructions
a. Prepare a schedule showing the computations of the activity‐based overheadrates.
b. Prepare a schedule assigning each activity's overhead cost pool to each product.
c. Compute the overhead cost per unit for each product.
d. Classify each activity cost pool as value‐added or nonvalue‐added.
Managerial AccountingChapter 4
Page 243

Solution to Demonstration Problem
a. Computations of activity‐based overhead rates:
SPREADWELL PAINT COMPANYActivity‐BasedOverhead Rates
=Expected Use of CostDrivers
÷Estimated OverheadActivity Cost Pools
$160 per order1,500 orders$ 240,000Purchasing$1.40 per gallon1,000,000 gallons1,400,000Processing
$1.45 per container400,000 containers580,000Packaging$60 per test4,000 tests240,000Testing
$10 per gallon18,000 gallons180,000Storing$700 per batch800 batches560,000Washing
$3,200,000
b. Assignment of activity cost pools to products:
SPREADWELL PAINT COMPANYLatex PaintOil‐Based Paint
Cost AssignedOverheadRates
Expected Useof Drivers
CostAssigned
OverheadRates
Expected Useof Drivers
Activity CostPools
$ 112,000$160700$ 128,000$160800Purchasing840,000$1.40600,000560,000$1.40400,000Processing319,000$1.45220,000261,000$1.45180,000Packaging114,000$601,900126,000$602,100Testing76,000$107,600104,000$1010,400Storing315,000$700450245,000$700350Washing
$1,424,000Total overhead assigned
c. Computation of overhead cost assigned per unit:
Latex PaintOil‐Based Paint$1,776,000$1,424,000Total overhead cost
assigned600,000400,000Total gallons produced$2.96$3.56Overhead cost per gallon
d. Value‐added activities: processing and packaging Nonvalue‐added activities:purchasing, testing, storing, and washing
Managerial AccountingChapter 4
Page 244

Note: All asterisked Questions, Exercises, and Problems relate to material in the appendix to thechapter.
1Robin Cooper and Robert S. Kaplan, “How Cost Accounting Distorts Product Costs,”Management Accounting 69, No. 10 (April 1988), pp. 20–27.
SELF-STUDY QUESTIONSAnswers are at the end of the chapter.
1. Activity‐based costing (ABC):
a. can be used only in a process cost system.
b. focuses on units of production.
c. focuses on activities performed to produce a product.
d. uses only a single basis of allocation.
Hint:
( Study Objective 1)
2. Activity‐based costing:
a. is the initial phase of converting to a just‐in‐time operating environment.
b. can be used only in a job order costing system.
c. is a two‐stage overhead cost allocation system that identifies activity cost poolsand cost drivers.
d. uses direct labor as its primary cost driver.
Hint:
( Study Objective 1)
3. Any activity that causes resources to be consumed is called a:
a. just‐in‐time activity.
b. facility‐level activity.
c. cost driver.
d. nonvalue‐added activity.
Hint:
( Study Objective 3)
4. The overhead rate for Machine Setups is $100 per setup. Products A and B have 80and 60 setups, respectively. The overhead assigned to each product is:
Managerial AccountingChapter 4
Page 245

a. Product A $8,000, Product B $8,000.
b. Product A $8,000, Product B $6,000.
c. Product A $6,000, Product B $6,000.
d. Product A $6,000, Product B $8,000.
Hint:
( Study Objective 4)
5. Donna Crawford Co. has identified an activity cost pool to which it has allocatedestimated overhead of $1,920,000. It has determined the expected use of cost driversper that activity to be 160,000 inspections. Widgets require 40,000 inspections, Gadgets30,000 inspections, and Targets, 90,000 inspections. The overhead assigned to eachproduct is:
a. Widgets $40,000, Gadgets $30,000, Targets $90,000.
b. Widgets $480,000, Gadgets $360,000, Targets $108,000.
c. Widgets $360,000, Gadgets $480,000, Targets $1,080,000.
d. Widgets $480,000, Gadgets $360,000, Targets $1,080,000.
Hint:
( Study Objective 4)
6. An activity that adds costs to the product but does not increase its market value is a:
a. value‐added activity.
b. cost driver.
c. cost–benefit activity.
d. nonvalue‐added activity.
Hint:
( Study Objective 6)
7. The following activity is value‐added:
a. Storage of raw materials.
b. Moving parts from machine to machine.
c. Shaping a piece of metal on a lathe.
d. All of the above.
Hint:
( Study Objective 6)
Managerial AccountingChapter 4
Page 246

8. Under just‐in‐time processing:
a. raw materials are received just in time for use in production.
b. subassembly parts are completed just in time for use in assembling finished goods.
c. finished goods are completed just in time to be sold.
d. All of the above.
Hint:
( Study Objective 8)
9. The primary objective of just‐in‐time processing is to:
a. accumulate overhead in activity cost pools.
b. eliminate or reduce all manufacturing inventories.
c. identify relevant activity cost drivers.
d. identify value‐added activities.
Hint:
( Study Objective 8)
10. A relevant facility‐level cost driver for heating costs is:
a. machine hours.
b. direct material.
c. floor space.
d. direct labor cost.
Hint:
( Study Objective 9)
QUESTIONS1. Under what conditions is direct labor a valid basis for allocating overhead?
2. What has happened in recent industrial history to reduce the usefulness of direct laboras the primary basis for allocating overhead to products?
3. In an automated manufacturing environment, what basis of overhead allocation isfrequently more relevant than direct labor hours?
4. What is generally true about overhead allocation to high‐volume products versuslow‐volume products under a traditional costing system?
Managerial AccountingChapter 4
Page 247

5. a. What are the principal differences between activity‐based costing (ABC) andtraditional product costing?
b. What assumptions must be met for ABC costing to be useful?
6. What is the formula for computing activity‐based overhead rates?
7. What steps are involved in developing an activity‐based costing system?
8. Explain the preparation and use of an activity flowchart in an ABC system.
9. What is an activity cost pool?
10. What is a cost driver?
11. What makes a cost driver accurate and appropriate?
12. What is the formula for assigning activity cost pools to products?
13. What are the benefits of activity‐based costing?
14. What are the limitations of activity‐based costing?
15. Under what conditions is ABC generally the superior overhead costing system?
16. What refinement has been made to enhance the efficiency and effectiveness of ABCfor use in managing costs?
17. Of what benefit is classifying activities as value‐added and nonvalue‐added?
18. In what ways is the application of ABC to service industries the same as its applicationto manufacturing companies?
19. a. Describe the philosophy and approach of just‐intime processing.
b. Identify the major elements of JIT processing.
20. What is the relevance of the hierarchy of levels of activity to ABC?
BRIEF EXERCISESBE4‐1 Mynex Co. identifies the following activities that pertain to manufacturing overhead:
Materials Handling, Machine Setups, Factory Machine Maintenance, FactorySupervision, and Quality Control. For each activity, identify an appropriate costdriver.Hint:
Identify cost drivers.
( Study Objective 4)
BE4‐2 Multi‐Products Company manufactures four products in a single production facility.The company uses activity‐based costing. The following activities have been
Managerial AccountingChapter 4
Page 248

identified through the company's activity analysis: (a) inventory control, (b) machinesetups, (c) employee training, (d) quality inspections, (e) material ordering, (f)drilling operations, and (g) building maintenance. For each activity, name a costdriver that might be used to assign overhead costs to products.Hint:
Identify cost drivers.
( Study Objective 4)
BE4‐3 Martinez Company identifies three activities in its manufacturing process: machinesetups, machining, and inspections. Estimated annual overhead cost for each activityis $180,000, $325,000, and $70,000, respectively. The cost driver for each activityand the expected annual usage are: number of setups 2,000, machine hours 25,000,and number of inspections 1,750. Compute the overhead rate for each activity.Hint:
Compute activity‐based overhead rates.
( Study Objective 4)
BE4‐4 Hats Galore, Inc. uses activity‐based costing as the basis for information to set pricesfor its six lines of seasonal hats. Compute the activity‐based overhead rates usingthe following budgeted data for each of the activity cost pools.
Expected Use of Cost Driversper ActivityEstimated OverheadActivity Cost Pool
12,000 designer hours$ 450,000Designing160,000 machine hours4,000,000Sizing and cutting80,000 labor hours1,400,000Stitching and trimming32,000 finished units336,000Blocking and packing
Hint:
Compute activity‐based overhead rates.
( Study Objective 4)
BE4‐5 Electronic Parts, Inc., a manufacturer of woofers and chips for computers, employsactivity‐based costing. Compute activity‐based overhead rates from the followingbudgeted data for each of the activity cost pools.
Managerial AccountingChapter 4
Page 249

Expected Use of Cost Driversper ActivityEstimated OverheadActivity Cost Pool12,000 orders$ 90,000Ordering and receiving32,000 pounds96,000Annealing
60,000 machine hours447,000Etching440,000 labor hours1,298,000Soldering
28,000 boxes436,800Packing and shipping
Hint:
Compute activity‐based overhead rates.
( Study Objective 4)
BE4‐6 Norm Johnson Novelty Company identified the following activities in its productionand support operations. Classify each of these activities as either value‐added ornonvalue‐added.
a. Purchasing.
b. Receiving.
c. Design engineering.
d. Storing inventory.
e. Cost accounting.
f. Moving work‐in‐process.
g. Inspecting and testing.
h. Painting and packing.
Hint:
Classify activities as value‐ or nonvalue‐added.
( Study Objective 6)
BE4‐7 Loggers Construction Company, a builder of log cabins on order for farm machinerystorage, identifies the following six activities: (1) receiving and handling materials,(2) painting and maintaining scaffolding, (3) setting poles, (4) siding, (5) roofing,(6) inspecting. Classify each of their activities as value‐added or nonvalue‐added.Hint:
Classify activities as value‐ or nonvalue‐added.
( Study Objective 6)
BE4‐8 Ayala and Ortiz is an architectural firm that is contemplating the installation ofactivity‐based costing. The following activities are performed daily by staff
Managerial AccountingChapter 4
Page 250

architects. Classify these activities as value‐added or nonvalue‐added: (1) designingand drafting, 3 hours; (2) staff meetings, 1 hour; (3) on‐site supervision, 2 hours;(4) lunch, 1 hour; (5) consultation with client on specifications, 1.5 hours; (6)entertaining a prospective client for dinner, 2 hours.Hint:
Classify service company activities as value‐ or nonvalue‐added.
( Study Objective 6 Study Objective 7)
BE4‐9 Pete's Pix Center is a large film developing and processing center that serves 130outlets in grocery stores, service stations, camera and photo shops, and drug storesin 16 nearby towns. The Center operates 24 hours a day, 6 days a week. Classifyeach of the following activity costs of the Center as either unit‐level, batch‐level,product‐level, or facility‐level.
a. Developing fluids.
b. Photocopy paper.
c. Depreciation of machinery.
d. Setups for enlargements.
e. Supervisor's salary.
f. Ordering materials.
g. Pickup and delivery.
h. Commission to dealers.
i. Insurance on building.
j. Loading developing machines.
Hint:
Classify activities according to level.
( Study Objective 9)
BE4‐10 Mechanic's Aids Company operates 20 injection molding machines in the productionof tool boxes of four different sizes, named the Apprentice, the Handyman, theJourneyman, and the Professional. Classify each of the following costs as unit‐level,batch‐level, product‐level, or facility‐level.
a. First‐shift supervisor's salary.
b. Powdered raw plastic.
c. Dies for casting plastic components.
d. Depreciation on injection molding machines.
e. Changing dies on machines.
Managerial AccountingChapter 4
Page 251

f. Moving components to assembly department.
g. Engineering design.
h. Employee health and medical insurance coverage.
Hint:
Classify activities according to level.
( Study Objective 9)
EXERCISESE4‐1 Waring Corporation manufactures safes—large mobile safes, and large walk‐in
stationary bank safes. As part of its annual budgeting process, Waring is analyzingthe profitability of its two products. Part of this analysis involves estimating theamount of overhead to be allocated to each product line. The following informationrelates to overhead.
Walk‐in SafesMobile Safes50200Units planned for production200300Material moves per product line350450Purchase orders per product line
1,700700Direct labor hours per productline
Instructions
a. The total estimated manufacturing overhead was $237,000. Under traditionalcosting (which assigns overhead on the basis of direct‐labor hours), whatamount of manufacturing overhead costs are assigned to (do not round):
1. One mobile safe?
2. One walk‐in safe?
b. The total estimated manufacturing overhead of $237,000 was comprised of$150,000 for material‐handling costs and $87,000 for purchasing activity costs.Under activity‐based costing (ABC):
1. What amount of material handling costs are assigned to:
a. One mobile safe?
b. One walk‐in safe?
Managerial AccountingChapter 4
Page 252

2. What amount of purchasing activity costs are assigned to:
a. One mobile safe?
b. One walk‐in safe?
c. Compare the amount of overhead allocated to one mobile safe and to onewalk‐in safe under the traditional costing approach versus under ABC.
Hint:
Assign overhead using traditional costing and ABC.
( Study Objective 1 Study Objective 4)
E4‐2 Lieberman Clothing Company manufactures its own designed and labeled sportsattire and sells its products through catalog sales and retail outlets. While Liebermanhas for years used activity‐based costing in its manufacturing activities, it hasalways used traditional costing in assigning its selling costs to its product lines.Selling costs have traditionally been assigned to Lieberman's product lines at a rateof 60% of direct material costs. Its direct material costs for the month of March forLieberman's “high intensity” line of attire are $400,000. The company has decidedto extend activity‐based costing to its selling costs. Data relating to the “highintensity” line of products for the month of March are as follows.
Number of CostDrivers Used per
ActivityOverhead RatesCost DriverActivity Cost Pool$930,000$0.05 per dollar
salesDollar salesSales commissions
250$300 per minuteMinutesAdvertising—TV/Radio3,000$10 per column inchColumn inchesAdvertising—Newspaper60,000$2.50 per catalogCatalogs mailedCatalogs8,500$1 per catalog orderCatalog ordersCost of catalog sales
$930,000$0.03 per dollarsales
Dollar salesCredit andcollection
Instructions
a. Compute the selling costs to be assigned to the “high‐intensity” line of attirefor the month of March: (1) using the traditional product costing system (directmaterial cost is the cost driver), and (2) using activity‐based costing.
b. By what amount does the traditional product costing system undercost orovercost the “high‐intensity” product line?
Managerial AccountingChapter 4
Page 253

c. Classify each of the activities as value‐added or nonvalue‐added.
Hint:
Assign overhead using traditional costing and ABC; classify activities as value‐ or nonvalue‐added and by level.
( Study Objective 1 Study Objective 4 Study Objective 6)
E4‐3 Nutrition Products, Inc., uses a traditional product costing system to assign overheadcosts uniformly to all products. To meet Food and Drug Administrationrequirements and to assure its customers of safe, sanitary, and nutritious food,Nutrition engages in a high level of quality control. Nutrition assigns itsquality‐control overhead costs to all products at a rate of 18% of direct‐labor costs.Its direct‐labor cost for the month of June for its low‐calorie dessert line is $55,000.In response to repeated requests from its financial vice president, Nutrition'smanagement agrees to adopt activity‐based costing. Data relating to the low‐caloriedessert line for the month of June are as follows.
Number of CostDrivers Used per
ActivityOverhead RateCost DriverActivity Cost Pool6,000 pounds$0.60 per poundNumber of
poundsInspections ofmaterial received
10,000 servings$0.33 per servingNumber ofservings
In‐processinspections
400 orders$12.00 per orderCustomer ordersFDA certification
Instructions
a. Compute the quality‐control overhead cost to be assigned to the low‐caloriedessert product line for the month of June: (1) using the traditional productcosting system (direct labor cost is the cost driver), and (2) using activity‐basedcosting.
b. By what amount does the traditional product costing system undercost orovercost the low‐calorie dessert line?
c. Classify each of the activities as value‐added or nonvalue‐added.
Hint:
Assign overhead using traditional costing and ABC; classify activities as value‐ or nonvalue‐added and by level.
( Study Objective 1 Study Objective 4 Study Objective 6)
E4‐4 Quick Copies Company is a small printing and copying firm with three high‐speedoffset printing presses, five copiers (two color and three black and white), onecollator, one cutting and folding machine, and one fax machine. To improve its
Managerial AccountingChapter 4
Page 254

pricing practices, owner‐manager Morgan Hough is installing activity‐basedaccounting. Additionally, Morgan employs five employees: two printers/designers,one receptionist/bookkeeper, one sales and copy‐machine operator, and onejanitor/delivery clerk. Morgan can operate any of the machines and, in addition tomanaging the entire operation, he performs the training, designing, selling, andmarketing functions.
Instructions
As Quick Copies' independent accountant who prepares tax forms and quarterlyfinancial statements, you have been asked to identify the activities that would beused to accumulate overhead costs for assignment to jobs and customers. Usingyour knowledge of a small printing and copying firm (and some imagination),identify at least twelve activity cost pools as the start of an activity‐based costingsystem for Quick Copies Company.Hint:
Identify activity cost pools.
( Study Objective 3)
E4‐5 Gulino Corporation manufactures snowmobiles in its White Mountain, Wisconsinplant. The following costs are budgeted for the first quarter's operations.
$ 860,000Direct factory labor‐wages1,200,000Raw material and purchased components140,000Engineering design60,000Engineering development210,000Depreciation, plant520,000Depreciation, machinery15,000Machine setup, wages4,000Machine setup, supplies16,000Inspections4,000Tests
110,000Insurance, plant29,000Property taxes19,000Natural gas, heating21,000Electricity, plant lighting36,000Electricity, machinery17,000Custodial (machine maintenance) wages
Instructions
Classify the above costs of Gulino Corporation into activity cost pools using thefollowing: engineering, machinery, machine setup, quality control, utilities,
Managerial AccountingChapter 4
Page 255

maintenance. Next, identify a cost driver that may be used to assign each cost poolto each line of snowmobiles.Hint:
Identify activity cost pools and cost drivers.
( Study Objective 3 Study Objective 4)
E4‐6 Tommy Colina's Rijo Vineyards in Mendocino, California produces three varietiesof wine: Merlot, Viognier, and Pinot Noir. His winemaster, Richard Watson, hasidentified the following activities as cost pools for accumulating overhead andassigning it to products.
1. Culling and replanting. Dead or overcrowded vines are culled, and new vinesare planted or relocated. (Separate vineyards by variety.)
2. Trimming. At the end of the harvest the vines are cut and trimmed back inpreparation for the next season.
3. Tying. The posts and wires are reset, and vines are tied to the wires for thedormant season.
4. Spraying. The vines are sprayed with chemicals for protection against insectsand fungi.
5. Harvesting. The grapes are hand‐picked, placed in carts, and transported tothe crushers.
6. Stemming and crushing. Cartfuls of bunches of grapes of each variety areseparately loaded into machines which remove stems and gently crush thegrapes.
7. Pressing and filtering. The crushed grapes are transferred to presses whichmechanically remove the juices and filter out bulk and impurities.
8. Fermentation. The grape juice, by variety, is fermented in either stainless‐steeltanks or oak barrels.
9. Aging. The wines are aged in either stainless‐steel tanks or oak barrels for oneto three years depending on variety.
10. Bottling and corking. Bottles are machine‐filled and corked.
11. Labeling and boxing. Each bottle is labeled, as is each nine‐bottle case, withthe name of the vintner, vintage, and variety.
12. Storing. Packaged and boxed bottles are stored awaiting shipment.
13. Shipping. The wine is shipped to distributors and private retailers.
14. Maintenance of buildings and equipment. Printing, repairs, replacements,and general maintenance are performed in the off‐season.
Managerial AccountingChapter 4
Page 256

15. Heating and air‐conditioning of plant and offices.
Instructions
For each of Rijo's fifteen activity cost pools, identify a probable cost driver thatmight be used to assign overhead costs to its three wine varieties.Hint:
Identify activity cost drivers.
( Study Objective 4)
E4‐7 Andrea Boss, Inc. manufactures five models of kitchen appliances at its Vista plant.The company is installing activity‐based costing and has identified the followingactivities performed at its Vista plant.
1. Designing new models.
2. Purchasing raw materials and parts.
3. Receiving and inspecting raw materials and parts.
4. Storing and managing inventory.
5. Interviewing and hiring new personnel.
6. Machine forming sheet steel into appliance parts.
7. Manually assembling parts into appliances.
8. Maintaining and repairing machinery and equipment.
9. Insuring all tangible fixed assets.
10. Supervising production.
11. Training all employees of the company.
12. Painting and packaging finished appliances.
Having analyzed its Vista plant operations for purposes of installing activity‐basedcosting, Andrea Boss, Inc. identified its activity cost centers. It now needs to identifyrelevant activity cost drivers in order to assign overhead costs to its products.
Instructions
Using the activities listed above, identify for each activity one or more cost driversthat might be used to assign overhead to Andrea Boss's five products.Hint:
Identify activity cost drivers.
( Study Objective 4)
E4‐8 Fribourg Instrument, Inc. manufactures two products: missile range instrumentsand space pressure gauges. During April, 50 range instruments and 300 pressure
Managerial AccountingChapter 4
Page 257

gauges were produced, and overhead costs of $89,000 were incurred. An analysisof overhead costs reveals the following activities.
Total CostCost DriverActivity$35,000Number of requisitions1. Materials handling27,000Number of setups2. Machine setups27,000Number of inspections3. Quality inspections
The cost driver volume for each product was as follows.
TotalGaugesInstrumentsCost Driver1,000600400Number of requisitions500300200Number of setups600400200Number of inspections
Instructions
a. Determine the overhead rate for each activity.
b. Assign the manufacturing overhead costs for April to the two products usingactivity‐based costing.
c.
Write a memorandum to the president of Fribourg Instrument explaining thebenefits of activity‐based costing.
Hint:
Compute overhead rates and assign overhead using ABC.
( Study Objective 4 Study Objective 5)
E4‐9 In an effort to expand the usefulness of its activity‐based costing system, TommyColina's Rijo Vineyards decides to adopt activity‐based management techniques.One of these ABM techniques is qualifying its activities as either value‐added ornonvalue‐added.
Instructions
Using Rijo's list of fifteen activity cost pools in Exercise 4‐6, classify each of theactivities as either value‐added or nonvalue‐added.Hint:
Classify activities as value‐added or nonvalue‐added.
( Study Objective 6)
Managerial AccountingChapter 4
Page 258

E4‐10 Andrea Boss, Inc. is interested in using its activity‐based costing system to improveits operating efficiency and its profit margins by applying activity‐basedmanagement techniques. As part of this undertaking, you have been asked toclassify its Vista plant activities as value‐added or nonvalue‐added.
Instructions
Using the list of activities identified in Exercise 4‐7, classify each activity as eithervalue‐added or nonvalue‐added.Hint:
Classify activities as value‐added or nonvalue‐added.
( Study Objective 6)
E4‐11 Cheatham and Howe is a law firm that is initiating an activity‐based costing system.Jim Cheatham, the senior partner and strong supporter of ABC, has prepared thefollowing list of activities performed by a typical attorney in a day at the firm.
HoursActivity1.0Writing contracts and letters0.5Attending staff meetings1.5Taking depositions1.0Doing research1.0Traveling to/from court1.0Contemplating legal strategy1.0Eating lunch2.5Litigating a case in court1.5Entertaining a prospective client
Instructions
Classify each of the activities listed by Jim Cheatham as value‐added ornonvalue‐added; be able to defend your classification. How much was value‐addedtime and how much was nonvalue‐added?Hint:
Classify service company activities by level.
( Study Objective 6 Study Objective 7)
E4‐12 Having itemized its costs for the first quarter of next year's budget, GulinoCorporation desires to install an activity‐based costing system. First it identifiedthe activity cost pools in which to accumulate factory overhead; second, it identifiedthe relevant cost drivers. (This was done in Exercise 4‐5.)
Instructions
Managerial AccountingChapter 4
Page 259

Using the activity cost pools identified in Exercise 4‐5, classify each of those costpools as either unit‐level, batch‐level, product‐level, or facility‐level.Hint:
Classify activities by level.
( Study Objective 9)
E4‐13 Paul DiGiovanni & Sons, Inc. is a small manufacturing company in Balboa thatuses activity‐based costing. DiGiovanni & Sons accumulates overhead in thefollowing activity cost pools.
1. Managing parts inventory.
2. Hiring personnel.
3. Purchasing.
4. Designing products.
5. Testing prototypes.
6. Setting up equipment.
7. Inspecting machined parts.
8. Training employees.
9. Machining.
10. Assembling.
Instructions
For each activity cost pool, indicate whether the activity cost pool would beunit‐level, batch‐level, product‐level, or facility‐level.Hint:
Classify activities by level.
( Study Objective 9)
PROBLEMS: SET AP4‐1A Curly‐Soo, Inc. manufactures hair curlers and blow‐dryers. The handheld hair
curler is Curly‐Soo's high volume product (80,000 units annually). It is a “largebarrel,” 20‐watt, triple‐heat appliance designed to appeal to the teenage marketsegment with its glow‐in‐the‐dark handle. The handheld blow‐dryer is Curly‐Soo'slower‐volume product (40,000 units annually). It is a three‐speed, 2,000 wattappliance with a “cool setting” and a removable filter. It also is designed for theteen market.
Managerial AccountingChapter 4
Page 260

Both products require one hour of direct labor for completion. Therefore, totalannual direct labor hours are 120,000, (80,000 + 40,000). Expected annualmanufacturing overhead is $441,600. Thus, the predetermined overhead rate is$3.68 per direct labor hour. The direct materials cost per unit is $5.25 for the haircurler and $9.75 for the blow‐dryer. The direct labor cost is $8.00 per unit for thehair curler and the blow‐dryer.
Curly‐Soo purchases most of the parts from suppliers and assembles the finishedproduct at its Fargo, North Dakota plant. It recently adopted activity‐based costing,which after this year‐end will totally replace its traditional direct labor‐based costaccounting system. Curly‐Soo has identified the following six activity cost poolsand related cost drivers and has assembled the following information.
Expected Use of Cost Driversper Product
DryersCurlers
Expected Useof CostDrivers
EstimatedOverheadCost Driver
Activity CostPool
330170500$ 57,500OrdersPurchasing98,00070,000168,00042,000PoundsReceiving424,000424,000848,000169,600PartsAssembling48,00082,000130,00052,000TestsTesting40,00080,000120,00060,000UnitsFinishing4,0608,04012,10060,500CartonsPacking and
shipping$441,600
Instructions
a. Under traditional product costing, compute the total unit cost of both products.Prepare a simple comparative schedule of the individual costs by product(similar to Illustration 4).
b. Under ABC, prepare a schedule showing the computations of the activity‐basedoverhead rates (per cost driver).
c. Prepare a schedule assigning each activity's overhead cost pool to each productbased on the use of cost drivers. (Include a computation of overhead cost perunit, rounding to the nearest cent.)
d. Compute the total cost per unit for each product under ABC.
e. Classify each of the activities as a value‐added activity or a nonvalue‐addedactivity.
Managerial AccountingChapter 4
Page 261

f. Comment on (1) the comparative overhead cost per unit for the two productsunder ABC, and (2) the comparative total costs per unit under traditionalcosting and ABC.
Hint:
Assign overhead using traditional costing and ABC; compute unit costs; classify activities as value‐ or nonvalue‐added.
( Study Objective 1 Study Objective 4 Study Objective 6)
P4‐2A Petty Plastics, Inc. manufactures two plastic thermos containers at its plastic moldingfacility in Elum, Washington. Its large container, called the Ice House, has a volumeof 5 gallons, side carrying handles, a snap‐down lid, and a side drain and plug. Itssmaller container, called the Cool Chest, has a volume of 2 gallons, an over‐the‐topcarrying handle which is part of a tilting lid, and a removable shelf. Both containersand their parts are made entirely of hard‐molded plastic. The Ice House sells for$35 and the Cool Chest sells for $24. The production costs computed per unit undertraditional costing for each model in 2002 were as follows.
Cool ChestIce HouseTraditional Costing$ 6.00$ 9.50Direct materials5.008.00Direct labor ($10 per hour)8.6013.76Manufacturing overhead ($17.20
per DLH)$19.60$31.26Total per unit cost
In 2002, Petty Plastics manufactured 50,000 units of the Ice House and 20,000 unitsof the Cool Chest. The overhead rate of $17.20 per direct labor hour was determinedby dividing total expected manufacturing overhead of $860,000 by the total directlabor hours (50,000) for the 2 models.
Under traditional costing, the gross profit on the two containers was: Ice House$3.74 or ($35 − $31.26), and Cool Chest $4.40 or ($24 − $19.60). The gross marginrates on cost are: Ice House 12% or ($3.74 ÷ $31.26), and Cool Chest 22% or ($4.40÷ $19.60). Because Petty can earn a gross margin rate on the Cool Chest that is nearlytwice as great as that earned on the Ice House, with less investment in inventoryand labor costs, its management is urging its sales staff to put its efforts into sellingthe Cool Chest over the Ice House.
Before finalizing its decision, management asks the controller Dinna Martinez toprepare a product costing analysis using activity‐based costing (ABC). Martinezaccumulates the following information about overhead for the year ended December31, 2002.
Managerial AccountingChapter 4
Page 262

Activity‐BasedOverhead Rate
Total ExpectedCost Drivers
EstimatedOverheadCost DriverActivity
$40 per order4,500$180,000Number of ordersPurchasing$250 per setup800200,000Number of setupsMachine setups$4 per machine
hour80,000320,000Machine hoursExtruding
$20 per test8,000160,000Tests andinspections
Quality control
The cost drivers used for each product were:
TotalCool ChestIce HouseCost Driver4,5002,0002,500Purchase orders800300500Machine setups
80,00020,00060,000Machine hours8,0003,0005,000Tests and inspections
Instructions
a. Assign the total 2002 manufacturing overhead costs to the two products usingactivity‐based costing (ABC).
b. What was the cost per unit and gross profit of each model using ABC costing?
c.
Are management's future plans for the two models sound?
Hint:
Assign overhead to products using ABC and evaluate decision.
( Study Objective 4)
P4‐3A Castro Cabinets Company designs and builds upscale kitchen cabinets for luxuryhomes. Many of the kitchen cabinet and counter arrangements are custom made,but occasionally the company does mass production on order. Its budgetedmanufacturing overhead costs for the year 2003 are as follows.
Managerial AccountingChapter 4
Page 263

AmountOverhead Cost Pools$ 114,400Purchasing164,320Handling materials400,000Production (cutting, milling, finishing)174,480Setting up machines184,800Inspecting252,000Inventory control (raw materials and finished
goods)360,000Utilities
$1,650,000Total budget overhead costs
For the last 3 years, Castro Cabinets Company has been charging overhead toproducts on the basis of machine hours. For the year 2003, 100,000 machine hoursare budgeted.
Maribel Castro, owner‐manager of Castro, recently directed her accountant, JohnKandy, to implement the activity‐based costing system he has repeatedly proposed.At Maribel's request, John and the production foreman identify the following costdrivers and their usage for the previously budgeted overhead cost pools.
Total DriversActivity Cost DriversOverhead Cost Pools650Number of ordersPurchasing
8,000Numbers of movesHandling materials100,000Direct labor hoursProduction (cutting, milling,
finishing)1,200Number of setupsSetting up machines6,000Number of inspectionsInspecting36,000Number of componentsInventory control (raw
materials and finished goods)90,000Square feet occupiedUtilities
Kelly Garber, sales manager, has received an order for 50 kitchen cabinetarrangements from Bitty Builders, a housing development contractor. At Kelly'srequest, John prepares cost estimates for producing components for 50 cabinetarrangements so Kelly can submit a contract price per kitchen arrangement to BittyBuilders. He accumulates the following data for the production of 50 kitchen cabinetarrangements.
Managerial AccountingChapter 4
Page 264

$180,000Direct materials$200,000Direct labor15,000Machine hours12,000Direct labor hours
50Number of purchase orders800Number of material moves100Number of machine setups450Number of inspections
3,000Number of components (cabinets andaccessories)
8,000Number of square feet occupied
Instructions
a. Compute the predetermined overhead rate using traditional costing withmachine hours as the basis. (Round to the nearest cent.)
b. What is the manufacturing cost per complete kitchen arrangement undertraditional costing?
c. What is the manufacturing cost per kitchen arrangement under the proposedactivity‐based costing? (Prepare all of the necessary schedules.)
d.
Which of the two costing systems is preferable in pricing decisions and why?
Hint:
Assign overhead costs using traditional costing and ABC; compare results.
( Study Objective 1 Study Objective 4)
P4‐4A Frazzle Corporation produces two grades of wine from grapes that it buys fromCalifornia growers. It produces and sells, in 1‐gallon jugs, roughly 800,000 gallonsper year of a low‐cost, high‐volume product called StarDew. It also produces andsells roughly 200,000 gallons per year of a low‐volume, high‐cost product calledVineRose. VineRose is sold in 1‐liter bottles; thus 200,000 gallons results in roughly800,000 bottles. Based on recent data, the StarDew product has not been as profitableas VineRose. Management is considering dropping the inexpensive StarDew so itcan focus more attention on the VineRose line product. VineRose already demandsconsiderably more attention than StarDew.
Tom Edwards, president and founder of Frazzle, is skeptical about this idea. Hepoints out that for many decades the company produced only the StarDew line,and that it was always quite profitable. It wasn't until the company started
Managerial AccountingChapter 4
Page 265

producing the more complicated VineRose wine that the profitability of StarDewdeclined. Prior to the introduction of VineRose the company had simple equipment,simple growing and production procedures, and virtually no need for qualitycontrol. Because VineRose is bottled in 1‐liter bottles it requires considerably moretime and effort, both to bottle and to label and box, than does StarDew. (There areroughly 4 liters in a gallon; thus the company must bottle and handle 4 bottles ofVineRose to sell the same amount of wine as StarDew.) StarDew requires 1 monthof aging; VineRose requires 1 year. StarDew requires cleaning and inspection ofequipment every 5,000 gallons; VineRose requires such maintenance every 500gallons.
Tom has asked the accounting department to prepare an analysis of the cost pergallon using the traditional costing approach and using activity‐based costing. Thefollowing information was collected.
VineRoseStarDew$2.40$1.10Direct materials per gallon$1.00$0.50Direct labor cost per gallon0.150.075Direct labor hours per gallon
30,00060,000Total direct labor hours
Expected Use of CostDrivers per Product
VineRoseStarDew
ExpectedUse of CostDrivers
EstimatedOverheadCost Driver
Activity CostPool
2,0008,00010,000$ 180,000Cart of grapesGrapeprocessing
9,600,000800,00010,400,000416,000Total monthsAging800,000800,0001,600,000360,000Number of
bottlesBottling andcorking
800,000800,0001,600,000240,000Number ofbottles
Labeling andboxing
400160560280,000Number ofinspections
Maintain, andinspectequipment
$1,476,000
Instructions
Answer each of the following questions. (Round all calculations to three decimalplaces.)
Managerial AccountingChapter 4
Page 266

a. Under traditional product costing using direct labor hours, compute the totalmanufacturing cost per gallon of both products.
b. Under ABC, prepare a schedule showing the computation of the activity‐basedoverhead rates (per cost driver).
c. Prepare a schedule assigning each activity's overhead cost pool to each product,based on the use of cost drivers. Include a computation of overhead cost perunit.
d. Compute the total manufacturing cost per gallon for both products underABC.
e.
Write a memo to Tom Edwards discussing the implications of your analysisfor the company's plans. In this memo provide a brief description of ABC, aswell as an explanation of how the traditional approach can result in distortions.
Hint:
Assign overhead costs using traditional costing and ABC; compare results.
( Study Objective 1 Study Objective 4)
P4‐5A Horses and Dogs Veterinary Clinic is a small‐town partnership that offers twoprimary services, farm animal services and pet care services. Providing veterinarycare to farm animals requires travel to the farm animal (house calls), while veterinarycare to pets generally requires that the pet be brought into the clinic. As part of aninvestigation to determine the contribution that each of these two types of servicesmakes to overall profit, one partner argues for allocating overhead usingactivity‐based costing while the other partner argues for a more simple overheadcost allocation on the basis of direct labor hours. The partners agree to use nextyear's budgeted data, as prepared by their public accountant, for analysis andcomparison purposes. The following overhead data are collected to develop thecomparison.
Managerial AccountingChapter 4
Page 267

Expected Use of Drivers byService
PetsFarm
Animals
TotalExpectedCost
DriversEstimatedOverheadCost Driver
Activity CostPool
2,2001,8004,000$ 64,000TreatmentsDrug treatment60020080065,000OperationsSurgery
2,00026,00028,00028,000MileageTravel2,4006003,00033,000Appointment/CallsConsultation3,0002,0005,00030,000Direct labor
hoursAccounting/office
40,000100% petsBoarding andgrooming
$260,000
Instructions
a. Using traditional product costing as proposed by the one partner, computethe total overhead cost assigned to both services of Horses and Dogs VeterinaryClinic.
b. 1. Using activity‐based costing, prepare a schedule showing thecomputations of the activity‐based overhead rates (per cost driver).
2. Prepare a schedule assigning each activity's overhead cost pool to eachservice based on the use of the cost drivers.
c. Classify each of the activities as a value‐added activity or a nonvalue‐addedactivity.
d.
Comment on the comparative overhead cost assigned to the two servicesunder both traditional costing and ABC.
Hint:
Assign overhead costs to services using traditional costing and ABC; compute overhead rates and unit costs; compare results.
( Study Objective 1 Study Objective 4 Study Objective 6 Study Objective 7)
PROBLEMS: SET BP4‐1B Fire Safety Products, Inc. manufactures steel cylinders and nozzles for two models
of fire extinguishers: (1) a home fire extinguisher and (2) a commercial fireextinguisher. The home model is a high‐volume (54,000 units), half‐gallon cylinder
Managerial AccountingChapter 4
Page 268

that holds pounds of multipurpose dry chemical at 480 PSI. The commercialmodel is a low‐volume (10,200 units), two‐gallon cylinder that holds 10 pounds ofmulti‐purpose dry chemical at 390 PSI. Both products require 1.5 hours of directlabor for completion. Therefore, total annual direct labor hours are 96,300 or [1.5hrs. × (54,000 + 10,200)]. Expected annual manufacturing overhead is $1,492,780.Thus, the predetermined overhead rate is $15.50 or ($1,492,780 ÷ 96,300) per directlabor hour. The direct materials cost per unit is $18.50 for the home model and$26.50 for the commercial model. The direct labor cost is $19 per unit for both thehome and the commercial models.
The company's managers identified six activity cost pools and related cost driversand accumulated overhead by cost pool as follows.
Expected Use of Drivers byProduct
CommercialHome
ExpectedUse of CostDrivers
EstimatedOverheadCost Driver
Activity CostPool
120,000215,000335,000$ 70,350PoundsReceiving8,00027,00035,000150,500Machine
hoursForming
50,000162,000212,000381,600Number ofparts
Assembling
10,00015,50025,50051,000Number oftests
Testing
2,0004,5106,51052,080GallonsPainting120,000215,000335,000787,250PoundsPacking and
shipping$1,492,780
Instructions
a. Under traditional product costing, compute the total unit cost of both products.Prepare a simple comparative schedule of the individual costs by product(similar to Illustration 4).
b. Under ABC, prepare a schedule showing the computations of the activity‐basedoverhead rates (per cost driver).
c. Prepare a schedule assigning each activity's overhead cost pool to each productbased on the use of cost drivers. (Include a computation of overhead cost perunit, rounding to the nearest cent.)
d. Compute the total cost per unit for each product under ABC.
Managerial AccountingChapter 4
Page 269

e. Classify each of the activities as a value‐added activity or a nonvalue‐addedactivity.
f. Comment on (1) the comparative overhead cost per unit for the two productsunder ABC, and (2) the comparative total costs per unit under traditionalcosting and ABC.
Hint:
Assign overhead using traditional costing and ABC; compute unit costs; classify activities as value‐ or nonvalue‐added.
( Study Objective 1 Study Objective 4 Study Objective 6)
P4‐2B Jackson Electronics manufactures two large‐screen television models: the Royalewhich sells for $1,600, and a new model, the Majestic, which sells for $1,300. Theproduction cost computed per unit under traditional costing for each model in 2002was as follows.
MajesticRoyaleTraditional Costing$420$1,700Direct materials100120Direct labor ($20 per hour)190228Manufacturing overhead ($38 per
DLH)$710$1,048Total per unit cost
In 2002, Jackson manufactured 25,000 units of the Royale and 10,000 units of theMajestic. The overhead rate of $38 per direct labor hour was determined by dividingtotal expected manufacturing overhead of $7,600,000 by the total direct labor hours(200,000) for the two models.
Under traditional costing, the gross profit on the models was: Royale $552 or ($1,600− $1,048), and Majestic $590 or ($1,300 − $710). Because of this difference,management is considering phasing out the Royale model and increasing theproduction of the Majestic model.
Before finalizing its decision, management asks Jackson's controller to prepare ananalysis using activity‐based costing (ABC). The controller accumulates thefollowing information about overhead for the year ended December 31, 2002.
Managerial AccountingChapter 4
Page 270
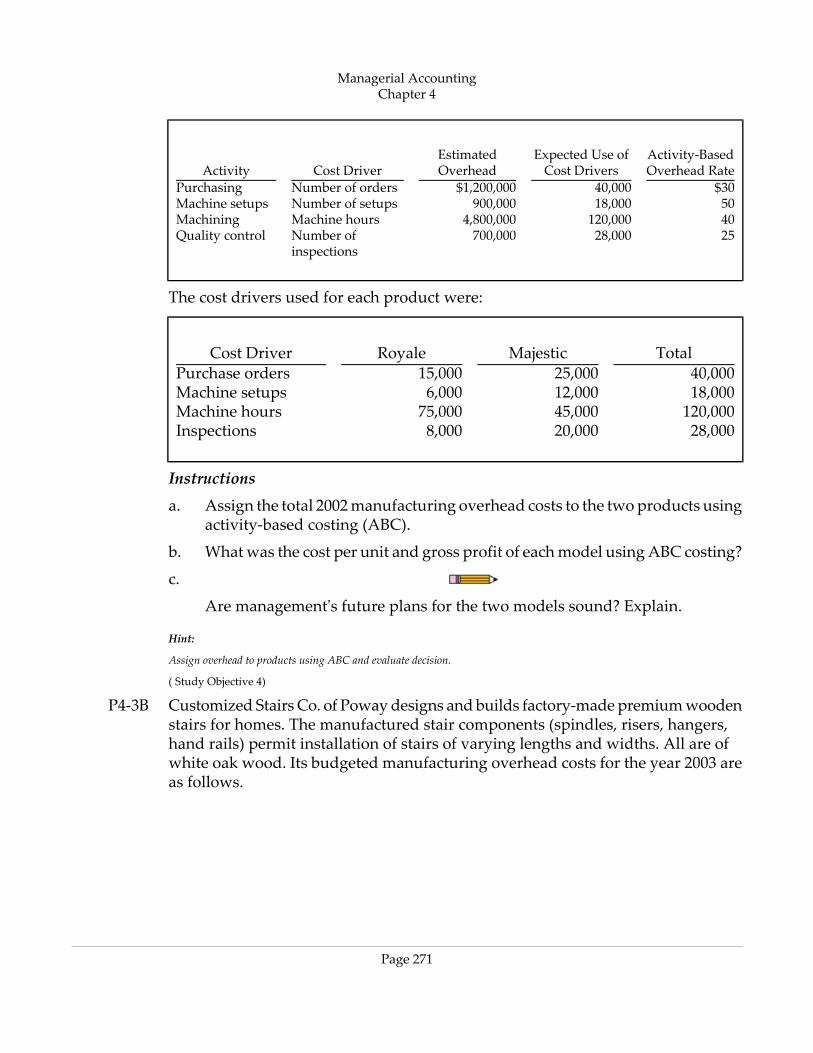
Activity‐BasedOverhead Rate
Expected Use ofCost Drivers
EstimatedOverheadCost DriverActivity
$3040,000$1,200,000Number of ordersPurchasing5018,000900,000Number of setupsMachine setups40120,0004,800,000Machine hoursMachining2528,000700,000Number of
inspectionsQuality control
The cost drivers used for each product were:
TotalMajesticRoyaleCost Driver40,00025,00015,000Purchase orders18,00012,0006,000Machine setups120,00045,00075,000Machine hours28,00020,0008,000Inspections
Instructions
a. Assign the total 2002 manufacturing overhead costs to the two products usingactivity‐based costing (ABC).
b. What was the cost per unit and gross profit of each model using ABC costing?
c.
Are management's future plans for the two models sound? Explain.
Hint:
Assign overhead to products using ABC and evaluate decision.
( Study Objective 4)
P4‐3B Customized Stairs Co. of Poway designs and builds factory‐made premium woodenstairs for homes. The manufactured stair components (spindles, risers, hangers,hand rails) permit installation of stairs of varying lengths and widths. All are ofwhite oak wood. Its budgeted manufacturing overhead costs for the year 2003 areas follows.
Managerial AccountingChapter 4
Page 271

AmountOverhead Cost Pools$ 57,000Purchasing82,000Handling materials200,000Production (cutting, milling, finishing)84,840Setting up machines90,000Inspecting126,000Inventory control (raw materials and finished
goods)180,000Utilities$819,840Total budget overhead costs
For the last 4 years, Customized Stairs Co. has been charging overhead to productson the basis of machine hours. For the year 2003, 100,000 machine hours arebudgeted.
Saida Fang, owner‐manager of Customized Stairs Co., recently directed hisaccountant, Maria Barrila, to implement the activity‐based costing system that shehas repeatedly proposed. At Saida Fang's request, Maria and the production foremanidentify the following cost drivers and their usage for the previously budgetedoverhead cost pools.
Expected Use ofCost DriversActivity Cost DriversOverhead Cost Pools
600Number of ordersPurchasing8,000Number of movesHandling materials
100,000Direct labor hoursProduction (cutting, milling,finishing)
1,200Number of setupsSetting up machines6,000Number of inspectionsInspecting
168,000Number of componentsInventory control (rawmaterials and finished goods)
90,000Square feet occupiedUtilities
Nick Duich, sales manager, has received an order for 280 stairs from Mall Builders,Inc., a large housing development contractor. At Nick's request, Maria preparescost estimates for producing components for 280 stairs so Nick can submit a contractprice per stair to Mall Builders. She accumulates the following data for theproduction of 280 stairways.
Managerial AccountingChapter 4
Page 272

$103,600Direct materials$112,000Direct labor14,500Machine hours5,000Direct labor hours
60Number of purchase orders800Number of material moves100Number of machine setups450Number of inspections
16,000Number of components8,000Number of square feet occupied
Instructions
a. Compute the predetermined overhead rate using traditional costing withmachine hours as the basis.
b. What is the manufacturing cost per stairway under traditional costing?
c. What is the manufacturing cost per stairway under the proposed activity‐basedcosting? (Prepare all of the necessary schedules.)
d.
Which of the two costing systems is preferable in pricing decisions and why?
Hint:
Assign overhead costs using traditional costing and ABC; compare results.
( Study Objective 1 Study Objective 4)
P4‐4B Bastille Corporation produces two grades of wine from grapes that it buys fromCalifornia growers. It produces and sells roughly 3,000,000 liters per year of alow‐cost, high‐volume product called CoolDay. It sells this in 600,000 5‐liter jugs.Bastille also produces and sells roughly 300,000 liters per year of a low‐volume,high‐cost product called LiteMist. LiteMist is sold in 1‐liter bottles. Based on recentdata, the CoolDay product has not been as profitable as LiteMist. Management isconsidering dropping the inexpensive CoolDay line so it can focus more attentionon the LiteMist product. The LiteMist product already demands considerably moreattention than the CoolDay line.
Frank Summer, president and founder of Bastille, is skeptical about this idea. Hepoints out that for many decades the company produced only the CoolDay line,and that it was always quite profitable. It wasn't until the company startedproducing the more complicated LiteMist wine that the profitability of CoolDaydeclined. Prior to the introduction of LiteMist, the company had simple equipment,
Managerial AccountingChapter 4
Page 273

simple growing and production procedures, and virtually no need for qualitycontrol. Because LiteMist is bottled in 1‐liter bottles, it requires considerably moretime and effort, both to bottle and to label and box than does CoolDay. The companymust bottle and handle 5 times as many bottles of LiteMist to sell the same quantityas CoolDay. CoolDay requires 1 month of aging; LiteMist requires 1 year. CoolDayrequires cleaning and inspection of equipment every 10,000 liters; LiteMist requiressuch maintenance every 600 liters.
Frank has asked the accounting department to prepare an analysis of the cost perliter using the traditional costing approach and using activity‐based costing. Thefollowing information was collected.
LiteMistCoolDay$1.20$0.40Direct materials per liter$0.50$0.25Direct labor cost per liter0.090.04Direct labor hours per liter
27,000120,000Total direct labor hours
Expected Use of CostDrivers per Product
LiteMistCoolDay
ExpectedUse of CostDrivers
EstimatedOverheadCost Driver
Activity CostPool
6006,0006,600$ 145,200Cart of grapesGrapeprocessing
3,600,0003,000,0006,600,000396,000Total monthsAging300,000600,000900,000270,000Number of
bottlesBottling andcorking
300,000600,000900,000189,000Number ofbottles
Labeling andboxing
500300800240,000Number ofinspections
Maintain andinspectequipment
$1,240,200
Instructions
Answer each of the following questions. (Round all calculations to three decimalplaces.)
a. Under traditional product costing using direct labor hours, compute the totalmanufacturing cost per liter of both products.
Managerial AccountingChapter 4
Page 274

b. Under ABC, prepare a schedule showing the computation of the activity‐basedoverhead rates (per cost driver).
c. Prepare a schedule assigning each activity's overhead cost pool to each product,based on the use of cost drivers. Include a computation of overhead cost perliter.
d. Compute the total manufacturing cost per liter for both products under ABC.
e.
Write a memo to Frank Summer discussing the implications of your analysisfor the company's plans. In this memo provide a brief description of ABC, aswell as an explanation of how the traditional approach can result in distortions.
Hint:
Assign overhead costs using traditional costing and ABC; compare results.
( Study Objective 1 Study Objective 4)
P4‐5B Les and Moore is a public accounting firm that offers two primary services, auditingand tax return preparation. A controversy has developed between the partners ofthe two service lines as to who is contributing the greater amount to the bottomline. The area of contention is the assignment of overhead. The tax partners arguefor assigning overhead on the basis of 40% of direct labor dollars, while the auditpartners argue for implementing activity‐based costing. The partners agree to usenext year's budgeted data for purposes of analysis and comparison. The followingoverhead data are collected to develop the comparison.
Expected Use of CostDrivers per Service
TaxAudit
ExpectedUse of CostDrivers
EstimatedOverheadCost Driver
Activity CostPool
$900,000$1,000,000$1,900,000$209,000Direct labordollars
Employeetraining
1,9006002,50076,200Number ofreports/forms
Typing andsecretarial
35,00025,00060,000204,000Number ofminutes
Computing
182038142,500Number ofemployees
Facility rental
41,50086,800Direct128,300Per expensereports
Travel
$760,000
Instructions
Managerial AccountingChapter 4
Page 275

a. Using traditional product costing as proposed by the tax partners, computethe total overhead cost assigned to both services (audit and tax) of Les andMoore.
b. 1. Using activity‐based costing, prepare a schedule showing thecomputations of the activity‐based overhead rates (per cost driver).
2. Prepare a schedule assigning each activity's overhead cost pool to eachservice based on the use of the cost drivers.
c. Classify each of the activities as a value‐added activity or a nonvalue‐addedactivity.
d.
Comment on the comparative overhead cost per unit for the two productsunder both traditional costing and ABC.
Hint:
Assign overhead costs to services using traditional costing and ABC; compute overhead rates and unit costs; compare results.
( Study Objective 1 Study Objective 4 Study Objective 6 Study Objective 7)
BROADENING YOUR PERSPECTIVEGROUP DECISION CASE
BYP4‐1 Valley West Hospital is a primary medical health care facility and trauma centerthat serves 11 small, rural midwestern communities within a 40‐mile radius. Thehospital offers all the medical/surgical services of a typical small hospital. It has astaff of 18 full‐time doctors and 20 part‐time visiting specialists. Valley West has apayroll of 150 employees consisting of technicians, nurses, therapists, managers,directors, administrators, dieticians, secretaries, data processors, and janitors.
Instructions
With the class divided into groups, discuss and answer the following.
a. Using your (limited, moderate, or in‐depth) knowledge of a hospital'soperations, identify as many activities as you can that would serve as thebasis for implementing an activity‐based costing system.
b. For each of the activities listed in (a), identify a cost driver that would serveas a valid measure of the resources consumed by the activity.
MANAGERIAL ANALYSIS
BYP4‐2 Ideal Manufacturing Company of Sycamore, Illinois has supported a research anddevelopment (R&D) department that has for many years been the sole contributor
Managerial AccountingChapter 4
Page 276

to the company's new farm machinery products. The R&D activity is an overheadcost center that provides services only to in‐house manufacturing departments (4different product lines), all of which produce agricultural/farm/ranch relatedmachinery products. The department has never sold its services outside, but becauseof its long history of success, larger manufacturers of agricultural products haveapproached Ideal to hire its R&D department for special projects. Because the costsof operating the R&D department have been spiraling uncontrollably, Ideal'smanagement is considering entertaining these outside approaches to absorb theincreasing costs. But, (1) management doesn't have any cost basis for charging R&Dservices to outsiders, and (2) it needs to gain control of its R&D costs. Managementdecides to implement an activity‐based costing system in order to determine thecharges for both outsiders and the in‐house users of the department's services.
R&D activities fall into four pools with the following annual costs.
$1,050,000Market analysis2,280,000Product design3,600,000Product development1,400,000Prototype testing
Activity analysis determines that the appropriate cost drivers and their usage forthe four activities are:
Total Estimated DriversCost DriversActivity15,000 hoursHours of analysisMarket analysis2,500 designsNumber of designsProduct design90 productsNumber of productsProduct development700 testsNumber of testsPrototype testing
Instructions
a. Compute the activity‐based overhead rate for each activity cost pool.
b. How much cost would be charged to an in‐house manufacturing departmentthat consumed 1,800 hours of market analysis time, was provided 280 designsrelating to 10 products, and requested 92 engineering tests?
c. How much cost would serve as the basis for pricing an R&D bid with anoutside company on a contract that would consume 800 hours of analysistime, require 178 designs relating to 3 products, and result in 70 engineeringtests?
Managerial AccountingChapter 4
Page 277

d. What is the benefit to Ideal Manufacturing of applying activity‐based costingto its R&D activity for both in‐house and outside charging purposes?
REAL-WORLD FOCUS
BYP4‐3 Hewlett‐Packard is considered one of the best managed and most innovativecompanies in the world. It continually has shown an ability to adapt to globalcompetitive challenges through technical innovation and continual reassessmentof its management and control mechanisms. Most applications of activity‐basedcosting by Hewlett‐Packard have been successful.
But, over the period August 1988 to August 1989, the Colorado Springs Divisionof Hewlett‐Packard designed an activity‐based costing system with the goal ofproviding for better product costing and inventory valuation. It beganimplementation in November 1989 but halted the process in the summer of 1992.Since then, the Colorado Springs Division has made no further attempts tore‐implement a more expansive ABC approach.
Instructions
The March 1997 issue of Management Accounting contains an article by Steven P.Landry, Larry M. Wood, and Tim M. Linquist about the Colorado Springs Divisionentitled “Can ABC Bring Mixed Results?” Read the article and answer the followingquestions.
a. What went wrong at H‐P's Colorado Springs Division in the design,development, and implementation of its activity‐based costing system?
b. What conclusions were drawn from H‐P's Colorado Springs Divisionexperience? What does successful ABC implementation require?
EXPLORING THE WEB
BYP4‐4 Cost Technology describes itself as a “global consulting company specializing inprofit management.” The company helps manufacturing, service, and governmentorganizations implement methods, such as activity‐based costing and activity‐basedmanagement, that will improve corporate profitability. The home page of CostTechnology includes information about the company, its markets, and products.The following exercise investigates the company's training programs.
Address: http://costtechnology.com/training.htm (or go towww.wiley.com/college/weygandt )
Instructions
This page refers to other pages that describe three different training courses. Readthe descriptions of these courses to answer the following questions.
Managerial AccountingChapter 4
Page 278

a. List four types of employees that the company says would benefit from thecourse “Introduction of Activity‐Based Management Solutions.”
b. What is target costing?
c. What is the major cause of failure of many ABC implementations? Describe“Workforce Activity‐Based Management.”
COMMUNICATION ACTIVITY
BYP4‐5 In our Feature Story about Super Bakery, Inc., we described a virtual corporationas one that consists of a core unit that is supported by a network of outsourcedactivities. A virtual corporation minimizes investment in human resources, fixedassets, and working capital. The application of ABC to Super Bakery, Inc. isdescribed in an article entitled “ABC in a Virtual Corporation” by Tom Davis andBruce Darling, in Management Accounting, October 1996.
Instructions
Assume you are the controller of a virtual corporation. Using the article as a basisfor your communication, write a summary that answers the following questions.
a. What unique strategies and tactics did Super Bakery's management implementthat caused sales to take off and continue to grow at an average rate of 20%?
b. Why did Super Bakery's management feel that it was necessary to install anABC system?
c. What is the main difference between Super Bakery's ABC system and othermanufacturers' ABC systems?
RESEARCH ASSIGNMENT
BYP4‐6 The April 1998 issue of Management Accounting includes an article by Kip R.Krumwiede entitled “ABC: Why It's Tried and How It Succeeds.”
Instructions
Read the article and answer the following questions.
a. What is the adoption and implementation status of ABC according to thesurvey conducted in 1996 by the Cost Management Group of the Institute ofManagement Accountants?
b. What did Krumwiede's survey attempt to determine?
c. In Krumwiede's survey, what factors appeared to separate those companiesthat adopted ABC from those that did not adopt ABC?
Managerial AccountingChapter 4
Page 279

d. Identify at least five “Basic ABC Implementation Tips” recommended in thearticle.
ETHICS CASE
BYP4‐7 Ernie Lobb, the cost accountant for Superior Mower Company, recently installedactivity‐based costing at its St. Louis lawn tractor (riding mower) plant where threemodels—the 8‐horsepower Bladerunner, the 12‐horsepower Quickcut, and the18‐horsepower Supercut—are manufactured. Ernie's new product costs for thesethree models show that the company's traditional costing system had beensignificantly undercosting the 18‐horsepower Supercut. This was due primarily tothe lower sales volume of the Supercut compared to the Bladerunner and theQuickcut.
Before completing his analysis and reporting these results to management, Ernieis approached by his friend Eddie Polyester, who is the production manager forthe 18‐horsepower Supercut model. Eddie has heard from one of Ernie's staff aboutthe new product costs and is upset and worried for his job because the new costsshow the Supercut to be losing, rather than making, money.
At first Eddie condemns the new cost system, whereupon Ernie explains the practiceof activity‐based costing and why it is more accurate than the company's presentsystem. Even more worried now, Eddie begs Ernie, “Massage the figures just enoughto save the line from being discontinued. You don't want me to lose my job do you?Anyway, nobody will know.”
Ernie holds firm but agrees to recompute all his calculations for accuracy beforesubmitting his costs to management.
Instructions
a. Who are the stakeholders in this situation?
b. What, if any, are the ethical considerations in this situation?
c. What are Ernie's ethical obligations to the company? To his friend?
GLOSSARY
Activity Any event, action, transaction, or work sequence that causes a cost to beincurred in producing a product or providing a service. (p. 141)
Activity‐basedcosting (ABC)
An overhead cost allocation system that allocates overhead to multipleactivity cost pools and assigns the activity cost pools to products or servicesby means of cost drivers that represent the activities used. (p. 141)
Managerial AccountingChapter 4
Page 280

Activity‐basedmanagement(ABM)
An extension of ABC from a product costing system to a managementfunction that focuses on reducing costs and improving processes and decisionmaking. (p. 152)
Activity cost pool The overhead cost allocated to a distinct type of activity or related activities.(p. 142).
Batch‐levelactivities
Activities performed for each batch of products. (p. 162)
Cost driver Any factor or activity that has a direct cause–effect relationship with theresources consumed. In ABC cost drivers are used to assign activity costpools to products or services. (p. 141)
Facility‐levelactivities
Activities required to support or sustain an entire production process andnot dependent on number of products, batches, or units produced. (p. 163)
Just‐in‐time (JIT)processing
A processing system dedicated to having the right amount of materials,products, or parts arrive as they are needed, thereby reducing the amountof inventory. (p. 157)
Nonvalue‐addedactivity
An activity that adds cost to, or increases the time spent on, a product orservice without increasing its market value. (p. 152)
Product‐levelactivities
Activities performed for and identifiable with an entire product line. (p. 163)
Unit‐levelactivities
Activities performed for each unit of production. (p. 162)
Value‐addedactivity
An activity that increases the worth of a product or service. (p. 152)
Managerial AccountingChapter 4
Page 281

Managerial AccountingChapter 4
Page 282