MANAGEMENT’S DISCUSSION OF RECENT FINANCIAL PERFORMANCE VIA
20
MANAGEMENT’S DISCUSSION OF RECENT FINANCIAL PERFORMANCE VIA CHRISTI HEALTH INC. CONSOLIDATED Nine Months Ended June 30, 2010. All results for the nine months ended June 30, 2010 and comparisons to the prior period reflect Preferred Health Systems as discontinued operations. Inpatient days for the nine months ended June 30, 2010 were 168,092 which represent a decrease of 8,715 days or 4.9% from the nine months ended June 30, 2009. The decrease was the result of a 4.8% decrease in admissions. Inpatient volumes have been soft for the first nine months, primarily in the Wichita market. This decline seems to be a combination of the overall weakness in the economy and the expiration of COBRA benefits for employees laid off in the Wichita aviation industry. Outpatient visits for the nine months ended June 30, 2010 were 543,683 which represent an increase of 3,247 visits or 0.6% from the nine months ended June 30, 2009. Total operating revenue for the nine months ended June 30, 2010 was $755.4 million which represents an increase of $13.1 million or 1.8% from the nine months ended June 30, 2009. Total operating expenses for the nine months ended June 30, 2010 were $715.4 million which represents an increase of $10.2 million or 1.4% from the nine months ended June 30, 2009. Total operating expenses, excluding depreciation, amortization and interest expense, for the nine months ended June 30, 2010 increased $15.4 million or 2.4% from the same time period the previous year. Salaries, wages and employee benefits increased $15.2 million or 4.2% from June 30, 2009 to June 30, 2010, due primarily to wage increases. Supplies expense for the nine months ended June 30, 2010 was $117.8 million which represents a decrease of $4.2 million or 3.5% due primarily to lower inpatient volumes. Other operating expenses for the nine months ended June 30, 2010 were $117.5 million which represents an increase of $6.9 million or 6.2%. Provision for bad debts for the nine months ended June 30, 2010 was $46.5 million which represents a decrease of $2.4 million or 4.9% due to improved recognition of charity compared to the prior period. Depreciation and amortization expense decreased 4.1% from June 30, 2009 to 2010. As a result of the activities described above, operating income for the nine months ended June 30, 2010 was $40.0 million, which represents an increase of $2.9 million or 7.7% from the same time period the previous year. The System reported a 5.3% operating margin. Total net nonoperating gains, for the nine months ended June 30, 2010 were $17.1 million which represents an improvement of $59.0 million from the nine months ended June 30, 2009. Net realized and unrealized investment gains for the nine months ended June 30, 2010 were 9.1 million, which represents an improvement of $49.9 million compared to the prior year. These funds are invested according to the VCH’s investment policy which has an asset allocation target of 50% fixed income, 40% equities, and 10% alternative investments. Total excess of revenues over expenses from continuing operations for the nine months ended June 30, 2010 were $50.1 million which represents an increase of $59.7 million from June 30, 2009. Total revenue and gains in excess of expenses and losses from continuing operations represent a 6.6% total margin. Page 1 of 20
Transcript of MANAGEMENT’S DISCUSSION OF RECENT FINANCIAL PERFORMANCE VIA

MANAGEMENT’S DISCUSSION OF RECENT FINANCIAL PERFORMANCE VIA CHRISTI HEALTH INC. CONSOLIDATED
Nine Months Ended June 30, 2010. All results for the nine months ended June 30, 2010 and comparisons to the prior period reflect Preferred Health Systems as discontinued operations.
Inpatient days for the nine months ended June 30, 2010 were 168,092 which represent a decrease of 8,715 days or 4.9% from the nine months ended June 30, 2009. The decrease was the result of a 4.8% decrease in admissions. Inpatient volumes have been soft for the first nine months, primarily in the Wichita market. This decline seems to be a combination of the overall weakness in the economy and the expiration of COBRA benefits for employees laid off in the Wichita aviation industry. Outpatient visits for the nine months ended June 30, 2010 were 543,683 which represent an increase of 3,247 visits or 0.6% from the nine months ended June 30, 2009.
Total operating revenue for the nine months ended June 30, 2010 was $755.4 million which represents an increase of $13.1 million or 1.8% from the nine months ended June 30, 2009.
Total operating expenses for the nine months ended June 30, 2010 were $715.4 million which represents an increase of $10.2 million or 1.4% from the nine months ended June 30, 2009. Total operating expenses, excluding depreciation, amortization and interest expense, for the nine months ended June 30, 2010 increased $15.4 million or 2.4% from the same time period the previous year. Salaries, wages and employee benefits increased $15.2 million or 4.2% from June 30, 2009 to June 30, 2010, due primarily to wage increases. Supplies expense for the nine months ended June 30, 2010 was $117.8 million which represents a decrease of $4.2 million or 3.5% due primarily to lower inpatient volumes. Other operating expenses for the nine months ended June 30, 2010 were $117.5 million which represents an increase of $6.9 million or 6.2%. Provision for bad debts for the nine months ended June 30, 2010 was $46.5 million which represents a decrease of $2.4 million or 4.9% due to improved recognition of charity compared to the prior period. Depreciation and amortization expense decreased 4.1% from June 30, 2009 to 2010.
As a result of the activities described above, operating income for the nine months ended June 30, 2010 was $40.0 million, which represents an increase of $2.9 million or 7.7% from the same time period the previous year. The System reported a 5.3% operating margin.
Total net nonoperating gains, for the nine months ended June 30, 2010 were $17.1 million which represents an improvement of $59.0 million from the nine months ended June 30, 2009. Net realized and unrealized investment gains for the nine months ended June 30, 2010 were 9.1 million, which represents an improvement of $49.9 million compared to the prior year. These funds are invested according to the VCH’s investment policy which has an asset allocation target of 50% fixed income, 40% equities, and 10% alternative investments.
Total excess of revenues over expenses from continuing operations for the nine months ended June 30, 2010 were $50.1 million which represents an increase of $59.7 million from June 30, 2009. Total revenue and gains in excess of expenses and losses from continuing operations represent a 6.6% total margin.
Page 1 of 20

In December 2009, Via Christi Health, through the City of Wichita, Kansas issued $88.1 million of Hospital Facilities Refunding Revenue Bonds Series X, 2009 Obligated Group fixed rate bonds to refund the $88.5 million in outstanding Obligated Group Series XI, 1991 bonds. Associated with this financing, both Standard and Poor’s Rating Services and Fitch Ratings affirmed their “A+” rating and positive outlook on Via Christi’s series 2001 and 2009 bonds.
Via Christi Health Inc. closed on the sale of its Preferred Health Systems, Inc. to Coventry Health Care, Inc. on February 1, 2010 effective as of January 31, 2010. In February, 2010, Via Christi Hospitals Wichita, Inc. formed a new wholly-owned not-for-profit subsidiary called Via Christi Hospital Wichita St. Teresa, Inc. to operate the new St. Teresa Campus facility. As of July 22, 2010, the Medical Center assigned its interest as sub lessee in the sublease of the St. Teresa Campus (the "West Hospital Sublease") to St. Teresa, as successor operator. As of July 22, 2010, Via Christi Hospital Wichita St. Teresa, Inc. also joined the Obligated Group. The assignment of the West Hospital Sublease required the approval of the City of Wichita, Kansas, as Issuer, which was granted July 14, 2010. Via Christi Hospital Wichita St. Teresa, Inc. will be listed in the Official Catholic Directory in its next published edition and thus, will qualify under Section 501(c)(3) of the Internal Revenue Code back to the date of its organization. Nothing described here will release Via Christi Hospitals Wichita, Inc. from its obligations under the West Hospital Sublease, or alter any of the other joint and several Obligations of the Obligated Group under the Master Indenture. On April 20, 2010 Michalene Maringer, CEO of Via Christi Hospitals Wichita, Inc. resigned her position. Randy Peterson, Via Christi Health, Inc. Senior Vice President for Regional Operations has been named interim CEO for Via Christi Hospitals Wichita, Inc. As part of a branding initiative, the ministries listed below began using their new legal names on April 1, 2010.
New Legal Name Old Legal Name Location
Via Christi Health, Inc.* Via Christi Health System, Inc Wichita, Kansas
Via Christi Hospitals Wichita, Inc.* Via Christi Regional Medical Center, Inc Wichita, Kansas
Via Christi Immediate Care, Mother Mary Anne, Inc. Mother Mary Anne Clinic, Inc Wichita, Kansas
Via Christi Rehabilitation Hospital, Inc.* Via Christi Rehabilitation Center, Inc Wichita, Kansas
Via Christi Home Health Wichita, Inc. Via Christi Home Health, Inc Wichita, Kansas
Via Christi Home Medical Wichita, LLC Home Medical Services, LLC Wichita, Kansas
Via Christi Villages, Inc. Via Christi Senior Services, Inc Wichita, Kansas
Via Christi Village Georgetown, Inc. Georgetown Village, Inc Wichita, Kansas
Via Christi Village Ponca City, Inc. Westminster Village, Inc Ponca City, Oklahoma
Via Christi Village Manhattan, Inc. St Joseph Village, Inc Manhattan, Kansas
Via Christi Village McLean, Inc. Riverside Village, Inc Wichita, Kansas
Via Christi Village Pittsburg, Inc. Cornerstone Village, Inc Pittsburg, Kansas
Via Christi Hospital Pittsburg, Inc.* Mt Carmel Regional Medical Center, Inc Pittsburg, Kansas
* Obligated Group Member
Page 2 of 20

All prior year comparisons in this Management Discussion are to the nine months ended June 30, 2009.
Certain consolidated operating statistics of the System are summarized below:
Nine Months Ended June 30, 2009 2010 (dollars reported in thousands) Financial Performance Income from operations $ 37,095 $ 39,960 Margin 5.0% 5.3% Excess(deficit) of revenues over expenses ($9,549) $ 50,141 Margin (1.3%) 6.6% Liquidity Days of cash and equivalents on hand 215.0 282.5 Days of net patient services revenue in net patient accounts receivable
40.6
39.8
Leverage Debt-to-capitalization ratio 0.32 0.36 Debt-to-equity ratio 0.46 0.56 Operations Total inpatient days 176,807 168,092 Total admissions 37,984 36,169 Total average length of stay, in days 4.65 4.65 Total inpatient revenues as a percentage of total patient service revenues
63.6%
61.8%
Number of full-time equivalent employees 7,660 7,672
Page 3 of 20

Via Christi Health, Inc. and SubsidiariesConsolidated Balance SheetsJune 30, 2010
(in thousands of dollars) June 30, 2010 September 30, 2009
AssetsCurrent assets
Cash and investments 504,959$ 408,979$ Patient accounts receivable - net 101,815 99,680 Estimated amounts receivable from third-party payors 1,356 104 Other current assets 122,760 71,584 Assets of discontinued operations, held for sale - 139,113
Total current assets 730,890 719,460
Assets whose use is limited Board designated assets 174,116 174,098 Trustee-held funds 85,123 97,285
- - Total noncurrent portion of assets whose use is limited 259,239 271,383
Property and equipment 1,104,831 1,044,779 Less accumulated depreciation (622,850) (593,843) Total net property and equipment 481,981 450,936
Other assets Long-term investments 17,871 12,247 Other assets 107,580 108,960
Total assets 1,597,561$ 1,562,986$
Liabilities and Net AssetsCurrent liabilities Current maturities of long-term debt 10,672$ 5,988$ Accounts payable 37,112 29,935 Accrued liabilities 119,363 63,078 Estimated amounts due to third-party payors - - Liabilities of discontinued operations, held for sale - 65,919 Total current liabilities 167,147 164,920
Noncurrent liabilities Long-term debt, less current maturities 459,311 460,954 Other noncurrent liabilities and noncontrolling interest 133,863 147,065 Total noncurrent liabilities 593,174 608,019
Total liabilities 760,321 772,939
Net assets Unrestricted 824,760 777,697 Temporarily restricted 6,560 6,430 Permanently restricted 5,920 5,920 Total net assets 837,240 790,047
Total liabilities and net assets 1,597,561$ 1,562,986$
Page 4 of 20

Via Christi Health, Inc. and SubsidiariesConsolidating Statements of Operations and Changes in Net AssetsNine Months Ended June 30, 2010 and 2009
(in thousands of dollars) FY 2010 FY 2009
Revenues, gains and other supportNet patient service revenues 695,784$ 688,685$ Other operating revenues 59,587 53,657
Total operating revenues 755,371 742,342
Operating expensesSalaries and employees benefits 379,017 363,857 Purchased services and other 117,452 110,644 Supplies 117,822 122,055 Interest 12,737 16,134 Depreciation and amortization 41,920 43,720 Provision for uncollectible accounts 46,463 48,836
Total operating expenses 715,411 705,247
Income from operations 39,960 37,095
Nonoperating gains (losses)Realized investment income 21,387 (33,345) Unrealized gains (losses) on investments (12,245) (7,369) Equity in earnings of investee organizations (364) 1,142 Loss on refunding of debt (2,695) - Income tax and other 11,038 (2,308)
Total nonoperating gains (losses) 17,121 (41,879)
Excess (deficit) of revenues over expenses before noncontrolling interest 57,081 (4,784)
Noncontrolling interest (6,940) (4,766)
Excess (deficit) of revenues over expenses 50,141$ (9,549)$
Page 5 of 20

Via Christi Health, Inc. and SubsidiariesConsolidating Statements of Operations and Changes in Net AssetsNine Months Ended June 30, 2010 and 2009
(in thousands of dollars) FY 2010 FY 2009
Unrestricted net assetsExcess of revenues over expenses 50,141$ (9,549)$ Change in net unrealized gain on investments 37 - Net assets released from restriction (98) - Net pension adjustment - - Net transfers to sponsoring organizations - - Other changes in unrestricted net assets 6,445 (5,883)
Increase (decrease) in unrestricted net assets 56,525 (15,432)
Temporarily restricted net assetsContributions 2,220 2,094 Investment income and gains 367 (579) Net realized and unrealized gains (losses) on investments (208) (204) Net assets released from restrictions (2,060) (1,925) Other (187) (51)
Increase (decrease) in temporarily restricted net assets 132 (665)
Permanently restricted net assetsContributions for endowment and other - -
Increase (decrease) in permanently restricted net assets - -
Income (loss) from discontinued operations (9,464) (1,951)
Increase (decrease) in net assets 47,193 (18,048)
Net assets, beginning of year 790,047 799,463
Net assets, end of period 837,240$ 781,415$
Page 6 of 20

Via Christi Health, Inc. and SubsidiariesConsolidated Statements of Cash FlowsNine Months Ended June 30, 2010 and 2009
(in thousands of dollars) FY 2010 FY 2009
Operating activitiesIncrease (decrease) in net assets 47,193$ (18,048)$ Adjustments to reconcile decrease in net assets to netcash provided by operating activities Depreciation and amortization 41,920 43,720 Provision for uncollectible accounts 46,463 48,836 Equity in earnings of investee organization 364 (1,142) Noncontrolling interest in earnings of investee organizations 6,940 4,766 Net realized and unrealized losses on investments 12,049 8,152 (Increase) decrease in operating assets Net patient accounts receivable (48,598) (38,090) Inventories and other assets 83,329 8,297 Increase (decrease) in operating liabilities Accounts payable and accrued liabilities (2,457) (12,318) Net estimated amounts do to/from third-party payors (1,252) 4,394 Other liabilities (20,142) (4,553) Net cash provided by operating activities 165,810 44,013
Investing activitiesAdditions to property and equipment (72,965) (40,005) (Increase)decrease in assets whose use is limited 95 (35,864) Net cash used in investing activities (72,871) (75,868)
Financing activitiesProceeds from long-term debt 93,102 - Payments on long-term debt (90,061) (10,297) Net cash used in financing activities 3,041 (10,297)
Net decrease in cash and cash equivalents 95,980 (42,152)
Cash and short-term investmentsBeginning of year 408,979 350,820
End of period 504,959$ 308,668$
Page 7 of 20

Via Christi Health, Inc. and SubsidiariesConsolidating Balance SheetJune 30, 2010
(in thousands of dollars) VCRMC Mt. Carmel Mercy Wichita Senior AMS Preferred FY 2010Consolidated Pittsburg Manhattan Health System Services Lab Health Systems Eliminations Consolidated
AssetsCurrent assets
Cash and investments 199,009$ 34,363$ 19,442$ 227,907$ 21,084$ 3,154$ -$ -$ 504,959$ Patient accounts receivable - net 74,470 9,399 10,573 - 5,482 1,891 - - 101,815 Estimated amounts receivable from third-party payors 2,090 30 - - - - - (764) 1,356 Other current assets 95,098 3,937 4,580 28,691 1,080 288 - (10,914) 122,760 Assets of discontinued operations, held for sale - - - - - - - - -
Total current assets 370,667 47,729 34,595 256,598 27,646 5,333 - (11,678) 730,890
Assets whose use is limitedBoard designated assets 167,376 - 5,374 - 1,366 - - - 174,116 Trustee-held funds 4,615 - 3,629 76,879 - - - - 85,123
- - - - - - - - - Total noncurrent portion of assets whose use is limited 171,991 - 9,003 76,879 1,366 - - - 259,239
Property and equipment 757,080 77,386 122,609 12,205 132,595 2,956 - - 1,104,831 Less accumulated depreciation (472,941) (43,401) (55,269) (6,509) (43,273) (1,457) - - (622,850)
Total net property and equipment 284,139 33,985 67,340 5,696 89,322 1,499 - - 481,981
Other assetsLong-term investments - - 17,871 - - - - - 17,871 Other assets 30,533 423 2,611 347,021 756 1 - (273,765) 107,580
Total assets 857,330$ 82,137$ 131,420$ 686,194$ 119,090$ 6,833$ -$ (285,443)$ 1,597,561$
Liabilities and Net AssetsCurrent liabilities
Current maturities of long-term debt 7,784$ 75$ 1,879$ 8,275$ 3,573$ -$ -$ (10,914)$ 10,672$ Accounts payable 26,215 2,973 3,893 2,065 1,726 240 - - 37,112 Accrued liabilities 26,478 3,690 4,749 80,147 3,910 389 - - 119,363 Estimated amounts due to third-party payors - - 764 - - - - (764) - Liabilities of discontinued operations, held for sale - - - - - - - - -
Total current liabilities 60,477 6,738 11,285 90,487 9,209 629 - (11,678) 167,147
Noncurrent liabilitiesLong-term debt, less current maturities 226,652 830 41,244 397,341 66,909 - - (273,665) 459,311 Other noncurrent liabilities including noncontrolling interest 45,818 2,856 9,544 21,569 17,566 237 - 36,273 133,863
Total noncurrent liabilities 272,470 3,686 50,788 418,910 84,475 237 - (237,392) 593,174
Total liabilities 332,947 10,424 62,073 509,397 93,684 866 - (249,070) 760,321
Net assetsUnrestricted 512,078 71,701 66,148 176,797 25,243 5,967 - (33,174) 824,760 Temporarily restricted 6,385 12 2,551 - 163 - - (2,551) 6,560 Permanently restricted 5,920 - 648 - - - - (648) 5,920
Total net assets 524,383 71,713 69,347 176,797 25,406 5,967 - (36,373) 837,240
Total liabilities and net assets 857,330$ 82,137$ 131,420$ 686,194$ 119,090$ 6,833$ -$ (285,443)$ 1,597,561$
Page 8 of 20

Via Christi Health, Inc. and SubsidiariesConsolidating Statements of Operations and Changes in Net AssetsNine Months Ended June 30, 2010
VCRMC Mt. Carmel Mercy Wichita Senior AMS Preferred FY 2010Consolidated Pittsburg Manhattan Health System Services Lab Health Systems Eliminations Consolidated
Revenues, gains and other supportNet patient service revenues 516,701$ 61,449$ 71,011$ -$ 46,623$ -$ -$ -$ 695,784$ Other operating revenues 32,239 1,815 2,894 42,667 11,953 9,620 140,010 (181,611) 59,587
Total operating revenues 548,940 63,264 73,905 42,667 58,576 9,620 140,010 (181,611) 755,371
Operating expensesSalaries and employees benefits 251,087 32,552 36,290 24,373 31,523 3,191 4,929 (4,929) 379,017 Purchased services and other 117,182 11,684 12,107 (9,421) 10,895 3,001 136,424 (164,420) 117,452 Supplies 84,716 10,556 12,695 1,806 5,965 2,084 47 (47) 117,822 Interest 7,843 52 2,157 13,024 3,266 - - (13,605) 12,737 Depreciation and amortization 23,151 3,221 5,326 6,220 3,813 190 308 (308) 41,920 Provision for uncollectible accounts 41,234 2,626 1,841 - 641 121 - - 46,463
Total operating expenses 525,213 60,691 70,416 36,002 56,103 8,587 141,708 (183,309) 715,411
Income )loss) from operations 23,727 2,573 3,489 6,665 2,474 1,033 (1,698) 1,698 39,960
Nonoperating gains (losses)Realized investment income 13,685 1,178 645 5,538 257 85 (321) 321 21,387 Unrealized gains (losses) on investments (7,723) (495) 197 (4,252) 78 (50) - - (12,245) Equity in earnings of investee organizations - - - (364) - - - - (364) Loss on refunding of debt - - - (2,695) - - - - (2,695) Income tax and other 1,662 263 350 69,873 (353) (237) (7,445) (53,074) 11,038
Total nonoperating gains 7,624 946 1,192 68,100 (18) (203) (7,766) (52,753) 17,121
Excess of revenues over expenses before noncontrolling interest 31,350 3,519 4,681 74,765 2,455 830 (9,464) (51,055) 57,081
Noncontrolling interest (3,915) - (281) - (544) - - (2,200) (6,940)
Excess of revenues over expenses 27,435$ 3,519$ 4,400$ 74,765$ 1,911$ 830$ (9,464)$ (53,255)$ 50,141$
Page 9 of 20

Via Christi Health, Inc. and SubsidiariesConsolidating Statements of Operations and Changes in Net AssetsNine Months Ended June 30, 2010
VCRMC Mt. Carmel Mercy Wichita Senior AMS Preferred FY 2010Consolidated Pittsburg Manhattan Health System Services Lab Health Systems Eliminations Consolidated
Unrestricted net assetsExcess of revenues over expenses 27,435$ 3,519$ 4,400$ 74,765$ 1,911$ 830$ (9,464)$ (53,255)$ 50,141$ Change in net unrealized gain on investments - - - - - - 37 - 37 Net assets released from restriction (98) - - - - - - - (98) Change in other comprehensive income - Pension - - - - - - - - - Net transfers to sponsoring organizations - - - - - - - - - Other changes in unrestricted net assets (587) - (224) (1,256) 424 (9) (53,035) 61,132 6,445
Increase in unrestricted net assets 26,750 3,519 4,176 73,509 2,335 821 (62,462) 7,877 56,525
Temporarily restricted net assetsContributions 2,208 12 - - - - - - 2,220 Investment income and gains 367 - - - - - - - 367 Net realized and unrealized gains (losses) on investments (208) - - - - - - - (208) Net assets released from restrictions (1,841) (219) (174) - - - - 174 (2,060) Other (93) - 231 - (93) - - (232) (187)
Increase in temporarily restricted net assets 433 (207) 57 - (93) - - (58) 132
Permanently restricted net assetsContributions for endowment and other - - 1 - - - - (1) -
Increase in permanently restricted net assets - - 1 - - - - (1) -
Net income (loss) from discontinued operations - - - - - - - (9,464) (9,464)
Increase in net assets 27,183 3,312 4,234 73,509 2,242 821 (62,462) (1,646) 47,193
Net assets, beginning of year 497,200 68,401 65,113 103,288 23,164 5,146 62,462 (34,727) 790,047
Net assets, end of period 524,383$ 71,713$ 69,347$ 176,797$ 25,406$ 5,967$ -$ (36,373)$ 837,240$
Page 10 of 20

MANAGEMENT’S DISCUSSION OF RECENT FINANCIAL PERFORMANCE VIA CHRISTI HEALTH INC. - OBLIGATED GROUP
Nine Months Ended June 30, 2010. All results for the nine months ended June 30, 2010 and comparisons to the prior period reflect Preferred Health Systems as discontinued operations.
Inpatient days for the nine months ended June 30, 2010 were 149,404 which represent a decrease of 7,088 days or 4.5% from the nine months ended June 30, 2009. The decrease was the result of a 4.5% decrease in admissions. Inpatient volumes have been soft for the first nine months, primarily in the Wichita market. Outpatient visits for the nine months ended June 30, 2010 were 361,884 which represent a increase of 325 visits or 0.1% from the nine months ended June 30, 2009. This decline of inpatient volumes seems to be a combination of the overall weakness in the economy and the expiration of COBRA benefits for employees laid off in the Wichita aviation industry.
Total operating revenue for the nine months ended June 30, 2010 was $560.2 million which represents an increase of $4.0 million or 0.7% from the nine months ended June 30, 2009.
Total operating expenses for the nine months ended June 30, 2010 were $533.4 million which represents an increase of $0.2 million or 0.0% from the nine months ended June 30, 2009. Total operating expenses, excluding depreciation, amortization and interest expense, for the nine months ended June 30, 2010 increased $5.6 million or 1.1% from the same time period the previous year. Salaries, wages and employee benefits increased $13.1 million or 4.8% from June 30, 2009 to June 30, 2010, due to wage increases. Supplies expense for the nine months ended June 30, 2010 was $84.7 million which represents a decrease of $5.0 million or 5.5% due primarily to reduced inpatient volumes. Other operating expenses for the nine months ended June 30, 2010 were $84.0 million which represents a decrease of $0.5 million or 0.7%. Provision for bad debts for the nine months ended June 30, 2010 was $42.7 million which represents a decrease of $3.1 million or 6.8%. Depreciation and amortization expense increased was equal to prior year.
As a result of the activities described above, operating income for the nine months ended June 30, 2010 was $26.8 million, which represents an increase of $4.2 million or 18.5% from the same time period the previous year. The Obligated Group reported a 4.8% operating margin.
Total net nonoperating gains, for the nine months ended June 30, 2010 were $12.9 million which represents an improvement of $48.8 million from the nine months ended June 30, 2009. Net realized and unrealized investment gains for the nine months ended June 30, 2010 were $6.3 million, which represents an improvement of $41.6 million compared to the prior year. These funds are invested according to the VCH’s investment policy which has an asset allocation target of 50% fixed income, 40% equities, and 10% alternate investments.
Total excess of revenues over expenses from continuing operations for the nine months ended June 30, 2010 were $39.7 million which represents an increase of $53.0 million from June 30, 2009. Total revenue and gains in excess of expenses and losses from continuing operations represent a 7.1% total margin.
Page 11 of 20
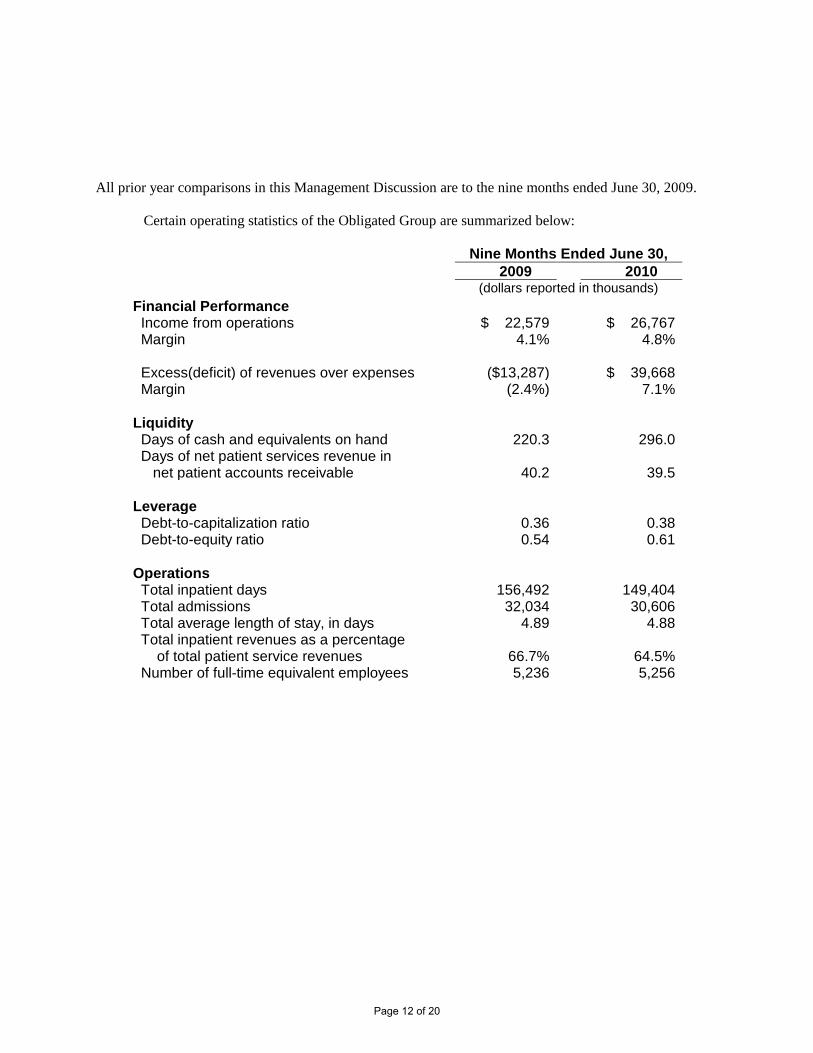
All prior year comparisons in this Management Discussion are to the nine months ended June 30, 2009.
Certain operating statistics of the Obligated Group are summarized below:
Nine Months Ended June 30, 2009 2010 (dollars reported in thousands) Financial Performance Income from operations $ 22,579 $ 26,767 Margin 4.1% 4.8% Excess(deficit) of revenues over expenses ($13,287) $ 39,668 Margin (2.4%) 7.1% Liquidity Days of cash and equivalents on hand 220.3 296.0 Days of net patient services revenue in net patient accounts receivable
40.2
39.5
Leverage Debt-to-capitalization ratio 0.36 0.38 Debt-to-equity ratio 0.54 0.61 Operations Total inpatient days 156,492 149,404 Total admissions 32,034 30,606 Total average length of stay, in days 4.89 4.88 Total inpatient revenues as a percentage of total patient service revenues
66.7%
64.5%
Number of full-time equivalent employees 5,236 5,256
Page 12 of 20
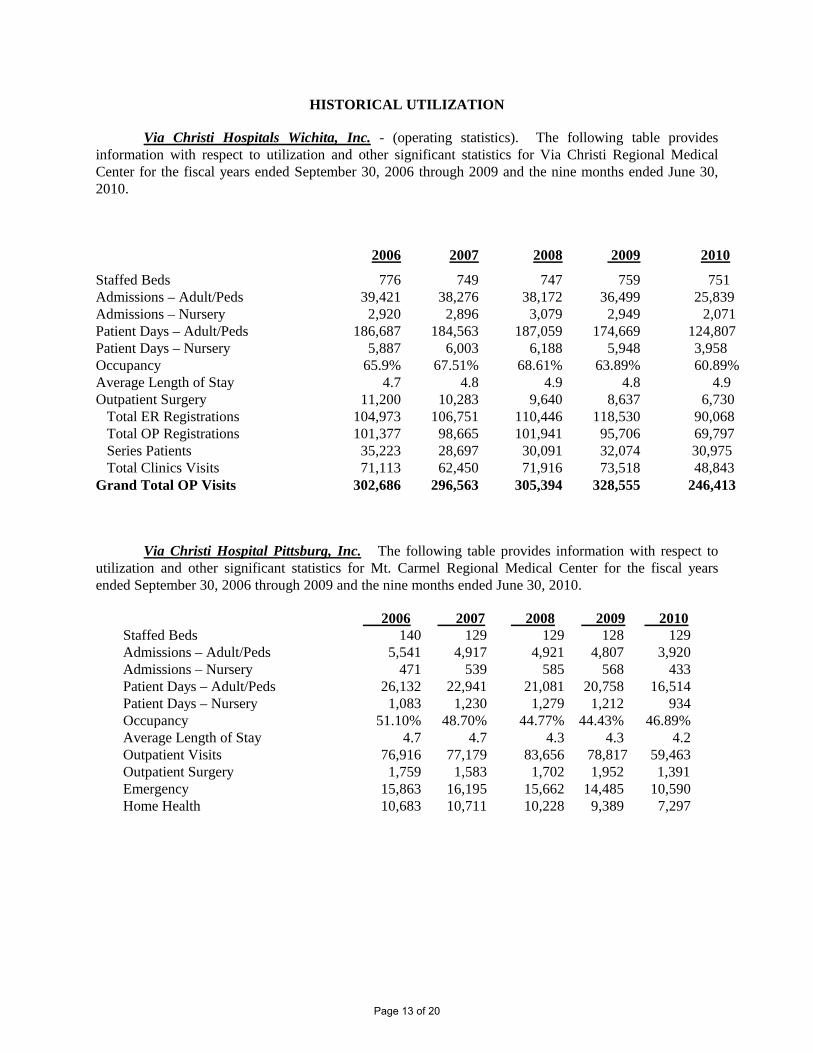
HISTORICAL UTILIZATION
Via Christi Hospitals Wichita, Inc. - (operating statistics). The following table provides information with respect to utilization and other significant statistics for Via Christi Regional Medical Center for the fiscal years ended September 30, 2006 through 2009 and the nine months ended June 30, 2010.
2006 2007 2008 2009 2010
Staffed Beds 776 749 747 759 751 Admissions – Adult/Peds 39,421 38,276 38,172 36,499 25,839 Admissions – Nursery 2,920 2,896 3,079 2,949 2,071 Patient Days – Adult/Peds 186,687 184,563 187,059 174,669 124,807 Patient Days – Nursery 5,887 6,003 6,188 5,948 3,958 Occupancy 65.9% 67.51% 68.61% 63.89% 60.89% Average Length of Stay 4.7 4.8 4.9 4.8 4.9 Outpatient Surgery 11,200 10,283 9,640 8,637 6,730 Total ER Registrations 104,973 106,751 110,446 118,530 90,068 Total OP Registrations 101,377 98,665 101,941 95,706 69,797 Series Patients 35,223 28,697 30,091 32,074 30,975 Total Clinics Visits 71,113 62,450 71,916 73,518 48,843 Grand Total OP Visits 302,686 296,563 305,394 328,555 246,413
Via Christi Hospital Pittsburg, Inc. The following table provides information with respect to utilization and other significant statistics for Mt. Carmel Regional Medical Center for the fiscal years ended September 30, 2006 through 2009 and the nine months ended June 30, 2010.
2006 2007 2008 2009 2010 Staffed Beds 140 129 129 128 129 Admissions – Adult/Peds 5,541 4,917 4,921 4,807 3,920 Admissions – Nursery 471 539 585 568 433 Patient Days – Adult/Peds 26,132 22,941 21,081 20,758 16,514 Patient Days – Nursery 1,083 1,230 1,279 1,212 934 Occupancy 51.10% 48.70% 44.77% 44.43% 46.89% Average Length of Stay 4.7 4.7 4.3 4.3 4.2 Outpatient Visits 76,916 77,179 83,656 78,817 59,463 Outpatient Surgery 1,759 1,583 1,702 1,952 1,391 Emergency 15,863 16,195 15,662 14,485 10,590 Home Health 10,683 10,711 10,228 9,389 7,297
Page 13 of 20

Via Christi Rehabilitation Hospital, Inc. The following table sets forth utilization statistics for the Rehabilitation Center for the fiscal years ended September 30, 2006 through 2009 and the nine months ended June 30, 2010.
2006 2007 2008 2009 2010
Staffed Beds 58 58 58 58 58 Admissions – Other 999 859 829 816 595 Patient Days – Other 13,227 11,332 12,060 11,397 8,218 Occupancy 62.5% 53.53% 56.97% 53.84% 51.90% Average Length of Stay 13.2 13.2 14.5 14.0 13.8 Outpatient Visits 100,907 103,602 109,750 91,961 69,567
SOURCES OF COMBINED GROSS PATIENT REVENUES The following table provides information with respect to sources of combined gross patient
revenues of the Obligated Group for the fiscal years ended September 30, 2006 through 2009 and the nine months ended June 30, 2010.
Payor Type 2006 2007 2008 2009 2010 Managed Care & Other 32.9% 33.7% 33.6% 34.5% 32.0% Medicare 45.8% 44.9% 44.8% 42.0% 44.7% Medicaid 13.6% 14.2% 14.1% 15.1% 11.9% Uninsured 7.7% 7.2% 7.5% 8.4% 11.4% 100% 100% 100% 100% 100%
Statements contained in this commentary regarding expected operating results, transactions and other events are forward-looking statements that involve risk and uncertainties. Actual future events or results may differ materially from these statements. Via Christi Health Inc. undertakes no obligation to revise or update any forward-looking statements, or to make any other forward-looking statements, whether as a result of new information, future events or otherwise.
Page 14 of 20

Via Christi Health, Inc. and SubsidiariesConsolidated Balance Sheet - Obligated GroupJune 30, 2010
(in thousands of dollars) June 30, 2010 September 30, 2009
AssetsCurrent assets
Cash and investments 379,775$ 294,137$ Patient accounts receivable - net 76,448 73,455 Estimated amounts receivable from third-party payors 1,927 81 Other current assets 71,756 56,256 Assets of discontinued operations, held for sale - 10,732
Total current assets 529,906 434,661
Assets whose use is limitedBoard designated assets 167,376 163,682 Trustee-held funds 65,031 83,616
- - Total noncurrent portion of assets whose use is limited 232,407 247,298
Property and equipment 665,410 682,937 Less accumulated depreciation (461,608) (438,902)
Total net property and equipment 203,802 244,035
Other assetsLong-term investments - - Other assets 278,288 170,935
Total assets 1,244,403$ 1,096,929$
Liabilities and Net AssetsCurrent liabilities
Current maturities of long-term debt 8,302$ 3,252$ Accounts payable 25,499 20,643 Accrued liabilities 103,603 46,787 Estimated amounts due to third-party payors - 482 Liabilities of discontinued operations, held for sale - -
Total current liabilities 137,404 71,164
Noncurrent liabilitiesLong-term debt, less current maturities 397,426 403,258 Other noncurrent liabilities and noncontrolling interest 41,258 50,880
Total noncurrent liabilities 438,684 454,138
Total liabilities 576,088 525,302
Net assetsUnrestricted 655,856 559,829 Temporarily restricted 6,564 5,903 Permanently restricted 5,895 5,895
Total net assets 668,315 571,627
Total liabilities and net assets 1,244,403$ 1,096,929$
Page 15 of 20

Via Christi Health, Inc. and SubsidiariesConsolidated Statements of Operations and Changes in Net Assets - Obligated GroupNine Months Ended June 30, 2010 and 2009
(in thousands of dollars) FY 2010 FY 2009
Revenues, gains and other supportNet patient service revenues 528,193$ 526,193$ Other operating revenues 32,014 29,993
Total operating revenues 560,207 556,186
Operating expensesSalaries and employees benefits 285,126 271,993 Purchased services and other 83,983 83,438 Supplies 84,709 89,684 Interest 8,167 13,445 Depreciation and amortization 28,738 29,209 Provision for uncollectible accounts 42,720 45,838
Total operating expenses 533,443 533,607
Income )loss) from operations 26,764 22,579
Nonoperating gains (losses)Realized investment income 17,529 (29,318) Unrealized gains (losses) on investments (11,203) (5,957) Equity in earnings of investee organizations (364) 1,142 Loss on refunding of debt - - Income tax and other 6,942 (1,733)
Total nonoperating gains 12,904 (35,866)
Excess of revenues over expenses before noncontrolling interest 39,668 (13,287)
Noncontrolling interest - -
Excess of revenues over expenses 39,668$ (13,287)$
Page 16 of 20

Via Christi Health, Inc. and SubsidiariesConsolidated Statements of Operations and Changes in Net Assets - Obligated GroupNine Months Ended June 30, 2010 and 2009
(in thousands of dollars) FY 2010 FY 2009
Unrestricted net assetsExcess of revenues over expenses 39,668$ (13,287)$ Change in net unrealized gain on investments - - Net assets released from restriction - 50 Nat pension adjustment - - Net transfers to sponsoring organizations - - Other changes in unrestricted net assets 56,359 2,509
Increase in unrestricted net assets 96,027 (10,728)
Temporarily restricted net assetsContributions - - Investment income and gains - - Net realized and unrealized gains (losses) on investments - - Net assets released from restrictions (219) - Other 880 (688)
Increase in temporarily restricted net assets 661 (688)
Permanently restricted net assetsContributions for endowment funds and other - -
Increase in permanently restricted net assets - -
Net income (loss) from discontinued operations - -
Increase in net assets 96,688 (11,416)
Net assets, beginning of year 571,627$ 568,806$
Net assets, end of period 668,315 557,390
Page 17 of 20

Via Christi Health, Inc. and SubsidiariesConsolidateing Balance Sheet - Obligated GroupJune 30, 2010
(in thousands of dollars)VC Hospital VC Rehab Pittsburg Wichita
Assets Wichita Hosital Mt. Carmel Health System Eliminations ConsolidatedCurrent assets
Cash and investments 114,428$ 16,431$ 32,597$ 216,319$ -$ 379,775$ Patient accounts receivable - net 64,123 2,926 9,399 - - 76,448 Estimated amounts receivable from third-party payors 1,882 15 30 - - 1,927 Other current assets 48,900 1,303 3,937 21,028 (3,412) 71,756 Assets of discontinued operations, held for sale - - - - - -
Total current assets 229,333 20,675 45,963 237,347 (3,412) 529,906
Assets whose use is limitedBoard designated assets 167,202 174 - - - 167,376 Trustee-held funds 587 - - 64,444 - 65,031
- - - - - - Total noncurrent portion of assets whose use is limited 167,789 174 - 64,444 - 232,407
Property and equipment 564,398 14,325 77,386 9,301 - 665,410 Less accumulated depreciation (405,006) (9,539) (43,401) (3,662) - (461,608)
Total net property and equipment 159,392 4,786 33,985 5,639 - 203,802
Other assetsLong-term investments - - - - - Other assets 39,875 194 423 357,521 (119,725) 278,288
Total assets 596,389$ 25,829$ 80,371$ 664,951$ (123,137)$ 1,244,403$
Liabilities and Net AssetsCurrent liabilities
Current maturities of long-term debt 2,972$ 392$ 75$ 8,275$ (3,412)$ 8,302$ Accounts payable 20,032 485 2,973 2,009 - 25,499 Accrued liabilities 21,529 2,115 3,581 76,378 - 103,603 Estimated amounts due to third-party payors - - - - - - Liabilities of discontinued operations, held for sale - - - - - -
Total current liabilities 44,533 2,992 6,629 86,662 (3,412) 137,404
Noncurrent liabilitiesLong-term debt, less current maturities 117,674 1,306 830 397,341 (119,725) 397,426 Other noncurrent liabilities and noncontrolling interest 29,484 1,589 2,856 7,329 - 41,258
Total noncurrent liabilities 147,158 2,895 3,686 404,670 (119,725) 438,684
Total liabilities 191,691 5,887 10,315 491,332 (123,137) 576,088
Net assetsUnrestricted 392,239 19,942 70,056 173,619 - 655,856 Temporarily restricted 6,564 - - - - 6,564 Permanently restricted 5,895 - - - - 5,895
Total net assets 404,698 19,942 70,056 173,619 - 668,315
Total liabilities and net assets 596,389$ 25,829$ 80,371$ 664,951$ (123,137)$ 1,244,403$
Page 18 of 20

Via Christi Health, Inc. and SubsidiariesConsolidating Statements of Operations and Changes in Net Assets - Obligated GroupNine Months Ended June 30, 2010
VC Hospital VC Rehab Pittsburg WichitaWichita Hosital Mt. Carmel Health System Eliminations Consolidated
Revenues, gains and other supportNet patient service revenues 449,917$ 16,827$ 61,449$ -$ -$ 528,193$ Other operating revenues 19,780 798 1,691 36,818 (27,073) 32,014
Total operating revenues 469,697 17,625 63,140 36,818 (27,073) 560,207
Operating expensesSalaries and employees benefits 219,217 11,607 32,510 21,792 - 285,126 Purchased services and other 96,774 3,976 11,632 (12,074) (16,325) 83,983 Supplies 71,411 952 10,555 1,791 - 84,709 Interest 5,747 92 52 13,024 (10,748) 8,167 Depreciation and amortization 18,822 509 3,221 6,186 - 28,738 Provision for uncollectible accounts 39,986 108 2,626 - - 42,720
Total operating expenses 451,957 17,244 60,596 30,719 (27,073) 533,443
Income )loss) from operations 17,740 381 2,544 6,099 - 26,764
Nonoperating gains (losses)Realized investment income 10,823 615 1,167 4,924 - 17,529 Unrealized gains (losses) on investments (6,129) (422) (495) (4,157) - (11,203) Equity in earnings of investee organizations - - - (364) - (364) Loss on refunding of debt - - - - - - Income tax and other 22 (2) 263 67,178 (60,519) 6,942
Total nonoperating gains 4,716 191 935 67,581 (60,519) 12,904
Excess of revenues over expenses before noncontrolling interest 22,456 572 3,479 73,680 (60,519) 39,668
Noncontrolling interest - - - - - -
Excess of revenues over expenses 22,456$ 572$ 3,479$ 73,680$ (60,519)$ 39,668$
Page 19 of 20

Via Christi Health, Inc. and SubsidiariesConsolidating Statements of Operations and Changes in Net Assets - Obligated GroupNine Months Ended June 30, 2010
VC Hospital VC Rehab Pittsburg WichitaWichita Hosital Mt. Carmel Health System Eliminations Consolidated
Unrestricted net assetsExcess of revenues over expenses 22,456$ 572$ 3,479$ 73,680$ (60,519)$ 39,668$ Change in net unrealized gain on investments - - - - - - Net assets released from restriction - - - - - - Nat pension adjustment - - - - - - Net transfers to sponsoring organizations - - - - - - Other changes in unrestricted net assets (517) (24) (1) (3,618) 60,519 56,359
+Increase in unrestricted net assets 21,939 548 3,478 70,062 - 96,027
Temporarily restricted net assetsContributions - - - - - - Investment income and gains - - - - - - Net realized and unrealized gains (losses) on investments - - - - - - Net assets released from restrictions - - (219) - - (219) Other 880 - - - - 880
Increase in temporarily restricted net assets 880 - (219) - - 661
Permanently restricted net assetsContributions for endowment funds and other - - - - - -
Increase in permanently restricted net assets - - - - - -
Net income (loss) from discontinued operations - - - - - -
Increase in net assets 22,819 548 3,259 70,062 - 96,688
Net assets, beginning of year 381,879 19,394 66,797 103,557 - 571,627
Net assets, end of period 404,698$ 19,942$ 70,056$ 173,619$ -$ 668,315$
Page 20 of 20