Management Tools and CGM Kathryn Moe, RN CDE Medtronic Diabetes.
32
Management Tools Management Tools and CGM and CGM Kathryn Moe, RN CDE Kathryn Moe, RN CDE Medtronic Diabetes Medtronic Diabetes
-
Upload
timothy-haynes -
Category
Documents
-
view
221 -
download
0
Transcript of Management Tools and CGM Kathryn Moe, RN CDE Medtronic Diabetes.
Management Tools and Management Tools and CGMCGM
Kathryn Moe, RN CDEKathryn Moe, RN CDE
Medtronic DiabetesMedtronic Diabetes
ObjectivesObjectives
Define the terms Define the terms basal basal andand bolus bolus Define how Define how basal basal and and bolus apply to bolus apply to
insulin pump therapyinsulin pump therapy Explain how the insulin pump can calculateExplain how the insulin pump can calculate
insulin doses based on ICR set up by the insulin doses based on ICR set up by the
dietitiandietitian Define Continuous Glucose MonitoringDefine Continuous Glucose Monitoring
Objectives cont’dObjectives cont’d
Explain the difference between Explain the difference between professionalprofessional
and and personal cgmpersonal cgm Explain how cgm can be utilized by the Explain how cgm can be utilized by the
dietitian to assess correct ICRdietitian to assess correct ICR
Diabetes 101Diabetes 101
Types of Diabetes MellitusTypes of Diabetes Mellitus PathophysiologyPathophysiology Treatment ModalitiesTreatment Modalities
Types of Diabetes MellitusTypes of Diabetes Mellitus
Type 1Type 1 Type 2Type 2 Gestational Gestational LADALADA
Definition of DMDefinition of DM
Metabolic disorder involving the beta cells of Metabolic disorder involving the beta cells of the pancreasthe pancreas
A group of diseases marked by high levels of A group of diseases marked by high levels of blood glucose resulting from defects in insulin blood glucose resulting from defects in insulin production, insulin action, or bothproduction, insulin action, or both
Type 1Type 1
Type 1 Diabetes MellitusType 1 Diabetes Mellitus
Caused by an autoimmune disorder that Caused by an autoimmune disorder that results in pancreatic beta cell destruction and results in pancreatic beta cell destruction and absolute insulin deficiencyabsolute insulin deficiency
Makes up ~ 5 to 10% of all DMMakes up ~ 5 to 10% of all DM
Must have exogenous insulin in order to Must have exogenous insulin in order to survivesurvive
Type 2Type 2
Insulin ResistanceInsulin Resistance
Increases with age, obesity, and inactivityIncreases with age, obesity, and inactivity Primary Beta Cell Dysfunction and Beta Cell Primary Beta Cell Dysfunction and Beta Cell
LossLoss
Results from loss of beta cell mass and the Results from loss of beta cell mass and the inability of the beta cells to recognize glucoseinability of the beta cells to recognize glucose
Gestational DMGestational DM
Occurs during pregnancyOccurs during pregnancy Can often resolve after deliveryCan often resolve after delivery Can return later in life as Type 2Can return later in life as Type 2
LADALADA
Form of Type 1 Form of Type 1 Diagnosed usually after the age of 30Diagnosed usually after the age of 30 Non-obese individualsNon-obese individuals Insulin dependency gradually occursInsulin dependency gradually occurs
Treatment ModalitiesTreatment Modalities
Lifestyle changesLifestyle changes Oral agentsOral agents InsulinInsulin NutritionNutrition
How insulin pumps mimic How insulin pumps mimic pancreatic insulin secretionpancreatic insulin secretion
Uses only rapid acting insulin analogsUses only rapid acting insulin analogs Uses basal/bolus insulin deliveryUses basal/bolus insulin delivery Can quickly make adjustments up or down in Can quickly make adjustments up or down in
the basal ratethe basal rate Bolus features that can accommodate glucose Bolus features that can accommodate glucose
release from high fat foods, gastroparesis, release from high fat foods, gastroparesis, etc… etc…
Time
Insu
lin
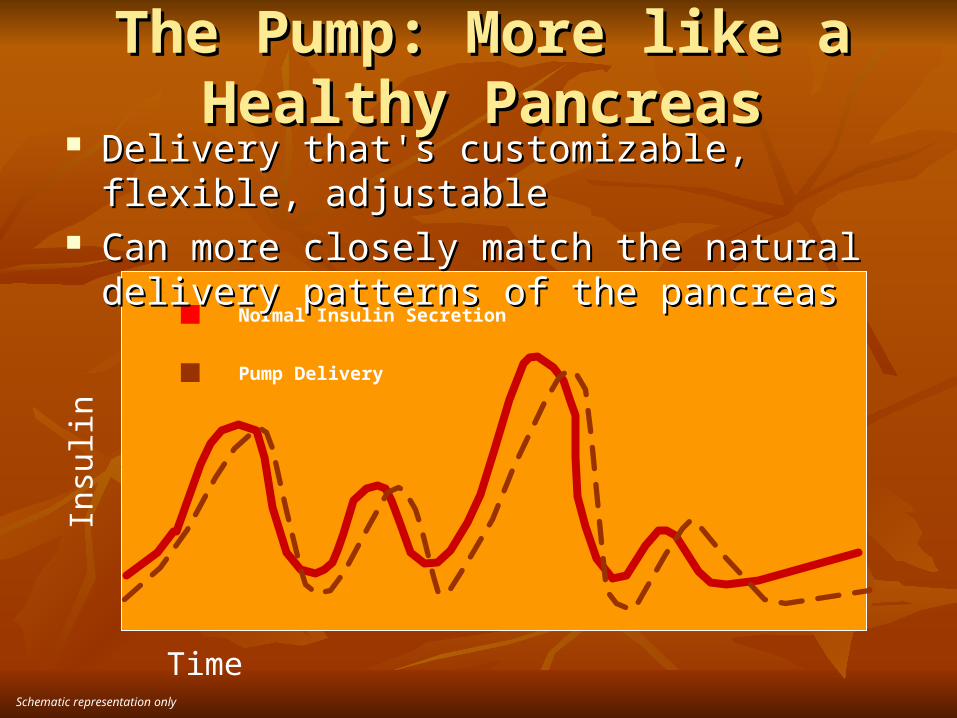
Normal Insulin Secretion
Pump Delivery
Schematic representation only
The Pump: More like a Healthy The Pump: More like a Healthy PancreasPancreas
Delivery that's customizable, flexible, adjustableDelivery that's customizable, flexible, adjustable Can more closely match the natural delivery patterns Can more closely match the natural delivery patterns
of the pancreasof the pancreas
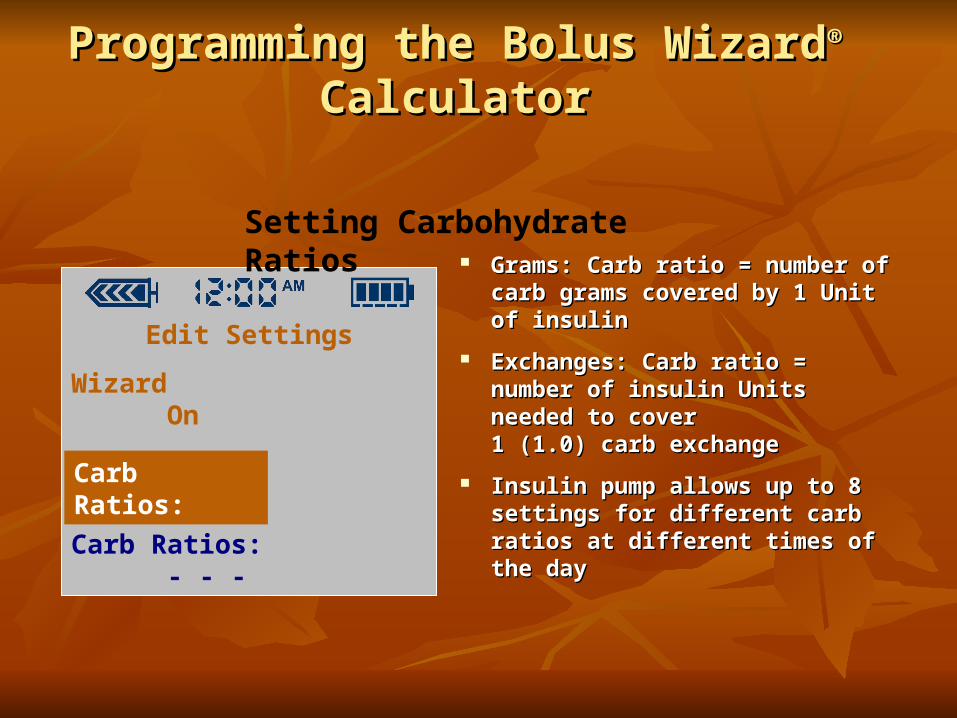
Programming the Bolus WizardProgramming the Bolus Wizard® ® CalculatorCalculator
Grams: Carb ratio = number of Grams: Carb ratio = number of carb grams covered by 1 Unit of carb grams covered by 1 Unit of insulininsulin
Exchanges: Carb ratio = number Exchanges: Carb ratio = number of insulin Units needed to cover of insulin Units needed to cover 1 (1.0) carb exchange1 (1.0) carb exchange
Insulin pump allows up to 8 Insulin pump allows up to 8 settings for different carb ratios at settings for different carb ratios at different times of the daydifferent times of the day
Select Carb Ratios.
Press ACT.
Edit Settings
Wizard On
Carb Units: Grams
Carb Ratios: - - -Carb Ratios:
Setting Carbohydrate Ratios
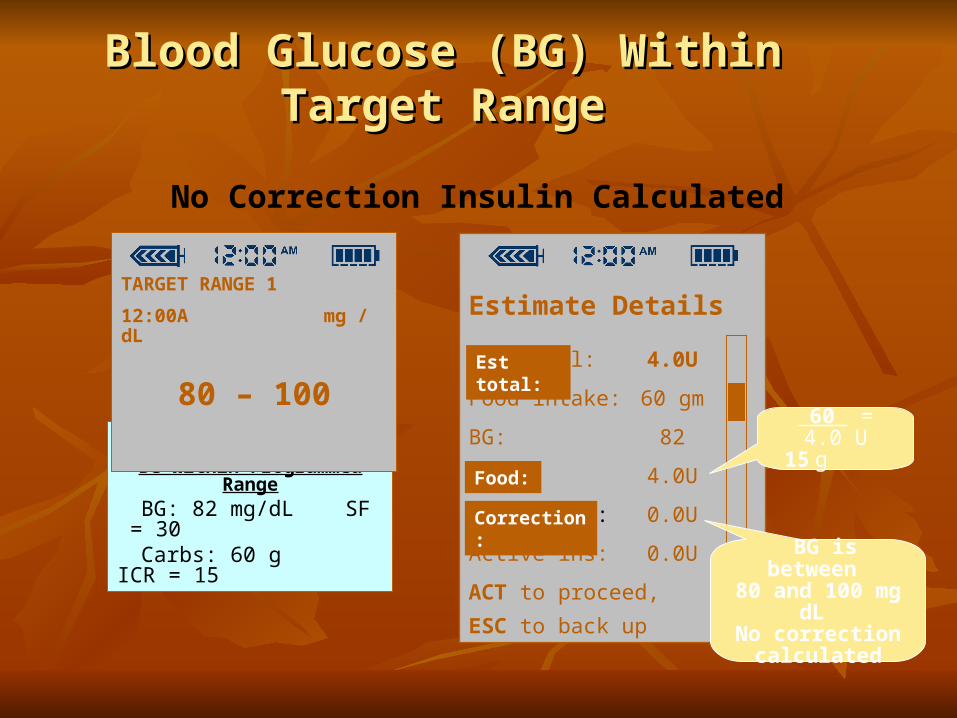
Blood Glucose (BG) Within Target RangeBlood Glucose (BG) Within Target Range
–
Estimate Details
Est total: 4.0U
Food intake: 60 gm
BG: 82
Food: 4.0U
Correction: 0.0U
Active ins: 0.0U
ACT to proceed,
ESC to back up
Food:
Correction:
Est total:
Example
BG Within Programmed Range
BG: 82 mg/dL SF = 30Carbs: 60 g ICR = 15
BG is between 80 and 100 mg dL
No correction calculated
60 = 4.0 U15 g
TARGET RANGE 1
12:00A mg / dL
80 – 100
No Correction Insulin Calculated
Continuous Glucose MonitorContinuous Glucose Monitor
ProfessionalProfessional PersonalPersonal
CGMCGM
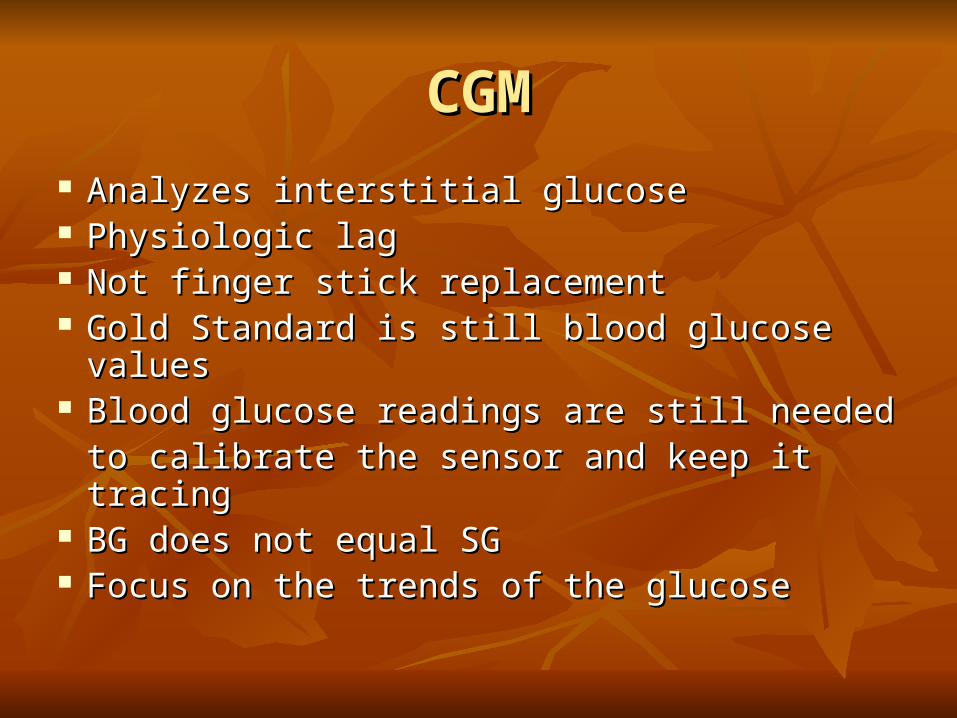
Analyzes interstitial glucoseAnalyzes interstitial glucose Physiologic lag Physiologic lag Not finger stick replacementNot finger stick replacement Gold Standard is still blood glucose valuesGold Standard is still blood glucose values Blood glucose readings are still neededBlood glucose readings are still needed
to calibrate the sensor and keep it tracingto calibrate the sensor and keep it tracing BG does not equal SGBG does not equal SG Focus on the trends of the glucoseFocus on the trends of the glucose
Professional CGMProfessional CGM
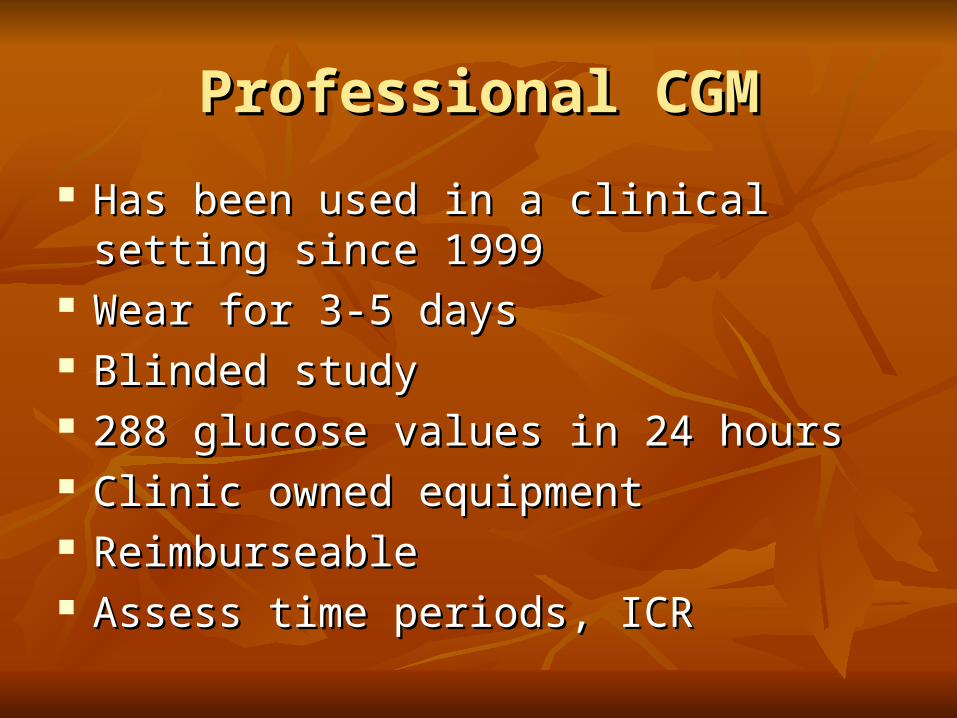
Has been used in a clinical setting since 1999Has been used in a clinical setting since 1999 Wear for 3-5 daysWear for 3-5 days Blinded studyBlinded study 288 glucose values in 24 hours288 glucose values in 24 hours Clinic owned equipmentClinic owned equipment ReimburseableReimburseable Assess time periods, ICRAssess time periods, ICR

Patient Responsibility Patient Responsibility
Testing four times a Testing four times a dayday
Fill out food log sheetFill out food log sheet
Bring the device back Bring the device back to the office 6 days to the office 6 days laterlater

C.A. – Lantus @ bedtime, Humalog SS
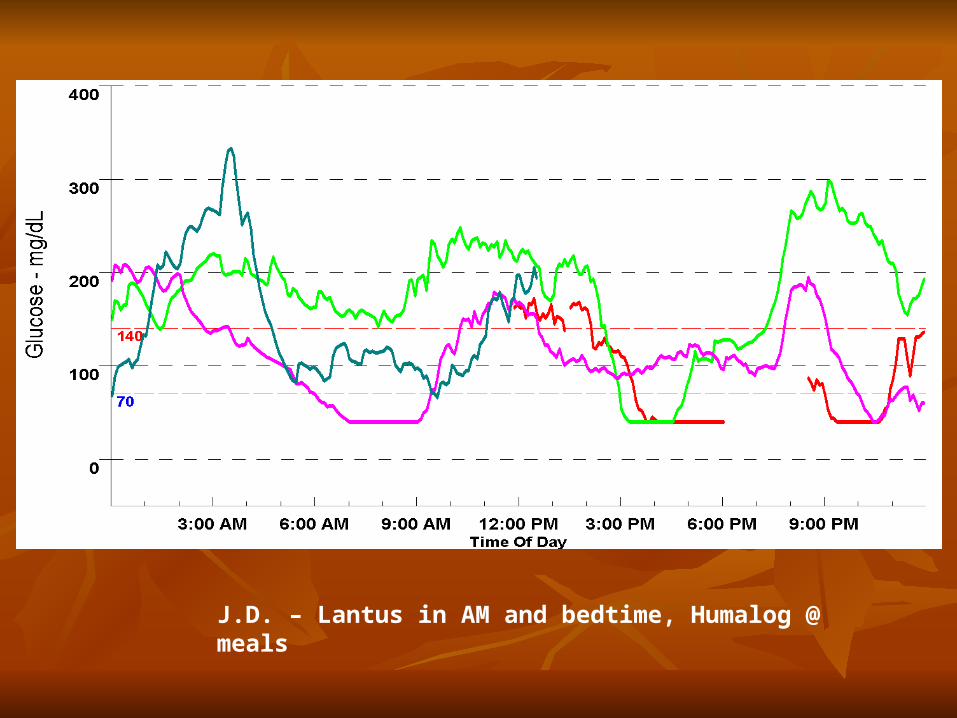
J.D. – Lantus in AM and bedtime, Humalog @ meals
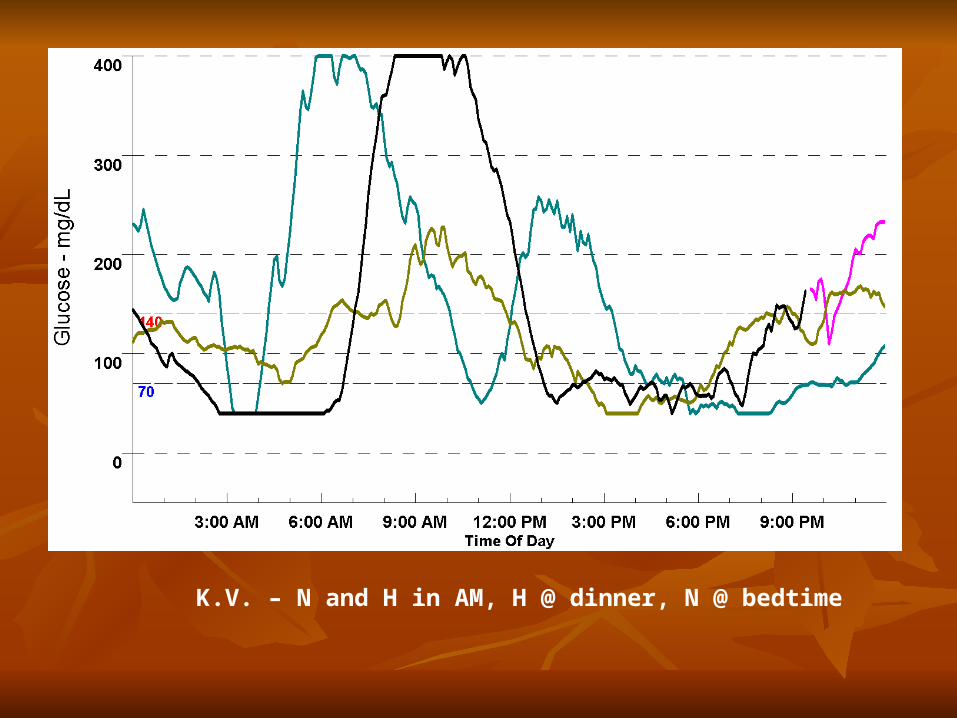
K.V. – N and H in AM, H @ dinner, N @ bedtime
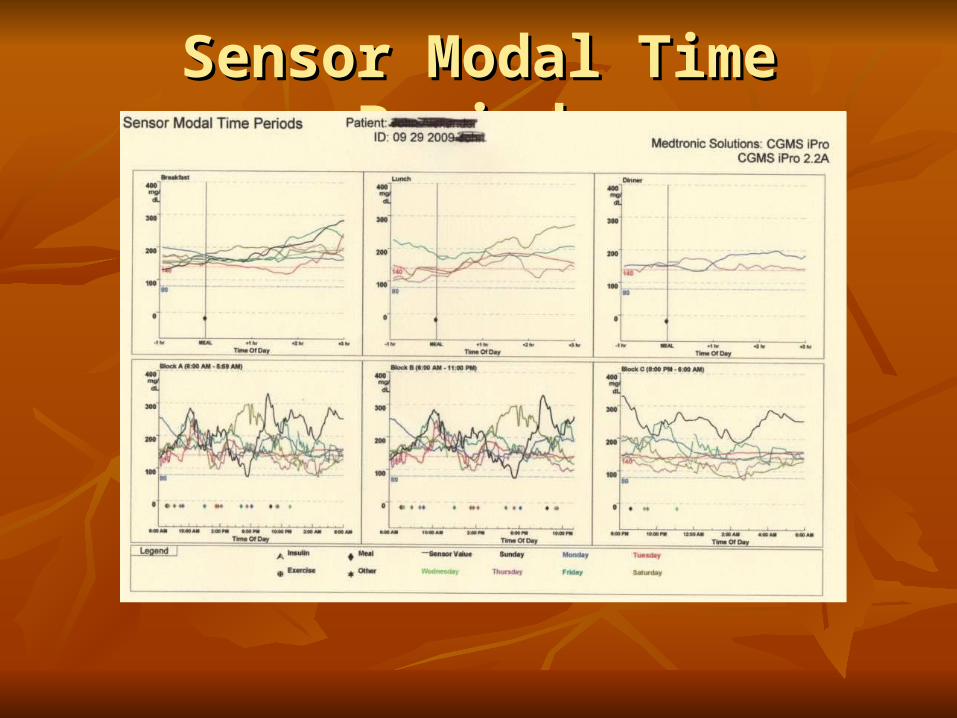
Sensor Modal Time PeriodsSensor Modal Time Periods
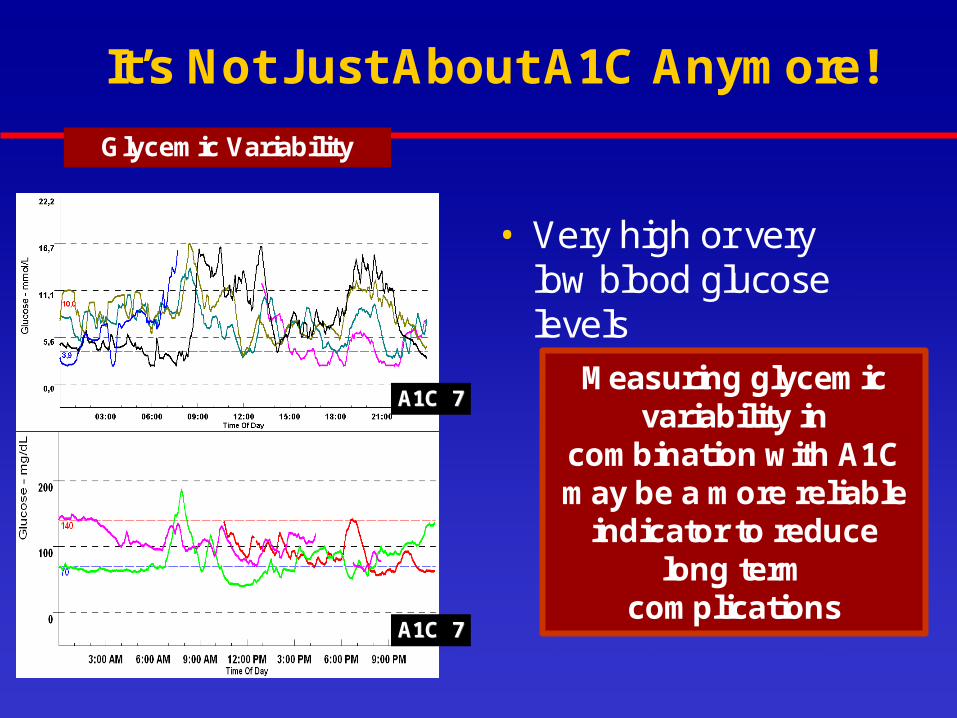
It’s Not Just About A1C Anymore!
• Very high or very low blood glucose levels– Missed with
Fingersticks
– Missed with A1C
Glycemic Variability
A1C 7A1C 7
A1C 7A1C 7
Measuring glycemic variability in
combination with A1C may be a more reliable
indicator to reduce long term
complications
It’s Not Just About A1C Anymore!
• Very high or very low blood glucose levels– Missed with
Fingersticks
– Missed with A1C
Glycemic Variability
A1C 7A1C 7
A1C 7A1C 7
Measuring glycemic variability in
combination with A1C may be a more reliable
indicator to reduce long term
complications
It’s Not Just About A1C Anymore!
• Very high or very low blood glucose levels– Missed with
Fingersticks
– Missed with A1C
Glycemic Variability
A1C 7A1C 7
A1C 7A1C 7
Measuring glycemic variability in
combination with A1C may be a more reliable
indicator to reduce long term
complications
Personal CGMPersonal CGM
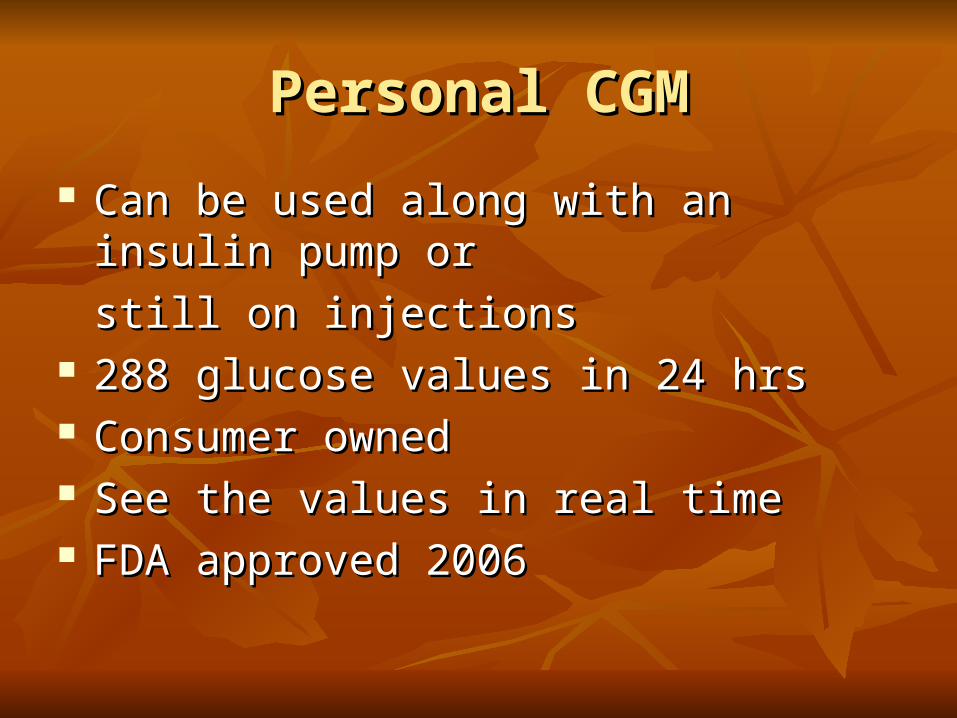
Can be used along with an insulin pump orCan be used along with an insulin pump or
still on injectionsstill on injections 288 glucose values in 24 hrs288 glucose values in 24 hrs Consumer ownedConsumer owned See the values in real timeSee the values in real time FDA approved 2006FDA approved 2006
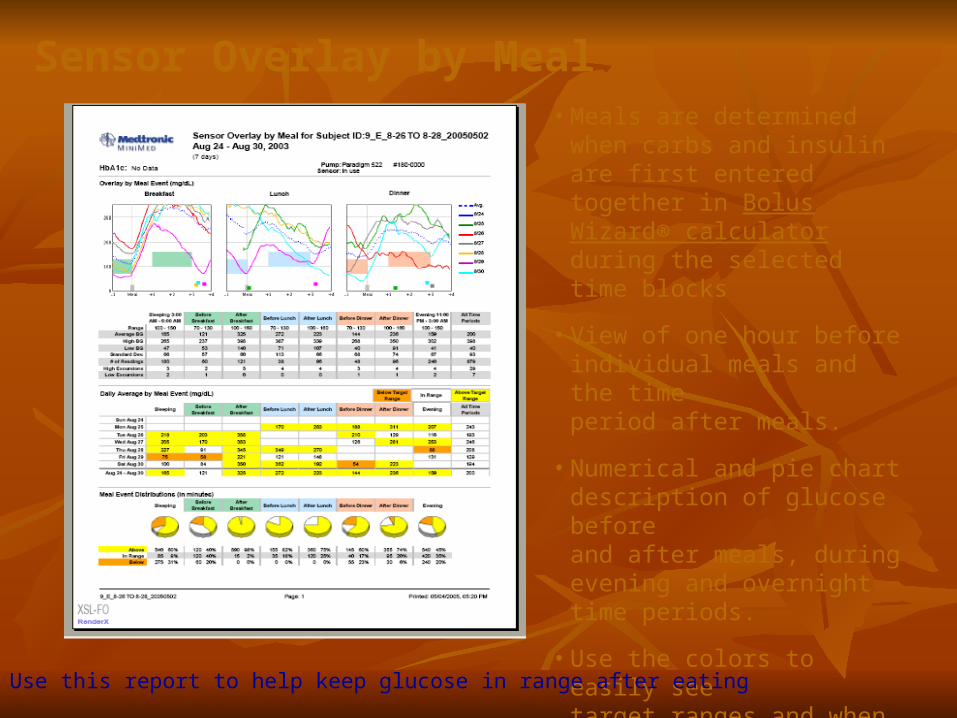
• Meals are determined when carbs and insulin are first entered together in Bolus Wizard® calculator during the selected time blocks
• View of one hour before individual meals and the time period after meals.
• Numerical and pie chart description of glucose before and after meals, during evening and overnight time periods.
• Use the colors to easily see target ranges and when in range, or above or below
• Up to 7 days of dataUse this report to help keep glucose in range after eating
Sensor Overlay by Meal
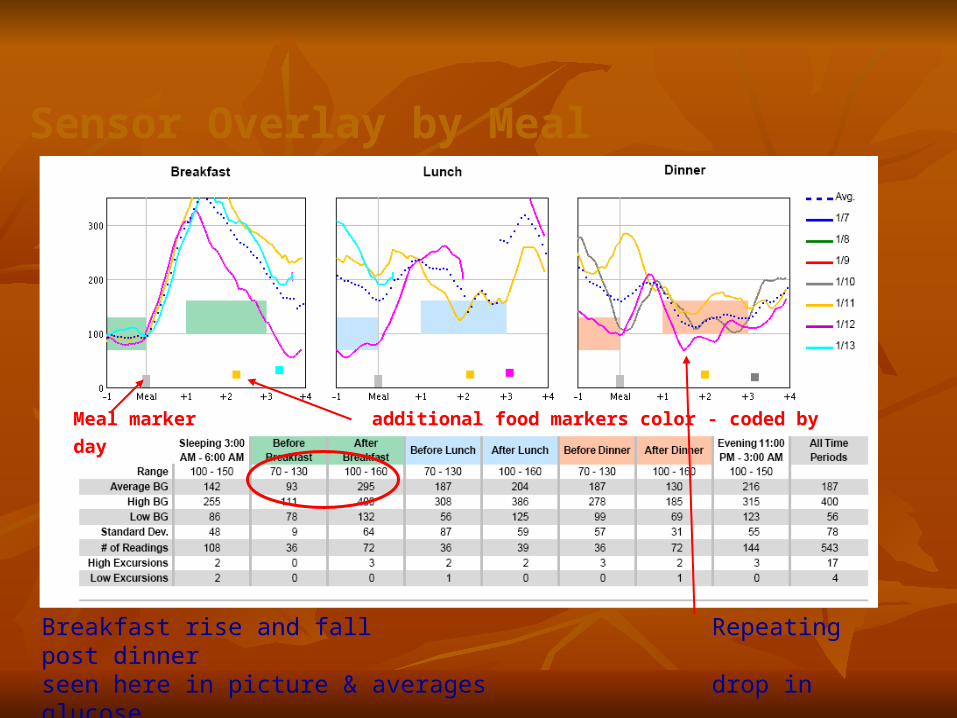
Breakfast rise and fall Repeating post dinnerseen here in picture & averages drop in glucose
Meal marker additional food markers color - coded by day
Sensor Overlay by Meal
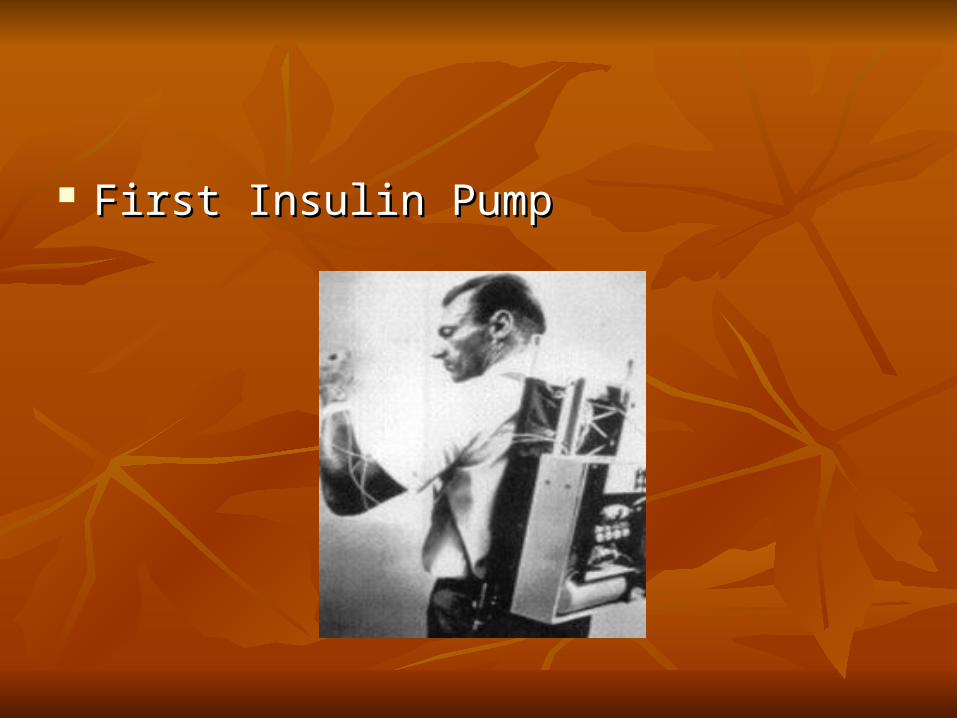
First Insulin PumpFirst Insulin Pump
First Person to Take InsulinFirst Person to Take Insulin
Leonard ThompsonLeonard Thompson

QuestionsQuestions
Thank YouThank You