Management Strategy Growth Foundation Financial Section ... · Yamaha Corporation and consolidated...
15
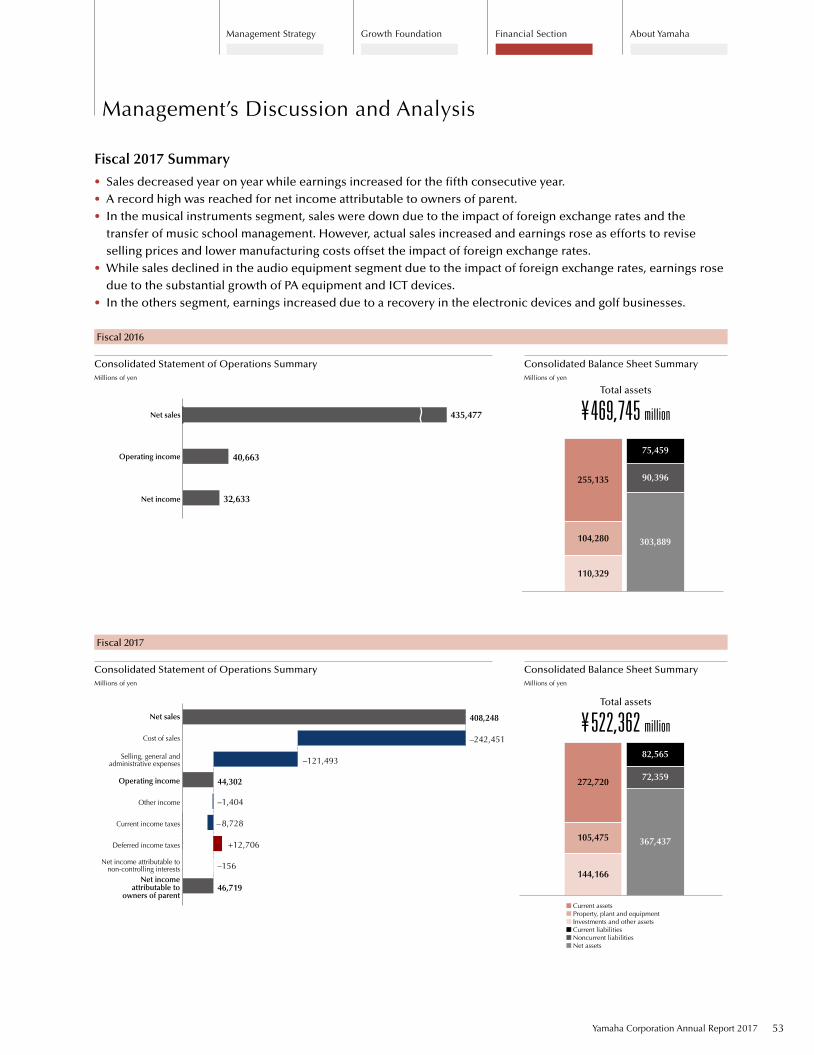
Consolidated Statement of Operations Summary Millions of yen Consolidated Statement of Operations Summary Millions of yen Consolidated Balance Sheet Summary Millions of yen Consolidated Balance Sheet Summary Millions of yen Fiscal 2017 Summary • Sales decreased year on year while earnings increased for the fifth consecutive year. • A record high was reached for net income attributable to owners of parent. • In the musical instruments segment, sales were down due to the impact of foreign exchange rates and the transfer of music school management. However, actual sales increased and earnings rose as efforts to revise selling prices and lower manufacturing costs offset the impact of foreign exchange rates. • While sales declined in the audio equipment segment due to the impact of foreign exchange rates, earnings rose due to the substantial growth of PA equipment and ICT devices. • In the others segment, earnings increased due to a recovery in the electronic devices and golf businesses. 110,329 104,280 255,135 303,889 90,396 75,459 144,166 105,475 272,720 367,437 72,359 82,565 Total assets ¥ 469,745 million Total assets ¥ 522,362 million Current assets Property, plant and equipment Investments and other assets Current liabilities Noncurrent liabilities Net assets Net income attributable to owners of parent Net income attributable to non-controlling interests Deferred income taxes Current income taxes Other income Operating income Selling, general and administrative expenses Cost of sales Net sales 46,719 –156 +12,706 – 8,728 –1,404 44,302 –121,493 –242,451 408,248 32,633 40,663 435,477 Net sales Operating income Net income Fiscal 2016 Fiscal 2017 Yamaha Corporation Annual Report 2017 53 Management’s Discussion and Analysis Financial Section Growth Foundation Management Strategy About Yamaha
Transcript of Management Strategy Growth Foundation Financial Section ... · Yamaha Corporation and consolidated...
Consolidated Statement of Operations SummaryMillions of yen
Consolidated Statement of Operations SummaryMillions of yen
Consolidated Balance Sheet SummaryMillions of yen
Consolidated Balance Sheet SummaryMillions of yen
Fiscal 2017 Summary
• Sales decreased year on year while earnings increased for the fifth consecutive year.• A record high was reached for net income attributable to owners of parent.• In the musical instruments segment, sales were down due to the impact of foreign exchange rates and the
transfer of music school management. However, actual sales increased and earnings rose as efforts to revise selling prices and lower manufacturing costs offset the impact of foreign exchange rates.
• While sales declined in the audio equipment segment due to the impact of foreign exchange rates, earnings rose due to the substantial growth of PA equipment and ICT devices.
• In the others segment, earnings increased due to a recovery in the electronic devices and golf businesses.
110,329
104,280
255,135
303,889
90,396
75,459
144,166
105,475
272,720
367,437
72,359
82,565
Total assets
¥ 469,745 million
Total assets
¥ 522,362 million
Current assets Property, plant and equipment Investments and other assets Current liabilities Noncurrent liabilities Net assets
Net incomeattributable to
owners of parent
Net income attributable tonon-controlling interests
Deferred income taxes
Current income taxes
Other income
Operating income
Selling, general andadministrative expenses
Cost of sales
Net sales
46,719
–156
+12,706
–8,728
–1,404
44,302
–121,493
–242,451
408,248
32,633
40,663
435,477Net sales
Operating income
Net income
Fiscal 2016
Fiscal 2017
Yamaha Corporation Annual Report 2017 53
Management’s Discussion and Analysis
Financial SectionGrowth FoundationManagement Strategy About Yamaha
Yamaha Corporation and consolidated subsidiaries Millions of yen %Millions of
U.S. dollars*1
Years ended March 31 2007 2008 2009 2010 2011 2012 2013 2014 2015 2016 2017 2016/2017 2017
For the year:
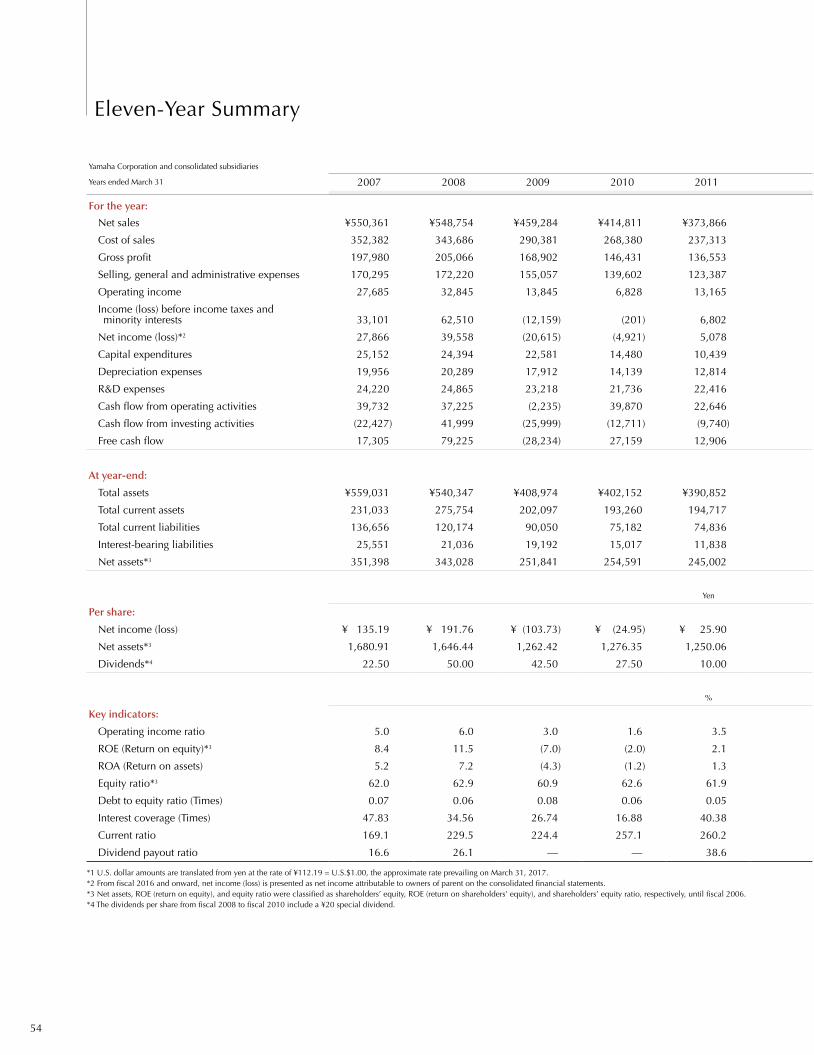
Net sales ¥550,361 ¥548,754 ¥459,284 ¥414,811 ¥373,866 ¥356,616 ¥366,941 ¥410,304 ¥432,177 ¥435,477 ¥408,248 –6.3 $3,638.90
Cost of sales 352,382 343,686 290,381 268,380 237,313 231,659 238,261 262,310 270,357 262,406 242,451 –7.6 2,161.07
Gross profit 197,980 205,066 168,902 146,431 136,553 124,957 128,680 147,994 161,820 173,070 165,796 –4.2 1,477.81
Selling, general and administrative expenses 170,295 172,220 155,057 139,602 123,387 116,846 119,465 121,999 131,684 132,407 121,493 –8.2 1,082.92
Operating income 27,685 32,845 13,845 6,828 13,165 8,110 9,215 25,994 30,135 40,663 44,302 +8.9 394.88
Income (loss) before income taxes and minority interests 33,101 62,510 (12,159) (201) 6,802 6,971 7,795 25,818 28,526 41,578 42,898 +3.2 382.37
Net income (loss)*2 27,866 39,558 (20,615) (4,921) 5,078 (29,381) 4,122 22,898 24,929 32,633 46,719 +43.2 416.43
Capital expenditures 25,152 24,394 22,581 14,480 10,439 11,337 13,844 10,799 13,846 11,220 17,542 +56.3 156.36
Depreciation expenses 19,956 20,289 17,912 14,139 12,814 11,973 11,613 12,759 12,597 12,681 11,145 –12.1 99.34
R&D expenses 24,220 24,865 23,218 21,736 22,416 22,819 22,149 22,561 25,439 24,793 24,415 –1.5 217.62
Cash flow from operating activities 39,732 37,225 (2,235) 39,870 22,646 10,880 7,755 33,213 31,729 42,399 39,142 –7.7 348.89
Cash flow from investing activities (22,427) 41,999 (25,999) (12,711) (9,740) (9,004) (12,617) (22,950) (11,700) 591 (9,663) –1735.0 (86.13)
Free cash flow 17,305 79,225 (28,234) 27,159 12,906 1,875 (4,862) 10,263 20,029 42,991 29,478 –31.4 262.75
At year-end:
Total assets ¥559,031 ¥540,347 ¥408,974 ¥402,152 ¥390,852 ¥366,610 ¥390,610 ¥438,932 ¥530,034 ¥469,745 ¥522,362 +11.2 $4,656.05
Total current assets 231,033 275,754 202,097 193,260 194,717 188,952 197,902 214,487 247,632 255,135 272,720 +6.9 2,430.88
Total current liabilities 136,656 120,174 90,050 75,182 74,836 72,829 71,550 73,145 80,976 75,459 82,565 +9.4 735.94
Interest-bearing liabilities 25,551 21,036 19,192 15,017 11,838 11,295 10,013 8,755 11,868 8,510 11,241 +32.1 100.20
Net assets*3 351,398 343,028 251,841 254,591 245,002 206,832 229,636 274,843 348,752 303,889 367,437 +20.9 3,275.13
Yen U.S.dollars*1
Per share:
Net income (loss) ¥ 135.19 ¥ 191.76 ¥ (103.73) ¥ (24.95) ¥ 25.90 ¥ (151.73) ¥ 21.79 ¥ 118.26 ¥ 128.75 ¥ 168.90 ¥ 249.17 $ 2.22
Net assets*3 1,680.91 1,646.44 1,262.42 1,276.35 1,250.06 1,052.01 1,171.67 1,403.12 1,787.42 1,601.55 1,948.01 17.36
Dividends*4 22.50 50.00 42.50 27.50 10.00 10.00 10.00 27.00 36.00 44.00 52.00 0.46
%
Key indicators:
Operating income ratio 5.0 6.0 3.0 1.6 3.5 2.3 2.5 6.3 7.0 9.3 10.9
ROE (Return on equity)*3 8.4 11.5 (7.0) (2.0) 2.1 (13.2) 1.9 9.2 8.1 10.1 14.0
ROA (Return on assets) 5.2 7.2 (4.3) (1.2) 1.3 (7.8) 1.1 5.5 5.1 6.5 9.4
Equity ratio*3 62.0 62.9 60.9 62.6 61.9 55.6 58.1 61.9 65.3 64.2 69.9
Debt to equity ratio (Times) 0.07 0.06 0.08 0.06 0.05 0.05 0.04 0.03 0.03 0.03 0.03
Interest coverage (Times) 47.83 34.56 26.74 16.88 40.38 31.84 40.64 130.19 130.51 129.04 165.40
Current ratio 169.1 229.5 224.4 257.1 260.2 259.4 276.6 293.2 305.8 338.1 330.3
Dividend payout ratio 16.6 26.1 — — 38.6 — 47.0 22.8 28.0 26.1 20.9
*1 U.S. dollar amounts are translated from yen at the rate of ¥112.19 = U.S.$1.00, the approximate rate prevailing on March 31, 2017.*2 From fiscal 2016 and onward, net income (loss) is presented as net income attributable to owners of parent on the consolidated financial statements.*3 Net assets, ROE (return on equity), and equity ratio were classified as shareholders’ equity, ROE (return on shareholders’ equity), and shareholders’ equity ratio, respectively, until fiscal 2006.*4 The dividends per share from fiscal 2008 to fiscal 2010 include a ¥20 special dividend.
54
Eleven-Year Summary
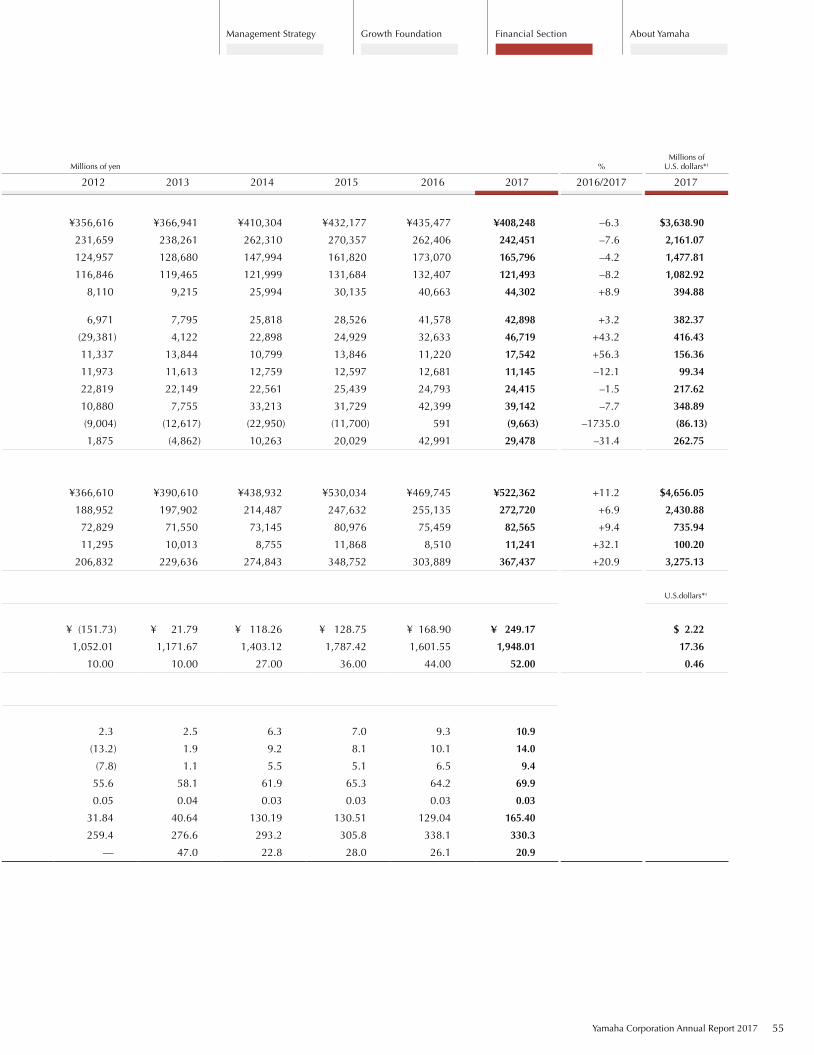
Yamaha Corporation and consolidated subsidiaries Millions of yen %Millions of
U.S. dollars*1
Years ended March 31 2007 2008 2009 2010 2011 2012 2013 2014 2015 2016 2017 2016/2017 2017
For the year:
Net sales ¥550,361 ¥548,754 ¥459,284 ¥414,811 ¥373,866 ¥356,616 ¥366,941 ¥410,304 ¥432,177 ¥435,477 ¥408,248 –6.3 $3,638.90
Cost of sales 352,382 343,686 290,381 268,380 237,313 231,659 238,261 262,310 270,357 262,406 242,451 –7.6 2,161.07
Gross profit 197,980 205,066 168,902 146,431 136,553 124,957 128,680 147,994 161,820 173,070 165,796 –4.2 1,477.81
Selling, general and administrative expenses 170,295 172,220 155,057 139,602 123,387 116,846 119,465 121,999 131,684 132,407 121,493 –8.2 1,082.92
Operating income 27,685 32,845 13,845 6,828 13,165 8,110 9,215 25,994 30,135 40,663 44,302 +8.9 394.88
Income (loss) before income taxes and minority interests 33,101 62,510 (12,159) (201) 6,802 6,971 7,795 25,818 28,526 41,578 42,898 +3.2 382.37
Net income (loss)*2 27,866 39,558 (20,615) (4,921) 5,078 (29,381) 4,122 22,898 24,929 32,633 46,719 +43.2 416.43
Capital expenditures 25,152 24,394 22,581 14,480 10,439 11,337 13,844 10,799 13,846 11,220 17,542 +56.3 156.36
Depreciation expenses 19,956 20,289 17,912 14,139 12,814 11,973 11,613 12,759 12,597 12,681 11,145 –12.1 99.34
R&D expenses 24,220 24,865 23,218 21,736 22,416 22,819 22,149 22,561 25,439 24,793 24,415 –1.5 217.62
Cash flow from operating activities 39,732 37,225 (2,235) 39,870 22,646 10,880 7,755 33,213 31,729 42,399 39,142 –7.7 348.89
Cash flow from investing activities (22,427) 41,999 (25,999) (12,711) (9,740) (9,004) (12,617) (22,950) (11,700) 591 (9,663) –1735.0 (86.13)
Free cash flow 17,305 79,225 (28,234) 27,159 12,906 1,875 (4,862) 10,263 20,029 42,991 29,478 –31.4 262.75
At year-end:
Total assets ¥559,031 ¥540,347 ¥408,974 ¥402,152 ¥390,852 ¥366,610 ¥390,610 ¥438,932 ¥530,034 ¥469,745 ¥522,362 +11.2 $4,656.05
Total current assets 231,033 275,754 202,097 193,260 194,717 188,952 197,902 214,487 247,632 255,135 272,720 +6.9 2,430.88
Total current liabilities 136,656 120,174 90,050 75,182 74,836 72,829 71,550 73,145 80,976 75,459 82,565 +9.4 735.94
Interest-bearing liabilities 25,551 21,036 19,192 15,017 11,838 11,295 10,013 8,755 11,868 8,510 11,241 +32.1 100.20
Net assets*3 351,398 343,028 251,841 254,591 245,002 206,832 229,636 274,843 348,752 303,889 367,437 +20.9 3,275.13
Yen U.S.dollars*1
Per share:
Net income (loss) ¥ 135.19 ¥ 191.76 ¥ (103.73) ¥ (24.95) ¥ 25.90 ¥ (151.73) ¥ 21.79 ¥ 118.26 ¥ 128.75 ¥ 168.90 ¥ 249.17 $ 2.22
Net assets*3 1,680.91 1,646.44 1,262.42 1,276.35 1,250.06 1,052.01 1,171.67 1,403.12 1,787.42 1,601.55 1,948.01 17.36
Dividends*4 22.50 50.00 42.50 27.50 10.00 10.00 10.00 27.00 36.00 44.00 52.00 0.46
%
Key indicators:
Operating income ratio 5.0 6.0 3.0 1.6 3.5 2.3 2.5 6.3 7.0 9.3 10.9
ROE (Return on equity)*3 8.4 11.5 (7.0) (2.0) 2.1 (13.2) 1.9 9.2 8.1 10.1 14.0
ROA (Return on assets) 5.2 7.2 (4.3) (1.2) 1.3 (7.8) 1.1 5.5 5.1 6.5 9.4
Equity ratio*3 62.0 62.9 60.9 62.6 61.9 55.6 58.1 61.9 65.3 64.2 69.9
Debt to equity ratio (Times) 0.07 0.06 0.08 0.06 0.05 0.05 0.04 0.03 0.03 0.03 0.03
Interest coverage (Times) 47.83 34.56 26.74 16.88 40.38 31.84 40.64 130.19 130.51 129.04 165.40
Current ratio 169.1 229.5 224.4 257.1 260.2 259.4 276.6 293.2 305.8 338.1 330.3
Dividend payout ratio 16.6 26.1 — — 38.6 — 47.0 22.8 28.0 26.1 20.9
*1 U.S. dollar amounts are translated from yen at the rate of ¥112.19 = U.S.$1.00, the approximate rate prevailing on March 31, 2017.*2 From fiscal 2016 and onward, net income (loss) is presented as net income attributable to owners of parent on the consolidated financial statements.*3 Net assets, ROE (return on equity), and equity ratio were classified as shareholders’ equity, ROE (return on shareholders’ equity), and shareholders’ equity ratio, respectively, until fiscal 2006.*4 The dividends per share from fiscal 2008 to fiscal 2010 include a ¥20 special dividend.
Yamaha Corporation Annual Report 2017 55
Financial SectionGrowth FoundationManagement Strategy About Yamaha
Economic EnvironmentDuring fiscal 2017, the year ended March 31, 2017, the global economy overall was solid as there was a trend toward gradual recovery. In the U.S., a major market among developed countries, the actual GDP growth rate was firm, despite heightened expecta-tions for an increase in protectionist political policies following the presidential election. In European markets, there was a strong sense of uncertainty for the future of the EU economy due to such factors as the U.K. decision to withdraw from the EU and rising concerns over the national elections of each member nation. Nevertheless, the EU continued to see gradual economic growth. China maintained high economic growth despite lingering fears of a continued economic slowdown. In emerging countries, while conditions varied from country to country, there was a strong sense of worsening economic conditions overall. In Japan, the employment and income environment continued to improve and consumer spending gradually recovered.
Performance ReviewWith regard to sales in fiscal 2017, in the musical instruments seg-ment, sales declined ¥19,705 million, or 7.1%, year on year, to ¥257,664 million. This decline was attributable to the negative impact of foreign exchange rates, which amounted to ¥22,200 million, and the negative effect of the transfer of music school management, which amounted to ¥4,200 million. Excluding these impacts, sales actually increased ¥6,700 million.
Excluding the impact of foreign exchange rates, sales of pianos surpassed those of the previous fiscal year. Sales of upright pianos were firm in China, with strong sales for grand pianos in Europe. Piano sales were solid in the North American market as well. For digital musical instruments, sales were steady overall on an actual basis due to increased sales of portable keyboards and the strong performance of new synthesizers. Sales of wind instruments exceeded those of the previous fiscal year as sales in every market besides Japan were solid. Excluding the impact of foreign exchange rates, sales of string and percussion instruments increased on an actual basis due to the high grow rate of guitar sales in China. By market, double-digit sales growth on an actual basis was recorded in China, with robust sales in North America and Europe.
In the audio equipment segment, sales declined ¥5,396 million,
Sales were also down in the others segment due to sales decreases in the electronics device business and impact of terminating operations at a facility in the resort business.
Sales by RegionIn Japan, sales fell ¥6,629 million, or 4.6%, to ¥138,404 million. This fall was attributable primarily to the impact of the transfer of music school management to the Yamaha Music Foundation.
In the musical instruments business, although piano sales were on a par with those of the previous fiscal year, sales were down for digital musical instruments, wind instruments, and string and percussion instruments. Additionally, non-product-related sales decreased due not only to the impact of the transfer of music school
–6.3%
Net Sales
¥ 408,248 million
Net SalesNet sales in fiscal 2017 declined ¥27,229 million, or 6.3%, to ¥408,248 million. While sales increased on an actual basis in both the musical instruments and audio equipment segments, this increase could not offset the significant impact of foreign exchange rates, which amounted to ¥33,400 million, and the transfer of management of the music school business to the Yamaha Music Foundation, which amounted to ¥4,200 million.
or 4.5%, to ¥115,484 million. This decline was due to the negative impact of foreign exchange rates, which amounted to ¥10,600 million. Excluding this impact, sales actually increased ¥5,200 million.
In this segment, network audio products were gradually intro-duced in markets around the world, and sales of AV receivers and other items were particularly strong in North America and China. For professional audio equipment, sales in the markets of devel-oped countries were favorable, with positive sales results begin-ning to emerge in North America, where sales had been poor due to a delay in establishing a sales structure. The strong performance in these markets helped drive growth in sales overall. For informa-tion and communications technology (ICT) devices, double-digit sales growth was recorded on an actual basis.
Sales in the others segment were down ¥2,126 million, or 5.7%, to ¥35,099 million.
For electronic devices, sales were down due to a slight decrease in sales of amusement equipment and significant decline in sales of audio devices. While sales of FA equipment increased, sales of automobile interior wood components decreased. In the resort business, sales fell due to a facility terminating general oper-ations in the third quarter. Sales of golf products decreased as the positive performance of new products in Japan was offset by a lackluster performance of products in overseas markets.
Turning to profit and loss, the musical instruments segment saw an increase in profits as the decline in sales due to the impact of foreign exchange rates was compensated by the positive effects from continuous reductions in manufacturing costs, sales increases in highly profitable products, primarily digital musical instruments, and efforts to revise selling prices and control SG&A expenses. Profits were up overall in the audio equipment segment as well, owing to significant profit contributions from PA equipment and ICT devices. In the others segment, profits rose significantly due to such factors as the improvement in the product model mix for electronic devices and cost reductions, in addition to the positive performance of new golf products in Japan.
As a result of the abovementioned factors, net sales in fiscal 2017 decreased 6.3%, to ¥408,248 million, and operating income was up 8.9%, to ¥44,302 million. Ordinary income rose 9.8%, to ¥44,926 million, and net income attributable to owners of parent increased 43.2%, to ¥46,719 million.
56
Overview
Analysis of Management Performance
management but also to the dwindling number of students at these schools. As a result, overall sales fell in the musical instruments business.
In the audio equipment business, network audio products recorded a strong performance. And, in terms of PA equipment, sales of commercial audio equipment were solid and installation sales of commercial audio equipment rose. Accordingly, sales climbed in the audio equipment business.
As for other businesses, sales of audio and graphics LSI for amusement equipment in the electronic devices business were sluggish. In addition, sales of audio devices fell significantly, resulting in an overall decline in sales. Furthermore, while sales edged up for FA equipment and thermoelectric devices, sales of automobile interior wood components declined, resulting in an overall decrease in sales in the industrial machinery and compo-nents business. Despite increased sales for golf products owing to the high evaluation of new products, sales declined in the resort business as operations at a facility were terminated. Due to these factors, overall sales for other businesses decreased.
Turning to outside Japan, sales were down ¥20,599 million, or 7.1%, to ¥269,843 million. However, this decline was primarily attributable to the negative impact of foreign exchange rates, amounting to ¥32,800 million. Excluding this impact, sales actually rose ¥12,200 million. On an actual basis that excludes the impact of foreign exchange rates, while sales failed to reach the previous year’s levels in other markets, healthy sales were recorded in China, North America, and Europe. The ratio of overseas sales nudged down 0.6 of a percentage point, from 66.7% to 66.1%.
By region, sales in North America decreased ¥5,202 million, or 5.9%, to ¥83,032 million. However, this decrease was due mainly to the negative impact of foreign exchange rates, totaling ¥9,700 million. Excluding this impact, sales actually climbed ¥4,500 million. In regard to sales on an actual basis that excludes the impact of foreign exchange rates, sales of numerous products in the musical instruments business exceeded those of the previ-ous fiscal year. In the audio equipment business, there were signs of a recovery trend as sales of Yamaha products by mass merchan-disers increased. For PA equipment, commercial audio equipment
helped drive high levels of growth following the progress made in establishing a sales structure. As a result, overall sales in North America were up on an actual basis.
In Europe, sales fell ¥5,741 million, or 7.0%, to ¥76,463 mil-lion. However, unfavorable foreign exchange rates placed down-ward pressure on sales to the extent of ¥9,200 million. Excluding this impact, sales actually rose ¥3,500 million. As for sales on an actual basis that excludes the impact of foreign exchange rates, sales increased in the musical instrument business thanks to the climbing sales of grand pianos and other factors. For digital musical instruments, firm sales of digital pianos helped offset the struggling sales of portable keyboards. Wind instruments and per-cussion instruments enjoyed healthy sales. For audio equipment, although sales of AV products remained at the same level as the previous fiscal year, sales of professional audio equipment—in addition to sales of PA equipment through musical instrument sales routes—were favorable. As a result, overall sales in Europe rose on an actual basis.
Sales in China and Asia, Oceania, and other regions were down ¥9,655 million, or 8.0%, to ¥110,347 million. However, the Company absorbed the negative impact of foreign exchange rates totaling ¥13,900 million. Excluding this impact, sales actually rose ¥4,200 million. In terms of sales on an actual basis that excludes the impact of foreign exchange rates, the musical instruments busi-ness in China continued to see a high growth rate in the sales of pianos, which post the largest sales volumes compared to any other musical instrument. In addition, sales of digital musical instruments were solid, with robust sales of string and percussion instruments centered on guitars. Sales in the audio equipment business were on a par with those of the previous fiscal year, despite relatively low sales volumes.
While circumstances differ between country and region, sales in the musical instruments business in other Asian countries, as well as in Oceania and other regions, remained at the same level as the previous fiscal year. However, due to a sales decline in the audio equipment business, overall sales in these markets edged down slightly on an actual basis.
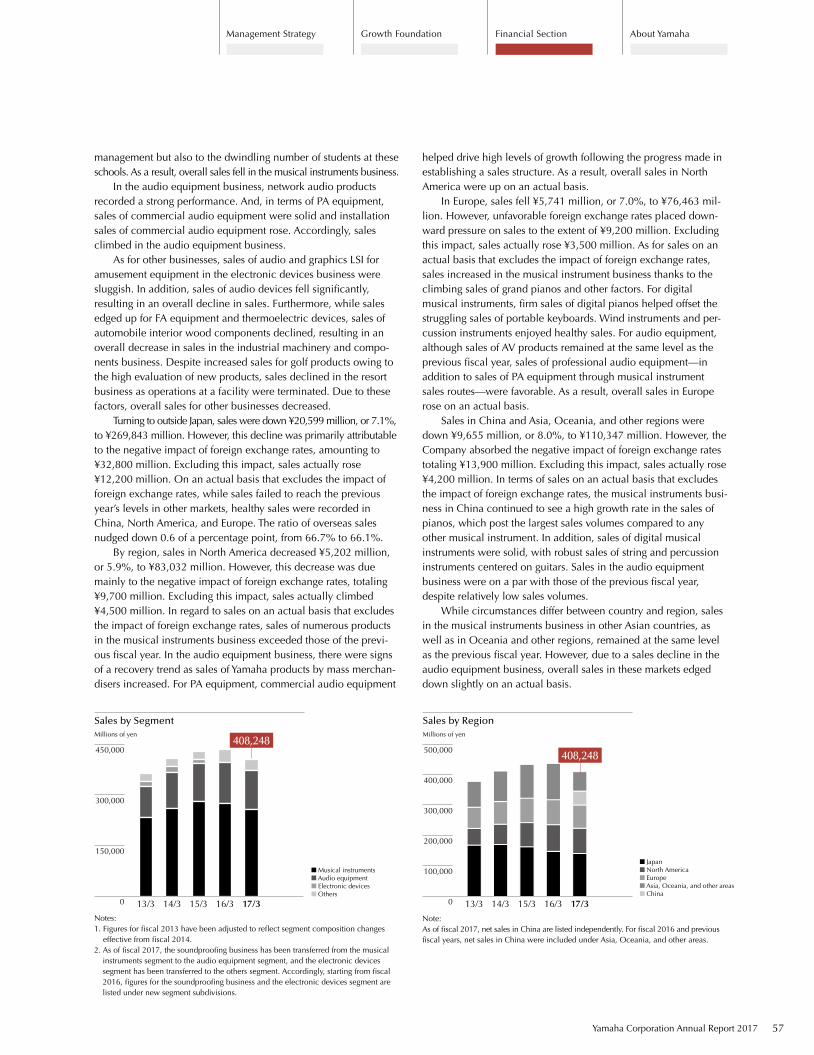
Sales by SegmentMillions of yen
0
150,000
300,000
450,000
17/316/315/314/313/3
Musical instruments Audio equipment Electronic devices Others
Notes:1. Figures for fiscal 2013 have been adjusted to reflect segment composition changes
effective from fiscal 2014.2. As of fiscal 2017, the soundproofing business has been transferred from the musical
instruments segment to the audio equipment segment, and the electronic devices segment has been transferred to the others segment. Accordingly, starting from fiscal 2016, figures for the soundproofing business and the electronic devices segment are listed under new segment subdivisions.
408,248
Note:As of fiscal 2017, net sales in China are listed independently. For fiscal 2016 and previous fiscal years, net sales in China were included under Asia, Oceania, and other areas.
Sales by RegionMillions of yen
17/316/315/314/313/30
100,000
200,000
300,000
400,000
500,000
Japan North America Europe Asia, Oceania, and other areas China
408,248
Financial SectionGrowth FoundationManagement Strategy About Yamaha
Yamaha Corporation Annual Report 2017 57
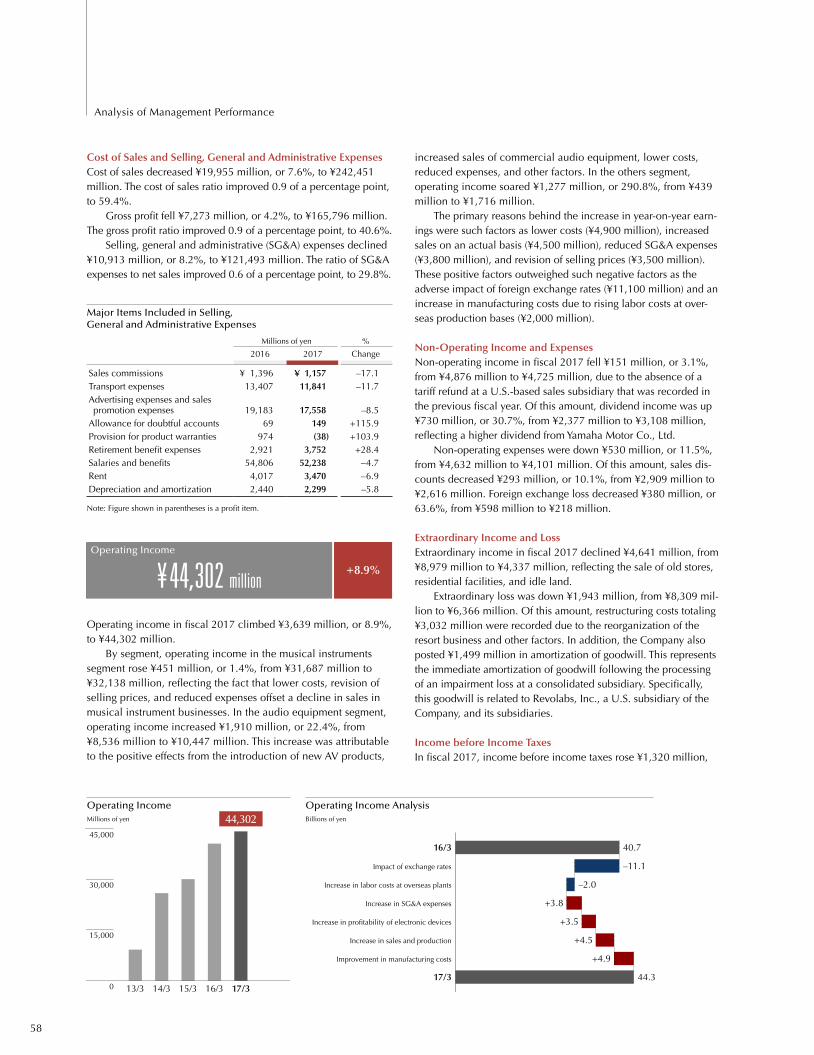
increased sales of commercial audio equipment, lower costs, reduced expenses, and other factors. In the others segment, operating income soared ¥1,277 million, or 290.8%, from ¥439 million to ¥1,716 million.
The primary reasons behind the increase in year-on-year earn-ings were such factors as lower costs (¥4,900 million), increased sales on an actual basis (¥4,500 million), reduced SG&A expenses (¥3,800 million), and revision of selling prices (¥3,500 million). These positive factors outweighed such negative factors as the adverse impact of foreign exchange rates (¥11,100 million) and an increase in manufacturing costs due to rising labor costs at over-seas production bases (¥2,000 million).
Non-Operating Income and ExpensesNon-operating income in fiscal 2017 fell ¥151 million, or 3.1%, from ¥4,876 million to ¥4,725 million, due to the absence of a tariff refund at a U.S.-based sales subsidiary that was recorded in the previous fiscal year. Of this amount, dividend income was up ¥730 million, or 30.7%, from ¥2,377 million to ¥3,108 million, reflecting a higher dividend from Yamaha Motor Co., Ltd.
Non-operating expenses were down ¥530 million, or 11.5%, from ¥4,632 million to ¥4,101 million. Of this amount, sales dis-counts decreased ¥293 million, or 10.1%, from ¥2,909 million to ¥2,616 million. Foreign exchange loss decreased ¥380 million, or 63.6%, from ¥598 million to ¥218 million.
Extraordinary Income and LossExtraordinary income in fiscal 2017 declined ¥4,641 million, from ¥8,979 million to ¥4,337 million, reflecting the sale of old stores, residential facilities, and idle land.
Extraordinary loss was down ¥1,943 million, from ¥8,309 mil-lion to ¥6,366 million. Of this amount, restructuring costs totaling ¥3,032 million were recorded due to the reorganization of the resort business and other factors. In addition, the Company also posted ¥1,499 million in amortization of goodwill. This represents the immediate amortization of goodwill following the processing of an impairment loss at a consolidated subsidiary. Specifically, this goodwill is related to Revolabs, Inc., a U.S. subsidiary of the Company, and its subsidiaries.
Income before Income TaxesIn fiscal 2017, income before income taxes rose ¥1,320 million,
Operating Income AnalysisBillions of yen
Operating IncomeMillions of yen
0
45,000
30,000
15,000
17/316/315/314/313/317/3
Improvement in manufacturing costs
Increase in sales and production
Increase in pro�tability of electronic devices
Increase in SG&A expenses
Increase in labor costs at overseas plants
Impact of exchange rates
16/3
44.3
+4.9
+4.5
+3.5
+3.8
–2.0
–11.1
40.7
Cost of Sales and Selling, General and Administrative ExpensesCost of sales decreased ¥19,955 million, or 7.6%, to ¥242,451 million. The cost of sales ratio improved 0.9 of a percentage point, to 59.4%.
Gross profit fell ¥7,273 million, or 4.2%, to ¥165,796 million. The gross profit ratio improved 0.9 of a percentage point, to 40.6%.
Selling, general and administrative (SG&A) expenses declined ¥10,913 million, or 8.2%, to ¥121,493 million. The ratio of SG&A expenses to net sales improved 0.6 of a percentage point, to 29.8%.
Major Items Included in Selling, General and Administrative Expenses
Millions of yen %
2016 2017 Change
Sales commissions ¥ 1,396 ¥ 1,157 –17.1Transport expenses 13,407 11,841 –11.7Advertising expenses and sales promotion expenses 19,183 17,558 –8.5Allowance for doubtful accounts 69 149 +115.9Provision for product warranties 974 (38) +103.9Retirement benefit expenses 2,921 3,752 +28.4Salaries and benefits 54,806 52,238 –4.7Rent 4,017 3,470 –6.9Depreciation and amortization 2,440 2,299 –5.8
Note: Figure shown in parentheses is a profit item.
+8.9%
Operating Income
¥ 44,302 million
Operating income in fiscal 2017 climbed ¥3,639 million, or 8.9%, to ¥44,302 million.
By segment, operating income in the musical instruments segment rose ¥451 million, or 1.4%, from ¥31,687 million to ¥32,138 million, reflecting the fact that lower costs, revision of selling prices, and reduced expenses offset a decline in sales in musical instrument businesses. In the audio equipment segment, operating income increased ¥1,910 million, or 22.4%, from ¥8,536 million to ¥10,447 million. This increase was attributable to the positive effects from the introduction of new AV products,
44,302
58
Analysis of Management Performance
or 3.2%, from ¥41,578 million to ¥42,898 million. The ratio of income before income taxes to net sales improved 1.0 percentage point, from 9.5% to 10.5%.
Current Income Taxes and Deferred Income TaxesCurrent income taxes in fiscal 2017 fell ¥813 million, or 8.5%, from ¥9,541 million to ¥8,728 million.
Deferred income taxes were up ¥12,049 million, from ¥656 million to ¥12,706 million. This increase was due to the recording of an additional deferred tax asset resulting from revisions to the recoverability of deferred tax assets.
Net Income Attributable to Non-Controlling InterestsIn fiscal 2017, net income attributable to non-controlling interests soared ¥97 million, or 164.2%, from ¥59 million to ¥156 million.
+43.2%
Net Income Attributable to Owners of Parent
¥ 46,719 million
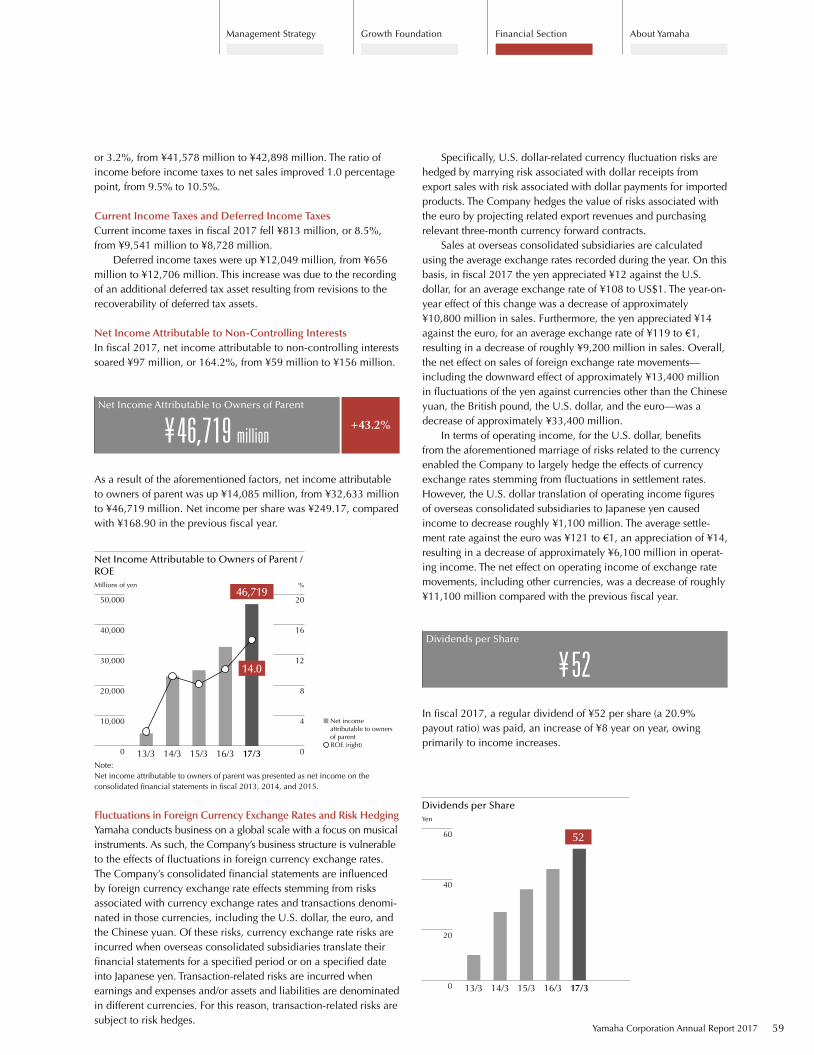
As a result of the aforementioned factors, net income attributable to owners of parent was up ¥14,085 million, from ¥32,633 million to ¥46,719 million. Net income per share was ¥249.17, compared with ¥168.90 in the previous fiscal year.
Net Income Attributable to Owners of Parent / ROEMillions of yen %
17/316/315/314/313/30
10,000
20,000
30,000
40,000
50,000
0
4
8
12
16
20
Net income attributable to owners of parent ROE (right)
Note: Net income attributable to owners of parent was presented as net income on the consolidated financial statements in fiscal 2013, 2014, and 2015.
Fluctuations in Foreign Currency Exchange Rates and Risk HedgingYamaha conducts business on a global scale with a focus on musical instruments. As such, the Company’s business structure is vulnerable to the effects of fluctuations in foreign currency exchange rates. The Company’s consolidated financial statements are influenced by foreign currency exchange rate effects stemming from risks associated with currency exchange rates and transactions denomi-nated in those currencies, including the U.S. dollar, the euro, and the Chinese yuan. Of these risks, currency exchange rate risks are incurred when overseas consolidated subsidiaries translate their financial statements for a specified period or on a specified date into Japanese yen. Transaction-related risks are incurred when earnings and expenses and/or assets and liabilities are denominated in different currencies. For this reason, transaction-related risks are subject to risk hedges.
Specifically, U.S. dollar-related currency fluctuation risks are hedged by marrying risk associated with dollar receipts from export sales with risk associated with dollar payments for imported products. The Company hedges the value of risks associated with the euro by projecting related export revenues and purchasing relevant three-month currency forward contracts.
Sales at overseas consolidated subsidiaries are calculated using the average exchange rates recorded during the year. On this basis, in fiscal 2017 the yen appreciated ¥12 against the U.S. dollar, for an average exchange rate of ¥108 to US$1. The year-on-year effect of this change was a decrease of approximately ¥10,800 million in sales. Furthermore, the yen appreciated ¥14 against the euro, for an average exchange rate of ¥119 to €1, resulting in a decrease of roughly ¥9,200 million in sales. Overall, the net effect on sales of foreign exchange rate movements—including the downward effect of approximately ¥13,400 million in fluctuations of the yen against currencies other than the Chinese yuan, the British pound, the U.S. dollar, and the euro—was a decrease of approximately ¥33,400 million.
In terms of operating income, for the U.S. dollar, benefits from the aforementioned marriage of risks related to the currency enabled the Company to largely hedge the effects of currency exchange rates stemming from fluctuations in settlement rates. However, the U.S. dollar translation of operating income figures of overseas consolidated subsidiaries to Japanese yen caused income to decrease roughly ¥1,100 million. The average settle-ment rate against the euro was ¥121 to €1, an appreciation of ¥14, resulting in a decrease of approximately ¥6,100 million in operat-ing income. The net effect on operating income of exchange rate movements, including other currencies, was a decrease of roughly ¥11,100 million compared with the previous fiscal year.
Dividends per Share
¥ 52In fiscal 2017, a regular dividend of ¥52 per share (a 20.9% payout ratio) was paid, an increase of ¥8 year on year, owing primarily to income increases.
46,719
14.0
Dividends per ShareYen
17/316/315/314/313/30
20
40
60 52
Financial SectionGrowth FoundationManagement Strategy About Yamaha
Yamaha Corporation Annual Report 2017 59
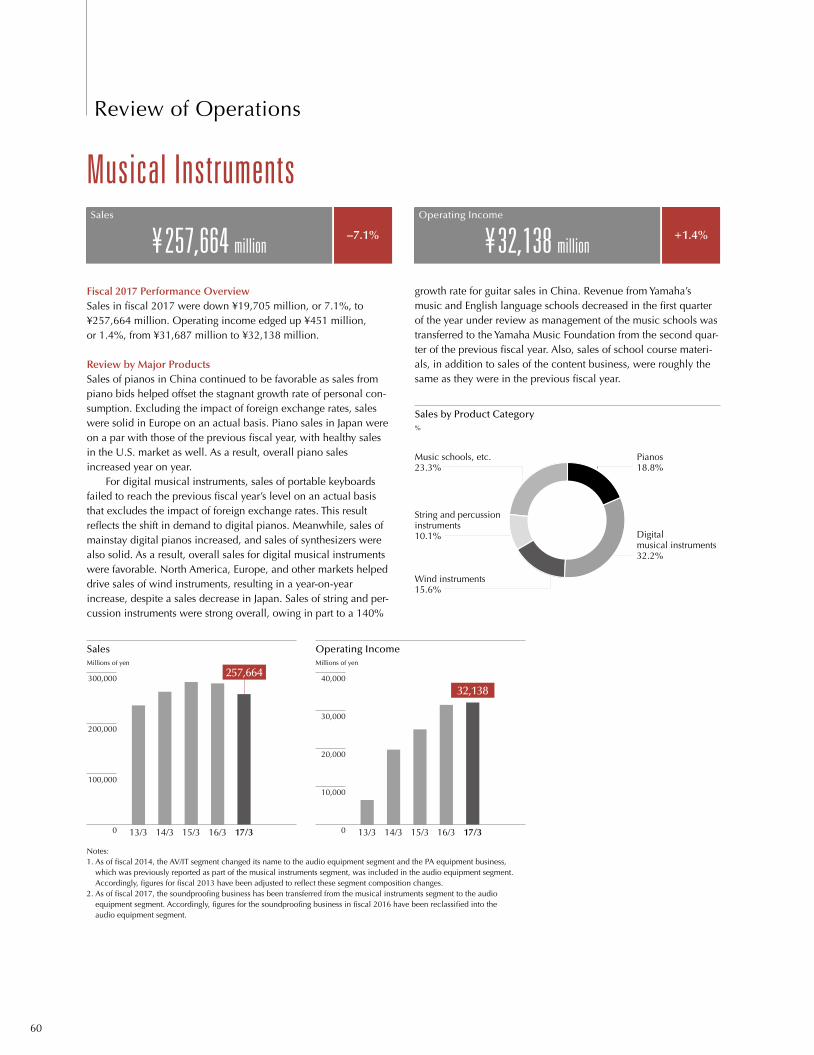
Music schools, etc.23.3%
String and percussion instruments 10.1%
Wind instruments 15.6%
Pianos 18.8%
Digital musical instruments 32.2%
–7.1%
Sales
¥ 257,664 million
Fiscal 2017 Performance OverviewSales in fiscal 2017 were down ¥19,705 million, or 7.1%, to ¥257,664 million. Operating income edged up ¥451 million, or 1.4%, from ¥31,687 million to ¥32,138 million.
Review by Major ProductsSales of pianos in China continued to be favorable as sales from piano bids helped offset the stagnant growth rate of personal con-sumption. Excluding the impact of foreign exchange rates, sales were solid in Europe on an actual basis. Piano sales in Japan were on a par with those of the previous fiscal year, with healthy sales in the U.S. market as well. As a result, overall piano sales increased year on year.
For digital musical instruments, sales of portable keyboards failed to reach the previous fiscal year’s level on an actual basis that excludes the impact of foreign exchange rates. This result reflects the shift in demand to digital pianos. Meanwhile, sales of mainstay digital pianos increased, and sales of synthesizers were also solid. As a result, overall sales for digital musical instruments were favorable. North America, Europe, and other markets helped drive sales of wind instruments, resulting in a year-on-year increase, despite a sales decrease in Japan. Sales of string and per-cussion instruments were strong overall, owing in part to a 140%
growth rate for guitar sales in China. Revenue from Yamaha’s music and English language schools decreased in the first quarter of the year under review as management of the music schools was transferred to the Yamaha Music Foundation from the second quar-ter of the previous fiscal year. Also, sales of school course materi-als, in addition to sales of the content business, were roughly the same as they were in the previous fiscal year.
Notes:1. As of fiscal 2014, the AV/IT segment changed its name to the audio equipment segment and the PA equipment business,
which was previously reported as part of the musical instruments segment, was included in the audio equipment segment. Accordingly, figures for fiscal 2013 have been adjusted to reflect these segment composition changes.
2. As of fiscal 2017, the soundproofing business has been transferred from the musical instruments segment to the audio equipment segment. Accordingly, figures for the soundproofing business in fiscal 2016 have been reclassified into the audio equipment segment.
SalesMillions of yen
Sales by Product Category%
0
100,000
200,000
300,000
17/316/315/314/313/3
Musical Instruments
Operating IncomeMillions of yen
0
40,000
30,000
20,000
10,000
17/316/315/314/313/3
+1.4%
Operating Income
¥ 32,138 million
32,138
257,664
60
Review of Operations
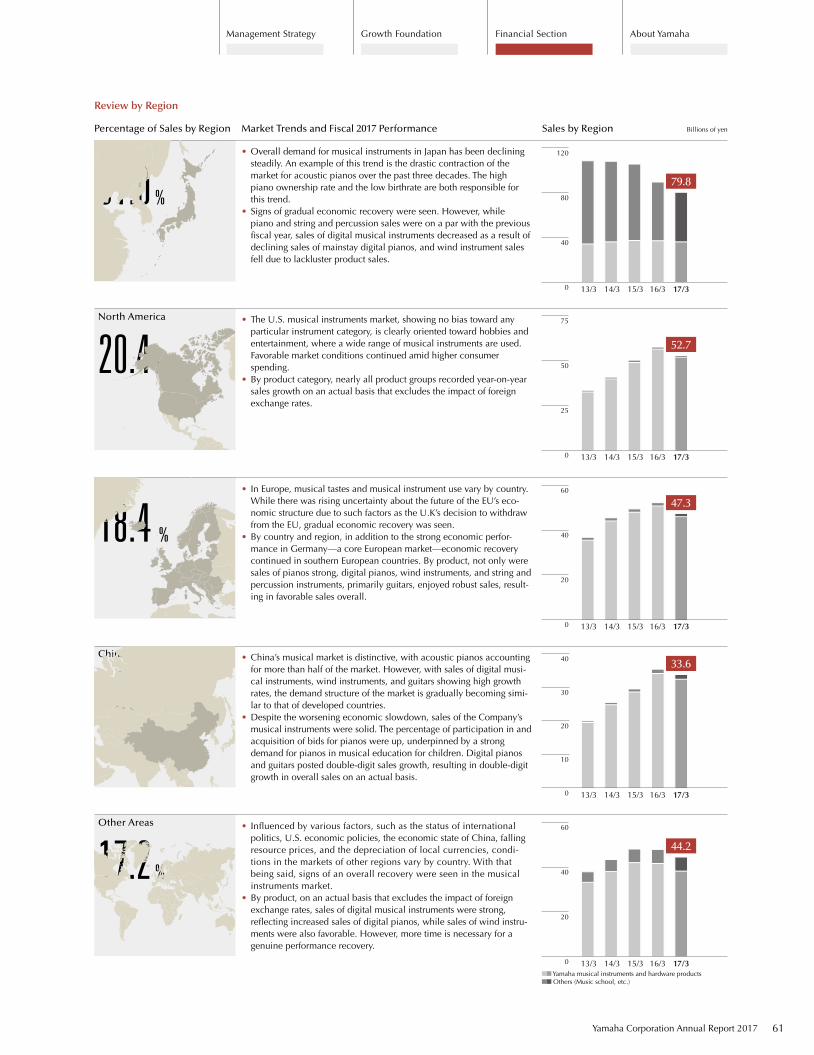
China
13.0 %
Review by Region
Sales by Region Billions of yenMarket Trends and Fiscal 2017 PerformancePercentage of Sales by Region
• Influenced by various factors, such as the status of international politics, U.S. economic policies, the economic state of China, falling resource prices, and the depreciation of local currencies, condi-tions in the markets of other regions vary by country. With that being said, signs of an overall recovery were seen in the musical instruments market.
• By product, on an actual basis that excludes the impact of foreign exchange rates, sales of digital musical instruments were strong, reflecting increased sales of digital pianos, while sales of wind instru-ments were also favorable. However, more time is necessary for a genuine performance recovery.
Other Areas
17.2 %
• In Europe, musical tastes and musical instrument use vary by country. While there was rising uncertainty about the future of the EU’s eco-nomic structure due to such factors as the U.K’s decision to withdraw from the EU, gradual economic recovery was seen.
• By country and region, in addition to the strong economic perfor-mance in Germany—a core European market—economic recovery continued in southern European countries. By product, not only were sales of pianos strong, digital pianos, wind instruments, and string and percussion instruments, primarily guitars, enjoyed robust sales, result-ing in favorable sales overall.
Europe
18.4 %
• China’s musical market is distinctive, with acoustic pianos accounting for more than half of the market. However, with sales of digital musi-cal instruments, wind instruments, and guitars showing high growth rates, the demand structure of the market is gradually becoming simi-lar to that of developed countries.
• Despite the worsening economic slowdown, sales of the Company’s musical instruments were solid. The percentage of participation in and acquisition of bids for pianos were up, underpinned by a strong demand for pianos in musical education for children. Digital pianos and guitars posted double-digit sales growth, resulting in double-digit growth in overall sales on an actual basis.
• The U.S. musical instruments market, showing no bias toward any particular instrument category, is clearly oriented toward hobbies and entertainment, where a wide range of musical instruments are used. Favorable market conditions continued amid higher consumer spending.
• By product category, nearly all product groups recorded year-on-year sales growth on an actual basis that excludes the impact of foreign exchange rates.
North America
20.4 %
• Overall demand for musical instruments in Japan has been declining steadily. An example of this trend is the drastic contraction of the market for acoustic pianos over the past three decades. The high piano ownership rate and the low birthrate are both responsible for this trend.
• Signs of gradual economic recovery were seen. However, while piano and string and percussion sales were on a par with the previous fiscal year, sales of digital musical instruments decreased as a result of declining sales of mainstay digital pianos, and wind instrument sales fell due to lackluster product sales.
0
40
80
120
17/316/315/314/313/3
0
25
50
75
17/316/315/314/313/3
0
20
40
60
17/316/315/314/313/3
0
10
20
30
40
17/316/315/314/313/3
0
20
40
60
17/316/315/314/313/3
Japan
31.0 %
Yamaha musical instruments and hardware products Others (Music school, etc.)
44.2
33.6
47.3
52.7
79.8
Financial SectionGrowth FoundationManagement Strategy About Yamaha
Yamaha Corporation Annual Report 2017 61
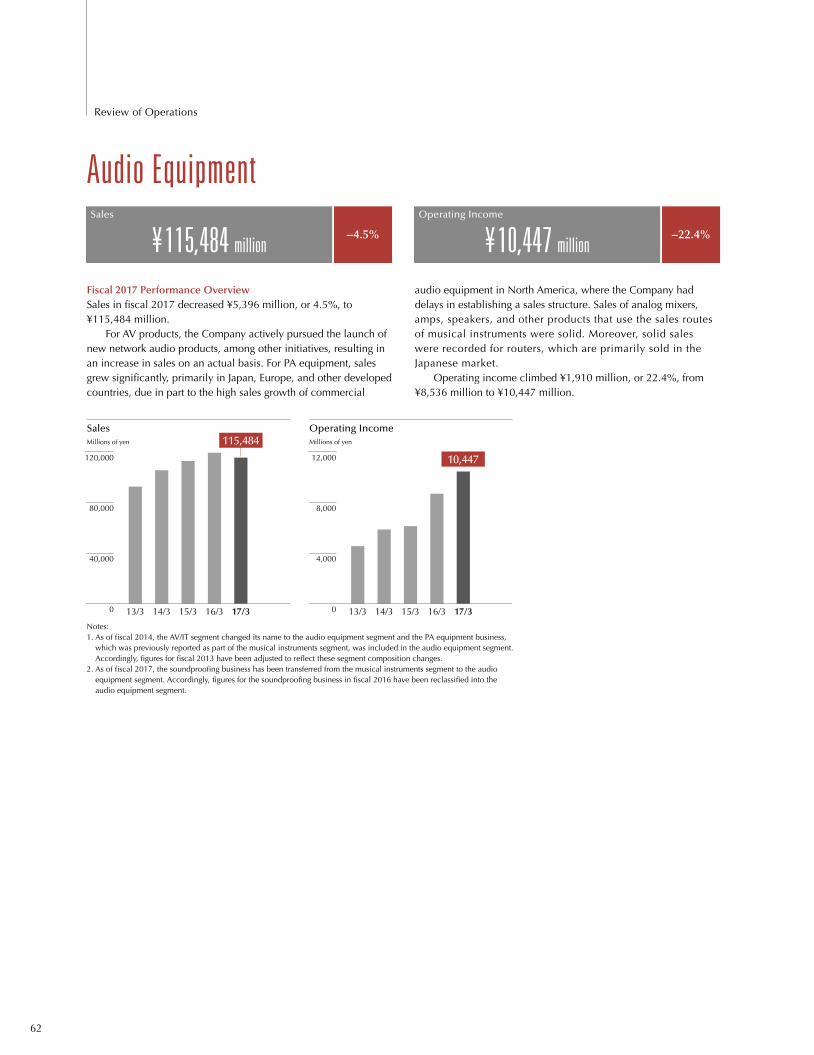
Fiscal 2017 Performance OverviewSales in fiscal 2017 decreased ¥5,396 million, or 4.5%, to ¥115,484 million.
For AV products, the Company actively pursued the launch of new network audio products, among other initiatives, resulting in an increase in sales on an actual basis. For PA equipment, sales grew significantly, primarily in Japan, Europe, and other developed countries, due in part to the high sales growth of commercial
audio equipment in North America, where the Company had delays in establishing a sales structure. Sales of analog mixers, amps, speakers, and other products that use the sales routes of musical instruments were solid. Moreover, solid sales were recorded for routers, which are primarily sold in the Japanese market.
Operating income climbed ¥1,910 million, or 22.4%, from ¥8,536 million to ¥10,447 million.
Sales Millions of yen
0
40,000
80,000
120,000
17/316/315/314/313/3
Operating IncomeMillions of yen
17/316/315/314/313/30
4,000
8,000
12,000
Audio Equipment
Notes:1. As of fiscal 2014, the AV/IT segment changed its name to the audio equipment segment and the PA equipment business,
which was previously reported as part of the musical instruments segment, was included in the audio equipment segment. Accordingly, figures for fiscal 2013 have been adjusted to reflect these segment composition changes.
2. As of fiscal 2017, the soundproofing business has been transferred from the musical instruments segment to the audio equipment segment. Accordingly, figures for the soundproofing business in fiscal 2016 have been reclassified into the audio equipment segment.
–22.4%
Operating Income
¥ 10,447 million–4.5%
Sales
¥ 115,484 million
10,447
115,484
62
Review of Operations
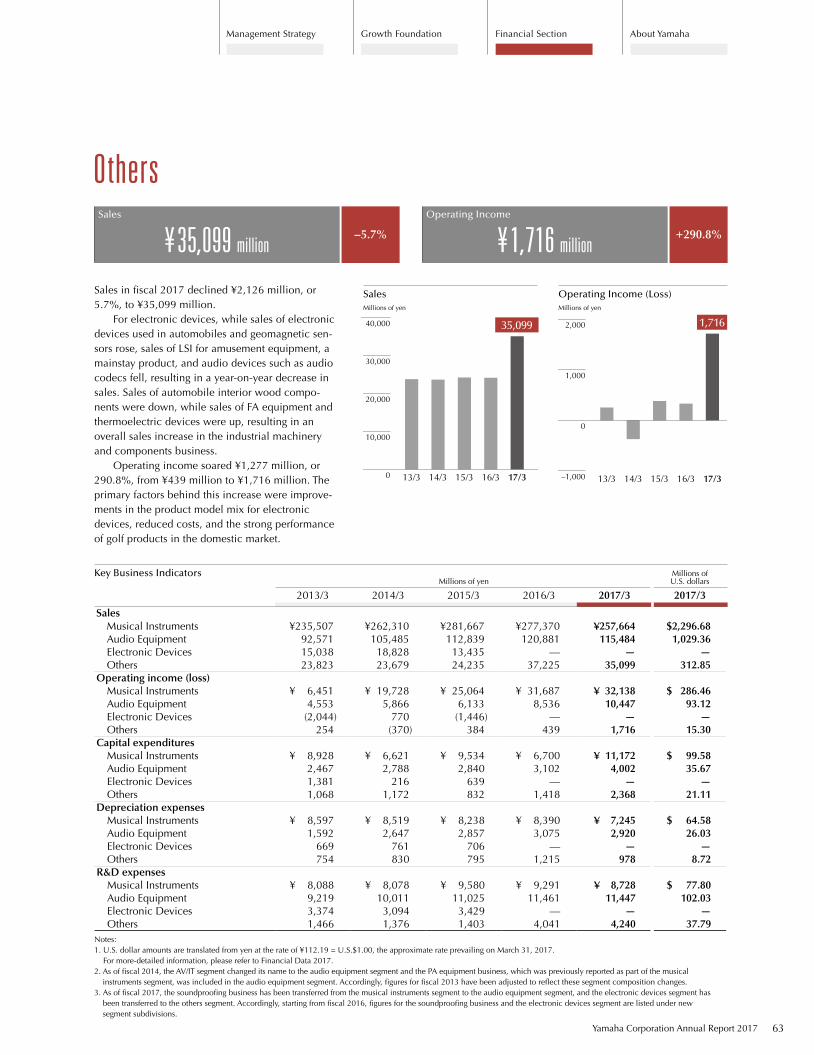
Sales in fiscal 2017 declined ¥2,126 million, or 5.7%, to ¥35,099 million.
For electronic devices, while sales of electronic devices used in automobiles and geomagnetic sen-sors rose, sales of LSI for amusement equipment, a mainstay product, and audio devices such as audio codecs fell, resulting in a year-on-year decrease in sales. Sales of automobile interior wood compo-nents were down, while sales of FA equipment and thermoelectric devices were up, resulting in an overall sales increase in the industrial machinery and components business.
Operating income soared ¥1,277 million, or 290.8%, from ¥439 million to ¥1,716 million. The primary factors behind this increase were improve-ments in the product model mix for electronic devices, reduced costs, and the strong performance of golf products in the domestic market.
Millions of yenMillions of U.S. dollars
2013/3 2014/3 2015/3 2016/3 2017/3 2017/3
SalesMusical Instruments ¥235,507 ¥262,310 ¥281,667 ¥277,370 ¥257,664 $2,296.68 Audio Equipment 92,571 105,485 112,839 120,881 115,484 1,029.36 Electronic Devices 15,038 18,828 13,435 — — —Others 23,823 23,679 24,235 37,225 35,099 312.85
Operating income (loss)Musical Instruments ¥ 6,451 ¥ 19,728 ¥ 25,064 ¥ 31,687 ¥ 32,138 $ 286.46 Audio Equipment 4,553 5,866 6,133 8,536 10,447 93.12 Electronic Devices (2,044) 770 (1,446) — — —Others 254 (370) 384 439 1,716 15.30
Capital expendituresMusical Instruments ¥ 8,928 ¥ 6,621 ¥ 9,534 ¥ 6,700 ¥ 11,172 $ 99.58Audio Equipment 2,467 2,788 2,840 3,102 4,002 35.67Electronic Devices 1,381 216 639 — — —Others 1,068 1,172 832 1,418 2,368 21.11
Depreciation expensesMusical Instruments ¥ 8,597 ¥ 8,519 ¥ 8,238 ¥ 8,390 ¥ 7,245 $ 64.58 Audio Equipment 1,592 2,647 2,857 3,075 2,920 26.03 Electronic Devices 669 761 706 — — —Others 754 830 795 1,215 978 8.72
R&D expensesMusical Instruments ¥ 8,088 ¥ 8,078 ¥ 9,580 ¥ 9,291 ¥ 8,728 $ 77.80Audio Equipment 9,219 10,011 11,025 11,461 11,447 102.03Electronic Devices 3,374 3,094 3,429 — — —Others 1,466 1,376 1,403 4,041 4,240 37.79
Notes:1. U.S. dollar amounts are translated from yen at the rate of ¥112.19 = U.S.$1.00, the approximate rate prevailing on March 31, 2017.
For more-detailed information, please refer to Financial Data 2017.2. As of fiscal 2014, the AV/IT segment changed its name to the audio equipment segment and the PA equipment business, which was previously reported as part of the musical
instruments segment, was included in the audio equipment segment. Accordingly, figures for fiscal 2013 have been adjusted to reflect these segment composition changes.3. As of fiscal 2017, the soundproofing business has been transferred from the musical instruments segment to the audio equipment segment, and the electronic devices segment has
been transferred to the others segment. Accordingly, starting from fiscal 2016, figures for the soundproofing business and the electronic devices segment are listed under new segment subdivisions.
SalesMillions of yen
Operating Income (Loss)Millions of yen
17/316/315/314/313/30
10,000
20,000
30,000
40,000
17/316/315/314/313/3–1,000
0
1,000
2,000
Others
+290.8%
Operating Income
¥ 1,716 million–5.7%
Sales
¥ 35,099 million
35,099 1,716
Key Business Indicators
Financial SectionGrowth FoundationManagement Strategy About Yamaha
Yamaha Corporation Annual Report 2017 63
Financing PolicyThe Yamaha Group obtains working capital to fund its business activities and finances its business expansion primarily from cash on hand, operating cash flows, and bank loans.
Yamaha’s basic financing policy is to procure stable, low-cost funding while preserving an appropriate amount of liquidity.
In fiscal 2017, the Company maintained a sufficient level of liquidity on hand, with cash and deposits totaling ¥105,859 million.
Group finance is carried out to promote efficient fund utiliza-tion for the entire Group.
Furthermore, the Company commissions long-term preferred debt rating assessments from credit rating agencies each year to facilitate smooth fund procurement in capital markets. The latest published ratings are shown below.
Credit Ratings
Rating agencyLong-term
preferred debt rating
Rating and Investment Information, Inc. (R&I) A (stable)
Japan Credit Rating Agency, Ltd. (JCR) A+ (stable)
As of March 31, 2017
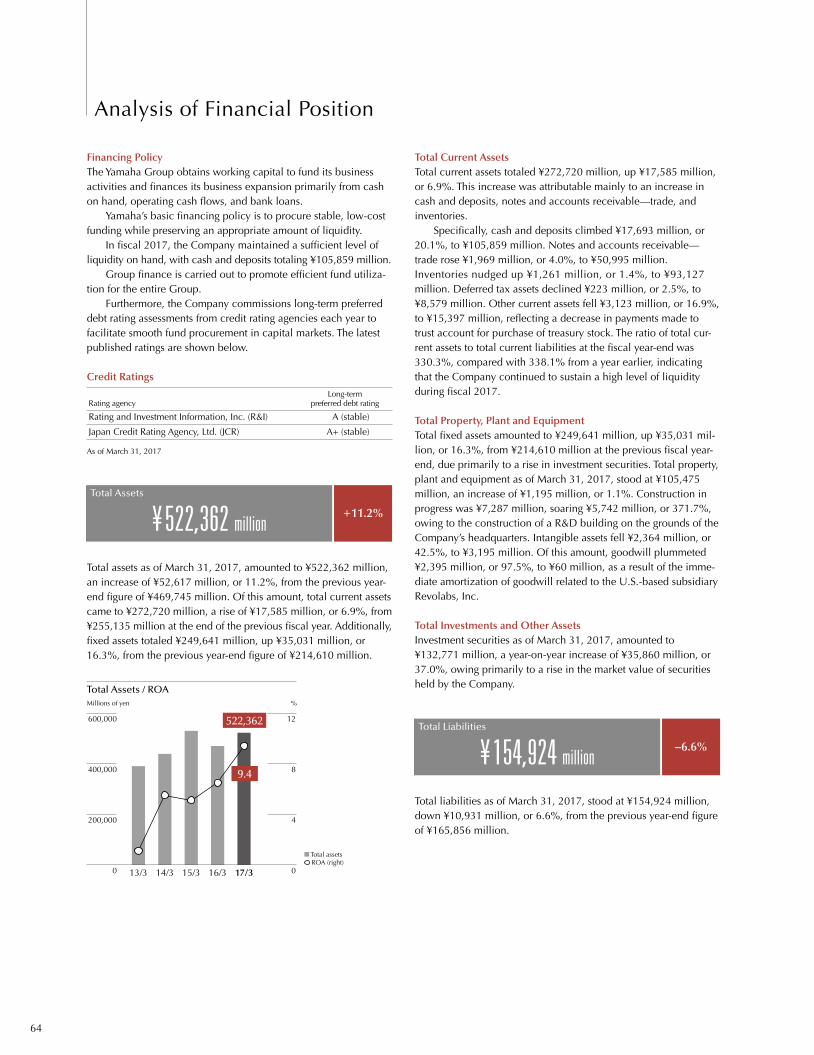
+11.2%
Total Assets
¥ 522,362 million
Total assets as of March 31, 2017, amounted to ¥522,362 million, an increase of ¥52,617 million, or 11.2%, from the previous year-end figure of ¥469,745 million. Of this amount, total current assets came to ¥272,720 million, a rise of ¥17,585 million, or 6.9%, from ¥255,135 million at the end of the previous fiscal year. Additionally, fixed assets totaled ¥249,641 million, up ¥35,031 million, or 16.3%, from the previous year-end figure of ¥214,610 million.
Total Assets / ROAMillions of yen %
17/316/315/314/313/30
200,000
400,000
600,000
0
4
8
12
Total assets ROA (right)
Total Current AssetsTotal current assets totaled ¥272,720 million, up ¥17,585 million, or 6.9%. This increase was attributable mainly to an increase in cash and deposits, notes and accounts receivable—trade, and inventories.
Specifically, cash and deposits climbed ¥17,693 million, or 20.1%, to ¥105,859 million. Notes and accounts receivable—trade rose ¥1,969 million, or 4.0%, to ¥50,995 million. Inventories nudged up ¥1,261 million, or 1.4%, to ¥93,127 million. Deferred tax assets declined ¥223 million, or 2.5%, to ¥8,579 million. Other current assets fell ¥3,123 million, or 16.9%, to ¥15,397 million, reflecting a decrease in payments made to trust account for purchase of treasury stock. The ratio of total cur-rent assets to total current liabilities at the fiscal year-end was 330.3%, compared with 338.1% from a year earlier, indicating that the Company continued to sustain a high level of liquidity during fiscal 2017.
Total Property, Plant and EquipmentTotal fixed assets amounted to ¥249,641 million, up ¥35,031 mil-lion, or 16.3%, from ¥214,610 million at the previous fiscal year-end, due primarily to a rise in investment securities. Total property, plant and equipment as of March 31, 2017, stood at ¥105,475 million, an increase of ¥1,195 million, or 1.1%. Construction in progress was ¥7,287 million, soaring ¥5,742 million, or 371.7%, owing to the construction of a R&D building on the grounds of the Company’s headquarters. Intangible assets fell ¥2,364 million, or 42.5%, to ¥3,195 million. Of this amount, goodwill plummeted ¥2,395 million, or 97.5%, to ¥60 million, as a result of the imme-diate amortization of goodwill related to the U.S.-based subsidiary Revolabs, Inc.
Total Investments and Other AssetsInvestment securities as of March 31, 2017, amounted to ¥132,771 million, a year-on-year increase of ¥35,860 million, or 37.0%, owing primarily to a rise in the market value of securities held by the Company.
–6.6%
Total Liabilities
¥ 154,924 million
Total liabilities as of March 31, 2017, stood at ¥154,924 million, down ¥10,931 million, or 6.6%, from the previous year-end figure of ¥165,856 million.
Analysis of Financial Position
522,362
9.4
64
Total Current LiabilitiesTotal current liabilities came to ¥82,565 million, an increase of ¥7,105 million, or 9.4%. While short-term loans payable and accounts payable—other and accrued expenses rose, notes and accounts payable—trade as well as provision for product warran-ties declined. Specifically, short-term loans payable climbed ¥2,761 million, or 32.8%, to ¥11,170 million. Accounts payable—other and accrued expenses rose ¥6,738 million, or 18.1%, to ¥43,961 million. Meanwhile, notes and accounts payable—trade declined ¥1,524 million, or 7.9%, to ¥17,828 million, while pro-vision for product warranties fell ¥839 million, or 33.2%, to ¥1,687 million.
Total Noncurrent LiabilitiesTotal noncurrent liabilities as of March 31, 2017, totaled ¥72,359 million, a fall of ¥18,037 million, or 20.0%. Deferred tax liabili-ties, net defined benefit liabilities, and long-term deposits received all decreased. Specifically, deferred tax liabilities were down ¥2,588 million, or 10.5%, to ¥22,161 million. Net defined benefit liabilities fell ¥14,985 million, or 39.4%, to ¥23,039 million, fol-lowing pension plan revisions. Furthermore, long-term deposits received decreased ¥5,939 million, or 39.5%, to ¥9,102 million.
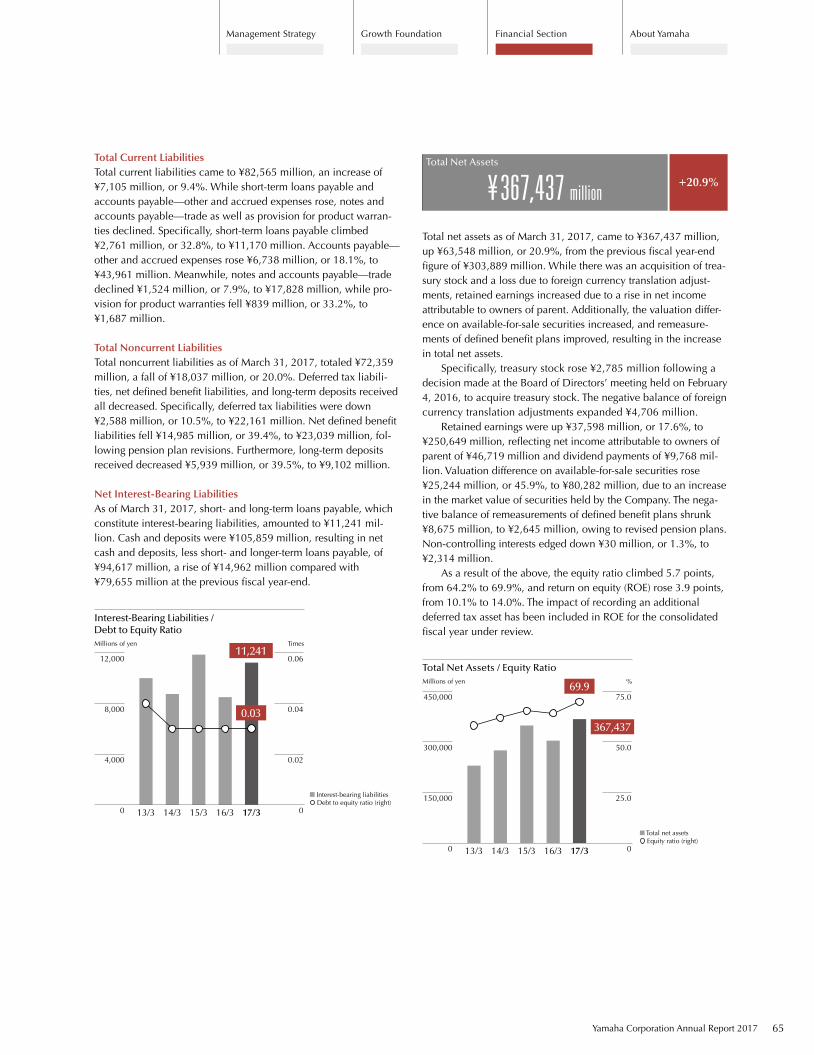
Net Interest-Bearing LiabilitiesAs of March 31, 2017, short- and long-term loans payable, which constitute interest-bearing liabilities, amounted to ¥11,241 mil-lion. Cash and deposits were ¥105,859 million, resulting in net cash and deposits, less short- and longer-term loans payable, of ¥94,617 million, a rise of ¥14,962 million compared with ¥79,655 million at the previous fiscal year-end.
Interest-Bearing Liabilities / Debt to Equity RatioMillions of yen Times
0
4,000
8,000
12,000
0
0.02
0.04
0.06
17/316/315/314/313/3
Interest-bearing liabilities Debt to equity ratio (right)
+20.9%
Total Net Assets
¥ 367,437 million
Total net assets as of March 31, 2017, came to ¥367,437 million, up ¥63,548 million, or 20.9%, from the previous fiscal year-end figure of ¥303,889 million. While there was an acquisition of trea-sury stock and a loss due to foreign currency translation adjust-ments, retained earnings increased due to a rise in net income attributable to owners of parent. Additionally, the valuation differ-ence on available-for-sale securities increased, and remeasure-ments of defined benefit plans improved, resulting in the increase in total net assets.
Specifically, treasury stock rose ¥2,785 million following a decision made at the Board of Directors’ meeting held on February 4, 2016, to acquire treasury stock. The negative balance of foreign currency translation adjustments expanded ¥4,706 million.
Retained earnings were up ¥37,598 million, or 17.6%, to ¥250,649 million, reflecting net income attributable to owners of parent of ¥46,719 million and dividend payments of ¥9,768 mil-lion. Valuation difference on available-for-sale securities rose ¥25,244 million, or 45.9%, to ¥80,282 million, due to an increase in the market value of securities held by the Company. The nega-tive balance of remeasurements of defined benefit plans shrunk ¥8,675 million, to ¥2,645 million, owing to revised pension plans. Non-controlling interests edged down ¥30 million, or 1.3%, to ¥2,314 million.
As a result of the above, the equity ratio climbed 5.7 points, from 64.2% to 69.9%, and return on equity (ROE) rose 3.9 points, from 10.1% to 14.0%. The impact of recording an additional deferred tax asset has been included in ROE for the consolidated fiscal year under review.
Total Net Assets / Equity RatioMillions of yen %
0
25.0
50.0
75.0
0
150,000
300,000
450,000
17/316/315/314/313/3
Total net assets Equity ratio (right)
11,241
367,4370.03
69.9
Financial SectionGrowth FoundationManagement Strategy About Yamaha
Yamaha Corporation Annual Report 2017 65
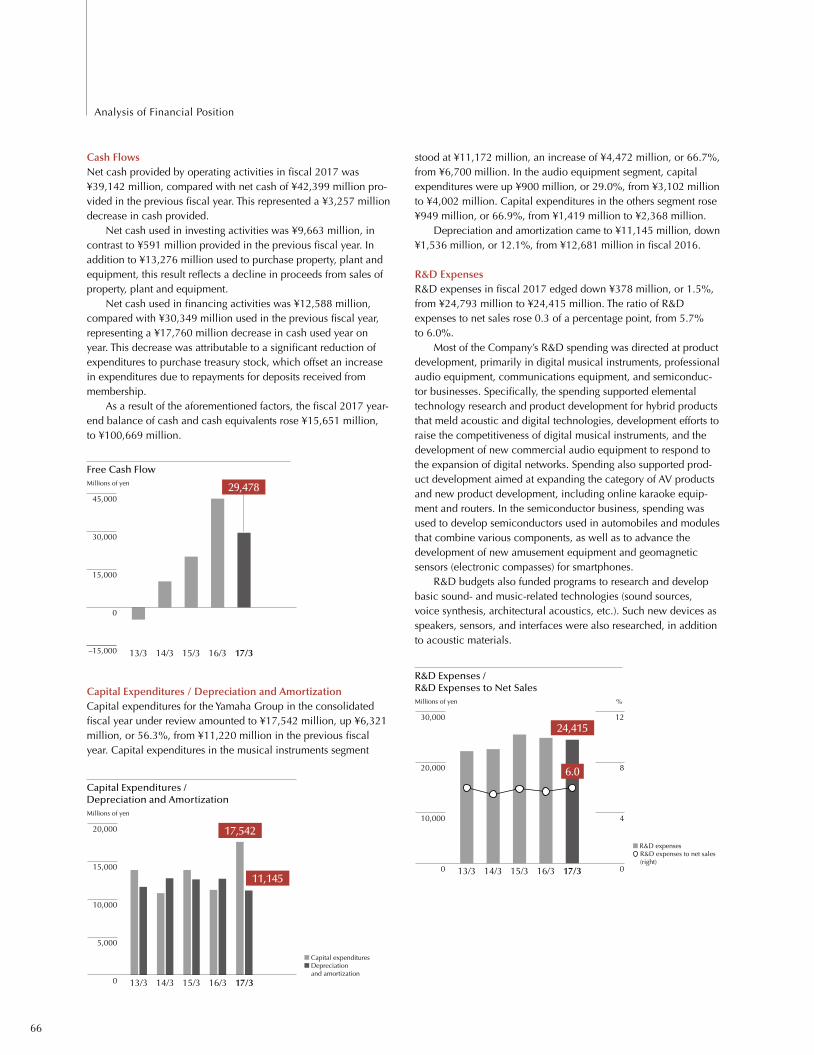
Cash FlowsNet cash provided by operating activities in fiscal 2017 was ¥39,142 million, compared with net cash of ¥42,399 million pro-vided in the previous fiscal year. This represented a ¥3,257 million decrease in cash provided.
Net cash used in investing activities was ¥9,663 million, in contrast to ¥591 million provided in the previous fiscal year. In addition to ¥13,276 million used to purchase property, plant and equipment, this result reflects a decline in proceeds from sales of property, plant and equipment.
Net cash used in financing activities was ¥12,588 million, compared with ¥30,349 million used in the previous fiscal year, representing a ¥17,760 million decrease in cash used year on year. This decrease was attributable to a significant reduction of expenditures to purchase treasury stock, which offset an increase in expenditures due to repayments for deposits received from membership.
As a result of the aforementioned factors, the fiscal 2017 year-end balance of cash and cash equivalents rose ¥15,651 million, to ¥100,669 million.
Free Cash FlowMillions of yen
–15,000
0
45,000
30,000
15,000
17/316/315/314/313/3
Capital Expenditures / Depreciation and AmortizationCapital expenditures for the Yamaha Group in the consolidated fiscal year under review amounted to ¥17,542 million, up ¥6,321 million, or 56.3%, from ¥11,220 million in the previous fiscal year. Capital expenditures in the musical instruments segment
stood at ¥11,172 million, an increase of ¥4,472 million, or 66.7%, from ¥6,700 million. In the audio equipment segment, capital expenditures were up ¥900 million, or 29.0%, from ¥3,102 million to ¥4,002 million. Capital expenditures in the others segment rose ¥949 million, or 66.9%, from ¥1,419 million to ¥2,368 million.
Depreciation and amortization came to ¥11,145 million, down ¥1,536 million, or 12.1%, from ¥12,681 million in fiscal 2016.
R&D ExpensesR&D expenses in fiscal 2017 edged down ¥378 million, or 1.5%, from ¥24,793 million to ¥24,415 million. The ratio of R&D expenses to net sales rose 0.3 of a percentage point, from 5.7% to 6.0%.
Most of the Company’s R&D spending was directed at product development, primarily in digital musical instruments, professional audio equipment, communications equipment, and semiconduc-tor businesses. Specifically, the spending supported elemental technology research and product development for hybrid products that meld acoustic and digital technologies, development efforts to raise the competitiveness of digital musical instruments, and the development of new commercial audio equipment to respond to the expansion of digital networks. Spending also supported prod-uct development aimed at expanding the category of AV products and new product development, including online karaoke equip-ment and routers. In the semiconductor business, spending was used to develop semiconductors used in automobiles and modules that combine various components, as well as to advance the development of new amusement equipment and geomagnetic sensors (electronic compasses) for smartphones.
R&D budgets also funded programs to research and develop basic sound- and music-related technologies (sound sources, voice synthesis, architectural acoustics, etc.). Such new devices as speakers, sensors, and interfaces were also researched, in addition to acoustic materials.
Capital Expenditures / Depreciation and AmortizationMillions of yen
R&D Expenses / R&D Expenses to Net SalesMillions of yen %
17/316/315/314/313/30
5,000
10,000
15,000
20,000
0
10,000
20,000
30,000
0
4
8
12
17/316/315/314/313/3
Capital expenditures Depreciation and amortization
R&D expenses R&D expenses to net sales (right)
17,542
24,415
11,145
6.0
29,478
66
Analysis of Financial Position
Performance forecastFiscal 2018 represents the middle year of the medium-term man-agement plan, NEXT STAGE 12.
Gradual economic recovery is expected to continue in North America. In Europe, although uncertainty remains about the future of the EU, signs of economic recovery have emerged and a solid performance is anticipated. While stagnation in the economic growth rate in China is expected to some extent, the Company is expect-ing to realize a stable performance due to steady growth in piano sales and genuine rise in popularity of other musical instruments, such as digital pianos and guitars. In other emerging countries, while conditions vary by country, the Company expects to realize a certain amount of overall sales growth based on the results it achieved throughout fiscal 2017 and in light of the establishment of a new organization that will manage the Asia Pacific region.
By business segment, in the musical instruments segment, the Company will continue its efforts to increase sales through the upgrade of sales networks in China and other emerging countries. Particularly in China, the Company will respond flexibly to the changing market, which is beginning to show steady sales growth for various products, including digital musical instruments, wind instruments, and guitars. Also, in such developed markets as North America, the Company aims to expand sales by taking a flexible approach to market changes while maximizing the impact of new product launches. Overall, in the musical instruments segment, the Company is expecting a slight increase in sales due to the impact of foreign exchange rates. Income is also expected to increase despite losses in certain areas.
In the audio equipment segment, for AV products, the Company aims to achieve sales growth by steadily promoting the launch of new network audio products. As for PA equipment, the Company will strengthen its ability to offer system solutions in the field of commercial audio equipment, centered on its mainstay digital mixers. In addition, the Company will make a full-scale entry into the commercial installed sound market. In the United States and ASEAN regions, the Company will promote the estab-lishment of a sales structure, which in turn will lead to a steady increase in the rate of growth. In the commercial router business, the Company will leverage its high reputation in the market and expand its domain for switches, access points, and other products. At the same time, the Company aims to increase sales of ICT devices as a whole by integrating microphone speakers for Web conferencing into the audio communication device business.
In the others segment, for the electronic devices business, the Company expects sales to be on a par with those of fiscal 2017. Amid such expectations, the Company will promote efforts to improve the product model mix and reduce costs. At the same time, the Company will contribute to the profit growth of client
companies through proposals for modules that combine the vari-ous technologies it possesses.
For golf products, although adverse conditions are expected to continue overseas, the Company aims to further boost its product recognition in Japan and expand sales by increasing its market share. In the automobile interior wood components business, with the aim of enhancing its manufacturing capabilities by reducing lead time, the Company will work to deliver a stable supply to customers. For FA equipment, the Company will set its sights on higher sales through the expansion of its customer base and initia-tives to bolster customer support by increasing the number of development staff. In the resort business, the Company aims to improve profitability through structural reforms and other mea-sures, despite an expected sales decrease due to the impact of facility transfers.
Exchange rate assumptions for fiscal 2018 are ¥110 per US$1, ¥120 per €1, and ¥16.2 per CNY¥1. Additionally, the Company expects to set a record high for operating income.
Capital Expenditures ForecastIn fiscal 2018, capital expenditures are expected to increase ¥28,400 million compared with fiscal 2017. In addition to regular investment in molds for the production of new products, invest-ment for facility upgrades and refurbishment, investment related to sales and marketing, investment to increase production capacity, R&D investment, and expenses related to plant rationalization, the Company plans to make investments to develop new facilities in the area surrounding its headquarters as well as to establish additional new production facilities in India and Indonesia. Depreciation and amortization expenses are expected to be on a par with the previous fiscal year as these expenses will not increase to the extent of capital expenditures following the Groupwide integration of a straight-line depreciation method.
Profit Distribution PolicyWith due consideration given to raising ROE, Yamaha adheres to a basic policy of actively providing returns to its shareholders while carrying out growth investments in areas such as R&D, sales, and capital expenditures, based on prospective levels of medium-term consolidated earnings. For shareholder returns, the Company adopts a policy of providing a continuous and stable dividend. However, giving consideration to the balance between returns and an appropriate amount of retained earnings for future growth investments, the Company will provide returns in a flexible and appropriate manner with the aim of improving capital efficiency. In addition, the Company has set a goal for a consolidated payout ratio of 30% or more. Furthermore, in fiscal 2018, the Company plans to pay a total dividend of ¥56.0 per share.
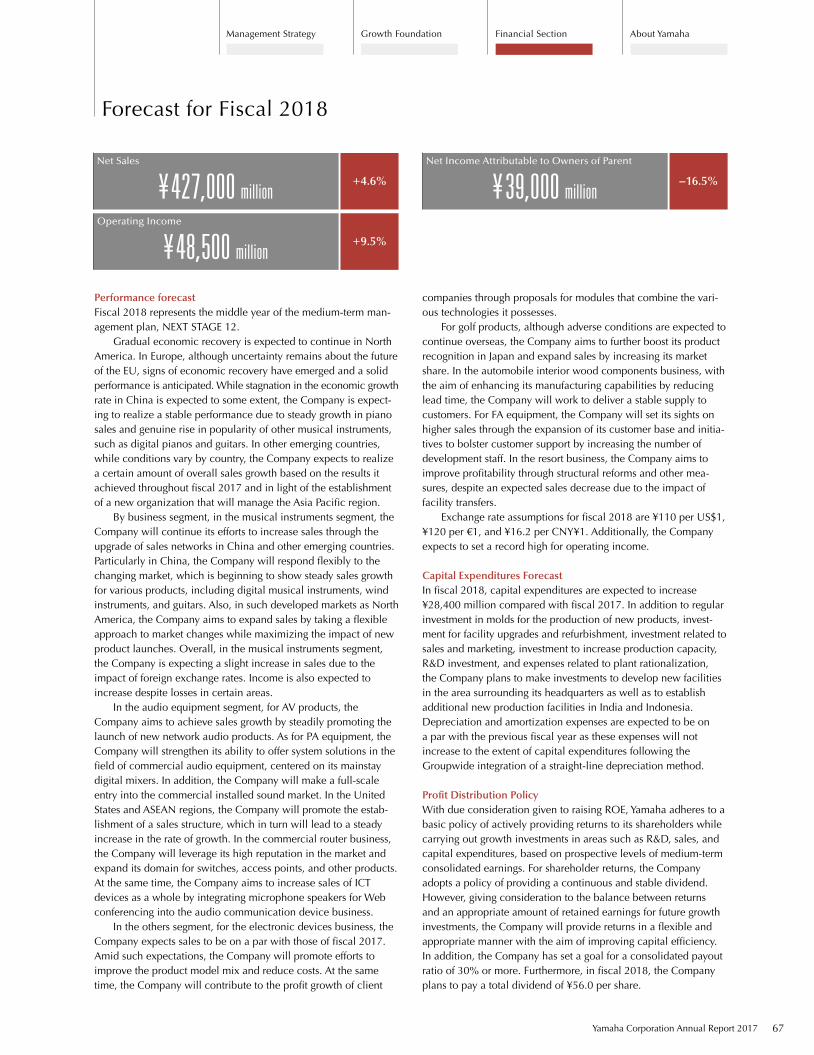
+4.6%
Net Sales
¥ 427,000 million–16.5%
Net Income Attributable to Owners of Parent
¥ 39,000 million
+9.5%
Operating Income
¥ 48,500 million
Financial SectionGrowth FoundationManagement Strategy About Yamaha
Yamaha Corporation Annual Report 2017 67
Forecast for Fiscal 2018