
Management Response to Early Initiatives as recommended in ...
190
I would like to thank the Transportation Cabinet employees for all their time and effort put forth in working together with Guidehouse to help support the creation of the Current State Analysis. Guidehouse gathered current state information by interviewing people across all three agencies, looking at real data of our operations and functional areas and looking at what makes other DOTs successful. The analysis was needed to establish a common understanding about how we currently operate across agencies and to facilitate the appropriate consideration of the changes, alternative organizational opportunities and process improvements recommendations that are to come. It is important to agree on that common understanding before we can think about how we will operate in the future. This report is not intended to cast judgement on any one Agency, Division, or the commitment, dedication, and investment of staff in their work to the respective agency missions. It is simply data, not criticism, an honest evaluation and benchmark of our practices and a look towards leading edge practices. The Transportation Modernization Committee will now use the Current State Analysis to begin work on focus areas to develop recommendations for organizational and process change. Also, you will find as part of the analysis, three early action immediate initiatives as recommended by Guidehouse. I have visited with our team members who are included and we look forward to working with them as these initiatives are transformed from recommendations into detailed opportunities. The initiative recommendations were reviewed by executive staff and attached you will find the summary response resulting from that consideration. We didn’t completely agree with everything presented and offered perspective on nuances that might not have been clear that will be further considered during the detailing of the recommendations. As the Transportation Modernization Committee works from the Current State Analysis and brings forward additional recommendations, my request is that each of you continue to provide feedback and input with a focus on our transportation future and our service to Oklahoma citizens. Thank you for your continued hard work and dedication to transportation in the state of Oklahoma. Tim J. Gatz Secretary of Transportation
Transcript of Management Response to Early Initiatives as recommended in ...

I would like to thank the Transportation Cabinet employees for all their time and effort put forth in working together with Guidehouse to help support the creation of the Current State Analysis. Guidehouse gathered current state information by interviewing people across all three agencies, looking at real data of our operations and functional areas and looking at what makes other DOTs successful.
The analysis was needed to establish a common understanding about how we currently operate across agencies and to facilitate the appropriate consideration of the changes, alternative organizational opportunities and process improvements recommendations that are to come. It is important to agree on that common understanding before we can think about how we will operate in the future. This report is not intended to cast judgement on any one Agency, Division, or the commitment, dedication, and investment of staff in their work to the respective agency missions. It is simply data, not criticism, an honest evaluation and benchmark of our practices and a look towards leading edge practices.
The Transportation Modernization Committee will now use the Current State Analysis to begin work on focus areas to develop recommendations for organizational and process change. Also, you will find as part of the analysis, three early action immediate initiatives as recommended by Guidehouse. I have visited with our team members who are included and we look forward to working with them as these initiatives are transformed from recommendations into detailed opportunities. The initiative recommendations were reviewed by executive staff and attached you will find the summary response resulting from that consideration. We didn’t completely agree with everything presented and offered perspective on nuances that might not have been clear that will be further considered during the detailing of the recommendations.
As the Transportation Modernization Committee works from the Current State Analysis and brings forward additional recommendations, my request is that each of you continue to provide feedback and input with a focus on our transportation future and our service to Oklahoma citizens. Thank you for your continued hard work and dedication to transportation in the state of Oklahoma.
Tim J. Gatz Secretary of Transportation

Management Response to Early Initiatives as recommended in the Current State Analysis:
Initiative 1:
1. Move OMPT under the Director of Capital Programs - Concur 2. Combine OMPT with Rail Division- Partially concur
a. Create a Modal division with OMPT, Rail and Waterways, see discussion under Initiative 2.a. This new division would then address statewide personal and freight mobility for the State of Oklahoma. Ultimately may include Active Transportation and Micro-mobility initiatives.
Initiative 2:
1. Creation of a Communications Group that serves the Transportation Cabinet – Concur. This group would encompass MPR, marketing and video and content development and be responsible for assisting with the marketing and promotion of waterways.
2. Include Governmental Affairs into Communications Group – Do not concur a. Combine resources of Tribal Liaison, Legislative Affairs, and Administrative Affairs into
one group. This will facilitate communication of the expertise of transportation policy knowledge on the state and federal level more effectively. Communications services can assist with messaging, but should not encompass a governmental affairs group due to the technical knowledge required.
3. Waterways moves into Communications Group moves into Initiative #1- Partially concur with modifications. Instead include in initiative 1, see below.
a. Combine this group with Rail and OMPT in Initiative #1 thereby strengthening the necessary coordination between modes. Additionally, with recent changes in state and federal laws, namely WRDA, grant and reimbursement opportunities are available for the MKARNS, which require program management. Grant applications and grant administration are appropriately managed by the Capital Programs divisions.
4. Governance of OSD – Partially concur a. Staff currently dedicated to graphic design and visual studios to create content should be
included in the Transportation Cabinet Communications Group. IT, Content Management, and other areas providing administrative services like cell phones, mail services, etc. should not be included in this early initiative.

Initiative 3:
1. Restructure Tolling "Back Office"-Concur. Re-structure OTA Customer Service, Tolling Operations, and Controller divisions to strengthen the back-office operations; and allow Customer Service and Controller divisions autonomy to re-calibrate (e.g. Launch new initiatives, re-tool and manage training programs, etc..) for success ahead of the AET rollout on the Kilpatrick Turnpike

State of OklahomaTransportation Modernization
Final Current State Assessment
February 2021

Current State Deliverables
1
Project Overview
1Executive Summary
2Cabinet
Assessment
3Focus Area Assessment
4
The Current State Assessment Deliverable is comprised of the following components:
Immediate Initiatives
5Appendix: Focus
Area Profiles
6

Table of Contents
2
01 Project Overview X3X 03 Cabinet Assessment 18
Project Overview 4 People & Organization 19
Project Approach 5 Process & Performance 24
Project Vision Blueprint 6 Infrastructure 28
Modernization Framework 7 04 Focus Area Assessment 32
Current State Inputs & Outputs 8 Business Functions 33
02 Executive Summary 9 Operating Platform 42
Cabinet Overview 10 05 Immediate Initiatives 51
Current State Findings: Cabinet 12 Overview 52
Current State Findings: Business Functions 13 Initiative 1: Relocate Mobility & Public Transit 53
Current State Findings: Operating Platform 14 Initiative 2: Integrate Media/PR/Communications 54
Immediate Initiatives 16 Initiative 3: Restructure Tolling “Back Office” 55
Next Steps 17 06 Appendix: Focus Area Profiles 56

3
03Cabinet Assessment
02Executive Summary
01Project Overview
06Appendix: Focus Area Profiles
05Immediate Initiatives
04Focus Area Assessment

Project Overview
4
The purpose of the Current State Assessment report is to establish a common, fact-based understanding of the operating models ofthe Cabinet, from which modernization initiatives can be developed in the next phase of the project. In particular, the report:
1. Synthesizes Cabinet Level organizational maturity findings
2. Presents a detailed analysis of 14 of the Agencies’ critical Business and Operating Platform Functions
3. Identify next steps and initiatives for immediate consideration
Report Objectives
BackgroundExecutive Leadership at the Oklahoma Department of Transportation (ODOT), Oklahoma Turnpike Authority (OTA), and Oklahoma Aeronautics Commission (OAC), collectively referred to as the “Cabinet,” have recognized that there is both the opportunity and urgency to modernize the combined organizational structure and operations of the Cabinet. The goal of this effort is to integrate and optimize the combined operating models of the three Agencies and deliver enduring cost savings, while positioning the Cabinet to meet the transportation needs of the State over the next 50 years. Guidehouse has been engaged to support the Executive Leadership and the Transportation Modernization Committee (TMC) by providing an objective analysis of the three Agencies’ operating models and facilitating the design and proposal of a set of recommendations to optimize the combined operating models of these Agencies.
Guidehouse appreciates and wants to acknowledge the cooperation that ODOT, OTA, and OAC provided during the course of this review. We were impressed with the knowledge, level of engagement, and flexibility of Cabinet staff at all levels. This report would not be possible without the countless individuals who agreed to be interviewed and provide documentation assistance. The quick and effective coordination with staff, despite the Covid-19 pandemic, was critical to the success of this report.
Acknowledgements

Project Approach
5
As the Prepare for Change phase winds down, Guidehouse will work intimately with the Transportation Modernization Committee (TMC) during the Architect the Change phase to design the future state and develop recommendations
Activities
Deliverables
Phase & Timeline
Prepare for Change (7 Months): Jul ‘20 – Jan ‘21
AssessConfirm & Plan
Architect the Change (4 Months): Feb ‘21 – May ‘21
• Articulate Modernization vision and guiding principles• Conduct internal and external stakeholder interviews• Execute data and document analysis• Conduct maturity assessment at the Cabinet and
Focus Area levels• Conduct targeted leading practice review and outreach
Sustain the Change (2 Months): Jun ‘21 – Jul ‘21
Design Construct Implement Sustain
• Conduct iterative workshops with TMC members to identify modernization recommendations
• Surface relevant leading practices• Prioritize recommendations• Develop high-level roadmap for implementation and
sequencing
Current State Report(this document) Recommendations Report
• Support tracking of implementation progress
• Adjust implementation roadmap• Conduct project closeout
activities
Closeout Documents

Project Vision Blueprint
6
For this Initiative, the Modernization Vision and Guiding Principles have served as the “North-Star”, shaped the current state assessment, and will help steer the next phase
1. Improved Collaboration: Fosters integration and coordination of activities, expertise, and resources across projects and key department functions that can be better achieved together while improving transportation services for Oklahoma
2. Enhanced Innovation: Promotes innovation across the organization and modernizes all business processes with data analytics and tailored technology solutions
3. Greater Communication: Facilitates constructive communication that ensures participation and transparency across the organization
4. Exceptional Customer Service: Prioritizes and manages internal and external customer service, and allows user needs to influence transportation planning
5. Increased Efficiency: Streamlines organizational structure and functions while encouraging collective and proactive optimization of resources, delivery timelines, and results
6. Rapid Adaptability: Enables the organization to rapidly address existing and emerging needs, allocate resources, and implement solutions accordingly
Transportation Modernization Vision:An efficient, innovative, and customer-driven organization working collaboratively to provide safe, modernized, integrated and sustainable transportation options throughout Oklahoma
Guiding Principles for Modernization
1
2
4
5
6 Rapid Adaptability
3
Increased Efficiency
Exceptional Customer Service
Greater Communication
Enhanced Innovation
Improved Collaboration

Modernization Framework
7
The Capability Maturity Model serves as a foundational framework to Modernization. The framework, coupled with the Modernization Vision and Guiding Principles, serves as the lens used to examine the Cabinet and will guide the future recommendations and implementation roadmap to ensure success

Current State Assessment Inputs & Outputs
8
213Interviews
800+Documents Reviewed
3Immediate Initiatives
261Pain Points
20Initial
Opportunities
6Peer DOTs for outreach
26Validation
Conversations

9
03Cabinet Assessment
02Executive Summary
01Project Overview
06Appendix: Focus Area Profiles
05Immediate Initiatives
04Focus Area Assessment
71.7%
17.9%
5.7%
2.2% 1.1% 1.4%Capital Projects
General Operations
Debt Service
Administrative / Support ServicesMaintenance
Other
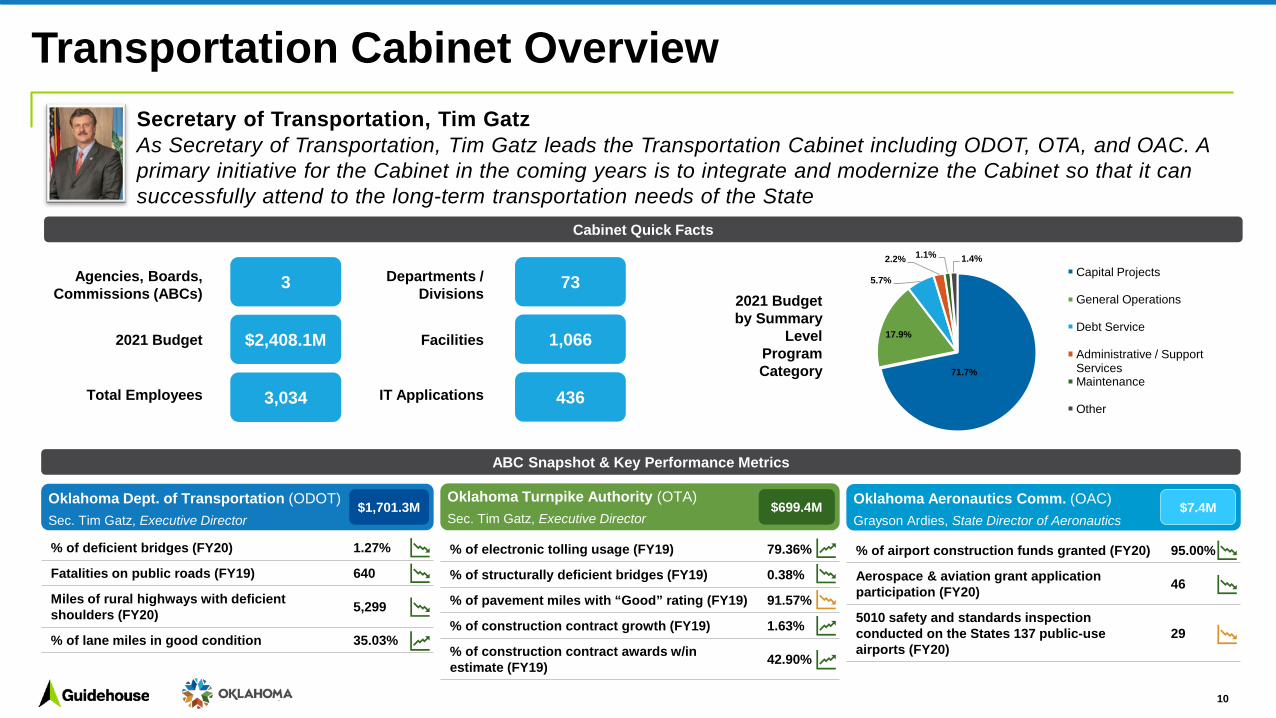
Transportation Cabinet Overview
ABC Snapshot & Key Performance Metrics
Secretary of Transportation, Tim Gatz
% of deficient bridges (FY20) 1.27%
Fatalities on public roads (FY19) 640
Miles of rural highways with deficient shoulders (FY20) 5,299
% of lane miles in good condition 35.03%
Oklahoma Dept. of Transportation (ODOT)Sec. Tim Gatz, Executive Director
$1,701.3MOklahoma Turnpike Authority (OTA)Sec. Tim Gatz, Executive Director
$699.4M Oklahoma Aeronautics Comm. (OAC)Grayson Ardies, State Director of Aeronautics
$7.4M
% of electronic tolling usage (FY19) 79.36%
% of structurally deficient bridges (FY19) 0.38%
% of pavement miles with “Good” rating (FY19) 91.57%
% of construction contract growth (FY19) 1.63%
% of construction contract awards w/in estimate (FY19) 42.90%
% of airport construction funds granted (FY20) 95.00%
Aerospace & aviation grant application participation (FY20) 46
5010 safety and standards inspection conducted on the States 137 public-use airports (FY20)
29
Departments / Divisions
Facilities
IT Applications
3
$2,408.1M
3,034
73
1,066
436
Agencies, Boards, Commissions (ABCs)
2021 Budget
Total Employees
2021 Budget by Summary
Level Program Category
Cabinet Quick Facts
As Secretary of Transportation, Tim Gatz leads the Transportation Cabinet including ODOT, OTA, and OAC. A primary initiative for the Cabinet in the coming years is to integrate and modernize the Cabinet so that it can successfully attend to the long-term transportation needs of the State
10

Current State Observations: Overview
11
To enable the development of granular and targeted modernization opportunities, the current state of the Cabinet was assessed at three levels; Cabinet level, primary Focus Areas, and Focus Area Sub-Functions
Cabinet
14 Primary Focus Areas“Front-office” or “back-office”
functional areas existing across the Cabinet
67 Focus Area Sub-FunctionsUnique functions or processes that make up the core responsibilities of each Primary Focus Area
Finance: Budgeting, revenue recognition, accounts payable (A/P), reporting, payroll, and project finance (9 Sub-Functions)
HR: HR operations, talent acquisition, payroll, training, safety services, and printing (6 Sub-Functions)
IT: IT infrastructure administration, business analysis, data services app development, and help desk (10 Sub-Functions)
Procurement: Contract and acquisition administration, and PO and P-card management (3 Sub-Functions)
Media / PR / Communications: Media, PR, Comms., marketing, and content development (3 Sub-Functions)
Audit: Internal and external audit activities (3 Sub-Functions)
Facilities & Land Management: Facilities construction, maintenance, administration services, and ROW acquisition and disposal (4 Sub-Functions)
Portfolio Planning & Project Management: Identification of transportation needs, prioritization, and management of capital/multi-model projects (4 Sub-Functions)Design & Pre-Construction: Plan design preparation and review, environmental approvals and utility relocations (5 Sub-Functions)Project Letting & Consultant Contracts: Construction project letting, contractor/consultant sourcing, and Spec book creation (4 Sub-Functions)Construction Monitoring: Project setup/administration, construction inspection and materials testing, and vendor payments (4 Sub-Functions)Maintenance: Maintenance project planning and execution, and equipment management (7 Sub-Functions)Transportation Systems Mgmt. & Operations (TSMO): Traffic/safety data collection, analytics, design, and real-time management (4 Sub-Functions) Customer Services: Management of public inquires from placement to resolution (1 Sub-Function)
Business Function“front-office” functions or functions critical to the specific
Agency missions within the Cabinet
Operating Platform“back-office” functions, administrative functions, and support
services
29 38Business Sub-Functions
Operating Sub-Functions

Current State Observations: Cabinet Level
12
The Capability Maturity Model presents a pathway to realizing the Transportation Modernization Vision. A comparison of the Cabinet to select characteristics of an optimized organization based on the Maturity Model helps direct the approach to identify and shaping recommendations
Ideal Modernization CharacteristicCurrent State Observations
• Appropriate functions centralized• Singular area / functional leaders • Efficient staffing• Matrix accountabilities• Human capital strategy
• Strong system accountability (KPIs) & internal performance
• Clear strategy to operations alignment• Customer Centric Processes• Effective talent management
• IT as a strategic business partner• Interoperable and right-sized platforms• Single source-of-truth platform• Predictive analytics, RPA, AI
• Functional duplication across the Cabinet• Manager Span of Control is low and uneven• Hybrid organization with unbalanced structural
accountabilities• Talent development is inconsistent
• IT Operating Model is disconnected but developing
• Facility footprint outweighs Cabinet need
People & Organization
Process & Performance
Infrastructure
Siloed Centralized Streamlined Integrated OptimizedXX
• Cabinet level goals tracked with strong performance, operational effectiveness KPIs are inconsistently utilized
• Strategy to operations “Line of sight” is emerging• Lack of comprehensive process documentation

Observations & Opportunities: Business Functions
13
Our detailed analysis of the 7 Business Function Focus Areas with 29 Sub-Functions across the Agencies yielded several opportunities within the areas of Integrate, Redesign, and Automate, based on the identified strengths and risks below
• ODOT system condition data management and analytics
• Project/Program mgmt.. and controls structure; and software
• Portfolio Plans integration
• ODOT core competencies & process maturity
• OTA design timeframe
• Coordination between Divisions; CO and Districts
• ODOT QA/QC Org. Structure/Processes
• ODOT Project Letting and Spec Book platform
• ODOT Software application support
• Consultant procurement - decision making process
• ODOT construction monitoring platform
• OTA/OAC Vendor Payment/Contract Admin platform
• ODOT Software application support
• ODOT/OTA Maintenance Management Systems
• Maintenance Quality Assurance platform
• Staff turnover and human capital development
• OTA infrastructure to capture real time traffic data
• TSMO strategy and Organizational Structures
PLANNING DESIGN LETTING CONSTRUCTION MAINTENANCE TSMO CUST. SVC.
• OTA customer service platform
• ODOT customer service platform
• Segregation of OTA Tolling duties
STR
ENG
THR
ISK
INTEGRATE REDESIGN AUTOMATE
• Unify portfolio planning, project management, and TSMO within ODOT and expand to include OTA/OAC
• Integrate Design, Letting, and CO Construction functions across Cabinet
• Expand OTA Customer Service role beyond OTA to the entire Cabinet
• Create a Maintenance Quality Assurance framework
• Establish a TSMO Strategy• Define operational effectiveness KPIs
and SLAs where gaps exist• Create process documentation for
critical areas• Establish appropriate
matrix accountabilities
• Expand the use of ODOT construction monitoring, vendor payment, and letting applications across the Cabinet
• Harmonize Maintenance, TSMO, and system condition platforms
• Invest in robust project and grants management platforms
Integrate Redesign
Automate Outsource
43% 29%
29% 0%
CO = Central Office KPI = Key Performance Indicators SLA = Service Level Agreements TSMO = Transportation Safety Management and Operations QA/QC = Quality Assurance, Quality Control

Observations & Opportunities: Operating PlatformOur detailed analysis of the 7 Operating Platform Focus Areas with 38 Sub-Functions across the Agencies yielded several opportunities within the areas of Integrate, Redesign, and Automate, based on the identified strengths and risks below
INTEGRATE REDESIGN AUTOMATE
• Integrate targeted functional areas in HR, Finance/Controller, IT, Comms/ Marketing, Audit, and Procurement
• Unify ROW & Facilities within ODOT and expand to include OTA/OAC
• Establish robust Back Office Support division specific to Tolling
• Establish Strategy for HR Talent Mgt., IT Platform & Service Quality, Facilities
• Define operational effectiveness KPIs and SLAs where gaps exist
• Create process documentation for critical areas
• Establish appropriate matrix accountabilities
• Expand the use of Workday across Cabinet and focus areas where appropriate
• Harmonize Procurement, Communications, Audit and Facilities software applications
Integrate Redesign
Automate Outsource
43% 50%
7% 0%
• ODOT process maturity & KPI platform
• OTA budget, reporting, and accounting standards
• Staff retirement risk• Staffing imbalances• Segregation of OTA
Tolling duties• Multiple / antiquated IT
systems
• ODOT transition to Workday
• ODOT Training Program Development
• Staff retirement risk• Process maturity and
KPI platform• Insufficient staff• Training attendance
value proposition
• OTA IT platform and people capabilities
• Process maturity at OTA
• Many legacy applications and aging infrastructure
• Lack of overall IT governance
• OMES service quality
• Cross agency informal contract sharing
• Dedicated ODOT staff with clear role division
• OTA Marketing platform
• Skilled content development staff
• Comms / Marketing strategy
• Agency brand clarity Functional gaps
• Insufficient & siloed staff
• IT infrastructure
• ODOT audit expertise, process and policy documentation
• Staff Retirement risk• Process maturity and
documentation• OAC functional gap• Audits alignment to
priority risks
• ODOT ROW process maturity and KPI platform
• Facilities / Land Mgmt. Strategy
• Siloed staffing• OTA ROW staffing• Maintenance KPI• Facility Footprint
FINANCE HR IT PROCUREMENT COMMS/PR AUDIT FACILITIES
STR
ENG
THR
ISK
• OTA/OAC staffing levels
• Process automation
ROW = Right of Way KPI = Key Performance Indicators SLA = Service Level Agreements14

Future State Recommendations Approach
15
Establishing a focus for formulating future state recommendations aligns the Cabinet with an appropriate Modernization trajectory
Using the Focus Area level findings as a foundation, establish the right organizational structures, leadership, and internal performance measures to pave the way for longer term operational success and modernization
Organizational Integration
Form a unified IT platform and re-calibrate the facility footprint to enable and catalyze modernization efforts
Right size key infrastructure platforms
Identify and execute on a limited number of high impact / low effort initiatives to help jump-start modernization and set a tone of success
Generate Quick Wins

Immediate Initiatives
Integrate OMPT withinRail Division
Current State: The Office of Mobility and Public Transit (OMPT) is currently without Division Leadership
Recommendation: Move the Office of Mobility and Public Transit (OMPT) under Director of Capital Programs, and potentially integrate with the Rail Division
Benefit: Integrates similar functions and allows for resource pooling, and lays the groundwork to establish a robust multi-modal transportation plan
Integrate Media/PR/Communications
Current State: Communication with the public / external stakeholders is of strategic importance, however, critical strategic and functional gaps exist
Recommendation: Create a “Strategic Communications” division that unifies relevant staff from ODOT and OTA
Benefit: Lays groundwork to establish a robust/unified enterprise marketing, Media/PR, and communications strategy; Integrates similar functions, and allows for resource pooling to enable better performance
1 2
The current state assessment has revealed critical strategic and functional gaps for which the Cabinet should consider taking immediate action to mitigate any near-term risks
16
Strengthen Tolling Back Office Support (BOS)
Current State: OTA’s current BOS structure does not align to leading practices and places the AET rollout on the Kilpatrick at risk
Recommendation: Re-structure OTA Customer Service, Tolling Operations, and Finance divisions to strengthen the back office operations ahead of the AET pilot
Benefit: Allows for the financial, IT, and data systems sophistication and process standardization required for more efficient and scalable electronic transaction processing
3
AET = All Electronic Tolling

Next Steps
17
Secure approval for Immediate Initiatives, Recommendations
Approach, and Report acceptance
1
Secure Key Approvals
Engage Change Management Team to communicate current state findings to Staff,
prioritizing those impacted by Immediate
Initiatives
2
Communicate Findings
Convene the TMC to commence crafting
Modernization recommendations in the “Architect the Change”
Phase
3
Craft Recommendations
The next steps will allow for the Cabinet to attend to some urgent organizational needs, establish the direction for future state recommendations, and enable communication of findings to all transportation staff and help promote engagement

18
03Cabinet Assessment
02Executive Summary
01Overview
06Appendix: Focus Area Profiles
05Immediate Initiatives
04Focus Area Assessment
People & Organization
19

Impacted Guiding Principles
Key Takeaways
Innovation
Communication
Customer Service
Efficiency
Adaptability
Collaboration
Ideal Modernization Characteristic
Functional duplication is pervasive across the Cabinet and some critical gaps exist
Appropriate Functions Centralized
Functional Duplication
52 Duplicative Sub-Functions
• Focus Area Sub-Functions that are identical/analogous, and could be integrated and shared, across ODOT, OTA, and OAC (where appropriate)
• Percentage of duplicative Sub-Functions of the 67 total Sub-Functions spanning 14 Focus Areas across ODOT, OTA, and OAC (where appropriate);
Specialized Sub-Functions5 • Key Sub-Functions that are unique to any one of ODOT, OTA, or
OAC
9 Critical Sub-Functional Gaps
• Sub-Functions that are undeveloped or absent, but have significant impact on the Cabinet operating model
76%
The 5 specialized Sub-Functions include PikePass Customer Service, Revenue Assurance, ODOT Rail and Utilities Audits,
OTA Project Finance, and Misc. Maintenance Programs
Critical Function Gaps include communications, marketing, content development; Maintenance Quality Assurance (MQA); unified TSMO strategy; ODOT IT asset management, business analysis, and content management; and ODOT customer service• Tangential to the Finance Focus Area, OTA faces a critical gap related to the Tolling Back Office Support
Beyond the Focus Areas each Agency executes on unique activities due to statutory or financial requirements, examples include: (ODOT) Civil Rights / DBE; Tribal Liaison; (OTA) Toll Operations, Highway Patrol, and External Audit; (OAC) Aerospace advocacy/education programs
• Considerable opportunity to integrate operations and optimize resources across the three Agencies
• Critical gaps currently exist, some of which need immediate attention
People & Org
20

Key Takeaways
Ideal Modernization Characteristic
Efficient Staffing
Cabinet-wide Leader Staffing Efficiency
Operating Platform Groups SOC vs. 1:6 Benchmark
Directional Opportunity for SOC
Observations
Impacted Guiding Principles
Innovation
Communication
Customer Service
Efficiency
Adaptability
Collaboration
Source: ODOT/OTA/OAC personnel files as of July 2020
Leader Span of Control (SOC)* is low and uneven across the Cabinet illuminating opportunity to optimize staffing and structure
Span of Control Baseline – ODOT and OTA
Marginal difference between current SOC and benchmark** is ~226 Leaders @$16M
Aver
age
Dire
ct R
epor
ts
SOC Baseline – ODOT and OTA
*Span of control refers to the number of employees a leaderoversees as a ratio of Leader to Direct Reports.
Total Leaders vs. Directional Opportunity at 1:6
• Span of Control gives insight into how efficiently Agencies are structured
• Pockets of inefficient staffing exist across the Cabinet and opportunities exist to re-deploy staff
**Benchmark: Program Evaluation Division North Carolina General Assembly December 2016 Report “Most Departments’ Spans of Control and Number of Organizational Layers Do Not Meet Recommended Levels”
Singular Executive / Functional
Leader
Most Operating Platform Functional Groups are Below 1:6 SOC
• Current state Span of Control (SOC) vs. benchmark helps to investigate areas for consolidating and resources movement
• Current state ODOT and OTA are structured with ~65% - 67% of Leaders below benchmark of 1:6, with SOC ranging from 1:1 to 1:4. At the leadership level (6); Division Manager level (20); Manager level (198)
• The aggregate difference between the current SOC and benchmark is equal to 226 leaders representing ~$16M in personnel costs to consider for enabling future state design optionsDirect Reports SOC Target
21
Agency Management Level Total Employees (less Staff)
Number of Leaders
Avg. Direct Reports
Median Direct Reports
Leadership 12 10 8.3 7.0Division Manager 31 30 5.1 5.0Manager 506 505 5.0 4.0Excluded 109 2 1.0 1.0Sub-Total 658 547 5.1 4.0Leadership 5 5 3.4 3.0Division Manager 10 10 3.2 3.5Manager 67 64 9.3 6.0Sub-Total 82 79 8.2 5.0Total 740 626 5.5 4.0
ODOT
OTA
People & Org

PM Division
Impacted Guiding Principles
Key Takeaways
Innovation
Communication
Customer Service
Efficiency
Adaptability
Collaboration
Ideal Modernization Characteristic
The Cabinet has several cross-functional organizational structures but lacks appropriate matrix (vertical and horizontal) accountabilities
Matrix Accountabilities
• Imbalance in authority and decision-making rights limits end to end performance
• Little incentive to collaborate across divisions
• Duplicative systems and lack of process/project transparency
Sur
vey
Rdw
y* /
Brid
ge
Env
*
RO
W */
U
tiliti
es
Traf
fic
PM
PMStaff
PM
PMStaff
PM
PMStaff
PM
PMStaff
PM
PMStaff
Sample agency Org. Structures and current matrix accountabilities
Strong functional
commitment
ODOT Design and Pre-Construction Org Structure
Weak project accountability
• Multiple independent systems to track project & operations execution
• Divisions operate in siloes with very little sharing of information, or best practices
• Lack of Service Level Agreements between collaborating Divisions or overarching KPIs
• Job Descriptions not appropriately structured to drive performance in a matrix environment
• Lack of standard approaches for identical functions that span Divisions, or inconsistent use of standard approaches if they exist
ODOT Central Office and District Offices Org. Structure
Operating Platform DivisionsBusiness FunctionDivisions
Dis
trict
1
HR & Safety
FinanceConstruction
Utilities
HR & Safety
FinanceConstruction
Utilities
Dis
trict
8
Strong District
commitment
Weak functional accountability
Pain Point Observations Sample Outcomes for sub-functions implemented in matrix environment
53Number of Pain Points attributable to lack of appropriate structural accountabilities
% of planned ODOT/OTA projects let on time (2018 & 2019) per 8-Year CWP and 5-Year Capital Plan
73%
12.2%Average annual Cabinet 2019 turnover rate for ODOT/OTA/OAC
22*Rdwy = Roadway Division; Env = Environmental Division; ROW = Right of Way
Source: ODOT/OTA provided 8yr - CWP/5yr - CP performance measures
Source: ODOT/OTA/OMES provided staff turnover data
People & Org
Key Takeaways
Ideal Modernization Characteristic
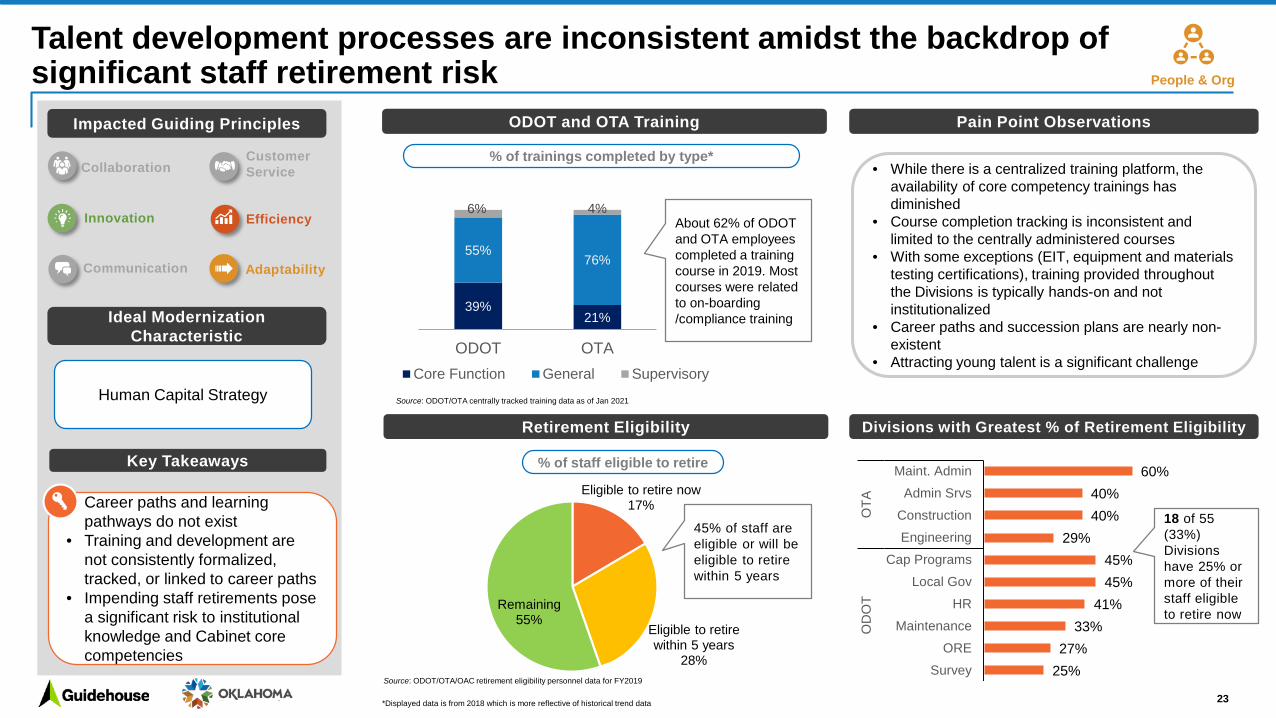
Talent development processes are inconsistent amidst the backdrop of significant staff retirement risk
Human Capital Strategy
ODOT and OTA Training
Retirement Eligibility
Pain Point Observations
Divisions with Greatest % of Retirement Eligibility
% of trainings completed by type*
About 62% of ODOT and OTA employees completed a training course in 2019. Most courses were related to on-boarding /compliance training
• Career paths and learning pathways do not exist
• Training and development are not consistently formalized, tracked, or linked to career paths
• Impending staff retirements pose a significant risk to institutional knowledge and Cabinet core competencies
Impacted Guiding Principles
Innovation
Communication
Customer Service
Efficiency
Adaptability
Collaboration
39%21%
55%76%
6% 4%
ODOT OTACore Function General Supervisory
*Displayed data is from 2018 which is more reflective of historical trend data
• While there is a centralized training platform, the availability of core competency trainings has diminished
• Course completion tracking is inconsistent and limited to the centrally administered courses
• With some exceptions (EIT, equipment and materials testing certifications), training provided throughout the Divisions is typically hands-on and not institutionalized
• Career paths and succession plans are nearly non-existent
• Attracting young talent is a significant challenge
% of staff eligible to retire
45% of staff are eligible or will be eligible to retire within 5 years
Eligible to retire now17%
Eligible to retire within 5 years
28%
Remaining55%
60%40%40%
29%45%45%
41%33%
27%25%
Maint. AdminAdmin Srvs
ConstructionEngineering
Cap ProgramsLocal Gov
HRMaintenance
ORESurvey
OTA
OD
OT
18 of 55 (33%) Divisions have 25% or more of their staff eligible to retire now
23Source: ODOT/OTA/OAC retirement eligibility personnel data for FY2019
Source: ODOT/OTA centrally tracked training data as of Jan 2021
People & Org

Process & Performance
24

Impacted Guiding Principles
Innovation
Customer Service
Efficiency
Collaboration
Ideal Modernization Characteristic
Clear strategy to operations line of sight
Observations
Process
Operations Line of Sight to execute the Cabinet Strategy is emerging but not mature or inclusive
AdaptabilityCommunication The Cabinet has translated 5 of its Strategic goals into concrete action items (“Rocks”) with associated owners and delivery timelines
Line of Sight Model
Action Plan Progress
74%Action Items Complete*
* Out of 58, and as of June 2020
26%Action Items In Process*
While the Cabinet has made significant progress, key functional areas are absent, obscuring contribution and impact
PLANNING 33
The Cabinet has translated 5 of its Strategic goals into concrete action items (“Rocks”) with associated owners and delivery timelines. Nevertheless, the 3 Agencies aren't fully represented, and downstream performance metrics are absent
LETTING 1
CONSTRUCTION 4
MAINTENANCE 1
TSMO 7
COMMS 6
TOLL OPS 6
Agency Strategy to Action Plan
Cabinet Strategy To Operations Line of Sight
Action Item Distribution
58Total “Rocks”
• Current ODOT, OTA, and OAC agency strategic plans highlight contributions to Cabinet Strategy with a historic and “siloed” agency and division mindset, potentially leading to local and “siloed” execution tactics and resource deployment
• Current Action plan / ”Rocks” do not include all business function and operating model components potentially excluding their contributions and impacts to the underlying divisions
Key Takeaways
Without Cabinet mindset and inclusive line of sight: • Operating model to support
execution will be misaligned regarding scope / requirements
• Agencies will be under resourced, execute locally, and contribute less than required
25
Source: ODOT/OTA June 2020 Traction Goals

At the Cabinet level, most metrics detailed in the agency strategic plan are achieved or are on target. However, internal metrics are not consistently clear at the functional area level
Impacted Guiding Principles
Key Takeaways
Innovation
Communication
Customer Service
Efficiency
Adaptability
Collaboration
Ideal Modernization Characteristic
Cabinet level goals tracked with strong performance, operational effectiveness KPIs are inconsistently utilized
• The Cabinet is generally on track to achieve its strategic goals
• Lack of operational effectiveness KPIs limits access to data necessary to continuously improve internal operations over the long run
Strong system accountability
(KPIs) & internal
performanceFocus Areas with more mature KPIs
Agency-level metrics Operational Effectiveness KPIs
• The data to calculate KPIs typically exist. However, data quality issues, lack of performance measurement culture, and system constraints prevent regular and consistent operational performance tracking
• Very few Service Level Agreements (SLAs) exist between divisions which hinders collaboration and accountability
• Performance Management Plans (PMPs) exist at the individual level, yet they are not consistently tracked and do not include function-level performance metrics
Effective talent mgmt.. Pain Point Observations
40% of metrics are not currently operationalized. 40% 60%
9/14
* For FY20 ** For CY19 *** For FY20 ! 2 of 5 OAC goals are marked as N/A
Focus Areas for which Interviews revealed operational effectiveness KPIs were lacking or did not exist
ODOT OTA OAC4 of 4 Trending /
Achieved
ODOT Right of Way•~95 KPIs tracked on a quarterly basis that measure performance across 13 key functional dimensions
ODOT Finance: Accounts payable, Revenue•Robust Performance Management Plans with clearly defined metrics
OTA Customer Service•~15 division and individual level KPIs. Real-time performance data and dashboards readily available and monitored daily
Data Exists,Not Tracked
Operationalized
Distribution of sample Focus Area KPIs
5 of 6 Trending / Achieved
2 of 3! Trending / Achieved
1.27%
Sample KPIs
% Structurally Deficient Bridges*
1.63%% of Contract
Growth**
95%% Programmed funds granted***
26
Source: ODOT/OTA/OAC FY2021 – 20216 Strategic Plans
Process

Impacted Guiding Principles
Key Takeaways
Innovation
Communication
Customer Service
Efficiency
Adaptability
Collaboration
Ideal Modernization Characteristic
Level of processes standardization, documentation, and automation varies, limiting knowledge management and process optimization
Customer Centric Processes
Pain Point Observations
Process Documentation
• Lack of process documentation, reliance on tribal knowledge, and highly manual processes were consistent themes raised in interviews
• Significant policy documentation across Agencies likely due to federal, state, and local requirements
• There are several “pockets” within each Agency that have strong process documentation. (e.g., ROW, Utilities, Construction, Controller/Comptroller, IT)
• On the business side, lack of standard processes poses significant challenges to coordination between divisions, especially in Maintenance and Construction
• Many manual processes exist, and with the transition to telework, some paper-based processes have been quickly transferred to electronic processes. However, electronic processes can still be inefficient. (e.g., emailing a file back and forth to gain all necessary approvals for contracts)
66Number of Process related Pain Points
*Construction document representation is accurate, but volume is scaled down 5X
Business Functions Operating Functions While Policy documentation is extensive, process documentation is not consistently present. Nevertheless, several Focus Areas including Design, Construction, Letting, and IT have significant process documentation
0102030405060
Policy Procedure Report*
Distribution of Process Documentation across Focus Areas1
• Process documentation is generally addressed locally at the Division level
• Without complete end-to-end documentation, customer centered process optimization is difficult and organizational integration will be hampered
27
Source: ODOT/OTA/OAC Documents sent to Guidehouse
Process

Infrastructure
28

Impacted Guiding Principles
Key Takeaways
Innovation
Communication
Customer Service
Efficiency
Adaptability
Collaboration
Ideal Modernization Characteristic
The Enterprise IT Operating Model is disconnected but developing, resulting in IT serving as a transactional rather than strategic partner
Key foundational gaps exist:• Alignment between IT spend
and strategic initiatives• Clarity related to what IT
services will be delivered, by when, and the quality
• Cohesive Org. structure and unified leadership to enable operational maturity
IT as Business Partner
Infrastructure
• No business strategy within / across Agencies creating uncertainty for IT
• No singular view into overall IT demand management across Agencies
• Lack of IT / data governance• Project approvals require long lead times
complex gates
Governance
Performance Measurement Organization
Architecture, Capabilities, Services
• Minimal Enterprise architecture and application standardization
• No clear way to map business applications, interactions, and data
• Numerous legacy systems without robust support or clear migration plan
• IT Service Management (ITSM) is inconsistent but emerging
• SLAs are limited and Performance measures/metrics are compiled manually
• Unclear view of performance of IT investments, distribution, and value
• The majority of IT spend allocated to “run” as opposed to grow/transform
• Unclear IT support structure across Agencies and lack of horizontal coordination
• Undefined / unfollowed vendor management processes with sourcing focused on contractors rather than MSPs
• IT leader load imbalance
IT Applications436Combined 2021 IT Budget$62.1M% IT Budget increase from 2019
23.7% Application Spend$15.5M
20
SLA Categories KPI Categories
ODOT
OTA
311
Source: OMES/OTA provided KPI and SLA information
Source: ODOT/OTA/OAC FY2021 Budget documents
Source: ODOT/OTA/OAC IT application listing and interviews
OMES OSD VendorsDivisions
OMES IT
OMES Admin
Vendors
IT Support Orgs

0 200 400 600
OTA
ODOT
Yards and Residencies Storage BuildingsSalt Sheds Mix ShedsStorm Shelters GaragesMechanic Shop
Impacted Guiding Principles
Key Takeaways
Ideal Modernization Characteristic
Facility footprint outweighs Cabinet need resulting in unnecessary costs and hindering inter-agency collaboration (1 of 2)
• There are opportunities to right size the facility footprint and reduce maintenance / capital improvement costs
• Consolidation will also aid in increasing collaboration and potentially lead to mutual efficiencies within the Agencies
Collaboration Customer Service
Communication
Efficiency
Adaptability
Interoperable and right-sized platforms
Observations
Total Facilities Breakdown* Community Breakdown
There is an excess of maintenance and storage facilities that can be shared across the Agencies
Total Urban Facilities31
Total Suburban Facilities12
Total Rural Facilities515
50+ Years Old Facilities163
ODOT Facilities Footprint (sq. ft)1.29M
OTA Facilities Footprint (sq. ft)173K
Community Ranges:Urban – 100K+ populationSuburban – 50K-100K populationRural – Less than 50K+ population
*Excluded: Maintenance Division Headquarters, tolling, and other utility facilities
• ODOT’s facility footprint currently consists of 86 Maintenance Yards, 25 Construction Residencies, 8 Field District HQ and 1 Central Office
• OTA’s facility footprint currently consists of 23 maintenance facilities on 11 turnpikes• Approximately 32% of ODOT’s current facilities have been in commission for more than 50 years and 8%
have been in commission for more than 60 years. We currently do not have data around when OTA facilities were built
• The current maintenance costs for ODOT’s facilities for FY20 are $6.3 M. The maintenance costs for OTA’s facilities in FY20 are $634K annually
• The ODOT budget for capital improvements for FY21 is $14.6M with the projected 5-year forecast to be approximately $58.5M. The OTA budget for capital improvements for FY21 is $3.4M with the projected 5-year forecast to be approximately $5.4M
30
Source: Guidehouse Facilities Data Validation
Innovation
Infrastructure

Impacted Guiding Principles
Key Takeaways
Ideal Modernization Characteristic
Facility footprint outweighs Cabinet need resulting in unnecessary costs and hindering inter-agency collaboration (2 of 2)
• There are opportunities to right size the facility footprint and reduce maintenance / capital improvement costs
• Consolidation will also aid in increasing collaboration and potentially lead to mutual efficiencies within the Agencies
Collaboration Customer Service
Communication
Efficiency
Adaptability
Interoperable and right-sized platforms
Rightsizing Parameters
• There are opportunities to consolidate/sunset maintenance facilities, but they are dependent on 3 critical factors: Maintenance Response Times (< 1 hour), distance to nearest population center (< 75 miles), and Manpower Availability/Utilization rates
• Consolidation needs to factor in the need/availability of increased equipment space as this correlates to more resources potentially being attributed to that yard
• There are opportunities in significantly scaling back the construction residencies (>50%), however they are crucial in rural areas where the consultant availability is limited and/or consultant fees are cost prohibitive
123 209
116
Salt ShedsStorage BuildingsResidency / Maint. Yard Buildings
Facility Opportunities
All Facilities Candidate Facilities
Maintenance Costs
FY20 Maintenance $6.4M FY20
Maintenance $634K
ODOT OTA
Capital Improvement Costs
FY 2021$15M FY 2021$3.4M
ODOT OTA
5-Year Forecast$58M 5-Year Forecast$5.4M
Potential Savings
“Sunset” facilities“Sunset” facilities
ODOT OTA
Cost Savings Cost Savings
Candidates for Consolidation
Candidates for Consolidation
* ODOT Maintenance Yards and Construction Residencies
15%
100%
50%
>50%
>90%*
31
13%
Source: FMD Asset Management Plan 2020.06.01
Innovation
Infrastructure

32
03Cabinet Assessment
02Executive Summary
01Overview
06Appendix: Focus Area Profiles
05Immediate Initiatives
04Focus Area Assessment

Business Functions
33

ODOT OTA OAC
FTE/Personnel Costs* Consultant – Cost** FTE/Personnel Costs* Consultant – Cost** FTE/Personnel
Costs* Consultant – Cost**
Portfolio Planning & Project Management 163 / $20,403,381 $5,201,173 4 / Hidden $730,380 4 / Hidden $425,000
Design & Preconstruction 286 / $31,401,742 $60,577,210 2 / Hidden $2,438,897 N/A N/A
Project Letting and Consultant Contracts 23 / $2,771,264 $40,000 5 / $538,402 $- N/A N/A
Construction 537 / $52,349,219 $19,622,381 3 / Hidden $53,451,896 2 / Hidden $-
Maintenance 1246 / $100,623,648 $5,211,565 202 / $12,944,231 $2,419,708 N/A N/A
TSMO 72 / $7,451,649 $1,075,759 4 / Hidden $450,000 N/A N/A
Customer Service 9 / $711,432 $- 105 / $6,054,763 $1,245,024 N/A N/A
34
FY 2019 Delivery Volume and Performance Highlights
• Construction Projects: 254 / $896M
• Work Plan Projects Entering Design: 60
• District/County Maint. Spend: $131M
• Avg Design Time: 2080 days
• Projects Let On-Time: 73.0%
• Construction Under-Budget: 54%
ODOT
• Construction Projects: 57 / $134M
• Projects Entering Design: 12
• Maintenance Spend: $19.3M
• Average Design Time: 202 days
• Projects Let On-Time: 72.7%
• Construction Under-Budget: 35%
OTA
• Construction Projects: 21 / $5.1M
• Projects Programmed: 7/$2.3M
• Airport Inspections: 44
OAC
Dedicated Personnel and Budget
Overview: Business Functions
34* FTE, Classification, and Personnel Costs – Sourced from Agency provided Personnel files as of July 2020 ** Consultant Costs – FY19 consultant costs
35
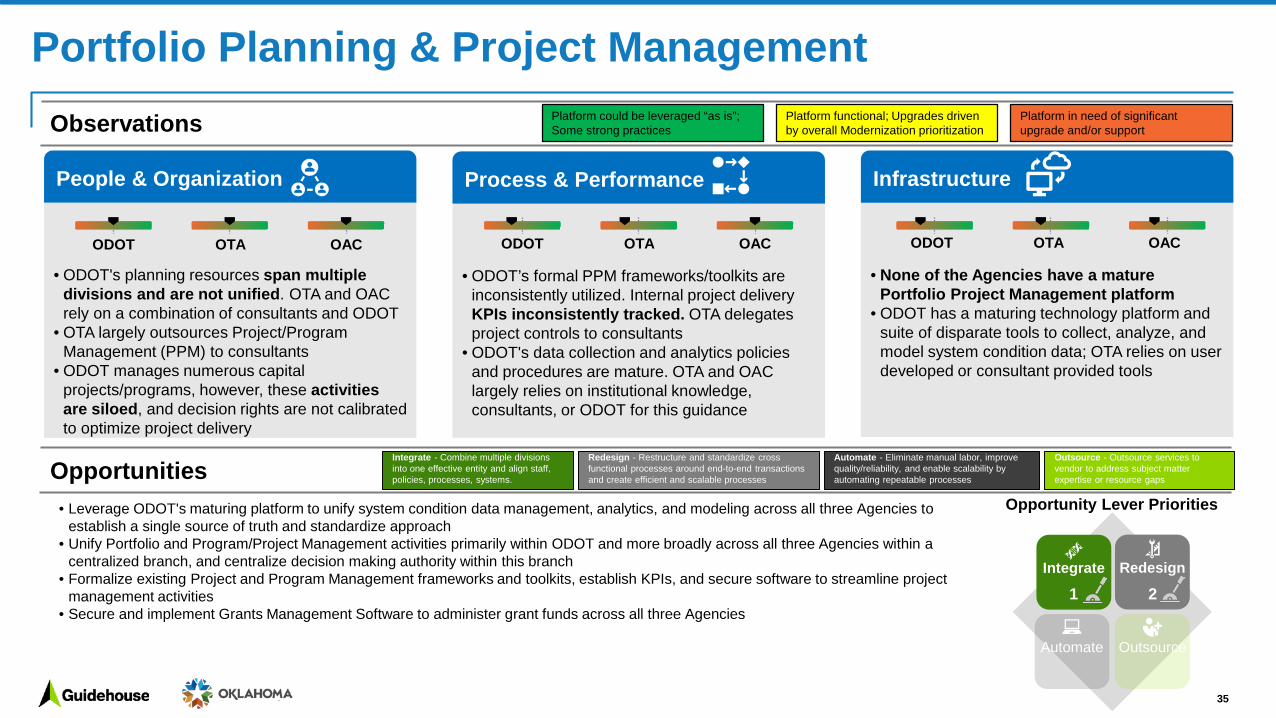
Portfolio Planning & Project Management
• ODOT's planning resources span multiple divisions and are not unified. OTA and OAC rely on a combination of consultants and ODOT
• OTA largely outsources Project/Program Management (PPM) to consultants
• ODOT manages numerous capital projects/programs, however, these activities are siloed, and decision rights are not calibrated to optimize project delivery
People & Organization
ODOT OTA OAC
• ODOT’s formal PPM frameworks/toolkits are inconsistently utilized. Internal project delivery KPIs inconsistently tracked. OTA delegates project controls to consultants
• ODOT's data collection and analytics policies and procedures are mature. OTA and OAC largely relies on institutional knowledge, consultants, or ODOT for this guidance
Process & Performance
ODOT OTA OAC
• None of the Agencies have a mature Portfolio Project Management platform
• ODOT has a maturing technology platform and suite of disparate tools to collect, analyze, and model system condition data; OTA relies on user developed or consultant provided tools
Infrastructure
ODOT OTA OAC
Observations
Opportunities
Integrate Redesign
Automate Outsource
1 2
• Leverage ODOT's maturing platform to unify system condition data management, analytics, and modeling across all three Agencies to establish a single source of truth and standardize approach
• Unify Portfolio and Program/Project Management activities primarily within ODOT and more broadly across all three Agencies within a centralized branch, and centralize decision making authority within this branch
• Formalize existing Project and Program Management frameworks and toolkits, establish KPIs, and secure software to streamline project management activities
• Secure and implement Grants Management Software to administer grant funds across all three Agencies
Opportunity Lever Priorities
Platform could be leveraged “as is”; Some strong practices
Platform functional; Upgrades driven by overall Modernization prioritization
Platform in need of significant upgrade and/or support
Integrate - Combine multiple divisions into one effective entity and align staff, policies, processes, systems.
Automate - Eliminate manual labor, improve quality/reliability, and enable scalability by automating repeatable processes
Outsource - Outsource services to vendor to address subject matter expertise or resource gaps
Redesign - Restructure and standardize cross functional processes around end-to-end transactions and create efficient and scalable processes

36
Design & Pre-Construction
• Although ODOT's pre-construction Divisions individually have strong core competencies, these Divisions are clustered according to specialization and operate in siloes
• OTA does not have the expertise to perform any design work in-house and outsources all design activities
People & Organization
ODOT OTA OAC – N/A
• ODOT and OTA track overall key project milestones but lack interagency KPIs/SLAs and lack accountability when key deadlines are unmet
• ODOT has a foundation of policies/procedural documents that OTA leverages, including design standards
Process & Performance
ODOT OTA OAC – N/A
• While there are systems in place to track design activities at ODOT, they are cumbersome and antiquated, and often are not updated
• Information often remains siloed at ODOT and other Divisions may operate based on inaccurate information
Infrastructure
ODOT OTA OAC – N/A
Observations
Opportunities
Integrate Redesign
Automate Outsource
1 2
• Optimize design work by unifying the Agencies and integrating processes• Centralize project management decision-making authority, which will optimize the delivery performance of design activities and
provide better understanding of resource allocation• Establish SLAs/KPIs between the design and District Divisions to reduce some of the process execution pain points in areas
such as utility relocation, environmental review, and errors & omissions• Establish a more robust feedback mechanism between the design and district divisions • Unify workflow and project management systems to gain a better understanding of resource needs
Opportunity Lever Priorities
Platform could be leveraged “as is”; Some strong practices
Platform functional; Upgrades driven by overall Modernization prioritization
Platform in need of significant upgrade and/or support
Integrate - Combine multiple divisions into one effective entity and align staff, policies, processes, systems.
Automate - Eliminate manual labor, improve quality/reliability, and enable scalability by automating repeatable processes
Outsource - Outsource services to vendor to address subject matter expertise or resource gaps
Redesign - Restructure and standardize cross functional processes around end-to-end transactions and create efficient and scalable processes

37
Project Letting & Consultant Contracts
• ODOT’s procurement of Professional Engineering (PE) services is distributed across the Agency with each Engineering Division determining scope, make/buy decisions, budget, negotiations, and award
• OTA’s consultant contracts are centrally managed where scope, budget, and need are determined
People & Organization
ODOT OTA OAC – N/A
• OTA leverages ODOT's spec book and pre-qualifications list
• OTA does not have formal consultant selection policies/procedures or a robust performance review policy or system, and can adopt ODOT’s
• OAC outsources the modest level of PE service procurement to OMES which charges a high service fee
Process & Performance
ODOT OTA OAC – N/A
• ODOT has a comprehensive letting system, which OTA could utilize as its system has yielded a more manual process, and which OAC could utilize for its sub-recipients
• ODOT and OTA both use different systems for document signing and project letting, but functionally, they are similar
Infrastructure
ODOT OTA OAC – N/A
Observations
Opportunities
Integrate Redesign
Automate Outsource
1 2
• Streamline and centralize within ODOT engineering consultant make/buy decisions, budget, and negotiations, which will provide better cost control measures and reduce administrative resources
• Adopt the same spec book, and integrate project letting and consultant contracting across the Agencies, to optimize internal operations and enable consistency for consultants / contractors
• Utilize ODOT processes to conduct performance reviews and implement a process for resolution of claims against consultants for engineering errors & omissions
• Reduce technology duplication by utilizing the same document signing and project letting technology
Opportunity Lever Priorities
Platform could be leveraged “as is”; Some strong practices
Platform functional; Upgrades driven by overall Modernization prioritization
Platform in need of significant upgrade and/or support
Integrate - Combine multiple divisions into one effective entity and align staff, policies, processes, systems.
Automate - Eliminate manual labor, improve quality/reliability, and enable scalability by automating repeatable processes
Outsource - Outsource services to vendor to address subject matter expertise or resource gaps
Redesign - Restructure and standardize cross functional processes around end-to-end transactions and create efficient and scalable processes

38
Construction
• All Agencies have clear organizational structures to manage Construction Inspection/Materials Testing activities. OTA and OAC largely outsource these functions, which allows more flexibility to shift resources
• All Agencies are under-resourced in Project Setup, Vendor Payment, and Contract Administration
People & Organization
ODOT OTA OAC
• ODOT has a comprehensive policy/procedural framework, but some key gaps exist. OTA and OAC have very limited policy / procedural documentation
• Current KPIs are designed to meet regulations or track project timeliness / budget, rather than capture total performanceor aid with process improvement
Process & Performance
ODOT OTA OAC
• ODOT has “industry-standard” ASW Site Manager to manage workflow, while OTA/OAC rely on spreadsheets or consultants
• Although ODOT requires facilities (residencies, materials labs, etc.) to support activities, current footprint limits resource flexibility / optimization
Infrastructure
ODOT OTA OAC
Observations
Opportunities
Integrate Redesign
Automate Outsource
1 2
• Centralize Construction Focus Area personnel across all three Agencies, and increase personnel dedicated to ASW Site Manager Support
• Consider re-calibrating District organizational structure with possible Facilities integration• Standardize policy and procedure documents across all three Agencies where they exist (and applicable) and close process
documentation gaps (e.g. Materials Manual, Const. PM)• Standardize project management approaches and expand operating effectiveness KPIs to optimize resource utilization,
improve project delivery, and vendor payments• Expand the use of ASW Site Manager across all three Agencies (OTA, if appropriate), to track Construction Activities and
process vendor payments
Opportunity Lever Priorities
Platform could be leveraged “as is”; Some strong practices
Platform functional; Upgrades driven by overall Modernization prioritization
Platform in need of significant upgrade and/or support
Integrate - Combine multiple divisions into one effective entity and align staff, policies, processes, systems.
Automate - Eliminate manual labor, improve quality/reliability, and enable scalability by automating repeatable processes
Outsource - Outsource services to vendor to address subject matter expertise or resource gaps
Redesign - Restructure and standardize cross functional processes around end-to-end transactions and create efficient and scalable processes

39
Maintenance
• Both Agencies have a lot of turnover and issues with resource retention, especially at the junior staff level
• Maintenance training is targeted towards specialized skills and certification and not tied to career progression
People & Organization
ODOT OTA OAC – N/A
• Neither Agency has an MQA platform todefine Level of Service (LOS) targets, prioritize maintenance projects, and develop budgets
• Neither Agency has internal procedural documents or mature project management to guide maintenance work
Process & Performance
ODOT OTA OAC – N/A
• ODOT has a more mature Maintenance Management Systems (MMS). However, data quality issues diminish the utility of the tool
• Although ODOT/OTA require facilities to support activities, current footprint artificially limits resource flexibility / optimization
Infrastructure
ODOT OTA OAC – N/A
Observations
Opportunities
Integrate Redesign
Automate Outsource
2 1
• Continue and expand ODOT's efforts to build a Maintenance Quality Assurance (MQA) platform to set Level of Service targets, manage project identification, and set budgets
• Integrate IT Infrastructure, specifically Maintenance and Equipment Management Systems• Consider re-calibrating District organizational with possible Facilities integration• Invest in creating process documentation (e.g. maintenance manuals) and expand project management approaches across
ODOT and OTA• Consider expanding Equipment Leasing across ODOT to manage the any budget shortfall
Opportunity Lever Priorities
Platform could be leveraged “as is”; Some strong practices
Platform functional; Upgrades driven by overall Modernization prioritization
Platform in need of significant upgrade and/or support
Integrate - Combine multiple divisions into one effective entity and align staff, policies, processes, systems.
Automate - Eliminate manual labor, improve quality/reliability, and enable scalability by automating repeatable processes
Outsource - Outsource services to vendor to address subject matter expertise or resource gaps
Redesign - Restructure and standardize cross functional processes around end-to-end transactions and create efficient and scalable processes

40
TSMO
• Parts of TSMO are spread across each Agency and there's no central TSMO strategy
• Duplication of work may occur, with conflicting results because divisions are not communicating frequently
People & Organization
ODOT OTA OAC
• TSMO concepts and principles are in their infancy
• Dedicated funding for TSMO activities across all Agencies is generally lacking
Process & Performance
ODOT OTA OAC
• The Agencies lack a centralized and accessible data and storage system needed to easily access real-time data
• OTA has the infrastructure and real-time data that can be leveraged for TSMO purposes,but it is not being used in this way
Infrastructure
ODOT OTA OAC
Observations
Opportunities
Integrate Redesign
Automate Outsource
1 2
• Centralize parts of TSMO into one Division within ODOT and develop clear roles and KPIs/SLAs between other relevant divisions (maintenance, design, SAPM, etc.) to ensure proper communications
• Establish a TSMO strategy and integration across each Agency • Unify technology systems to enable real-time data access
Opportunity Lever Priorities
Platform could be leveraged “as is”; Some strong practices
Platform functional; Upgrades driven by overall Modernization prioritization
Platform in need of significant upgrade and/or support
Integrate - Combine multiple divisions into one effective entity and align staff, policies, processes, systems.
Automate - Eliminate manual labor, improve quality/reliability, and enable scalability by automating repeatable processes
Outsource - Outsource services to vendor to address subject matter expertise or resource gaps
Redesign - Restructure and standardize cross functional processes around end-to-end transactions and create efficient and scalable processes

41
Customer Service
• No centralized customer service at ODOTand it is being managed by the MPR Division and District offices
• In addition to typical customer service duties, OTA’s Customer Service Division is performing back-office tolling activities
People & Organization
ODOT OTA OAC
• ODOT does not have a strategy, processes, or KPIs
• OTA has established KPIs and processes around their PIKEPASS customer service
Process & Performance
ODOT OTA OAC
• OTA makes it convenient for customers to make payment transactions over the phone or in person, which can also be completed online
Infrastructure
ODOT OTA OAC
Observations
Opportunities
Integrate Redesign
Automate Outsource
1 2
• Leverage OTA's Customer Service division resources to provide both general customer service to all external ODOT/OTA customers and PikePass specific requests
• Enable more customer self-service and automation for PikePass transactions, which would provide additional staff resources devoted to more general customer service for both ODOT and OTA
• Establish policies/procedures, SLAs and KPIs between the Central Offices and District Offices to track and manage customer inquiries to resolution
• Utilize more third-party entities for PikePass tag distribution / centralize staff into fewer facilities
Opportunity Lever Priorities
Platform could be leveraged “as is”; Some strong practices
Platform functional; Upgrades driven by overall Modernization prioritization
Platform in need of significant upgrade and/or support
Integrate - Combine multiple divisions into one effective entity and align staff, policies, processes, systems.
Automate - Eliminate manual labor, improve quality/reliability, and enable scalability by automating repeatable processes
Outsource - Outsource services to vendor to address subject matter expertise or resource gaps
Redesign - Restructure and standardize cross functional processes around end-to-end transactions and create efficient and scalable processes

Operating Platform
42

ODOT OTA OAC
FTE/Personnel Costs* Consultant – Cost** FTE/Personnel Costs* Consultant – Cost** FTE/Personnel
Costs* Consultant – Cost**
Finance 65 / $6,390,245 $66,648 19 / $1,871,479 $2,360,000 2 / Hidden $-
HR 38 / $4,447,853 $184,717 10 / $960,455 $- 0.3 / Hidden $-
IT 14 / $1,312,973 $7,019,818 59 / $6,237,745 $- N/A N/A
Procurement 30.5 / $2,495,187 $4,682 1 / Hidden $- 0.6 / Hidden $-
Media/Public Relations/Communications 25 / $2,294,369 $60,962 1.5 / Hidden $100,000 0.5 / Hidden $-
Audit 11 / $1,255,748 $306,139 7 / $547,895 N/A N/A N/A
Facilities and Land Management 85.3/ $8,435,124 $10,266,845 7.8 / $619,001 $2,416,923 N/A N/A
43
Delivery Volume and Performance Highlights
• Annual PO volume: $1.6B
• Average monthly # of service requests: 490
• FY19 % of Facilities Constructed On-time:100%
• Billing, requisitions, Journal entry accuracy rate: 92-98%
• Annual PO volume: $51M
• Average monthly # of IT service requests:400
• Maintaining the highest bond rating
• FY19 # and % ROW Acquisitions over offer: 58 / 49% over
• Annual PO volume:$117K
• Average monthly # of IT service requests: 17
• Turnaround time for invoices: 5 days
ODOT OTA OAC
Dedicated Personnel and Budget
Overview: Operating Platform
43* FTE, Classification, and Personnel Costs – Sourced from Agency provided Personnel files as of July 2020 ** Consultant Costs – FY19 consultant costs

44
Finance
• There is risk associated with losing peoplethrough retirement/moves. All Agencies needadditional tribal knowledge capture & ideally cross training
• OTA is severely restricted in staff and relies heavily on firefighting to achieve goals. Some staff at ODOT may be underutilized and need additional employee development
People & Organization
ODOT OTA OAC
• ODOT has robust individual KPIs and procedures for most financial processes. OTA/OAC KPIs not formally tracked
• Agencies have processes for the rigorous reporting required and opportunity to automate
• There are areas that could be eligible for centralization (given statutes / unique considerations)
Process & Performance
ODOT OTA OAC
• There is great need for AET support infrastructure at OTA to ensure successful deployment
• ODOT utilizes a double-entry system for finance and OTA has multiple in-house systems for budget and financials. OAC uses single system for all financials
Infrastructure
ODOT OTA OAC
Observations
Opportunities
Integrate Redesign
Automate Outsource
1 2
• Centralize targeted aspects of the duplicative functions like payroll, reporting, budget, & asset tracking, across all three organizations. ODOT can potentially manage payroll function for OTA and OAC as well
• Formalize a customer-oriented mindset for budget, working with each division to understand goals & needs• Solidify strategy to maintain or sunset legacy ODOT mainframe. Knowledge of maintenance is dwindling due to retirements.• Create/modify PMPs and metrics across Agencies to create measurable metrics that can be evaluated at a functional level• Due to movement to workday for HR, investigate possibility to use workday financial modules to standardize financial functions
across Agencies• Can leverage automation and process mapping to connect front end budget with back-end accounts payable within ODOT and
OTA
Opportunity Lever Priorities
Platform could be leveraged “as is”; Some strong practices
Platform functional; Upgrades driven by overall Modernization prioritization
Platform in need of significant upgrade and/or support
Integrate - Combine multiple divisions into one effective entity and align staff, policies, processes, systems.
Automate - Eliminate manual labor, improve quality/reliability, and enable scalability by automating repeatable processes
Outsource - Outsource services to vendor to address subject matter expertise or resource gaps
Redesign - Restructure and standardize cross functional processes around end-to-end transactions and create efficient and scalable processes
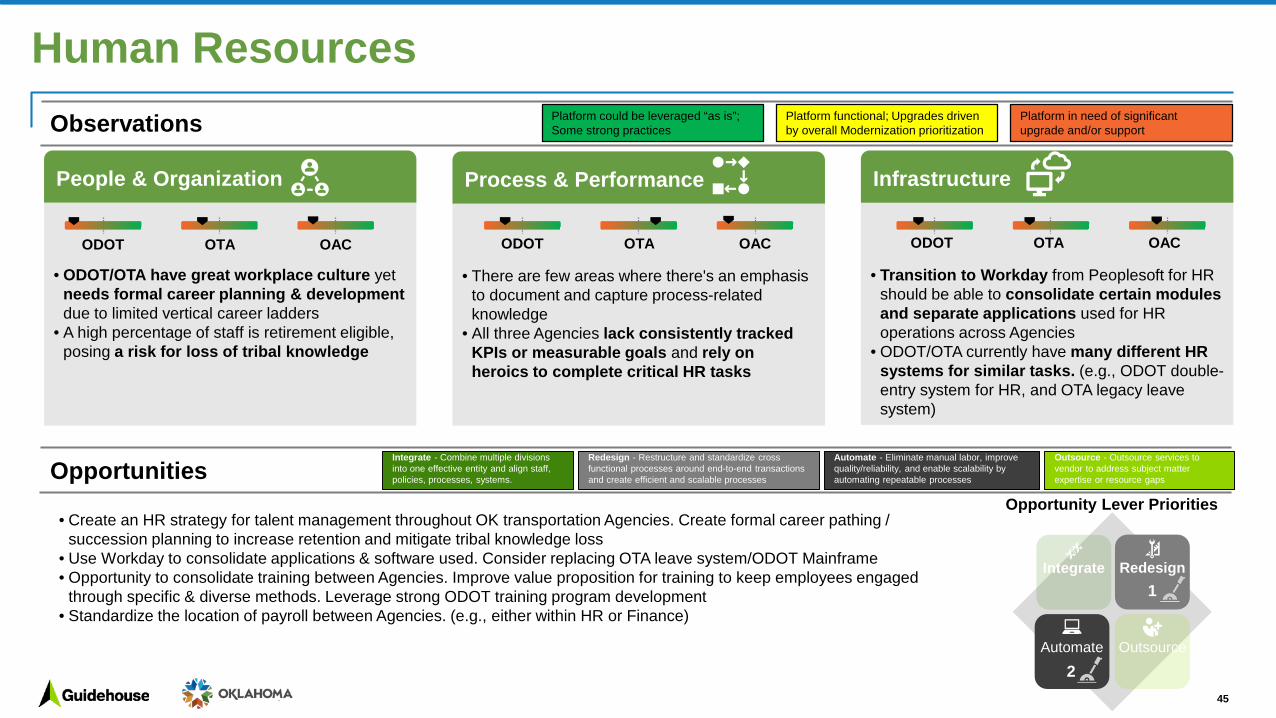
45
Human Resources
• ODOT/OTA have great workplace culture yet needs formal career planning & development due to limited vertical career ladders
• A high percentage of staff is retirement eligible, posing a risk for loss of tribal knowledge
People & Organization
ODOT OTA OAC
• There are few areas where there's an emphasis to document and capture process-related knowledge
• All three Agencies lack consistently tracked KPIs or measurable goals and rely on heroics to complete critical HR tasks
Process & Performance
ODOT OTA OAC
• Transition to Workday from Peoplesoft for HR should be able to consolidate certain modules and separate applications used for HR operations across Agencies
• ODOT/OTA currently have many different HR systems for similar tasks. (e.g., ODOT double-entry system for HR, and OTA legacy leave system)
Infrastructure
ODOT OTA OAC
Observations
Opportunities
Integrate Redesign
Automate Outsource
1
2
• Create an HR strategy for talent management throughout OK transportation Agencies. Create formal career pathing / succession planning to increase retention and mitigate tribal knowledge loss
• Use Workday to consolidate applications & software used. Consider replacing OTA leave system/ODOT Mainframe• Opportunity to consolidate training between Agencies. Improve value proposition for training to keep employees engaged
through specific & diverse methods. Leverage strong ODOT training program development • Standardize the location of payroll between Agencies. (e.g., either within HR or Finance)
Opportunity Lever Priorities
Platform could be leveraged “as is”; Some strong practices
Platform functional; Upgrades driven by overall Modernization prioritization
Platform in need of significant upgrade and/or support
Integrate - Combine multiple divisions into one effective entity and align staff, policies, processes, systems.
Automate - Eliminate manual labor, improve quality/reliability, and enable scalability by automating repeatable processes
Outsource - Outsource services to vendor to address subject matter expertise or resource gaps
Redesign - Restructure and standardize cross functional processes around end-to-end transactions and create efficient and scalable processes

46
Information Technology
• OTA IT has a skilled team and solid platformthat is able to identify and address IT challenges at OTA and potentially ODOT & OAC as well
• Interviews revealed that expectations & service delivery of IT needs by OMES through SB. 227 is regularly not meeting ODOT & OAC needs
People & Organization
ODOT OTA OAC
• ODOT/OTA are just beginning to build out dashboards to track KPIs & SLAs; operational metrics are still being defined.
• There are no SLAs between Agencies/ OMES that are regularly reviewed to measure service quality
• OTA needs additional enterprise-level strategy surrounding project prioritization
Process & Performance
ODOT OTA OAC
• OTA has many custom-built applications for internal OTA uses, and has potential capability to assist ODOT/OAC with technology needs
• ODOT/OTA use same consultant (BIS) for content mgmt., ODOT's Grooper initiative has not been successful; OTA's has been effective
• All Agencies can be reactive at times, OTA moving to model with agile framework
Infrastructure
ODOT OTA OAC
Observations
Opportunities
• Define an overall IT strategy with governance structure (umbrella) for all three Agencies. Utilize OTA IT capabilities to automate ODOT/OAC manual processes. Consider more OMES/OTA IT partnerships to provide services for ODOT/OAC.
• Develop customer/supplier relationship both internal and external through SLA co-creation (include KPI development, escalation of issues, and process improvement)
• Create an interagency IT catalogue to better understand all IT contracts, application, software, hardware, etc. This will help document what needs to be maintained and sunset. Identify silos and standardize IT platforms leveraging Process mapping.
• Content management - need to create document retention policies outlining what should/shouldn't be documented, and timing.• Cloud solutions for data storage and cloud migration for some applications. Proper security measures needed to protect data.
Opportunity Lever Priorities
Integrate Redesign
Automate Outsource
1 2
Platform could be leveraged “as is”; Some strong practices
Platform functional; Upgrades driven by overall Modernization prioritization
Platform in need of significant upgrade and/or support
Integrate - Combine multiple divisions into one effective entity and align staff, policies, processes, systems.
Automate - Eliminate manual labor, improve quality/reliability, and enable scalability by automating repeatable processes
Outsource - Outsource services to vendor to address subject matter expertise or resource gaps
Redesign - Restructure and standardize cross functional processes around end-to-end transactions and create efficient and scalable processes

47
Procurement
• ODOT is well staffed and has dedicated teams for contracts & acquisitions and POs; OTA and OAC have very few people and contract/acquisition is not centralized in the "procurement" role
People & Organization
ODOT OTA OAC
• Agencies share contracts through informal means, but there is no centralized repository to store and view all contracts available for use & comparison
• ODOT/OTA have manual but structured processes
Process & Performance
ODOT OTA OAC
• ODOT engineering-side sourcing is effective, but the goods & services team needs new/better infrastructure
• Agencies use different technology / applications for document signatures
Infrastructure
ODOT OTA OAC
Observations
Opportunities
• Centralize all contracts to a repository that can be accessed across Agencies. This will allow for easier contract comparisons. This is to help standardization and ability for price comparison
• Use procurement workflow tool (e.g., ePro) for all procurement (both central office & in the field) to streamline and automate procurement activities
• Standardize to one doc signing/viewing software (Adobe Formfill, SignNow, Docusign, etc.)• Utilize OMES to improve procurement infrastructure (ODOT) specifically on the goods/services side. Since ODOT uses OMES
for their IT infrastructure, OMES would be able to support
Opportunity Lever Priorities
Integrate Redesign
Automate Outsource
1 2
Platform could be leveraged “as is”; Some strong practices
Platform functional; Upgrades driven by overall Modernization prioritization
Platform in need of significant upgrade and/or support
Integrate - Combine multiple divisions into one effective entity and align staff, policies, processes, systems.
Automate - Eliminate manual labor, improve quality/reliability, and enable scalability by automating repeatable processes
Outsource - Outsource services to vendor to address subject matter expertise or resource gaps
Redesign - Restructure and standardize cross functional processes around end-to-end transactions and create efficient and scalable processes

48
Media, Comm, & PR
• Informal resource-sharing between Agencies already exists (e.g., ODOT/OAC use OTA for marketing) to fill functional gaps
• OTA and OAC have limited FTE to manage all media, PR, Comms responsibilities
• ODOT’s Divisions that manage customer relationships are disconnected
• All Agencies struggle with talent retention
People & Organization
ODOT OTA OAC
• Variability (at each Agency) of customer relationships, segmentation of those customers, and the current & future tools necessary to communicate with the different segments
• At the Cabinet level there is a lack of strategy & approach as it relates to marketing/comm
Process & Performance
ODOT OTA OAC
• All Agencies us different technology & tools,but there is no standard tool between the three Agencies that can be used. There's an opportunity to rationalize those tools
Infrastructure
ODOT OTA OAC
Observations
Opportunities
• Recommend bringing Communications, Media, & PR out from all three Agencies and combine into one large Marketing/Communication arm that reports to the Transportation Secretary
• Review/do a deep dive into content creation in Office Service Division to determine what work they're doing for who• Create a governance structure for content creation through Marketing/Communications, as well as prioritization of work for Office
Services Division• Standardize & rationalize contracts for social media/public engagement metrics (e.g., Hootsuite, MeltWater, etc.)
Opportunity Lever Priorities
Integrate Redesign
Automate Outsource
1 2
Platform could be leveraged “as is”; Some strong practices
Platform functional; Upgrades driven by overall Modernization prioritization
Platform in need of significant upgrade and/or support
Integrate - Combine multiple divisions into one effective entity and align staff, policies, processes, systems.
Automate - Eliminate manual labor, improve quality/reliability, and enable scalability by automating repeatable processes
Outsource - Outsource services to vendor to address subject matter expertise or resource gaps
Redesign - Restructure and standardize cross functional processes around end-to-end transactions and create efficient and scalable processes

49
Audit
• All agencies face significant retirements riskand upcoming vacancies
• OTA Audit does not have formal succession planning and is a smaller division in comparison to ODOT.
• OAC does not have an internal audit functionand could benefit from the other Agencies internal audit’s capabilities
People & Organization
ODOT OTA OAC
• ODOT has a unique "External audit" function that serves more of quality assurance
• ODOT/OTA would benefit from protocol to follow up on audit findings, as well as process documentation to retain institutional knowledge
Process & Performance
ODOT OTA OAC
• ODOT is currently beginning to use the same auditing software (Engagement) as the state OTA uses mostly Excel and both Agencies use the software in the Division they're auditing
Infrastructure
ODOT OTA OAC
Observations
Opportunities
• Define an audit group that aligns to the modernization strategies (e.g., centralizations; if HR is combined for all three groups, they can audit all three Agencies together)
• Prioritize highest risk areas to operations/business functions across enterprise and audit accordingly. (e.g., ODOT/OTA should formalize process to determine which areas to audit)
• ODOT/OTA should invest in career and succession planning so that tribal knowledge is documented and retained in new staff• ODOT/OTA can consider sharing audit software licenses and report generating applications within their two Agencies, and
potentially OAC as well
Opportunity Lever Priorities
Integrate Redesign
Automate Outsource
1 2
Platform could be leveraged “as is”; Some strong practices
Platform functional; Upgrades driven by overall Modernization prioritization
Platform in need of significant upgrade and/or support
Integrate - Combine multiple divisions into one effective entity and align staff, policies, processes, systems.
Automate - Eliminate manual labor, improve quality/reliability, and enable scalability by automating repeatable processes
Outsource - Outsource services to vendor to address subject matter expertise or resource gaps
Redesign - Restructure and standardize cross functional processes around end-to-end transactions and create efficient and scalable processes

50
Facilities & Land Management
• ODOT and OTA's Facilities construction, maintenance, and ROW resources span multiple Divisions/Districts and are not unified
• OTA's ROW sub-function is under-resourced
People & Organization
ODOT OTA OAC – N/A
• Neither agency has standardized approaches or KPIs related to facilities maintenance
• ODOT and OTA do not have a unified Facilities and Land Management strategy yielding a facility footprint that outweighs the need
• ODOT has comprehensive ROW acquisition policies, procedures, and performance metrics;
Process & Performance
ODOT OTA OAC – N/A
• ODOT has “industry standard” facilities construction project management and maintenance software applications. OTA currently utilizes Microsoft Suite
• ODOT has a facility rebuild plan that spans to 2048 and will result in some structures surpassing 100 years in age
Infrastructure
ODOT OTA OAC – N/A
Observations
Opportunities
• Unify ROW acquisition/disposal across ODOT, and combine platform across ODOT/OTA• Unify ongoing facilities construction/maintenance planning and execution across Agencies to ensure that facility footprint meets
field staff needs while optimizing resources/ expenditures • Establish standardized approaches, SLAs, and KPIs for Facilities Maintenance across Agencies; Establish dotted line reporting
structures between Field and Central Office Personnel • Leverage ODOT's IT platform to support facilities maintenance construction
Opportunity Lever Priorities
Integrate Redesign
Automate Outsource
1 2
Platform could be leveraged “as is”; Some strong practices
Platform functional; Upgrades driven by overall Modernization prioritization
Platform in need of significant upgrade and/or support
Integrate - Combine multiple divisions into one effective entity and align staff, policies, processes, systems.
Automate - Eliminate manual labor, improve quality/reliability, and enable scalability by automating repeatable processes
Outsource - Outsource services to vendor to address subject matter expertise or resource gaps
Redesign - Restructure and standardize cross functional processes around end-to-end transactions and create efficient and scalable processes

51
03Cabinet Assessment
02Executive Summary
01Overview
06Appendix: Focus Area Profiles
05Immediate Initiatives
04Focus Area Assessment

Immediate Initiatives Summary
Integrate OMPT within Rail Division
Current State: The Office of Mobility and Public Transit (OMPT) is currently without Division Leadership
Recommendation: Move the Office of Mobility and Public Transit (OMPT) under the Director of Capital Programs, and potentially integrate with the Rail Division
Benefit: Integrates similar functions and allows for resource pooling, and lays the groundwork to establish a robust multi-modal transportation plan
Integrate Media/PR/Communications
Current State: Communication with the public / external stakeholders is of strategic importance, however, critical strategic and functional gaps exist
Recommendation: Create a “Strategic Communications” division that unifies relevant staff from ODOT and OTA
Benefit: Lays groundwork to establish a robust/unified enterprise marketing, Media/PR, and communications strategy; Integrates similar functions, and allows for resource pooling to enable better performance
1 2
Three initiatives were identified from the current state observations to address critical gaps for which the organization should consider taking immediate action to mitigate any near-term risks
52
Strengthen Tolling Back Office Support (BOS)
Current State: OTA’s current BOS structure does not align to leading practices and places the AET rollout on the Kilpatrick at risk
Recommendation: Re-structure OTA Customer Service, Tolling Operations, and Finance divisions to strengthen the back-office operations ahead of the AET pilot
Benefit: Allows for the financial, IT, and data systems sophistication and process standardization required for more efficient and scalable electronic transaction processing
3

• Integrates similar functions and allows for resource pooling• Lays the groundwork to establish a robust multi-modal
transportation plan
Move the Office of Mobility and Public Transit (OMPT) under the Director of Capital Programs, and potentially integrate with the Rail Division
Relevant Guiding Principles
Innovation
Communication
Customer Service
Efficiency
Adaptability
Collaboration
Ideal Modernization Characteristic
Immediate Initiative 1: Integrate OMPT with Rail Division
Appropriate Functions
Centralized
Efficient Staffing
Current State
Office of Mobility and Public Transit (OMPT) is, due to retirement, currently
without permanent Division leadership
Recommendation Benefits
Next Steps
Lay administrative groundwork Communicate organizational shift to OMPT staff
Map out and execute integration plan
Coordinate with HR, Finance, and Law department to execute on administrative activities to allow for staff movement
Meet with OMPT staff to announce the change ahead of broader communication of current state findings
Identify new organization and reporting structure, performance framework, and transition plan; and begin implementation
OMPT primarily serves two key functions:• Mobility and Public Transit strategic planning, grants administration,
claims processing, technical assistance and audits• 6 Funds (5311, 5339a, 5339b, 5303, 5304, and revolving state);
$28M+ in grants; ~72+ sub-recipients• Administer the State’s Safety and Security Oversight program (OKC
Streetcar; 4.8 miles; 7 Street Cars, and 22 Stations)
Currently the Divisions under the Director of Capital Programs are primarily
responsible for managing programs and projects across
ODOT
1 2 3
53

• Integrates similar functions and allows for resource pooling to enable better performance
• Lays the groundwork to establish a robust and unified enterprise marketing, MPR, and communications strategy
Creation of a “Strategic Communications” Division responsible for Marketing, Comms & PR, and government relations, that integrates:
• ODOT: MPR, Interagency Liaison, Admin of Legislative Affairs, Tribal Liaison, and Waterways; Governance of OSD (Content Development)
• OTA: Communications
Relevant Guiding Principles
Innovation
Communication
Customer Service
Efficiency
Adaptability
Collaboration
Ideal Modernization Characteristic
Immediate Initiative 2: Integrate Media/PR/Comms (MPR)
Appropriate Functions
Centralized
Efficient Staffing
Current State
Recommendation Benefits
Next Steps
Lay administrative groundwork Communicate organizational shift to impacted staff
Map out and execute integration plan
• Appoint new Division Lead
• Coordinate with HR, Finance, IT, and Law department to execute on administrative activities
Meet with impacted staff at all 3 Agencies to announce the change ahead of broader communication of current state findings
New Division lead to identify new organization/reporting structure, performance framework, transition plan; and begin implementation
• Communication with the public / external stakeholders is of strategic importance
• Lack of cohesive strategy and variability in philosophy/approach related to customer relationships and segmentation, brand awareness, communications vehicles and tools
At the agency level, critical functional gaps/organizational misalignments currently exist, and inter-agency collaboration is informal and tactical:• ODOT: Marketing is a gap; Content development housed in OSD; MPR
Division, Inter-agency liaison, Tribal Liaison, and Waterways disconnected• OTA: Only has 2 FTE to manage MPR and marketing; content development
contracted to a PR Firm; Call center helps manage customer inquiries• OAC: Only has 1 FTE to manage MPR and marketing and relies heavily
ODOT and OTA to support all functions
Marketing/Comms Performance metrics
are largely absentand IT infrastructure is
in its infancy
1 2 3
54

• Enables greater investment in front-end customer service to enhance OTA customer experience
• Allows for the financial, IT, and data systems sophistication and process standardization required for more efficient and scalable electronic transaction processing
• Brings OTA in line with leading practices
Re-structure OTA Customer Service, Tolling Operations, and Controller divisions to strengthen the back-office operations; and allow Customer Service and Controller divisions autonomy to re-calibrate (e.g. Launch new initiatives, re-tool and manage training programs, etc..) for success ahead of the AET rollout on the Kilpatrick Turnpike
Relevant Guiding Principles
Innovation
Communication
Customer Service
Efficiency
Adaptability
Collaboration
Ideal Modernization Characteristic
Immediate Initiative 3: Restructure Tolling “Back Office”
Clear strategy to operations
alignment
Peer Examples
Recommendation Benefits
Next Steps
Craft new Org. structure Communicate organizational shift to impacted staff
Map out and execute integration plan
Create a new, leading practice informed, organizational structure that allows OTA to be well positioned for AET rollout, and identify any new Division leads
Meet with impacted staff to announce the change ahead of broader communication of current state findings
New Division leads to create transition plan, performance metrics, training plan, and begin implementation
• The 1st All Electronic Tolling (AET) rollout, a key strategic priority that is dependent on robust BOS, is scheduled to launch in June 2021
• OTA has not established a singular division that can manage the full complement of BOS functions but rather splits them between three divisions Customer Service, Tolling, and Controller
• As a result, unified and scalable end to end BOS operations nor a single point of accountability exists, and OTA leadership/staff time is drawn away from their core competencies: front end customer service, OTA level finance, and manual tolling operations
A review of tolling operations at three DOTs (VDOT, FDOT, and KYTC) reveals a clear division of duties between Customer Service, Back Office Support (BOS), and Finance:• Customer Service: Front-end services such as Call center, Store front, Transponders,
account management• BOS: Payment processing; reporting/reconciliation; dispute resolution; and back-end
account, interoperability, and transponder management• Finance: Traditional enterprise financial functions such as budget, enterprise
reporting/reconciliation, revenue analysis/recognition etc.
Current State1 2
55

56
03Cabinet Assessment
02Executive Summary
01Overview
06Appendix: Focus Area Profiles
05Immediate Initiatives
04Focus Area Assessment

Focus Area Summary User Guide - OverviewTo allow for a standardized approach to consider all three Agencies (ODOT, OTA, and OAC), each Focus Area is broken into Sub-Functions with associated descriptions/key responsibilities. In addition, the Division(s) responsible for those Sub-Functions are identified where possible, otherwise a Sub-Function gap is identified
• Sub-Functions Breakdowno Breaks down the Focus Area by the associated Sub-Functions
• Key Responsibilitieso Listing of the key responsibilities within each Sub-Function that potentially span
across all the Agencies
• Division and Brancheso Aligns the appropriate Division (and where necessary, Branch), for each Agency,
with the applicable Sub-Function
Sub-Function Breakdown and Key Responsibilities1
Sub-Function Gaps2• Sub-Function Gaps
o Potential areas where functionality may be lacking for a specific Agency when compared to others within the same Sub-Function
2
1
57

Focus Area Summary User Guide – Agency Profile (1 of 2)For each Agency, the first page of the Focus Area Summary provides a targeted view of the dedicated FTE, Personnel costs, and consultant costs; a depiction of the volume of work handled; and existing measures of performance
• FTE Breakdowno Summary of all full-time employees that have contribute to that Sub-Function o Sources: Agency Personnel file July 2020 and Agency provided Organizational
Charts• Personnel Budget
o Total salaries (as of June 2020) for resources that fall within the specific Sub-Function
o Sources: Agency Personnel file as of July 2020 • Consultant Budget
o FY19 consultant costs associated with the corresponding that Sub-Function o Sources: Targeted data/document requests from Executive Leaders and/or Division
Directors
Budget Breakdown1
Volume2• Volume of Work
o Summary view of work volume, potentially spanning different Divisions, that pertain to the respective Focus Area for FY19
o Sources: Sources: Targeted data/document requests from Executive Leaders and/or Division Directors
Performance3• Key Performance Indicators (KPIs)
o Summary of various FY19 KPIs, potentially spanning different Divisions, that represent the performance of Agency in this particular Focus Area
o Sources: Interviews and targeted data/document requests from Executive Leaders and/or Division Directors
1
2
3
58

Focus Area Summary User Guide – Agency Profile (2 of 2)For each Agency, the second page of the Focus Area Summary highlights critical software applications, policies and procedures, and pain points
• Key IT Applicationso List of the top IT applications sorted by FY19 spend, potentially spanning different
divisions, across the entire Focus Area. Note: Annual cost represents the Annual Cost for the software application, not just the portion specific to the Focus Area
o Sources: Interviews and Agency provided software costs file• Total Number of IT Applications and Total Annualized Cost
o Sum of the total number of applications and associated FY19 Annualized Cost, potentially spanning different divisions, across the entirety of the Focus Area
o Sources: Interviews and Agency provided software costs file• Percent Tailored/User Developed
o A percent calculation of the IT applications that are not Off-the-Shelf and have been tailored or developed from scratch to fit within the organization
o Sources: Interviews and Agency provided software costs file
Information Technology Capabilities1
Policies and Procedure Documents2• Key Policy and Procedure Documents
o Snapshot of critical policy and procedure documents for the Focus Area and categorization of all received files (Policy, Procedure, or Dashboard/Report
o Sources: Agency provided documents and data per Guidehouse Data/Document requests
Pain Points3• Pain Points
o Summary of the various pain points, potentially spanning different Divisions, sorted by: People, Process, or Infrastructure
o Sources: Interviews
1
32
59

Focus Area Summary User Guide – Inter-Agency Comparison (1 of 2)The first page of the Inter-Agency Comparison provides a quantitative view of each Agency in the identified Focus Area. It offers comparisons of the Agencies’ personnel, budgets, IT applications, and volume / performance metrics
• FTE and Budgeto Breakdown of total FTE, Classification Percentage, Personnel, and Consultant costs
by Agency in order to allow comparison across all 3 Agencies (where applicable) o Sources: Agency Personnel file July 2020, Agency provided Organizational Charts,
Agency provided FY19 consultant costs
Dedicated Personnel and Associated Costs 1
Key Common IT Applications2• Key Functions and Associated Applications
o Breakdown of key IT applications by Function, Focus Area and Agency to better identify and analyze opportunities and gaps
o Sources: Interviews and Agency provided software costs file
Volume and Performance3• Volume
o Summary view of work volume by Agency in order to provide context for the each Agency’s dedicated personnel and associated costs
o Sources: Interviews and targeted data/document requests from Executive Leaders and/or Division Directors
• KPIso Summary of various FY19 KPIs that represent the performance of each Agency in
this particular Focus Area to identify and analyze gaps and opportunitieso Sources: Interviews and targeted data/document requests from Executive Leaders
and/or Division Directors
1
32
60

Focus Area Summary User Guide – Inter-Agency Comparison (2 of 2)The second page (and beyond) of the Inter-Agency Comparison provides a qualitative comparison of all 3 Agencies (Where appropriate) from a People & Organization, Process & Performance, and Infrastructure standpoint. It lays the groundwork for formulating modernization recommendations
• Sub-Functiono A breakdown of the Focus Areas into their respective Sub-Functions with the
associated key responsibilities
Sub-Functions1
Maturity Model2• Agency Maturity Assessment
o Provides a qualitative assessment of each Agency’s platform in that Sub-Function across three dimensions: People & Organization, Process & Performance, and Infrastructure. This assessment lays surface areas of strengths and potential gaps and lays the groundwork to identify modernization opportunities
Observations3• Observations
o Articulates observations that support the Agency Maturity Assessment in the 3 identified dimensions: People & Organization, Process & Performance, and Infrastructure
1
3
2
61

Portfolio Planning: Focus Area Overview
62
Sub-Functions Key Responsibilities ODOT Divisions OTA Divisions OAC Divisions
System Condition Data Collection and Management
• Collection of critical transportation data• Maintenance of systems and data warehouses • Data and quality management
SAPM (GIS, Inventory, Pvmt, Traffic)Bridge (Maintenance, Geo Info Sys)Maintenance (ITS - Fiber and Ops)Rail (OK Rail Program)
Engineering MaintenanceIT (Fiber & Telecommunications)
Airports Division(Aviation Program Managers)
Data analytics, modeling, and reporting
• Model and forecast system conditions• Portfolio Planning decision-enabling reporting• Federal and State Performance reporting• Federally required research project investment and
execution
SAPM (Pavement, Planning, Traffic)Bridge (Maintenance, Geo Info Sys) MaintenanceOffice of Research and ImplementationTraffic EngineeringRail (130 Program/HSIP Fund)
MaintenanceFinance Airports Division
Portfolio Planning • Capital programs planning – State and Local levels • Multi-modal transportation planning
SAPM (Planning)Project ManagementLocal GovernmentDistrict OfficeOMPT
Engineering MaintenanceFinance
Airport Division
Program/Project Management
• Project/Program Management of Capital projects and multi-modal projects
• Grants Management
Project Management Local GovernmentRailOMPTROW/Utilities (Project Management) Environmental (Project Development)
Engineering Airports Division
Sub-Functions and Agency Breakdown
Sub-Functions Footnotes
ODOT OTA• Multi-modal Transportation
Planning• Grants Management
OAC • Multi-modal Transportation Planning

Portfolio Planning: ODOT Profile (1 of 2)
63
Dedicated Personnel and Budget
Sub-Function Divisions FTE /% Class*
Personnel Cost*
Consultant Cost**
System Condition Data Collection and Management
SAPMBridgeMaintenanceRail
46.53 /100% $5,133,361 Not Available
Data analytics, modeling, and reporting
SAPMBridgeMaintenanceOffice of ResearchRail
32.34 /98% $3,947,038 $2,672,697
Portfolio Planning
SAPM – PlanningProject ManagementLocal GovernmentDistrict OfficeOMPT
29.47 /79% $4,062,667 $2,528,477
Program/Project Management
Project Management Local Government RailOMPTROW/UtilitiesEnvironmentalMaintenance
47.33 /79% $6,293,924 Not Available
Administrative All 7.34 /100% $966,391 N/A
Vacancies All 0 N/A N/A
Total 163 $ 20,403,381 $ 5,201,173
Volume of Work
Measure Value8-year Work Plan Projects Let in FY19 251 / $ 788 M
CIRB Projects Let in FY19 69 / $112.5 M
Number of Bridges Inspected – FY19 11,971
Number of Miles of Pavement Inspected – FY19 14,345 miles
Number of Manual Traffic Count Measurements – FY19 10,866
Transit Program Grant Volume (5311, 5339a/b, Revolving) – FY19 72 recipients / $28 M
KPI Definition Measure
CWP Design Plans Completed On-Time
Percent of Engineering Plans completed per the Project Baseline Schedule between 2017-2020
33%
Percent of Original CWP Delivered
Percentage of the 251 projects in FY2019 which were delivered 64%
Percentage of Projected Budget Utilized
Percent of the utilization rate of the projects budgeted funds 109%
30-60-90 Milestones 30-60-90 Milestones Reached On-Time 41%/38%/35%
Average Design Time Avg number of design days from Initial Preliminary Meeting to Final Plans 2080 Days
Performance
* FTE, Classification, and Personnel Costs – Sourced from Agency provided Personnel files as of July 2020 ** Consultant Costs – FY19 consultant costs

People
ProcessInfrastructure
Portfolio Planning: ODOT Profile (2 of 2)
64
Policies and Procedures Documents
Pain Points
People
• The role of the Project Management Division is not clearly understood, nor does it have the authority to drive project management related decisions
• Insufficient staff to handle the current Project Management workload• Professional development occurs through on the job training and informal
mentorship rather than a formalized training program
Process
• Plan Reviews are not being checked at all currently even though a great number are being utilized; The quality and content is lacking
• Lack of visibility into design timeframes once a project is handed over to a functional division
• Lack of SLAs in place and poor communication has resulted in extreme resistance within the District Level Residence Engineers as it relates to Utility Relocation
• Local Government plan design review is focused on “readiness for project letting” rather than engineering accuracy potentially leading to greater change orders
Infrastructure
• Lack of a robust project management software tool to oversee CIRB and 8 Year Work Plan projects
• Data systems that span Project Planning to Design through end of Construction are very siloed and the data cannot be visualized, presented, or relayed
• Each Division uses own independent database and considerable time is wasted transferring information between these disparate independent systems
Policy55%
Procedure12%
Report33%Key Policies and Procedures
• ODOT PMD Project Management Development Process
• CIRB Project Management Process Flow
• 8-year Construction Work Plan
• 5 Year CIRB
• TPD Internal Policies & Procedures 2020
• Division Notebooks
IT Capabilities
Key Applications Function Annual Cost*
Decision Lens Data Management and Analytics – Project Prioritization $805 K
Bentley Open Roads Core Function - Civil Design software $750 K
ESRI Stack Data Management and Analytics – Geospatial $385 K
What-ifs Database Data Management and Analytics – Project Prioritization $ -
Number of Applications30 36% % Tailored/User-
Developed $4MTotal Annualized Cost
Critical Pain Point*IT cost signified as “$ -” when the cost is an Agency-wide tool, and (where available) cost included in IT Focus Area

Portfolio Planning: OTA Profile (1 of 2)
65
Dedicated Personnel and Budget
Sub-Function Divisions FTE /% Class*
Personnel Cost*
Consultant Cost**
System Condition Data Collection and Management
Engineering Maintenance
ITIndeterminate
$375,000Data analytics, modeling, and reporting
MaintenanceFinance Indeterminate
Portfolio PlanningEngineering Maintenance
Finance
1 / 50% Hidden $132,380
Program/Project Management Engineering 1.32 /
50% Hidden $223,000
Administrative All 1.83 /73% Hidden N/A
Vacancies All 0 N/A N/A
Total 4.15 Hidden $ 730,380
Volume of Work
Measure ValueNumber of Miles of Pavement Inspected – FY19 850 miles
Number of Bridges Inspected (NBIS rating) – FY19 411
Number of Bridges Inspected (Walk Around) – FY19 388
Number of Projects Entering Design – FY19 8 / $12 M
Number of Projects with Finalized Design and ready for Project Letting - FY19 15 / $177 M
KPI Definition MeasurePercent of Projects Let FY19
Percent of projects that are let in their respective program year 64.3%
Average Design Time Average number of design days from Notice to Proceed to Final Plans 202 Days
Performance
* FTE, Classification, and Personnel Costs – Sourced from Agency provided Personnel files as of July 2020 ** Consultant Costs – FY19 consultant costs

People
ProcessInfrastructure
Portfolio Planning: OTA Profile (2 of 2)
66
Policies and Procedures Documents
Pain Points
People • Not enough resources to document/track key data
Process • Unsure on whether shift towards more outsourcing will be beneficial when some projects could be done in-house
Infrastructure • Data Sharing between divisions is severely lacking• Lack of true technology platform makes it difficult to find document/status updates
Policy25%
Procedure0%
Report75%
Key Policies and Procedures• 5 Year Capital Plan Program
• Project Status Report Spreadsheet
• 2019 Annual Report – Summary
• Engineering Project Status Report
• Annual Olsson Reports
IT Capabilities
Key Applications Function Annual Cost*Bentley MicroStation Core Function - Civil Design software $2 K
Bid Express Bidding software $ -
F Drive Data Management, Analytics, and Reporting $ -
Quickbase Documenting site inspection data $ -
Number of Applications5 40% % Tailored/User-
Developed $2KTotal Annualized Cost
Critical Pain Point
*IT cost signified as “$ -” when the cost is an Agency-wide tool, and (where available) cost included in IT Focus Area

Portfolio Planning: OAC Profile (1 of 2)
67
Dedicated Personnel and Budget
Sub-Function Divisions FTE /% Class*
Personnel Cost*
Consultant Cost**
System Condition Data Collection and Management
Airports Division 1.33 /0% Hidden N/A
Data analytics, modeling, and reporting
Airports Division 0.68 /0% Hidden N/A
Portfolio Planning Airport Division 0.66 /0% Hidden $425 K
Program/Project Management Airports Division 0 N/A N/A
Administrative All 1 Hidden N/A
Vacancies All 0 N/A N/A
Total 3.67 Hidden $ 425 K
Volume of Work
Measure ValueNumber of Airport Projects Programmed - FY19 21 / $30 M
Payments/Grant Distributions Processed - FY19 131 / $5 M
KPI Definition MeasureAirport Inspections Airport Inspections Conducted - FY19 44
Performance
* FTE, Classification, and Personnel Costs – Sourced from Agency provided Personnel files as of July 2020 ** Consultant Costs – FY19 consultant costs

People
ProcessInfrastructure
Portfolio Planning: OAC Profile (2 of 2)
68
Policies and Procedures Documents
Pain Points
People • N/A
Process
• Since OK is considered a “Channeling” State OAC is constrained to disbursing funds at the individual airport/project level, thus limiting the ability of OAC to optimize funds per statewide airport needs
• Required to use OMES procurement platform to secure key professional engineering services that involve a service fee ranging from 3% to 7%
• Not able to utilize ODOT procurement system for project letting and preconstruction services
• Airport system condition modeling is based on historical institutional knowledge and/or FAA guidance (e.g. average lifespan milestones)
Infrastructure • Lack of software application to help with project prioritization or manage
grants/grant applications - Currently everything is managed through user developed MS suite applications (e.g. Excel, Word, etc...)
Policy19%
Procedure31%
Report50%
IT Capabilities
Key Applications Function Annual Cost*
ESRI Geospatial data management, analysis and reporting $5 K
AutoCAD Civil Design software $2 K
Paver Pavement Condition data management $800
MS Suite Bundle of productivity software $ -
Number of Applications5 20 % Tailored/User-
Developed $8KTotal Annualized Cost
Critical Pain Point
Key Policies and Procedures• FAA Order 5090 Airport Construction Plan Policy
• Oklahoma Airport System Plan
• Final FAA Master NPIAS Needs
• Approved Airports Construction Plan FY2021
• OAC Capital Projects Tracker/Worksheet
• Airport Inspection Packet
*IT cost signified as “$ -” when the cost is an Agency-wide tool, and (where available) cost included in IT Focus Area

Portfolio Planning: Inter-Agency Comparison (1 of 3)
69
FTE Classified Personnel –Costs*
Consultant – Cost**
ODOT 163 90% $20 M $5 M
OTA 4.2 58% Hidden $730 K
OAC 3.7 0% Hidden $425 K
Total 170.9 87% $20.8 M $6 M
Dedicated Personnel and Budget Volume and Performance
Agency Volume Performance
ODOT
• FY19 # 8YWP Projects Let – 251 / $788 M• FY19 # CIRB Projects - 110 / $121M• FY19 # of Bridges Inspected - 11,971• FY19 # of Miles of Pavement Inspected -
14,345 miles• FY19 # Manual Traffic Count - 10,866• FY19 / Value Transit Program Grant
Volume - 72 recipients / $27.8 M
• FY19 % CWP Design Plan Completed On-Time - 33%
• FY19 % of Original CWP Delivered – 64%
• FY19 % Percentage of Projected Budget Utilized - 109%
• FY19 % 30-60-90 Milestones - 41%/38%/35%
OTA
• FY19 # Miles of Pavement Inspected - 850 miles
• FY19 # Bridges Inspected (NBIS rating) -411
• FY19 # Bridges Inspected (Walk Around) -388
• FY19 # Projects Entering Design -8 / $12.8 M
• FY19 # Projects with Finalized Design and ready for Project Letting – 15 / $177 M
• FY19 % of Projects Let –64.3%
• FY19 Avg Length for Design -7-10 months
OAC• FY19 # / Value of Airport Projects
Programmed - 21 / $30.1 M• FY19 # / Value Payments/Grant
Distributions Processed - 131 / $5.2 M
• FY19 # Airport Inspections Conducted - 44
IT Spend
ODOT$4.1M
$1.8K OTA
$7.8K OAC
Key Common IT Applications
Function ODOT OTA OAC
Project Management JPinfo Quickbase MS Suite
Workflow Management
ProjectWiseMylonet N/A MS Suite
Data Management
ESRIDecision Lens F Drive ESRI
Paver
Core Function MicroStation MicroStation AutoCAD
* FTE, Classification, and Personnel Costs – Sourced from Agency provided Personnel files as of July 2020 ** Consultant Costs – FY19 consultant costs

Sub-Function
Agency Maturity Assessment
ObservationsPeople & Organization
Process & Performance
Infrastructure
System Condition Data Collection and Management
• Collection of critical transportation data
• Maintenance of systems and data warehouses
• Data and quality management
• People - ODOT has significant resources dedicated to data collection and management, however these resources are not unified across the Agency. Both OTA and OAC use a combination of in-house staff and consultants to collect and warehouse system condition data
• Process - Federal requirements inform system condition measurement policies, however, underlying procedural documents for internal staff are minimal across all Agencies. KPIs do not formally exist within this Sub-Function across all 3 Agencies
• Infrastructure – All 3 Agencies have many tools and software applications dedicated to data collection; however these resources are not unified across the Agency
Data analytics, modeling, and reporting
• Model and forecast system conditions
• Portfolio Planning decision-enabling reporting
• Federal and State Performance reporting
• People – ODOT and OTA have dedicated significant resources for data analytics and reporting across different divisions within their respective organizations. Nevertheless, efforts are not unified across the Agency and gaps exist. ODOT also has a dedicated branch to meet federal reporting requirements related to pavement condition, safety, congestion, etc..
• Process - OTA and OACs in-house analytics and modeling capabilities are informal and are based on institutional knowledge of typical asset lifecycles and/or staff experience. With OTA, modeling quality assurance is provided in-part by an independent review (by Olsson), and OAC contracts out pavement modeling. Federal policy guides ODOT federal reporting
• Infrastructure – ODOT has several tools that they utilize (ESRI Stack, ASW BrM, dTIMS) for the organization’s analytics and modeling needs as it relates to the 8 year CWP. Outside of the CWP projects, the platforms are less mature. Both OTA and OAC utilize user-developed tools to manage any required reporting and/or rely on consultant provided tools
Portfolio Planning: Inter-Agency Comparison (2 of 3)
ODOT ODOT
OAC
OTA
OAC
OTA
ODOT
OTA
OAC
Platform could be leveraged “as is”; Some strong practicesKey Platform functional; Upgrades driven by
overall Modernization strategic prioritizationPlatform in need of significant upgrade and/or
support
ODOT ODOT
OAC
OTA
OAC
OTA
ODOT
OTA
OAC
70

Sub-Function
Agency Maturity Assessment
ObservationsPeople & Organization
Process & Performance
Infrastructure
Portfolio Planning• Capital programs planning
– State and Local levels • Multi-modal transportation
planning
• People – ODOT has a dedicated branch to provide the analytics and data to facilitate the creation of the 8 Year Work Plan. However, numerous plans are created, and actual portfolio planning is distributed across multiple Divisions. OTA and OAC are centralized within one resource
• Process – Federal and state regulations guide policy for 8 Year Work Plan, CIRB and others however, there are limited internal procedures to govern the underlying process. This issue is similar with OTA and OAC. In all three cases it is not clear that the portfolio of projects will yield long term system condition goals. ODOT has demonstrated that it can structure its portfolio to meet strategic system condition goals (e.g. Pavement; Bridge etc..)
• Infrastructure – ODOT utilizes Decision Lens to help with portfolio planning however it does not appear to be integrated with maintenance, pavement, or bridge forecasting systems. OTA and OAC use Microsoft Suite applications for their portfolio planning needs
Program/Project Management• Project/Program
Management of Capital projects and multi-modal projects
• Grants Management
• People – ODOT manages numerous projects and programs (e.g. Design / Pre-construction, Local Government, Rail, Public Transit, District Offices etc...). However, these activities are siloed, and decision rights are not calibrated to optimize project delivery. OTA largely outsources project management and controls to consultants, whereas OAC serves more in an oversight capacity and does not have PM obligations
• Process - ODOT has formal project management frameworks and toolkits, but it is not clear that OTA has the same. Internal KPIs are inconsistently tracked at ODOT because while some may have formal tracking the majority do not formally track performance measures. OTA delegates project control to consultants, however it is not clear whether KPIs are being internally tracked
• Infrastructure – None of the Agencies have a mature project management IT tools; ODOT largely relies on a JPinfo system which presents many challenges; OTA outsources project/program management to their design and construction inspection consultants
Portfolio Planning: Inter-Agency Comparison (3 of 3)
ODOT ODOT
OAC
OTA
OAC
OTA
ODOT
OTA
OAC
ODOT ODOT
OAC
OTA
OAC
OTA
ODOT
OTA
OAC
Platform could be leveraged “as is”; Some strong practicesKey Platform functional; Upgrades driven by
overall Modernization strategic prioritizationPlatform in need of significant upgrade and/or
support
71

72
Sub-Functions Key Responsibilities ODOT Divisions OTA Divisions OAC Divisions
Surveys• Perform surveying to establish land boundaries• Produce aerial LiDAR scans to create 3D views• Collect survey data
SurveyEngineering (Consultants)
N/A
Geometrics & Structural Design
• Provide structural and geometric analysis and design• Apply limited traffic engineering elements • Perform value engineering studies
RoadwayBridge
Engineering (Consultants)
N/A
Environmental Review/ Compliance
• Create NEPA documents/Secure environmental permits • Identify, asses, manage and mitigate environmental risk• Complete environmental studies and reviews
EnvironmentalEngineering (Consultants)
N/A
Utility Relocation• Provide Utility Owners with Plan of Relocation designs• “Manage” Utility Owners throughout the relocation design
and construction• Issue, monitor, and process work orders and claims
Right of Way(Utilities) Districts
Engineering (Consultants)
N/A
Quality Assurance and Control (QA/QC)
• Review all design plans • Develop design policies, standards and manuals
Roadway; Survey; Traffic; Rail; Local Government (Consultants)
Engineering(Consultants) N/A
Sub-Functions and Agency Breakdown
Sub-Function Footnotes
ODOT OTA OAC Airports complete their own design work
Design & Pre-Construction: Focus Area Overview

73
Dedicated Personnel and Budget
Sub-Function Divisions FTE /% Class*
Personnel Cost*
Consultant Cost**
Surveys Survey 59 /100% $5,963,055 $2,882,287
Geometrics & Structural Design
RoadwayBridge
143.5 /99% $15,688,969 $52,603,120
Environmental Review/ Compliance Environmental 10 /
100% $1,185,000 $4,166,027
Utility RelocationRight of Way &
Utilities; Districts
17.33 / 100% $1,940,288 $762,595
Quality Assurance and Control (QA/QC)
Roadway; Survey; Traffic; Rail; Local
Government (Consultants)
17.16 /100% $2,069,329 $163,181
Leadership and Administrative All 27.5 /
100% $3,679,991 N/A
At Large Vacancies All 12 / 100% $875,109 N/A
Total 286.5 $31,401,742 $60,577,210
Volume of Work
Measure ValueNumber of CIRB Projects with Finalized Design and ready for Project Letting - FY19 69/$112.5M
Number of 8-year Construction Work Plan (CWP) Projects Entering Design - FY19 60
Number of CWP Projects Entering Design done by in-house resources - FY19 15 (25%)
Number of CWP Projects with Finalized Design - FY19 64
Number of CWP Projects Ready for Letting - FY19 50
KPI Definition Measure
Design Plans Completed On-Time
Percent of CWP Engineering Plans completed On-Time between 2017-20 33%
Utilities Removed On-Time
Percent of Utilities Removed On-Time between 2017-20 47%
NEPA Approval On-Time
Percent of projects receiving NEPA Approval On-Time between 2017-20 29%
Average Design Time Avg number of design days from Initial Preliminary Meeting to Final Plans 2080 days
Performance
Design & Pre-Construction: ODOT Profile (1 of 2)
* FTE, Classification, and Personnel Costs – Sourced from Agency provided Personnel files as of July 2020 ** Consultant Costs – FY19 consultant costs

74
Policies and Procedures Documents
Pain Points
People• Not enough resources within key areas, which also face hiring challenges• Difficulty identifying and utilizing the expertise of other divisions • Silos within and between divisions sometimes resulting in project delays• Communication between field districts and central office divisions is a challenge
Process
• QA/QC on outsourced projects is not performed consistently
• Project Management is siloed from the pre-construction and design divisions• Traffic design is included late in the design process• Conservative posture towards environmental risk management leads to additional
process delays• Lack of consistency in tracking KPIs across divisions• No accountability in meeting project baseline deadlines and milestones• Project Management is siloed from the pre-construction and design divisions
Infrastructure • Projects outside of the 8-year Construction Work Plan are not always tracked within
the Oracle database• Project data and management IT systems are antiquated, and maintenance is a
challenge
Policy37%
Procedure41%
Report22%Key Policies and Procedures
• ODOT Roadway Design Manual
• ODOT Geotechnical Specifications for Roadway Design
• Project Development Process
• ODOT Bridge Plan Directives
• Utilities Procedures Index
• Errors and Omissions Guidelines
IT Capabilities
Number of Applications26
Key Applications Function Annual Cost*RTK Network & Terrasolid Survey Core Function Delivery $1.7M
Bentley CADD MicroStation /In Roads/Open Roads Design Core Function Delivery $749K
AASHTOWare Bridge & Pavement ME Data Management, Analytics, and Reporting $254K
Bentley ProjectWise Document Management $228K
15% $4.8MTotal Annualized Cost
People
ProcessInfrastructure% Tailored/User-Developed
Design & Pre-Construction: ODOT Profile (2 of 2)
Critical Pain Point
*IT cost signified as “$ -” when the cost is an Agency-wide tool, and (where available) cost included in IT Focus Area*IT cost signified as “$ -” when the cost is an Agency-wide tool, and (where available) cost included in IT Focus Area

75
Dedicated Personnel and Budget
Sub-Function Divisions FTE /% Class*
Personnel Cost*
Consultant Cost**
SurveysEngineering
(Consultants)0 N/A $119,981
Geometrics & Structural Design
Engineering (Consultants)
0 N/A
$2,186,536Environmental Review/ Compliance
Engineering (Consultants)
0 N/A
Utility RelocationEngineering
(Consultants)0 N/A
Quality Assurance and Control (QA/QC)
Engineering(Consultants)
1.5 /22% Hidden $132,380
Administrative Engineering 1 /100% Hidden $ -
Vacancies at Large All 0 N/A $ -
Total 2 Hidden $2,438,897
Volume of Work
Measure ValueNumber of Projects Entering Design - FY19 12
Number of Projects Entering and Finalizing Design - FY19 6
Number of Projects with Finalized Design and ready for Project Letting - FY19 28
KPI Definition Measure
Design Plans Completed On-Time
Percent of Engineering Plans completed per the Project Baseline Schedule
Not Available
Design Plans Completed On-Budget
Percent of Engineering Plans completed within budget Not Available
Average Design Time Average number of design days from Notice to Proceed to Final Plans 202 Days
Performance
Design & Pre-Construction: OTA Profile (1 of 2)
* FTE, Classification, and Personnel Costs – Sourced from Agency provided Personnel files as of July 2020 ** Consultant Costs – FY19 consultant costs

People
ProcessInfrastructure
76
Policies and Procedures Documents
Pain Points
People• Staff expertise is more specific to design oversight and QA/QC than with the
technical aspects of conducting project design work • Utility relocations could be handled better by a dedicated employee instead of a
consultant; however, staff lacks specialized expertise in certain areas like utilities
Process • No formal policies or process documents that guides OTA’s approach to Design and Pre-Construction or oversight of consultants
Infrastructure • Each division uses their own tracking tools, so sharing data across divisions is a
challenge and the data is siloed• Lack of a GIS based system to visualize old plans, ROW documents and others
design documents
Policy17%
Procedure0%
Report83%
Key Policies and Procedures• 2010 OTA Standard Specifications
• Project Status Report
IT Capabilities
Number of Applications2
Key Applications Function Annual Cost*
GIS Geospatial data management, analysis and reporting $13K
AutoCAD Design Core Function Delivery $1.8K
0% $14.9KTotal Annualized Cost
% Tailored/User-Developed
Design & Pre-Construction: OTA Profile (2 of 2)
Critical Pain Point
*IT cost signified as “$ -” when the cost is an Agency-wide tool, and (where available) cost included in IT Focus Area

Design & Pre-Construction: Inter-Agency Comparison (1 of 4)
77
FTE Classified Personnel –Costs*
Consultant –Cost**
ODOT 286.5 100% $31.4M $60.6M
OTA 2 42% Hidden $2.4M
OAC 0 N/A N/A N/A
Total 288.5 99% $31.6M $63.0M
Dedicated Personnel and Budget Volume and Performance
Agency Volume Performance
ODOT
• CIRB Projects with Finalized Design and ready for Project Letting: 69/$112.5M
• 8-year Work Plan Projects Entering Design: 60
• 8-year Work Plan with Finalized Design: 64
• 8-year Work Plan Ready for Letting: 50
• Design Plans Completed On-Time: 33%
• Utilities Removed On-Time: 47%• NEPA Approval On-Time: 29%• Average Design Time: 2080 days
OTA
• Projects Entering Design: 12• Projects Entering and Finalizing
Design: 6• Projects with Finalized Design
and ready for Project Letting: 28
• Design Plans Completed On-Time: Not Available
• Design Plans Completed On-Budget: Not Available
• Average Design Time: 202 days
OAC N/A N/A
IT Spend
ODOT$4.8M
$14.9K OTA
N/A OAC
Key Common IT Applications
* FTE, Classification, and Personnel Costs – Sourced from Agency provided Personnel files as of July 2020 ** Consultant Costs – FY19 consultant costs
Function ODOT OTA OAC
CAD/Design Program
Bentley MicroStation AutoCAD N/A
Surveys RTK Network & Terrasolid N/A N/A
Design Document
Sharing
Bentley ProjectWise N/A N/A
Mapping ArcGIS ArcGIS N/A

78
Sub-Function
Agency Maturity Assessment
ObservationsPeople & Organization
Process & Performance
Infrastructure
Surveys• Perform surveying to establish
land boundaries• Produce aerial LiDAR scans to
create 3D views• Collect survey data
• People – Approximately 25-35% of all survey work is done in-house at ODOT and each of the 11 office area branches manage that work. All survey work is outsourced at OTA. ODOT may have a better grasp on negotiating consultant hours, price and special provisions because of their strong technical expertise
• People – ODOT is at some risk of losing some core competencies as 25% of survey staff are nearing retirement. Additionally, licensed surveyors are not paid the same amount as engineers, but go through similar training and education, which makes it difficult to attract new talent
• Process – ODOT is not tracking all projects done outside of the 8-year work plan, making it difficult to measure the real output and ensure workload balance. OTA lack procedure documents
• Infrastructure – ODOT is using Bentley products, whereas OTA is using AutoCAD
Geometrics & Structural Design• Provide structural and geometric
analysis and design• Apply limited traffic engineering
elements • Perform value engineering
studies
• People – Approximately 40% of geometric and structural design work is done in-house at ODOT; all design work is outsourced at OTA. ODOT has a lot of CAD techs that could be utilized and allocated more efficiently across the divisions to work on various parts of the design plans
• People – ODOT’s Roadway division has a branch devoted for training employees • Process – Traffic design is included late in the design process at ODOT• Process – ODOT is not tracking all projects done outside of the 8-year work plan, making it
difficult to measure the real output and ensure workload balance. OTA lacks procedure documents
• Process – ODOT performs a few (4-5) Value Engineering studies a year that are federally required, however there’s not a process to incorporate VE practices into other projects. OTA does not have a process around VE studies
• Infrastructure – ODOT is using Bentley products, whereas OTA is using AutoCAD
ODOT ODOT
OTA OTA
ODOT
OTA
ODOT ODOT
OTA OTA
ODOT
OTA
Note: OAC does not conduct Pre-Construction & Design work. That resides within each individual Airport
Note: OAC does not conduct Pre-Construction & Design work. That resides within each individual Airport
Design & Pre-Construction: Inter-Agency Comparison (2 of 4)
Platform could be leveraged “as is”; Some strong practicesKey Platform functional; Upgrades driven by
overall Modernization strategic prioritizationPlatform in need of significant upgrade and/or
support

79
Sub-Function
Agency Maturity Assessment
ObservationsPeople & Organization
Process & Performance
Infrastructure
Environmental Review/ Compliance• Create NEPA documents/Secure
environmental permits • Identify, asses, manage and
mitigate environmental risk• Complete environmental studies
and reviews
• People – While ODOT’s Environmental Division includes staff members with the necessary technical subject matter expertise, OTA’s Engineering Division, by design, does not
• People – Communication and collaboration with the Districts is a challenge, as the pressures of project delivery leads to a perception that Environmental requirements are a burden. This sometimes result in compliance issues and higher costs
• Process – Environmental review involves a lot of subjectivity and ODOT applies a standard approach (regardless of project type), rather than a risk-based and tailored approach to project reviews. Most of OTA projects do not receive federal funds so they don’t need to meet the same federal environmental requirements as does ODOT
• Infrastructure – ODOT environmental consultants do not have access to ProjectWise. Environmental Division has yet to set up reports from the Oracle database system, as there are some reporting glitches
Utility Relocation• Provide Utility Owners with Plan
of Relocation designs• “Manage” Utility Owners
throughout the relocation design and construction
• Issue, monitor, and process work orders and claims
• People – About 90% of the work is done in-house at ODOT, however the Utilities division appears understaffed. OTA outsources management of utility relocations, but the volume is lower compared to ODOT. Regardless, both Agencies report that consultants may not always have the proper expertise to manage the work
• Process – There appears to be a critical breakdown in process and role assignments at ODOT: Utility Relocation work should be managed at the District level once a NTP is issued to the contractor, however, this rarely happens
• Process – ODOT’s Utilities branch has comprehensive policies and procedures to govern and guide the work, and clear KPIs to measure performance. OTA does not have either
• Infrastructure – ODOT’s utilities database is outdated, and storage/maintenance of the system has become an issue
ODOT ODOT
OTA OTA
ODOT
OTA
ODOT ODOT
OTA OTA
ODOT
OTA
Note: OAC does not conduct Pre-Construction & Design work. That resides within each individual Airport
Note: OAC does not conduct Pre-Construction & Design work. That resides within each individual Airport
Design & Pre-Construction: Inter-Agency Comparison (3 of 4)
Platform could be leveraged “as is”; Some strong practicesKey Platform functional; Upgrades driven by
overall Modernization strategic prioritizationPlatform in need of significant upgrade and/or
support

80
Sub-Function
Agency Maturity Assessment
ObservationsPeople & Organization
Process & Performance
Infrastructure
Quality Assurance and Control (QA/QC)• Review all design plans • Develop design policies,
standards and manuals
• People – QA/QC is distributed across several divisions at ODOT, including Roadway, Local Government, Rail, and the level of resources, nor the SME, meet the workload demand
• Process – A standard QA/QC across all projects does not seem to exist. Inconsistent QA/QC occurs throughout the various divisions at ODOT: QA/QC mainly occurs on the projects done in-house and not projects that are outsourced. At OTA, QA/QC is contracted out on the Driving Forward program but done in-house on the Capital Plan projects
• Process – At ODOT, QA/QC is just designed to catch errors and the overall quality or impact of design is not considered
• Process – ODOT has technical design guidelines/manuals, but they are out of date, some going back to 1992. No set design policy exists across the different districts at ODOT. OTA does not seem to have design manuals and is utilizing ODOT’s
• Process – Neither ODOT nor OTA appear to have policies or procedures to conduct QA/QC on project plans
• Infrastructure – ODOT is not tracking all projects done outside of the 8-year work plan and project management IT systems are antiquated, making QA/QC more difficult to manage within the current infrastructure
ODOT ODOT
OTA OTA
ODOT
OTA
Note: OAC does not conduct Pre-Construction & Design work. That resides within each individual Airport
Design & Pre-Construction: Inter-Agency Comparison (4 of 4)
Platform could be leveraged “as is”; Some strong practicesKey Platform functional; Upgrades driven by
overall Modernization strategic prioritizationPlatform in need of significant upgrade and/or
support

81
Sub-Functions Key Responsibilities ODOT Divisions OTA Divisions OAC Divisions
Professional Engineering Contract Management
• Consultant Solicitation, review, scoring, short-listing, and final selection• Contract development & fee hour negotiation • Contract Administration, including task order changes, invoices,
supplementals, and consultant evaluations
Procurement Engineering N/A
Construction Project Letting
• Set bid opening schedule and project letting dates• Review PS&E and engineering estimates• Advertise projects, evaluate contactor bids, and check project quantities and
unit avg prices• Provide contract award recommendation and execute contracts
Office EngineerConstruction Engineering N/A
Prequalification & Performance Review
• Process Contractor’s Prequalification Application• Review Contractor's Audited Financial Statement • Manage contractor renewal process• Maintain prequalification list and performance review data
Office Engineer EngineeringConstruction N/A
Spec Book • Maintain and update the spec book• Maintain a running log of all the spec changes
Office EngineerMaterials Engineering N/A
Sub-Functions and Agency Breakdown
ODOT
Sub-Functions Footnotes
OTAOTA relies on ODOT’s
prequalification list and does not conduct Performance Reviews
OAC OAC does not execute any Sub-Functions in this Focus Area
Project Letting & Consultant Contracts: Focus Area Overview

82
Dedicated Personnel and Budget
Sub-Function Divisions FTE /% Class*
Personnel Cost*
Consultant Cost**
Professional Engineering Contract Management
Procurement 7 /100% $859,744 $ -
Construction Project Letting
Office EngineerConstruction
11.5 / 100% $1,255,507 $ -
Prequalification & Performance Review Office Engineer 1 /
100% Hidden $ -
Spec Book Office EngineerMaterials
2 /100% Hidden $40,000
Administrative ProcurementOffice Engineer
1.5 /100% Hidden N/A
Total 23 $2,771,264 $40,000
Volume of Work
Measure Value# of Engineering contracts vendors and projects in 2019 117/762
Value of Engineering contracts in 2019 $78,196,917
# of Construction Contract Awards in 2019 275
Value of Construction Contracts Awarded in 2019 $885,044,697
Number of CIRB Projects with Finalized Design and ready for Project Letting in 2019 69/$112.5M
# of Pre-Qualifications processed in 2019 157 (29 New/128 Renewals)
# of Contractor Performance Reviews conducted in 2019 291 (6% Negative Reviews)
KPI Definition Measure
Engineer’s Estimate vs Awarded
The percentage of construction contracts awarded that are within 10% of engineering estimates
49.8%
Construction Contract Growth
The percentage growth in construction project costs -0.78%
Projects Let On-TimePercentage of CWP projects let within the intended program year between 2018-2019
73.0%
Performance
Project Letting & Consultant Contracts: ODOT Profile (1 of 2)
* FTE, Classification, and Personnel Costs – Sourced from Agency provided Personnel files as of July 2020 ** Consultant Costs – FY19 consultant costs

83
Policies and Procedures Documents
Pain Points
People• Insufficient staff to provide IT support on project letting activities: Only one person
knows the Project Letting Application systems, and as a result the institutional knowledge is at risk
Process
• Each of the engineering design divisions independently engage with the consultant on scope of work and level of effort for each project, that potentially leads to unnecessary time investment and more importantly lack of control on Total Design/Pre-Construction Costs
• Lack of transparency related to professional engineering consultant selection• Not consistently tracking key KPIs, including resolution of contractor inquiries on
time and number of days to pre-qualify a contractor
Infrastructure
• Insufficient training/change management as it relates to implementation of new IT project letting applications for internal and external users
• AASHTOWare Pre-construction software only allows for internal users and as a result, ODOT staff input consultant deliverables that inform project letting bid packets
• Multiple systems to check the status of engineering projects, which makes reporting an issue
Policy25%
Procedure62%
Report13%Key Policies and Procedures
• Guidelines for the Administration of Consultant Contracts
• 2020 ODOT Standards Specifications
• Spec Year Pay Item List
• Consultant Interview Evaluation
• Oklahoma Administrative Code – Highway Contractors
• Oklahoma Statutes Title 69
IT Capabilities
Number of Applications6
Key Applications Function Annual Cost*AASHTOWare Pre-Construction & Project Bids
Construction Project Letting Management Platform $254K
DocExpress Electronic contracts management $3K
BidX Platform for encrypted Project Bids $0
Transportation Online Professional Services (TOPS)
Engineering Consultant Solicitation and response submission $ -
40% $257KTotal Annualized Cost
People
ProcessInfrastructure
Project Letting & Consultant Contracts: ODOT Profile (2 of 2)
% Tailored/User-Developed
Critical Pain Point
*IT cost signified as “$ -” when the cost is an Agency-wide tool, and (where available) cost included in IT Focus Area

84
Dedicated Personnel and Budget
Sub-Function Divisions FTE /% Class*
Personnel Cost*
Consultant Cost**
Professional Engineering Contract Management
Engineering 2.17 /69% Hidden $ -
Construction Project Letting Engineering 2.77 /
55% Hidden $ -
Prequalification & Performance Review
EngineeringConstruction
0 / 0% $ - $ -
Spec Book Engineering 0 / 0% $ - $ -
Total 4.94 $538,402 $-
Volume of Work
Measure Value# of Consultant contracts in 2019 12
# of Construction Contract Awarded in 2019 16 Contracts / 23 Projects
Value of Construction Contracts Awarded in 2019 $246,677,634
# of Pre-Qualifications processed 0 (Rely on ODOT’s list)
# of Contractor Performance Reviews conducted 0
KPI Definition Measure
Engineer’s Estimate vs Awarded
Percentage of Contract Awards within 10% of Engineer’s Estimate in 2019 42.9%
Construction Contract Growth
The percentage growth in construction project costs in 2019 2.0%
Projects Let On-TimePercentage of projects let within the intended program year between 2018-2019
72.7%
Performance
Project Letting & Consultant Contracts: OTA Profile (1 of 2)
* FTE, Classification, and Personnel Costs – Sourced from Agency provided Personnel files as of July 2020 ** Consultant Costs – FY19 consultant costs

85
Policies and Procedures Documents
Pain Points
People
Process
• No official consultant evaluation process• Don't have formal process documents• Lack of transparency related to professional engineering consultant selection• Not consistently tracking key KPIs, including resolution of contractor inquiries on
time• Not much demand for specific timeline KPIs• No official formal review/evaluation process in place
Infrastructure • Each division uses their own tracking tools, so sharing data across divisions is a challenge and the data is siloed
Policy11%
Procedure28%Report
61%
Key Policies and Procedures• 2010 OTA Standard Specifications
• Final/Progressive Prime/Sub Contractor Performance Evaluation
• Construction Bidding Schedule
• Oklahoma Statutes Title 69
IT Capabilities
Number of Applications6
Key Applications Function Annual Cost*SignNow Used for Electronic Signatures $-
Box Used to send electronic documents between consultants/contractors/staff $-
Bid Express Electronic bidding system $ -
Quickbase/Excel Used to data and tracking purposes $ -
0% $-Total Annualized Cost
People
ProcessInfrastructure
Project Letting & Consultant Contracts: OTA Profile (2 of 2)
% Tailored/User-Developed
Critical Pain Point
*IT cost signified as “$ -” when the cost is an Agency-wide tool, and (where available) cost included in IT Focus Area

Project Letting & Consultant Contracts: Inter-Agency Comparison (1 of 3)
86
FTE Classified Personnel –Costs*
Consultant – Cost**
ODOT 23 100% $2.8M $40K
OTA 4.9 61% $538K $ -
OAC 0 N/A N/A N/A
Total 27.9 94% $3.3M $40K
Dedicated Personnel and Budget Volume and Performance
Agency Volume Performance
ODOT
• FY19 # of Engineering vendors/ projects: 117/762
• FY19 Value of Engineering contracts: $78.2M
• FY19 # / Value of Construction Contract Awards: 275 / $885M
• FY19 # of Pre-Qualifications processed: 157
• FY19 # of Contractor Performance Reviews conducted: 291
• FY19 % of construction contracts awarded that are within 10% of engineering estimates: 49.8%
• FY19 percentage growth in construction project costs:-0.78%
• FY19 Project Let On-Time: 73.0%
OTA
• FY19 # of consultant contracts established: 12
• FY19 # / Value of Construction Contract Awards: 23 / $247M
• FY19 # of Pre-Qualifications processed: 0
• FY19 # of Contractor Performance Reviews conducted: 0
• FY19 % of construction contracts awarded that are within 10% of engineering estimates: 42.9%
• FY19 percentage growth in construction project costs: 2.0%
• FY19 Project Let On-Time: 72.7%
IT Spend
ODOT$257K
$- OTA
N/A OAC
Key Common IT Applications
Function ODOT OTA OAC
Engineering Contract Mgmt. TOPS Quickbase/
Excel N/A
Construction Project Letting
AASHTOWareBidX Bid Express N/A
Electronic Signature Adobe Sign SignNow N/A
* FTE, Classification, and Personnel Costs – Sourced from Agency provided Personnel files as of July 2020 ** Consultant Costs – FY19 consultant costs

87
Sub-Function
Agency Maturity Assessment
ObservationsPeople & Organization
Process & Performance
Infrastructure
Professional Engineering Contract Management• Consultant Solicitation, review,
scoring, short-listing, and final selection
• Contract development & fee hour negotiation
• Contract Administration, including task order changes, invoices, supplementals, and consultant evaluations
• People – ODOT’s procurement of PE services is distributed across the Agency with each Engineering division determining scope, make/buy decisions, budget, negotiations, and award; while the procurement division (8 FTE) manages the process itself. This is often cumbersome and increases solicitation duration. OTA manages procurement through its Engineering division where scope, budget, and need are centrally determined
• Process – OTA does not have formal policies or procedures for consultant selection; ODOT has comprehensive procurement policies and procedures that are rooted in State and Federal regulations. Nevertheless, the current process does not place make/buy and scope decisions with Project Management division where total project budget and scope controls are managed
• Process – Neither Agency consistently tracks KPIs related to procurement (e.g. Average time to procure; consultant contract growth); and transparency related to award decisions are limited
• Infrastructure – ODOT utilizes a custom-built solution (TOPS) to manage procurement workflow. OTA manages it through user-developed spreadsheets
Construction Project Letting• Set bid opening schedule and
project letting dates• Review PS&E and engineering
estimates• Advertise projects, evaluate
contactor bids, and check project quantities and unit avg prices
• Provide contract award recommendation and execute contracts
• People – ODOT’s Office Engineer Division is split into Proposals and Contracts, and the Construction division manages all the technology. There’s often a perception issue that people aren't doing nearly as much work as the other branch because the work ebbs and flows
• Process – ODOT/OTA have different project letting schedules. While both ODOT and OTA have a low-bid policy, they have different ways to evaluate their bids and OTA may have more ability to select contractors that are not the lowest bid. OTA may pay contractors more for speed and is able to complete the projects faster because of this
• Infrastructure – ODOT’s lack of robust unified project management system does not allow Office Engineer to accurately forecast when projects will be ready to let. ODOT uses AASHTOWare Project Bids to build proposals and generate pay items; the process at OTA is more manual
ODOT ODOT
OTA OTA
ODOT
OTA
ODOT ODOT
OTA OTA
ODOT
OTA
Note: OAC conducts limited professional engineering contract management (through OMES) but it is not a primary function as most of this is managed at the airport level
Note: OAC does not conduct project letting. That function resides with each individual Airport
Project Letting & Consultant Contracts: Inter-Agency Comparison (2 of 3)
Platform could be leveraged “as is”; Some strong practicesKey Platform functional; Upgrades driven by
overall Modernization strategic prioritizationPlatform in need of significant upgrade and/or
support

88
Sub-Function
Agency Maturity Assessment
ObservationsPeople & Organization
Process & Performance
Infrastructure
Prequalification & Performance Review• Process Contractor’s
Prequalification Application• Review Contractor's Audited
Financial Statement • Manage contractor renewal
process• Maintain prequalification list and
performance review data
• People – Neither Agency dedicates significant people resources to contractor pre-qualifications or performance evaluations and OTA’s resource is spread amongst several other Sub-Functions. Only one individual at ODOT is responsible for pre-qualifications, which poses a potential risk
• Process – ODOT has mature processes to conduct pre-qualifications and performance reviews; OTA does not and relies on ODOT’s pre-qualification list
• Process – While ODOT has a formal policy to suspend or debar contractors for receiving negative performance evaluations, there seems to be a lack of reaction to receiving a negative review, and poor performers are still selected for future work. 18 projects received a negative review, and 16 contractors were removed from the 260-contractor prequalification list, but due to expiration. OTA does not formally complete performance reviews
• Process – Neither Agency consistently tracks KPIs (such as Avg. duration of pre-qualification evaluation; performance distribution of contractors)
• Infrastructure – ODOT uses its TOPS system for workflow management related contractor pre-qualification. OTA uses excel spreadsheets to manage this process
Spec Book• Maintain and update the spec
book• Maintain a running log of all the
spec changes
• People – ODOT Office Engineers has a dedicated resource who brings together all the expertise of the different divisions, other external contractors, or specialists and keeps a running log of all the spec changes
• Process – ODOT publishes a new spec book about every 10 years, which then OTA would adopt a similar version. OTA already works with ODOT's Office Engineers for the Spec Book and Special Provisions and they will be using the same spec book in the future
• Infrastructure – ODOT maintains spec changes by hand/manually and captures spec book differences in a published document on the website
ODOT ODOT
OTA
ODOT
OTA
ODOT ODOT
OTA OTA
ODOT
OTA
Note: OAC does not create a specification book. That function resides with each individual Airport
Note: OAC is not obligated and does not formally conduct prequalification or performance reviews of contractors. That function resides with each individual Airport
OTA
Project Letting & Consultant Contracts: Inter-Agency Comparison (3 of 3)
Platform could be leveraged “as is”; Some strong practicesKey Platform functional; Upgrades driven by
overall Modernization strategic prioritizationPlatform in need of significant upgrade and/or
support

Construction Monitoring: Focus Area Overview
89
Sub-Functions Key Responsibilities ODOT Divisions OTA Divisions OAC Divisions
Project Setup and Application/Data
Management
• Project Setup in applicable systems (Site Manager Construction, Excel, etc..)
• Project Data Migration or Population• Application Support (where applicable)
Construction(Construction Programs)
Construction(Administration)
Airport Division (Grants Administration)
Construction Inspection
• Conduct daily inspections of Work-Sites • Selecting and scheduling Construction Management
consultants • Contractor Dispute resolution • Change Order initiation• Liaison to various external stakeholders
District Offices(Construction Residency Staff)
Construction (Field Office)
Airport Division(Airport Engineer)
Materials Quality Testing
• Verifying the quality of materials for use in highway construction
• Technician evaluation and certification verification • Mediator to settle Construction vs Contractor disputes• Calibrating Agency Lab equipment
Materials Construction(Field Office)
Airport Division(Airport Engineer)
Vendor Payments and Contract Administration
• Issue (monthly/bi-monthly) and final estimate payments• Maintain contracts and process any changes and update
applicable applications• Process Change Orders• Conduct Final construction project Audits
Construction (Contracts and Estimates)
ComptrollerDistrict Offices
(Construction Auditors)
Construction(Administration)
ControllerConsultants
(Construction Auditors)
Airport Division(Grants Administration)
Sub-Functions and Agency Breakdown
Sub-Functions Footnotes
ODOT OTA OACOAC does not conduct any of the
Sub-Functions withing Construction Inspection except inspections

Construction Monitoring: ODOT Profile (1 of 2)
90
Dedicated Personnel and Budget
Sub-Function Divisions FTE /% Class*
Personnel Cost*
Consultant Cost**
Project Setup and Application/Data Management
Construction Division 2 /100% Hidden $ -
Construction Inspection District Offices 395.14 /
98% $36,752,382 $16,688,249
Materials Quality Testing Materials Division 61 /
97% $6,156,631 $2,934,132
Vendor Payments and Contract Administration
Construction Division 36.33 /100% $3,768,853 $ -
Administrative All 42.27 /91% $5,477,853 N/A
Vacancies All 0 N/A N/A
Total 536.74 $ 52,349,219 $ 19,622,381
Volume of Work
Measure ValueProjects Transitioned to Construction FY19 254 / $896 M
Number of Vendor Payments FY19 4,670 / $901 M
Number of Change Orders FY19 1,090 / $16 M
Number and Value of Final Estimate Paid – FY19 331/ $3 M
Active Technicians IA Evaluated – FY19 267
Number of Labs Certified – FY19 30 of 33
Asphalt Plants Certified – FY19 66 of 71
KPI Definition Performance Measurement
Projects On-Time/Under-Budget
Percent of projects delivered on time and under budget – FY19
54% on-time / 62% under-budget
Techs Complete/Labs Certified
Percent of technician evaluation and lab certifications completed – FY19 100%
Vendor Payments Percent of vendor payments made within 15 days – FY19 97%
Inspection Spend Comparison
Consultant inspection spend vs in-house spend – FY19 6.68% / 12.72%
6 Month List Number of projects that have not been closed out in 6 months or more 189
Contract Growth The percentage growth in construction project costs – FY19 -0.78%
Performance
* FTE, Classification, and Personnel Costs – Sourced from Agency provided Personnel files as of July 2020 ** Consultant Costs – FY19 consultant costs
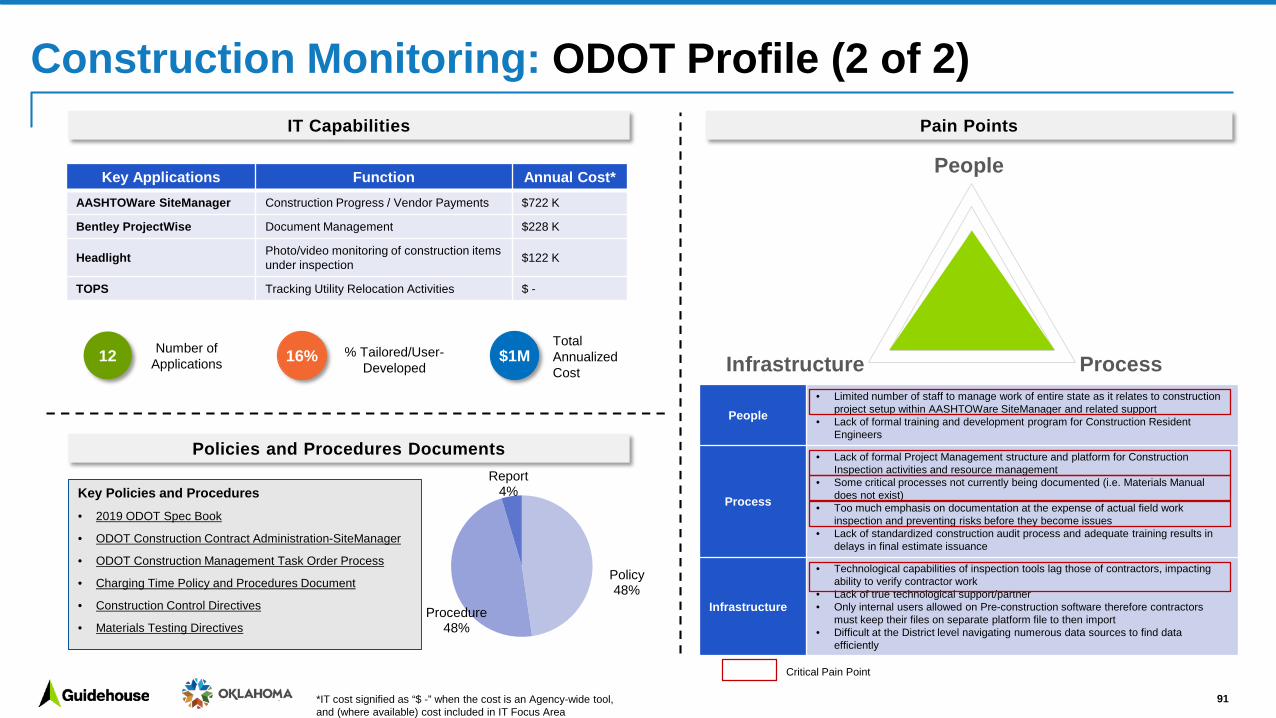
People
ProcessInfrastructure
Construction Monitoring: ODOT Profile (2 of 2)
91
Policies and Procedures Documents
Pain Points
People• Limited number of staff to manage work of entire state as it relates to construction
project setup within AASHTOWare SiteManager and related support• Lack of formal training and development program for Construction Resident
Engineers
Process
• Lack of formal Project Management structure and platform for Construction Inspection activities and resource management
• Some critical processes not currently being documented (i.e. Materials Manual does not exist)
• Too much emphasis on documentation at the expense of actual field work inspection and preventing risks before they become issues
• Lack of standardized construction audit process and adequate training results in delays in final estimate issuance
Infrastructure
• Technological capabilities of inspection tools lag those of contractors, impacting ability to verify contractor work
• Lack of true technological support/partner• Only internal users allowed on Pre-construction software therefore contractors
must keep their files on separate platform file to then import• Difficult at the District level navigating numerous data sources to find data
efficiently
Policy48%
Procedure48%
Report4%Key Policies and Procedures
• 2019 ODOT Spec Book
• ODOT Construction Contract Administration-SiteManager
• ODOT Construction Management Task Order Process
• Charging Time Policy and Procedures Document
• Construction Control Directives
• Materials Testing Directives
IT Capabilities
Number of Applications12
Key Applications Function Annual Cost*AASHTOWare SiteManager Construction Progress / Vendor Payments $722 K
Bentley ProjectWise Document Management $228 K
Headlight Photo/video monitoring of construction items under inspection $122 K
TOPS Tracking Utility Relocation Activities $ -
16% $1MTotal Annualized Cost
Critical Pain Point
% Tailored/User-Developed
*IT cost signified as “$ -” when the cost is an Agency-wide tool, and (where available) cost included in IT Focus Area

Construction Monitoring: OTA Profile (1 of 2)
92
Dedicated Personnel and Budget Volume of Work
Measure ValueProjects Transitioned to Construction - FY19 57 / $134 M
Number of Vendor Payments - FY19 376 / $333 M
Number of Change Orders - FY19 126 / $11 M
Number and Value of Final Estimate Paid – FY19 20 / $129 M
KPI Definition Measure
Projects Under-Budget Percent of projects delivered under budget – FY19 35%
Project Closeout Avg length of time between last estimate signed and final payment 64 days
Contract Growth Percent of projects over the original contract amount 65%
Vendor Payments Percent of vendor payments made within 30 days 87%
Contract Growth The percentage growth in construction project costs – FY19 2%
Performance
Sub-Function Divisions FTE /% Class*
Personnel Cost*
Consultant Cost**
Project Setup and Application/Data Management
Construction Division 0.33 /100% Hidden $ -
Construction Inspection Construction Division 1.75 /
57% Hidden $46,145,051
Materials Quality Testing N/A N/A Hidden $7,306,845
Vendor Payments and Contract Administration
Construction Division 0.33 /100% Hidden $ -
Administrative All 1 Hidden N/A
Vacancies All 0 N/A N/A
Total 3.42 Hidden $ 53,451,896
* FTE, Classification, and Personnel Costs – Sourced from Agency provided Personnel files as of July 2020 ** Consultant Costs – FY19 consultant costs

People
ProcessInfrastructure
Construction Monitoring: OTA Profile (2 of 2)
93
Policies and Procedures Documents
Pain Points
People • Only 1 FTE to manage Project Setup, Vendor Payment/Contract Administration, and Right of Way Acquisitions and Disposal
Process
• No formal documented procedures or processes related to inspections, payments, testing, etc..; However, OTA relies on ODOT’s existing construction and materials control directives.
• Tracking measures exist at the project level (project schedule status, budget status) for Driving Forward Program. However, no KPIs to report on the "baseline" projects performance (% projects on time; % of projects under/at budget) are currently in use
• Cumbersome and time-consuming project closeout process that requires intra-Agency cooperation amongst multiple divisions by which time consultants may have moved on to other projects
• Construction contractors paid via physical check rather than via electronic deposit• Contractors do not consistently follow OTA traffic safety rules
Infrastructure • Lack of a robust software platform to facilitate project, workflow, and document
management related to construction inspection and vendor payments• Difficulty with upgrading IT infrastructure while delivering a major capital program
(I.e.. Driving Forward)
Policy8%
Procedure23%
Report69%
Key Policies and Procedures:• OTA 2010 Std Specs Construction
• Driving Forward Project Status Report
• Capital Plan Project Tracking
• Consultant Selection Criteria
• Capital Planned Improvements
• Construction Control and Materials Directives
IT Capabilities
Number of Applications5
Key Applications Function Annual Cost*EPPS Payment Processing System $9,571
OnX Hunt GPS mapping $860
Google Earth Mapping $ 0
Google Maps GPS Mapping $ 0
40% $10KTotal Annualized Cost
Critical Pain Point
% Tailored/User-Developed
*IT cost signified as “$ -” when the cost is an Agency-wide tool, and (where available) cost included in IT Focus Area

Construction Monitoring: OAC Profile (1 of 2)
94
Dedicated Personnel and Budget Volume of Work
Measure ValueProjects Programmed - FY19 7 / $2.3 M
Projects Closed Out - FY19 11 / $809 K
Vendor payments – FY19 531 / $5 M
Construction Projects Transitioned – FY19 21 / $31 M total / OAC portion $5 M
Dollar value of reimbursement payments – FY19 131 / $5 M
Number of Change Orders Processed – FY19 6
Performance
KPI Definition Measure
KPIs not currently being tracked
Sub-Function Divisions FTE /% Class*
Personnel Cost*
Consultant Cost**
Project Setup and Application/Data Management
Airport Division 0.33 /0% Hidden $ -
Construction Inspection Airport Division 1.34 /
0% Hidden $ -
Materials Quality Testing Airport Division N/A Hidden $ -
Vendor Payments and Contract Administration
Airport Division 0.33 /0% Hidden $ -
Administrative All N/A N/A N/A
Vacancies All N/A Hidden N/A
Total 2 Hidden $ -
* FTE, Classification, and Personnel Costs – Sourced from Agency provided Personnel files as of July 2020 ** Consultant Costs – FY19 consultant costs

Construction Monitoring: OAC Profile (2 of 2)
95
Policies and Procedures Documents
Pain Points
People • Lack of a GIS Subject Matter Expert to provide day-to-day support until a FTE can be hired
Process
• KPIs related to whether Airport Construction Projects are completed on time and within budget are not tracked
• Project closeout can become cumbersome if FAA doesn’t close out the project in a timely fashion
• Elevated OMES fee to procure construction inspection services (~7% of contract amount)
Infrastructure
• Currently everything is tracked manually through spreadsheets; automation through a grants-management application (e.g. Salesforce) would be very beneficial
• Incompatibility with ODOT pavement inspection process and methodology (ODOT focuses on rideability, OTA’s focuses on loads)
Policy0%
Procedure67%
Report33%Key Policies and Procedures:
• Capital Projects Operating Manual
• Various Tracking Spreadsheets (to monitor and mange project progress, vendor payments, and grant distribution)
• Financial Review – All Projects
• Preconstruction Operating Protocols
IT Capabilities
Number of Applications5 0%
% Custom Built/User-Developed
$3KTotal Annualized Cost
Key Applications Function Annual Cost*AutoCAD Civil 3D To review construction plan designs $2 K
PAVER Pavement Condition Management $800
Adobe Acrobat To track and read electronic documents $ -
Microsoft Suite Excel to track grants and help facilitate payments $ -
Critical Pain Point
People
ProcessInfrastructure
*IT cost signified as “$ -” when the cost is an Agency-wide tool, and (where available) cost included in IT Focus Area

Construction Monitoring: Inter-Agency Comparison (1 of 3)
96
FTE Classified Personnel –Costs*
Consultant – Cost**
ODOT 536.7 98% $52 M $19 M
OTA 3.4 49% Hidden $53 M
OAC 2 0% Hidden $ -
Total 542.1 97% $53 M $73 M
Dedicated Personnel and Budget Volume and Performance
Agency Volume Performance
ODOT
• FY19 # / Value of Projects Transitioned to Construction - 254 / $896 M
• FY19 # / Value of Vendor Payments -4,670 / $901 M
• FY19 # / Value Orders - 1,090 / $15.8 M• FY19 # / Value of Final Estimate Paid -
331/ $2.93 M
• FY19 % of Projects On-Time/Under-Budget - 54% on-time / 62% under-budget
• FY19 % of Techs Complete/Labs Certified - 100%
• FY19 % of Vendor Payments - 98% within 15 days
• FY19 % of Inspection Spend Comparison – 6.68% / 12.72%consultant vs in-house
• 6 Month List - 189
OTA
• FY19 # / Value Projects Transitioned to Construction – 57 / $134 M
• FY19 # / Value of Vendor Payments –376 / $333 M
• FY19 # / Value of Change Orders – 126 / $11.3 M
• FY19 # / Value of Final Estimate Paid –20 / $129 M
• FY19 Pavement Distress Survey - Avg of 82 (Excellent)
• FY19 Bridge Conditions Ratings –8/411 bridges structurally deficient
• FY19 % of Vendor Payments - 87% paid within 30 days
OAC
• FY19 Projects Programmed -7 / $2.3M
• FY19 Projects Closed Out -11 / $809 K
• FY19 # / Value of Vendor Payments –531 / $5.2 M
• Construction Projects Transitioned -21 / $31 M total / OAC portion $5.1 M
• FY19 # / Value of Reimbursements -131 / $5.2 M
• FY19 # of Change Orders - 6
N/A
IT Spend
ODOT$1.2M
$10K OTA
$2.8K OAC
Key Common IT Applications
Function ODOT OTA OAC
Workflow Management
AASHTOWare TOPS -Utilities
Microsoft Suite Microsoft Suite
Payment Processing AASHTOWare EPPS Microsoft Suite
Document Management ProjectWise EPPS DropBox;
AutoCAD
Analytics Oracle BI Microsoft Suite Microsoft Suite
* FTE, Classification, and Personnel Costs – Sourced from Agency provided Personnel files as of July 2020 ** Consultant Costs – FY19 consultant costs

Sub-Function
Agency Maturity Assessment
ObservationsPeople & Organization
Process & Performance
Infrastructure
Project Setup and Application/Data Management
• People -There is a general lack of resources within this Sub-Function across all the Agencies. ODOT has a dedicated branch of only 3 FTE to manage project setup and data migration for the entire state. OTA and OAC have 1 resource each who are spread between several other Sub-Functions. Additionally, OTA relies on consultants to manage components of project setup
• Process - ODOT has significantly more projects to setup versus OTA and OAC. Nevertheless, None of the Agencies have a Policy or Procedures manual to guide Project Setup
• Infrastructure - ODOT has “industry-standard” application ASW Site Manager to manage workflow for Construction Inspection, Materials Testing and Vendor Payments. However, OTA and OAC rely on user developed spreadsheets or consultants
Construction Inspection
• People - All three Agencies have clear organizational structures to execute on construction inspection. ODOT and OAC handle most responsibilities in house, while OTA largely contracts out this function. OTA has spent approximately 3,741% ($45M) more than ODOT in outsourced work
• Process - The 2019 Specs book (specific to ODOT/OTA) and construction control directives provide a comprehensive policy and partial procedural framework, however, none of the Agencies have formal internally focused inspection procedures guidebook or project management framework for construction inspection activities (E.g., Resident Engineer manual, Project Management toolset, etc..)
• Process - All three Agencies track several performance measures, however none of them have specific KPIs or regular reporting dashboards. Nonetheless ODOT’s and OTA’s project completion progress is quite high. The majority of ODOT’s projects are also under-budget.
• Infrastructure - ODOT has an “industry standard” application ASW SiteManager to support workflow management. Both OTA and OAC utilize user-developed tools to manage workflow, and both rely on consultants to provide Project/Program management
Construction Monitoring: Inter-Agency Comparison (2 of 3)
ODOT ODOT
OAC
OTA
OAC
OTA
ODOT
OTA
OAC
ODOT ODOT
OAC
OTA
OAC
OTA
ODOT
OTA
OAC
Platform could be leveraged “as is”; Some strong practicesKey Platform functional; Upgrades driven by
overall Modernization strategic prioritizationPlatform in need of significant upgrade and/or
support
97

Sub-Function
Agency Maturity Assessment
ObservationsPeople & Organization
Process & Performance
Infrastructure
Materials Quality Testing
• People - ODOT has a dedicated division to manage Materials Quality Testing, whereas OTA and OAC outsource to either ODOT or consultants
• Process - ODOT’s Policies and KPIs related to Materials testing, Quality Assurance, Inspector certification are embedded with federal regulations and contracts, and articulated in their materials testing directives. ODOT consistently meets or exceeds its required performance. OTA and OAC do not have Policies or KPIs
• Infrastructure - ODOT has dedicated infrastructure (labs, equipment, etc...), however, ODOTs software apparatus is largely custom built, and operates on an antiquated operating software platform and is subject to inoperability risk
Vendor Payments and Contract Administration
• People - ODOT has a dedicated branch to manage vendor payments, change orders, and administrative contract management. OTA and OAC have 1 resource each who are spread between several other Sub-Functions
• Process - ODOT must process significantly more vendor payments/change orders in comparison to OTA and OAC (4,670 ODOT / 376 OTA / 531 OAC) A critical gap is that none of the Agencies have a Procedures manual to guide the underlying processes
• Process - Only OTA has actively been tracking performance measures such as on on-time payments, although the underlying data exists for ODOT. Nevertheless, ODOT and OTA have a strong track record of issuing payments within 15 days – 97% for ODOT, and within 30 days -30% for OTA
• Infrastructure - ODOT has “industry-standard” application ASW Site Manager to manage workflow for Construction Inspection, Materials Testing and Vendor Payments. However, OTA and OAC rely on user developed spreadsheets or consultants
Construction Monitoring: Inter-Agency Comparison (3 of 3)
ODOT ODOT
OTA
ODOT
OTA
ODOT ODOT
OAC
OTA
OAC
OTA
ODOT
OTA
OAC
Note: OAC does not perform this function. OTA outsources this function it to consultants or ODOT and so has no infrastructure
Platform could be leveraged “as is”; Some strong practicesKey Platform functional; Upgrades driven by
overall Modernization strategic prioritizationPlatform in need of significant upgrade and/or
support
98

Maintenance: Focus Area Overview
99
Sub-Functions Key Responsibilities ODOT Divisions OTA Divisions OAC Divisions
Maintenance Quality Assurance (MQA)
• Implementation of systems to identify level of service targets and performance for Roadway Assets
• Alignment of Maintenance Budgets and Project Planning to MQA framework
N/A N/A N/A
Systems and Data Management
• Capture and warehousing of all data from the field to enable relevant budget and performance monitoring and analysis
Maintenance (Agile Assets) Maintenance (Division and Turnpike Crews) N/A
District Wide Maintenance • Oversees the preservation, upkeep, inspection, evaluation and restoration of roadways and structures (includes Special/Heavy Maintenance)
Districts (District Maint. Crews) N/A N/A
County Maintenance Districts (County Maint. Crews) Maintenance (Turnpike Crews) N/A
Bridge Maintenance • Oversees the preservation, upkeep, inspection, evaluation and restoration of bridges
Bridge (Field Services)Districts (Bridge Crews) Maintenance (Turnpike Crews) N/A
Equipment Management• Purchasing and leasing equipment and vehicles• Monitoring and conducting asset preservation efforts on
heavy/light equipment and vehicles
Maintenance (Equipment) Districts (Equipment/Shop Crew)
Maintenance (Vehicle Maintenance and Fleet Specialists)
N/A
Miscellaneous Programs• Execution of various programs that do not fit in within the
more traditional Sub-Functions (e.g. Beautification, Traffic Sign Shop, Contracts, etc..)
Maintenance (Overhead/MMS/Equipment N/A N/A
Sub-Functions and Agency Breakdown
Sub-Functions Footnotes
ODOT Maintenance Quality Assurance OTA Maintenance Quality Assurance OACOAC is not responsible/obligated to conduct maintenance activities for
airports

Maintenance : ODOT Profile (1 of 2)
100
Dedicated Personnel and Budget
Sub-Function Divisions FTE /% Class*
Personnel Cost*
Consultant Cost**
Maintenance Quality Assurance N/A N/A N/A N/A
Systems and Data Management Maintenance 2 /
100% Hidden $842,025
District Wide Maintenance Districts 308.44 /
100% $24,284,279$5,658,330
County Maintenance Districts 659 /100% $51,230,401
Bridge Maintenance BridgeDistricts
50.44 /100% $4,351,296 $211.437
Equipment Management
MaintenanceDistricts
85 /100% $7,205,928 Not Available
Misc. Programs Maintenance 12 /100% $1,051,774 Not Available
Administrative All 129.27 /98% $12,499,969 N/A
Vacancies All 0 N/A N/A
Total 1,246.15 $100,623,648 $5,211,565
Volume of Work
Measure ValueTotal District/County Maintenance - FY19 $131 M
Total Bridge Maintenance - FY19 $113 M
Total Equipment Costs - FY19 $9 M
Total Miles of Lane Miles Maintained 120 K miles
Bridge Inspection Count - FY19 12 K
KPI Definition MeasureLimited KPIs for Maintenance Activities
Cost-Balance Dashboard
Dashboard used in the field to monitor overspending
To be defined KPIs that provide a real-time view of budget capacity of all maintenance activities
Structurally Deficient Bridges – FY19
The percent of structurally deficient bridges that are On-System 1.94% FY19 budgeted
Performance
* FTE, Classification, and Personnel Costs – Sourced from Agency provided Personnel files as of July 2020 ** Consultant Costs – FY19 consultant costs
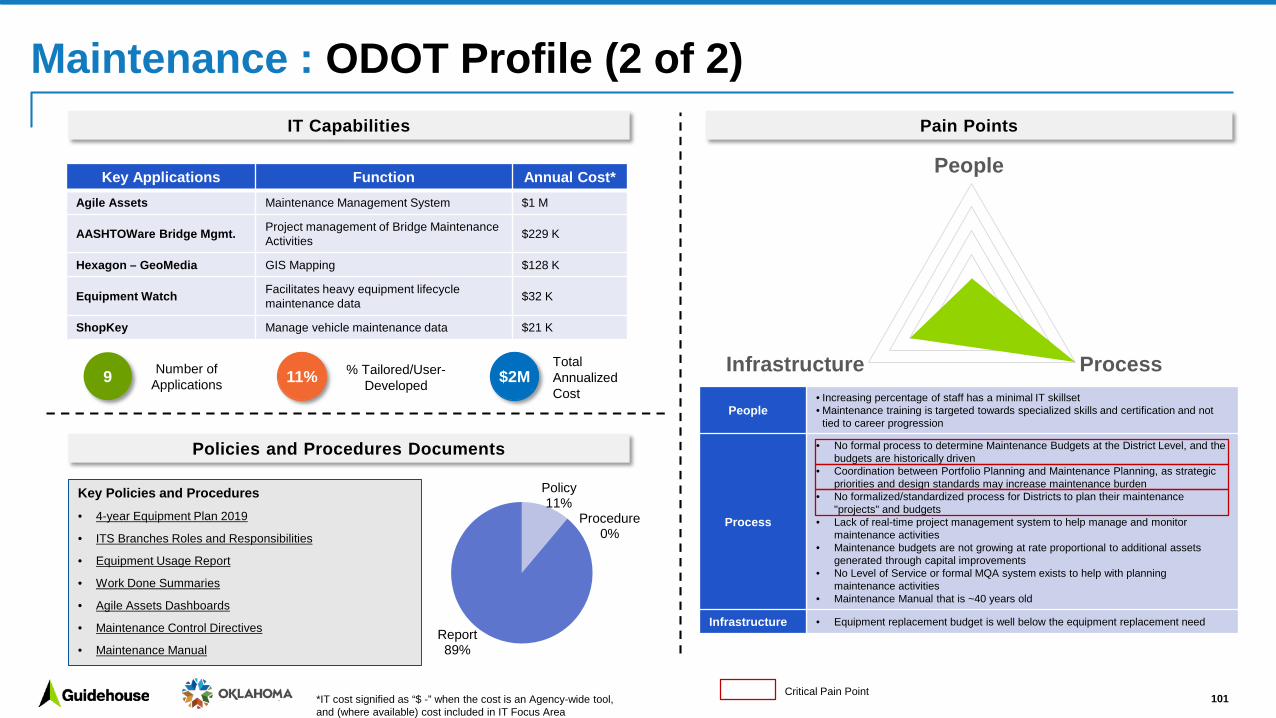
People
ProcessInfrastructure
People• Increasing percentage of staff has a minimal IT skillset• Maintenance training is targeted towards specialized skills and certification and not
tied to career progression
Process
• No formal process to determine Maintenance Budgets at the District Level, and the budgets are historically driven
• Coordination between Portfolio Planning and Maintenance Planning, as strategic priorities and design standards may increase maintenance burden
• No formalized/standardized process for Districts to plan their maintenance "projects" and budgets
• Lack of real-time project management system to help manage and monitor maintenance activities
• Maintenance budgets are not growing at rate proportional to additional assets generated through capital improvements
• No Level of Service or formal MQA system exists to help with planning maintenance activities
• Maintenance Manual that is ~40 years old
Infrastructure • Equipment replacement budget is well below the equipment replacement need
Maintenance : ODOT Profile (2 of 2)
101
Policies and Procedures Documents
Pain Points
Policy11%
Procedure0%
Report89%
Key Policies and Procedures• 4-year Equipment Plan 2019
• ITS Branches Roles and Responsibilities
• Equipment Usage Report
• Work Done Summaries
• Agile Assets Dashboards
• Maintenance Control Directives
• Maintenance Manual
IT Capabilities
Key Applications Function Annual Cost*Agile Assets Maintenance Management System $1 M
AASHTOWare Bridge Mgmt. Project management of Bridge Maintenance Activities $229 K
Hexagon – GeoMedia GIS Mapping $128 K
Equipment Watch Facilitates heavy equipment lifecycle maintenance data $32 K
ShopKey Manage vehicle maintenance data $21 K
Number of Applications9 11% % Tailored/User-
Developed $2MTotal Annualized Cost
Critical Pain Point*IT cost signified as “$ -” when the cost is an Agency-wide tool, and (where available) cost included in IT Focus Area

Measure ValueTrash Removal – FY19 44,656 hours / $1 M
Drainage Repairs – FY19 67,221 sq.. yards / $829 K
Brush and Weed Control – FY19 15,767 hours / $675 K
Vegetation Management – FY19 34,804 acres / $650 K
Asphalt Repairs on Travel Surfaces – FY19 2,816 tons / $300 K
Concrete Repairs on Travel Surfaces – FY19 644 cubic yards / $1 M
Total Maintenance Spend – FY19 $19 M
Total Bridge Maintenance Spend – FY19 $181 K
Maintenance : OTA Profile (1 of 2)
102
Dedicated Personnel and Budget Volume of Work
KPI Definition Measure
Limited KPIs for Maintenance Activities
Drainage Culvert Inspection – FY19
Summarization of the maintenance needs for each drainage structure 4,000 structures checked
Bridge Inspections –FY19
Summarization of the rehabilitation needs for bridges 99 Bridges Inspected
Performance
Sub-Function Divisions FTE /% Class*
Personnel Cost*
Consultant Cost**
Maintenance Quality Assurance N/A N/A N/A N/A
Systems and Data Management Maintenance 2.33 /
57% Hidden $ -
District Wide Maintenance N/A N/A N/A N/A
County Maintenance Maintenance 94.5 /100% $5,934,042 $2,214,804
Bridge Maintenance Maintenance 94 /100% $5,906,849 $ -
Equipment Management Maintenance 10 /
90% $726,766 $204,904
Misc. Programs N/A N/A N/A N/A
Administrative All 1.34 /63% Hidden N/A
Vacancies All 0 N/A N/A
Total 202.17 $12,944,231 $2,419,708
* FTE, Classification, and Personnel Costs – Sourced from Agency provided Personnel files as of July 2020 ** Consultant Costs – FY19 consultant costs

People
ProcessInfrastructure
Maintenance : OTA Profile (2 of 2)
103
Policies and Procedures Documents
Pain Points
People
• Significant challenge recruiting and retaining at the more junior maintenance levels (i.e. TEO 1 - 3 level) – there has been ~50% turnover in the last two years
• Compensation for Maintenance staff at a more junior level is not competitive• Maintenance training is targeted towards specialized skills and certification and not
tied to career progression
Process
• No formalized process for Budget planning at the Turnpike Level and it is historically driven
• No formal MQA system exists (beyond Olsson report on Culvert condition) to guide planning maintenance activities or budgets.
• Level of Service assessment is based on staff experience and institutional knowledge
• OTA's turnpikes are starting to age and maintenance and repair needs are potentially going to increase
• There is a push for OTA to remain lean and outsource more work however pricing for consultants is trending higher than what OTA can provide in-house
• Communication needs to be better at the division and turnpike level in order to aide equipment and resource gaps across the Agencies
Infrastructure • N/A
Policy0%
Procedure12%
Report88%
Key Policies and Procedures• Long Term Equipment and Vehicle Purchasing Plan
• Purchase of Goods and Services Policy
• December 2017, 2018, 2019 OPs Report
• Bridge Maintenance Manual
• Asphalt Repair Manual
• VoTech Training Manuals
IT Capabilities
Number of Applications5
Key Applications Function Annual Cost*VUEWorks Maintenance Management System $198 K
OnX Hunt Identify Adjacent land owners $860
Hansen Maintenance Management System (sunsetting) $ -
Hansen Reporter To view Bridge Condition Data $ -
Quickbase Project Management $ -
0% $199KTotal Annualized Cost
Critical Pain Point
% Tailored/User-Developed
*IT cost signified as “$ -” when the cost is an Agency-wide tool, and (where available) cost included in IT Focus Area

Maintenance: Inter-Agency Comparison (1 of 4)
104
FTE Classified Personnel –Costs*
Consultant – Cost**
ODOT 1,246.2 99% $101 M $5 M
OTA 202.2 82% $13 M $2 M
OAC N/A N/A N/A N/A
Total 1,448.8 90.5% $114 M $7 M
Dedicated Personnel and Budget Volume and Performance
Agency Volume Performance
ODOT
• FY19 District/County Maint. Spend: $131 M• FY19 Bridge Maint. Spend - $112.7 M• FY19 Equipment Costs - $8.8 M• FY19 Miles of Roadway Maint. - 120 K miles• FY19 Bridge Inspection Count - 11.9 K
• FY19 % Structurally Deficient Bridges: 1.94%
OTA
• FY19 Maint. Spend: $19.3 M • FY19 Bridge Maintenance Spend: $180.6 K • FY19 Trash Removal hours / spend:
44,656 hours / $1.44 M• FY19 Drainage Repairs hours / spend:
67,221 sq.. yards / $829 K• FY19 Brush & Weed Control hours / spend:
15,767 hours / $675 K • FY19 Vegetation Mgmt. hours / spend:
34,804 acres / $650 K • FY19 Asphalt Repairs hours / spend:
2,816 tons / $300 K • FY19 Concrete Repairs hours / spend:
644 cubic yards / $1.04 M
• FY19 Drainage Culvert Inspection: 4,000 structures checked
• FY19 Bridge Inspections: 799 Bridges Inspected
OAC N/A N/A
IT Spend
ODOT$1.9M
$199K OTA
N/A OAC
Key Common IT Applications
Function ODOT OTA OAC
Maintenance Management Agile Assets Hansen/
Vue Works N/A
Bridge Maintenance
ASW Bridge Management
Hansen/Vue Works N/A
Project Management N/A QuickBase N/A
Equipment Management
Equipment Watch Hansen N/A
* FTE, Classification, and Personnel Costs – Sourced from Agency provided Personnel files as of July 2020 ** Consultant Costs – FY19 consultant costs

Maintenance : Inter-Agency Comparison (2 of 4)
105
Sub-Function
Agency Maturity Assessment
ObservationsPeople & Organization
Process & Performance
Infrastructure
Maintenance Quality Assurance (MQA)• Implementation of systems to
identify level of service targets and performance for Roadway Assets
• Alignment of Maintenance Budgets and Project Planning to MQA framework
• People - MQA traditionally resides within a centralized Maintenance division, however neither ODOT nor OTA has dedicated resources to a formal MQA System. OTA outsources a portion of an MQA system to the independent consulting engineer, Olsson, that annually evaluates the condition of OTA’s culverts
• Process - No formal MQA framework exists at either ODOT or OTA. Thus, Maintenance budgets are historically based, and there is no consistent Agency wide approach to maintenance planning
• Process - Neither ODOT nor OTA have a comprehensive level of service targets for roadway and bridge features, and as a result KPIs are not available. OTA measures performance based on maintenance project completion (from annual plans)
• Infrastructure - ODOT and OTA have “industry standard” maintenance management software applications, AgileAssets and VueWorks. It appears that only VueWorks provides MQA capabilities
Systems and Data Management• Capture and warehousing of all
data from the field to enable relevant budget and performance monitoring and analysis
• People - ODOT relies on in-house and outsourced resources to manage Agile Assets. OTA mainly relies on in-house resources to support Hansen and VueWorks soon
• Process - Neither Agency has a policy or procedural framework to govern data quality, resulting in data integrity concerns. The volume and lack of data integration within ODOT limits the value of the data in driving decision-making. Data systems are in place to enable Districts to make more data informed decisions regarding maintenance projects and budgets, however, it does not appear that this data is being used consistently at the field district level
• Infrastructure - ODOT and OTA have “industry standard” maintenance management software applications, AgileAssets and VueWorks. AgileAssets is heavily customized and does not have built-in GIS capabilities
ODOT ODOT
OTA OTA
ODOT
OTA
ODOT ODOT
OTA OTA
ODOT
OTA
Note: OAC does not conduct Airport Maintenance planning or work. That resides with each individual Airports
Note: OAC does not conduct Airport Maintenance planning or work. That resides with each individual Airports
Platform could be leveraged “as is”; Some strong practicesKey Platform functional; Upgrades driven by
overall Modernization strategic prioritizationPlatform in need of significant upgrade and/or
support

Maintenance : Inter-Agency Comparison (3 of 4)
106
Sub-Function
Agency Maturity Assessment
ObservationsPeople & Organization
Process & Performance
Infrastructure
District & County Maintenance• Oversees the preservation,
upkeep, inspection, evaluation and restoration of roadways and structures
• People – Both Agencies have a lot of turnover and issues with resource retention, especially at the junior staff level. Vacancies lead to back and forth between roles and responsibilities that must now be divided between a smaller pool
• Process – There is a lack of procedural documentation to guide maintenance work across ODOT and OTA. ODOT also lacks a project management framework to help manage the substantial amount of workload that the Agency is under. There also needs to be better coordination within both ODOT and OTA, so that construction decisions also factor into maintenance implications
• Infrastructure - ODOT and OTA have “industry standard” maintenance management software applications, AgileAssets and VueWorks
Bridge Maintenance• Oversees the preservation,
upkeep, inspection, evaluation and restoration of bridges
• People – This function is being done at the District level within ODOT, with the Bridge Division providing subject matter expertise when required. OTA has this function mapped at the turnpike level to provide bridge maintenance authority
• Process – Although bridge condition KPIs have been defined and are tracked, there appears to be a lack of documentation to guide bridge maintenance. In addition, It would be beneficial for ODOT to retain a sub-set of bridge maintenance projects in-house so that the comprehensive expertise stays within the Agency. Within OTA Bridge Maintenance is more reactive than proactive. Actively trying to get back to bringing sufficiency rating up when conditions are deemed as to low
• Infrastructure - ODOT and OTA have “industry standard” maintenance management software applications, AASHTOWare Bridge Management and VueWorks
ODOT ODOT
OTA OTA
ODOT
OTA
Note: OAC does not conduct Airport Maintenance planning or work. That resides with each individual Airports
ODOT ODOT
OTA OTA
ODOT
OTA
Note: OAC does not conduct Airport Maintenance planning or work. That resides with each individual Airports
Platform could be leveraged “as is”; Some strong practicesKey Platform functional; Upgrades driven by
overall Modernization strategic prioritizationPlatform in need of significant upgrade and/or
support

Maintenance : Inter-Agency Comparison (4 of 4)
107
Sub-Function
Agency Maturity Assessment
ObservationsPeople & Organization
Process & Performance
Infrastructure
Equipment Management• Purchasing and leasing
equipment and vehicles• Monitoring and conducting
asset preservation efforts on heavy/light equipment and vehicles
• People – ODOT relies on an in-house team for all equipment management tasks, while OTA has a much smaller resource footprint that is adequate for it’s equipment management needs
• Process – OTA has a strong setup in the equipment space and efficient processes that allow for them to actively acquire any piece of equipment that they require in part due to minimal red-tape. They also have a staggered leasing program with guaranteed buybacks that allow for a younger fleet of equipment with potentially less maintenance costs. ODOT however has an equipment replacement budget far below their replacement needs, resulting in much older equipment that is less efficient and requires far more maintenance
• Infrastructure – ODOT is using an equipment management software application called EquipmentWatch for it’s equipment management needs. OTA is utilizing Hansen for equipment management and tracking. Apart from trying to maintain aging equipment, there isn’t a significant gap in acquiring specific equipment from an ODOT perspective. OTA is lacking some specialized equipment (big milling, laydown machine, etc..) that they could potentially leverage from ODOT if necessary
ODOT ODOT
OTA OTA
ODOT
OTA
Note: OAC does not conduct Airport Maintenance planning or work. That resides with each individual Airports
Platform could be leveraged “as is”; Some strong practicesKey Platform functional; Upgrades driven by
overall Modernization strategic prioritizationPlatform in need of significant upgrade and/or
support

108
Sub-Functions Key Responsibilities ODOT Divisions OTA Divisions OAC Divisions
Traffic Data Collection • Collect Short term and long-term traffic counts, speed data, probe data, as well as turning movement counts
SAPMTraffic
Toll Operations(Consultant)
N/A
Traffic/Safety Data Analytics
• Provide traffic count and travel time reliability analysis and reporting
• Perform safety studies and work zone analysis
SAPMTraffic
Finance(Consultant) N/A
ITS/Real Time Traffic Management
• Traffic/Safety Design• Signal Phase and Timing • Incident and emergency response• Manage travel times and message boards• Traffic safety/mobility elements of:
- Work zone management- Road weather management
Maintenance Traffic
Districts
Engineering (Consultants)
Information TechnologyN/A
Operations • Fiber Optic expansion and maintenance • Maintain ITS Network Maintenance Information Technology N/A
Sub-Functions and Agency Breakdown
ODOT
Sub-Functions Footnotes
OTA OAC OAC does not execute any Sub-Functions in this Focus Area
TSMO: Focus Area Overview

TSMO: ODOT Profile (1 of 2)
109
Dedicated Personnel and Budget
Sub-Function Divisions FTE /% Class*
Personnel Cost*
Consultant Cost**
Traffic Data Collection
SAPMTraffic
5.5 /91% $641,364 $ -
Traffic/Safety Data Analytics
SAPMTraffic
23.5 / 97% $2,559,761 $ -
ITS/Real Time Traffic Management
MaintenanceTraffic
Districts
21.12/98% $2,279,449 $753,868
Operations Maintenance 11 /45% $499,800 $321,891
Leadership & Admin All 11 /100% $1,471,275 N/A
Total 72.12 $7,451,649 $1,075,759
Volume of Work
Measure Value# of ITS Network Sites 236
# Permanent Dynamic Message Signs 80
Miles of Fiber inspections/oversight 3100
FY19 Permanent Count Locations 86
FY19 Number of Manual Traffic Count Measurements - Short Term Volume 9,584
FY19 Number of Manual Traffic Count Measurements- Short Term Class 1,302
KPI Definition Measure
Traffic Fatalities Number of fatalities on all roadways –CY19 414
Fatality Rate Number of Fatalities per 100 Million Vehicle Miles of Travel – CY19 1.05
Serious Injury Rate Serious Injury Rate per 100 Million Vehicle Miles of Travel – CY19 3.66
Travel Time Reliability Percent of reliable person-miles traveled on the Interstate – CY19 93%
Performance
* FTE, Classification, and Personnel Costs – Sourced from Agency provided Personnel files as of July 2020 ** Consultant Costs – FY19 consultant costs

People
ProcessInfrastructure
TSMO: ODOT Profile (2 of 2)
110
Policies and Procedures Documents
Pain Points
People
• Parts of TSMO/ITS span multiple divisions, which causes some silos to exist• Small staff, which makes it difficult to balance the day-to-day operations and
innovation • Job classifications for ITS Branch limits job advancement• Lack of dedicated funding to expand and maintain the Department’s ITS/Fiber
network • Lack of communication around roles and who is responsible for which aspects of
the work
Process
• Need better analytics to build work zones, rather than basing those decisions on a “best guess” of traffic patterns
• Limited access to real time data needed to actively manage the system• TSMO is often an afterthought in the design process, and not strategically
implemented• Processing Purchase Orders (POs) related to maintenance and servicing of the
department’s fiber network
Infrastructure • Getting access to specialized software is not a smooth process since need to work with both OMES and the Office Services division
Policy20%
Procedure0%Report
80%
Key Policies and Procedures• Oklahoma Statewide Intelligent Transportation Systems
Strategic Plan (2003)
• Oklahoma Strategic Highway Safety Plan
IT Capabilities
Number of Applications32
Key Applications Function Annual Cost*EXFO Used to monitor fiber optic networks $21K
Houston Radar Tetryon Traffic count data management and analytics platform $10K
Info Group Data Used to create shapefiles for Traffic Analysis Zones $10K
PTV Vissim Traffic Traffic simulation and modeling program $7K
3% $51.8KTotal Annualized Cost
Critical Pain Point
% Tailored/User-Developed
*IT cost signified as “$ -” when the cost is an Agency-wide tool, and (where available) cost included in IT Focus Area
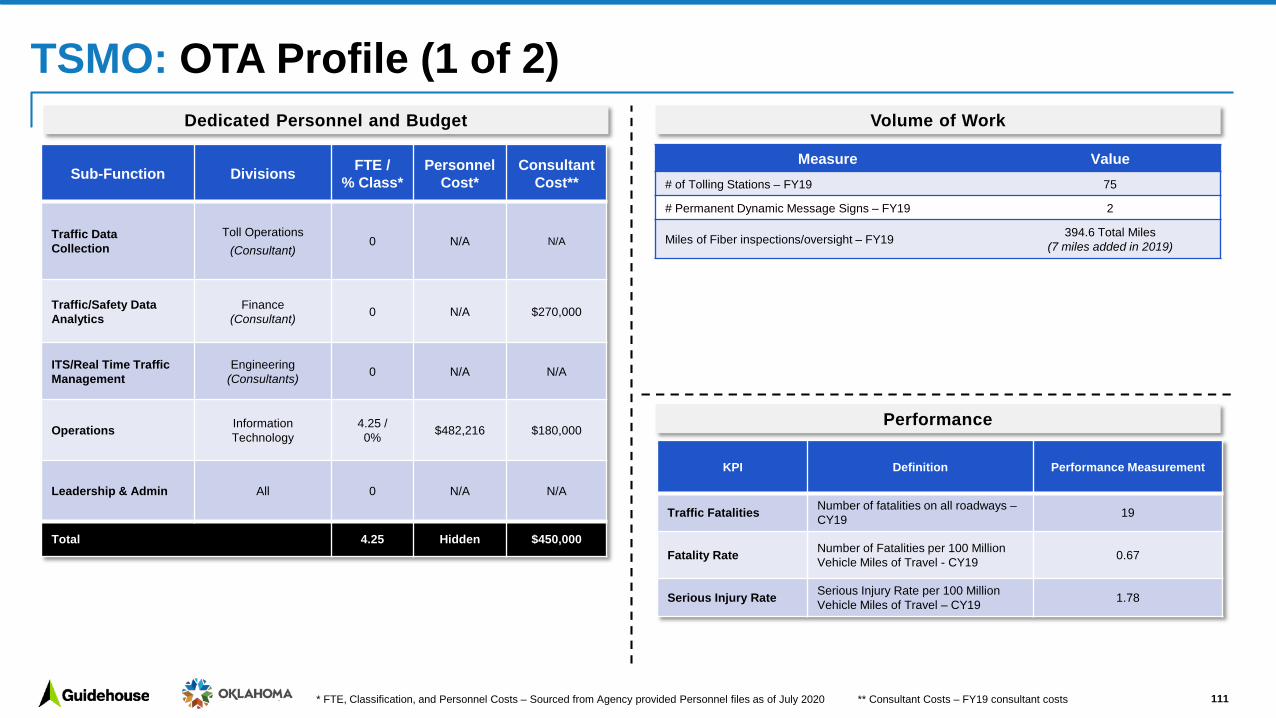
TSMO: OTA Profile (1 of 2)
111
Dedicated Personnel and Budget
Sub-Function Divisions FTE /% Class*
Personnel Cost*
Consultant Cost**
Traffic Data Collection
Toll Operations(Consultant)
0 N/A N/A
Traffic/Safety Data Analytics
Finance(Consultant) 0 N/A $270,000
ITS/Real Time Traffic Management
Engineering (Consultants) 0 N/A N/A
Operations Information Technology
4.25 /0% $482,216 $180,000
Leadership & Admin All 0 N/A N/A
Total 4.25 Hidden $450,000
Volume of Work
Measure Value# of Tolling Stations – FY19 75
# Permanent Dynamic Message Signs – FY19 2
Miles of Fiber inspections/oversight – FY19 394.6 Total Miles(7 miles added in 2019)
KPI Definition Performance Measurement
Traffic Fatalities Number of fatalities on all roadways –CY19 19
Fatality Rate Number of Fatalities per 100 Million Vehicle Miles of Travel - CY19 0.67
Serious Injury Rate Serious Injury Rate per 100 Million Vehicle Miles of Travel – CY19 1.78
Performance
* FTE, Classification, and Personnel Costs – Sourced from Agency provided Personnel files as of July 2020 ** Consultant Costs – FY19 consultant costs

People
ProcessInfrastructure
TSMO: OTA Profile (2 of 2)
112
Policies and Procedures Documents
Pain Points
People • Other divisions don’t always communicate with IT, which is why networking is often not included in construction projects
Process• Networking is always last in construction projects and often forgotten in projects• Challenge to get sites ready and ahead for fiber construction• TSMO is not considered during the design process due to a lack of
communication/processes with IT
Infrastructure • OTA has much of the data collection and ITS infrastructure in place to support
TSMO activities, but is not currently using this infrastructure for those purposes
Key Policies and Procedures
No Policies or Procedures were provided
IT Capabilities
Number of Applications2
Key Applications Function Annual Cost*WhatsUp Gold/WUG Fiber Network Monitoring $-
Power BI Shows Traffic Counts by Class and Payment Type $ -
0% $-Total Annualized Cost
Critical Pain Point
% Tailored/User-Developed
*IT cost signified as “$ -” when the cost is an Agency-wide tool, and (where available) cost included in IT Focus Area

TSMO: Inter-Agency Comparison (1 of 3)
113
FTE Classified Personnel –Costs*
Consultant – Cost**
ODOT 72.1 89% $7.5M $1.1M
OTA 4.2 0% Hidden $450K
OAC 0 N/A N/A N/A
Total 76.3 84% $7.9M $1.5M
Dedicated Personnel and Budget Volume and Performance
Agency Volume Performance
ODOT
• # of ITS Network Sites: 236• # Permanent Dynamic Message
Signs: 80• Miles of Fiber inspections/oversight:
3100• FY19 Permanent Count Locations: 86 • FY19 Manual Traffic Count
Measurements - Short Term Volume: 9,584
• FY19 Manual Traffic Count Measurements- Short Term Class: 1,302
• CY19 Traffic Fatalities: 414• CY19 Fatality Rate: 1.05• CY19 Serious Injury Rate:
3.66• CY19 Travel Time
Reliability: 93%
OTA
• # of Tolling Stations : 75• # Permanent Dynamic Message
Signs: 2• Miles of Fiber inspections/oversight:
394.6
• CY19 Traffic Fatalities: 19• CY19 Fatality Rate: 0.67• CY19 Serious Injury Rate:
1.78
OAC N/A N/A
IT Spend
ODOT$51.8K
$- OTA
N/A OAC
Key Common IT Applications
Function ODOT OTA OAC
Traffic Data Management
Houston Radar
TetryonN/A N/A
Traffic Forecasting
VissimSynchro N/A N/A
Collision Analytics SAFE-T N/A N/A
Fiber Network Monitoring EXFO WUG N/A
* FTE, Classification, and Personnel Costs – Sourced from Agency provided Personnel files as of July 2020 ** Consultant Costs – FY19 consultant costs

TSMO: Inter-Agency Comparison (2 of 3)
114
Sub-Function
Agency Maturity Assessment
ObservationsPeople & Organization
Process & Performance
Infrastructure
Field Traffic Data Collection• Collect Short term and long-term
traffic counts, speed data, probe data, as well as turning movement counts
• People – ODOT and OTA rely on receiving traffic collision data from OHP/OHSO/DPS and ODOT’s SAPM division collects and manages traffic counts. ODOT’s traffic division also collects speed data, so parts of this function occur in multiple divisions
• Process – ODOT’s traffic division has limited access to real time/probe data, which is needed for real time traffic management and TSMO purposes. OTA has access to real time traffic volume data, but the data is not being used to actively manage the system, just for finance/revenue purposes. Additionally, data sharing between Finance and Engineering is not streamlined and the data is siloed
• Infrastructure – ODOT has automatic count stations, as well as manual traffic count equipment to collect data. OTA has the infrastructure and real-time data that can be leveraged for TSMO purposes, including origins/destinations data from PIKEPASS transponders, tag readers and sensors, and CCTV cameras at toll areas, but it is not being used for TSMO purposes
• Infrastructure – ODOT lacks a centralized and accessible data and storage system needed to easily access real-time data
Traffic/Safety Data Analytics• Provide traffic count and travel
time reliability analysis and reporting
• Perform safety studies and work zone analysis
• People – ODOT’s Safety branch within the Traffic Division code collision data and send the data to OU to perform safety analysis, which is used to make smarter safety design decisions. Additionally, ODOT performs OTA’s safety studies since there are no dedicated resources at OTA to perform analysis
• Process – ODOT performs OTA’s safety studies, which is then reported to NHTSA by the Traffic Division. Traffic performance metrics are reported to FHWA by SAPM. Need better analytics to build work zones, rather than basing those decisions on a “best guess” of traffic patterns
• Infrastructure – ODOT’s SAFE-T Program/collision analytics software is outdated
ODOT ODOT
OTA OTA
ODOT
OTA
ODOT ODOT
OTA OTA
ODOT
OTA
Note: OAC does not conduct Operations/TSMO work
Note: OAC does not conduct Operations/TSMO work
Platform could be leveraged “as is”; Some strong practicesKey Platform functional; Upgrades driven by
overall Modernization strategic prioritizationPlatform in need of significant upgrade and/or
support

TSMO: Inter-Agency Comparison (3 of 3)
115
Sub-Function
Agency Maturity Assessment
ObservationsPeople & Organization
Process & Performance
Infrastructure
ITS/Real Time Traffic Management• Traffic/Safety Design• Signal Phase and Timing • Incident and emergency response• Manage travel times and
message boards• Traffic safety/mobility elements of:
- Work zone management- Road weather management
• People – ITS functionality is split between ODOT’s Traffic and Maintenance Divisions. Maintenance focuses more on DMS and messaging, weather conditions, travel time. Whereas Traffic Division focuses on safety, smart work zones, and traffic signals
• People – ODOT doesn’t have the resources to fully execute on Real Time Traffic Management. There are no staff resources devoted to the Virtual TMC. Additionally, Maintenance Division’s in-house forces are primarily dedicated to the Fiber optic expansion and maintenance. OTA does not do any Real Time Traffic Management
• Process – Processes are not integrated across the two ODOT Divisions, and the Virtual TMC is still immature. While processes are individually functional, they are not integrated / documented
• Infrastructure – Traffic signals are maintained by municipalities, but ODOT should maintain these because many rural areas don’t have the resources to maintain them/hire engineers
Operations• Fiber Optic expansion and
maintenance • Maintain ITS Network
• People – Maintenance Division ITS staff are focused more on expansion and maintenance of the infrastructure network (fiber network, etc..). ODOT provides this support to OTA currently, however, the workload requires a dedicated OTA resource
• People – Job classifications for Maintenance ITS Branch limits job advancement• People – When it comes to planning/installing of ITS network, there may be duplication of work
with conflicting results because divisions are not communicating frequently• Process – Although ODOT has multiyear plans for wireless (4 – year) and ITS fiber (5 – year)
projects, it has historically, lacked dedicated funding. As a result, funding is secured on a project basis to expand and maintain the Department’s ITS/Fiber network
• Infrastructure – ODOT’s Maintenance division outsources to OU, hardware and software support for road and weather conditions, dynamic message boards, MobileApp, and snow-plow tracking. OTA’s IT division outsources all fiber to telecommunications companies
ODOT ODOT
OTA OTA
ODOT
OTA
Note: OAC does not conduct Operations/TSMO work
ODOT ODOT
OTA OTA
ODOT
OTA
Note: OAC does not conduct Operations/TSMO work
Platform could be leveraged “as is”; Some strong practicesKey Platform functional; Upgrades driven by
overall Modernization strategic prioritizationPlatform in need of significant upgrade and/or
support

Customer Service: Focus Area Overview
116
Sub-Functions Key Responsibilities ODOT Divisions OTA Divisions OAC Divisions
Customer Service
• Respond to general citizen and elected official requests Respond to and manage citizen litter calls
• Manage Agency social media • Manage call center and store services related to
PIKEPASS account creation, transponder distribution, payments, toll violation processing and resolution support
Media & Public RelationsDistricts Customer Service N/A
Sub-Functions and Agency Breakdown
ODOT
Sub-Functions Footnotes
• ODOT does not have Call Centers or Store Services
• OTA handles all litter callsOTA OAC

Customer Service: ODOT Profile (1 of 2)
117
Dedicated Personnel and Budget
Sub-Function Divisions FTE /% Class*
Personnel Cost*
Consultant Cost**
Customer ServiceMedia & Public
Relations;Districts
8.75 / 100% $711,432 $ -
Leadership and Administrative All 0 N/A $ -
At Large Vacancies All 0 N/A $ -
Total 8.75 $711,432 $-
Volume of Work
Measure ValueNumber of Twitter Social Media Followers 37,814
Number of Twitter Posts 43,484
Number of emails received in generic email inbox N/A
KPI Definition Measure
ODOT does not have specific customer service KPIs
Performance
* FTE, Classification, and Personnel Costs – Sourced from Agency provided Personnel files as of July 2020 ** Consultant Costs – FY19 costs include temp and contract workers

People
ProcessInfrastructure
Customer Service: ODOT Profile (2 of 2)
118
Policies and Procedures Documents
Pain Points
People
• Resolving citizen issues takes up a lot of the Field District’s Construction/Maintenance Engineers' times, which is not their main role, so more support is needed
• Social media has grown a lot recently but it's a challenge to stay up to date with the volume and changing technology environment
• Lack of a dedicated video content development group
Process
• No guiding customer service strategy• No standard processes for managing, tracking, or resolving customer
inquiries within Districts, as a result, calls and emails may not get routed to the right people
• No KPIs to measure customer responsiveness or satisfaction, or ROI of engagement posts
Infrastructure • No CRM/system to track and manage customer inquiries from inception to
resolution. As a result, it’s not clear if, or how quickly, customer calls or emails are resolved
Key Policies and ProceduresNo Policies or Procedures were provided
IT Capabilities
Number of Applications1
Key Applications Function Annual Cost*
Hootsuite Used for managing and monitoring all social media profiles $12K
0% $12KTotal Annualized Cost
Critical Pain Point
% Tailored/User-Developed
*IT cost signified as “$ -” when the cost is an Agency-wide tool, and (where available) cost included in IT Focus Area

Customer Service: OTA Profile (1 of 2)
119
Dedicated Personnel and Budget Volume of Work
Measure Value
Avg number of daily calls handled in 2019 ~3,200
Number of Litter Calls Received in 2019 489
Total Number of active PIKEPASS tags 1.9M
KPI Definition Measure
Calls Handled Percentage of all customer service calls handled 96%
Quality AssuranceQuality Assurance measures the quality of each call, measuring tone, empathy, and correct information
94%
Average Speed of Answer
Average time it takes for a customer to speak with a customer service representative
1:00
Average Handle Time Average time spent with a customer on a call 5:00 – 6:00
Overall Customer Service Satisfaction
Average customer satisfaction score for overall service 4.91/5.00
Performance
Sub-Function Divisions FTE /% Class*
Personnel Cost*
Consultant Cost**
Customer Service Customer Service 99 /82% $5,358,148 $1,245,024
Leadership & Administrative All 6 /
33% $696,615 $ -
Total 105 $6,054,763 $1,245,024
* FTE, Classification, and Personnel Costs – Sourced from Agency provided Personnel files as of July 2020 ** Consultant Costs – FY19 costs include temp and contract workers

Customer Service: OTA Profile (2 of 2)
120
Policies and Procedures Documents
Pain Points
People
• Hiring/Retaining Employees is a challenge as Table of Organization cap limits human capital needs to temporary employees. Moreover, it is difficult to fill vacancies or move people because of regulatory obstacle hurdles
• Training: Limited ability to control training prioritization which impacts vacancies and retention
• Leadership may not recognize the importance of customer service which impacts resource levels and accentuates knowledge gap
Process
Infrastructure
• Difficult to secure IT customer support sufficient to meet business needs • Current customer service technology is tailored for a more mature community,
rather than for younger customers that would like more self-service options• Lack of real-time dashboards limits reporting responsiveness or agile project
management and coordination. Working to secure PowerBI from IT to improve this capability
• Real time access to Accounting Systems is limited, narrowing perspective of budget/accounts/payment/invoices for toll operations
Procedure21%
Report79%
Key Policies and Procedures• PIKEPASS Business Rules & Procedures
• PIKEPASS Functional Responsibilities
IT Capabilities
Number of Applications34
Key Applications Function Annual Cost*
inContact Software used for tracking calls and runs the phone queues for Call Center $376K
Power BI Dashboard reporting $ -
MS Excel Used for scheduling activities $ -
82% $376KTotal Annualized Cost
People
ProcessInfrastructure% Tailored/User-Developed
Critical Pain Point
*IT cost signified as “$ -” when the cost is an Agency-wide tool, and (where available) cost included in IT Focus Area

Customer Service : Inter-Agency Comparison (1 of 2)
121
FTE Classified Personnel –Costs*
Consultant – Cost** Facilities
ODOT 8.8 100% $711K $0 4
OTA 105 79% $6.1M $1.2M 1
OAC 0 N/A N/A N/A N/A
Total 113.8 80% $6.8M $1.2M 5
Dedicated Personnel and Budget Volume and Performance
Agency Volume Performance
ODOT
• Twitter Social Media Followers: 37,814
• Twitter Posts: 43,484• Emails received in generic email
inbox: N/AN/A
OTA
• Twitter Social Media Followers: 11,900
• Twitter Posts: 4,045• Avg number of daily calls
handled: ~1,900• Litter Calls Received in 2019:
489• Active PIKEPASS tags:1.9M
• Calls Handled: 96%• Quality Assurance: 94%• Average Speed of Answer: 1:00• Average Handle Time: 5:00-6:00• Overall Customer Service
Satisfaction: 4.91/5.00
OAC N/A N/A
IT Spend
ODOT$12K
$376K OTA
N/A OAC
Key Common IT Applications
Function ODOT OTA OAC
Call Center Management N/A inContact N/A
Dashboards N/A Power BI N/A
Social Media Management Hootsuite N/A N/A
* FTE, Classification, and Personnel Costs – Sourced from Agency provided Personnel files as of July 2020 ** Consultant Costs – FY19 consultant costs

Customer Service: Inter-Agency Comparison (2 of 2)
122
Sub-Function
Agency Maturity Assessment
ObservationsPeople & Organization
Process & Performance
Infrastructure
Customer Service• Respond to general citizen and
elected official requests Respond to and manage citizen litter calls
• Manage Agency social media • Manage call center and store
services related to PIKEPASS account creation, transponder distribution, payments, toll violation processing and resolution support
• People – No centralized general customer service at ODOT. Marketing/Communications and Field District staff respond to customers at ODOT. OTA Customer Service Division handles PIKEPASS issues, not general customer service related to roads, which is handled by Communications/Maintenance staff
• People – OTA’s Customer Service staff are also performing activities that are typically done by back-office support
• Process – ODOT does not have a strategy, processes, or KPIs related to customer service. OTA customer service does have processes and KPIs in placed related to PIKEPASS, but not necessarily around general roadway customer service. OTA Maintenance leadership report that they receive customer complaints via email, and they are handled within 5 business days. However, it’s not clear the origin of the emails and resolution is not tracked
• Infrastructure – ODOT has an email account which citizens can respond to but does not track inquiries/resolutions through any tool. OTA tracks all call center PIKEPASS but does not track general customer service from inquiry to resolution. VueWorks may have the capability to track inquiries to resolution
• Infrastructure – OTA currently utilizes inContact, which is an OMES owned call center software, but are actively looking to move away from the platform. OTA makes it convenient for customers to make payment transactions over the phone or in person, which can also be completed online by the customer. Automation could enable staff to provide more general support to customers
ODOT ODOT
OTA OTA
ODOT
OTA
Note: OAC does not have a dedicated apparatus to manage customer service
Platform could be leveraged “as is”; Some strong practicesKey Platform functional; Upgrades driven by
overall Modernization strategic prioritizationPlatform in need of significant upgrade and/or
support
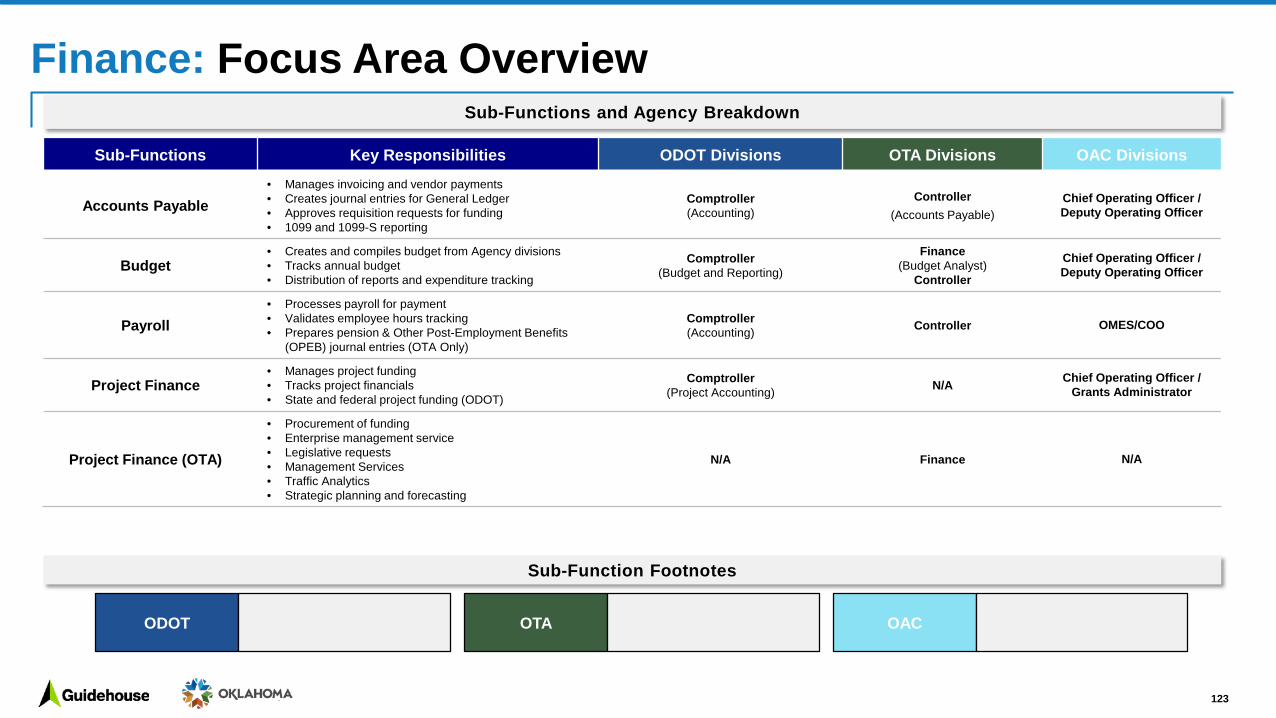
Finance: Focus Area Overview
Sub-Functions Key Responsibilities ODOT Divisions OTA Divisions OAC Divisions
Accounts Payable• Manages invoicing and vendor payments• Creates journal entries for General Ledger• Approves requisition requests for funding• 1099 and 1099-S reporting
Comptroller(Accounting)
Controller(Accounts Payable)
Chief Operating Officer / Deputy Operating Officer
Budget• Creates and compiles budget from Agency divisions• Tracks annual budget • Distribution of reports and expenditure tracking
Comptroller(Budget and Reporting)
Finance(Budget Analyst)
Controller
Chief Operating Officer / Deputy Operating Officer
Payroll• Processes payroll for payment• Validates employee hours tracking• Prepares pension & Other Post-Employment Benefits
(OPEB) journal entries (OTA Only)
Comptroller(Accounting) Controller OMES/COO
Project Finance• Manages project funding• Tracks project financials• State and federal project funding (ODOT)
Comptroller(Project Accounting) N/A Chief Operating Officer /
Grants Administrator
Project Finance (OTA)
• Procurement of funding• Enterprise management service• Legislative requests• Management Services• Traffic Analytics• Strategic planning and forecasting
N/A Finance N/A
Sub-Functions and Agency Breakdown
Sub-Function Footnotes
ODOT OTA OAC
123

Finance: Focus Area Overview
Sub-Functions Key Responsibilities ODOT Divisions OTA Divisions OAC Divisions
Reporting• GAAP reporting (CAFR, quarterly bondholders• Monthly trust reporting - OTA Only)• Additional Financial reporting (CAFR, asset reporting)• Creates journal entries for General Ledger
Comptroller(Budget and Reporting) Controller Chief Operating Officer /
Deputy Operating Officer
Revenue
• Customer service manages payment intake (OTA Only)• Toll collection proceeds (OTA Only)• Accounts receivable (revenue and construction for OTA)• Account reconciliations• Managing revenue stream (tax revenue, state & federal
funds)• Acquires funding for projects (state and federal funding,
bond proceeds drawdown)
Comptroller(Budget and Reporting)
Customer ServiceToll Division
Controller
Chief Operating Officer / Deputy Operating Officer
Revenue Assurance (OTA)• Acquires funding for projects• Secures revenue stream to pay off debt (Tolls, bonds)• Bondholder relationships• Trust related activities
N/A Finance N/A
Right of Way (ROW) Accounting
• Clears ROW prior to construction• Sets up and manages ROW projects• Accounts for and reports on depreciable and non-
depreciable asset
Comptroller(ROW Accounting) Controller N/A
Sub-Functions and Agency Breakdown
Sub-Function Footnotes
ODOT • N/A OTA • N/A OAC • ROW accounting
124

125
Dedicated Personnel and Budget Volume of Work
Measure Value
Zero variance for budget by year end$1.2B Total$1B Capital
$200M Operating
Number of project invoices processed monthly 10-15 invoices
Number of claims processed annually 40.6K claims
GAAP accounting season packets prepared 17-23 packets
Average projects created in system annually 1205 projects
KPI Definition Performance Measurement
Timeliness of reports• Budget• Financial Reporting
Submitting reports on or before the due date • 100% Timeliness
Accuracy of • Billing• Requisitions• Journal Entries (JVs)• Deferred revenue
Reports have few errors after submitted for approval
• FHWA Billing: 96.16-98.08% accuracy
• Bonds: 92.01-95% accuracy• Deferred Revenue: 92.01-95%
accuracy
Invoice/claims processing time Turnaround time
• 6 days turnaround time for claims
• Prior JVs submitted in under 10 days
Payroll hours validation Validating employee hours • Monitored until 100% accurate
Performance
* FTE, Classification, and Personnel Costs – Sourced from Agency provided Personnel files as of July 2020 ** Consultant Costs – FY19 consultant costs
Sub-Function Divisions FTE /% Class*
Personnel Cost*
Consultant Cost**
Accounts Payable / Payroll Comptroller 19 / 100% $1,931,479 -
Budget & Reporting Comptroller 8 / 0% $760,568 $66,648
Project Finance Comptroller 12 / 100% $1,130,483 -
Revenue Comptroller 4 / 100% $388,907 -
ROW Accounting Comptroller 7 / 100% $721,127 -
Vacant Comptroller 15 / 93% $1,457,681 -
Total 65 $6,390,245 $66,648
Finance: ODOT Profile (1 of 2)

Finance: ODOT Profile (2 of 2)
People
ProcessInfrastructure
People & Organization
• Difficult to have a career path in an environment where demographics are very tenured, not a lot of movement up
• Lack of documentation given level of people retiring/leaving the Agency• Lack of ability to measure people performance; people’s strengths are not fully
utilized• Division budget request management could be improved
Process & Procedures
• Inefficiency between Payroll in comptroller and HR• No process to capture knowledge and standard work• Budget process is inefficient, processes are siloed• Lacking organization-wide KPI measures (vs individual PMPs)
Infrastructure
• Need infrastructure to increase automation, especially to connect the front end (budget, requests, invoice), with the back end (accounts payable)
• Double entry into ODOT mainframe and OMES Peoplesoft Financials system• Significant number of paper and manual processes• ODOT relies on OMES for all Application Xtender changes, and they do not have
access to make any changes themselves
Pain Points
Policies and Procedures Documents
Policy40%
Procedure9%
Report51%
Key Policies and Procedures• Standardized accounts payable procedures across all Districts
• Standardized accuracy and timeliness measures for reporting
• Strict segregation of duties
IT Capabilities
Number of Applications15 33% % Tailored/User-
Developed $1.8MTotal Annualized Cost
Key Applications Function Annual Cost*
ODOT mainframe Financial tracking system from the 1980s for data entry and storage $1.2M
Peoplesoft Financials State finance tracking system $50K
Oracle BI Report Generation $59K
BIS Document scanning $28K
Application Xtender Document Storage $-
Grooper Document management and automation $500K
Critical Pain Point
*IT cost signified as “$ -” when the cost is an Agency-wide tool, and (where available) cost included in IT Focus Area
126

127
Dedicated Personnel and Budget
Sub-Function Divisions FTE / %
ClassPersonnel
BudgetConsultant
Cost**
Accounts Payable Controller 4 / 100% Hidden -
Budget & Reporting Finance 2 / 0% Hidden $270,000
Payroll Controller 3 / 33% Hidden -
Project Finance Finance 1 / 0% Hidden -
Revenue ControllerFinance 4 / 0% Hidden -
Leadership ControllerFinance 3 / 0% Hidden $2,090,000
Vacant ControllerFinance 2 / 0% Hidden -
Total 19 $1,871,479 $2,360,000
Volume of Work
Measure Value
Volume of payments
Monthly: 70 checks generated, 300-400 PikePass refund checks, 900-
1100 revolving checks, 150 requisitions
Number of payroll payments processed monthly 515-520 payments
KPI Definition Performance Measurement
Bond Rating Yearly rating from bondholders • Highest bond rating
Accuracy of • Financial
Statements• CAFR
Accuracy of reports • Has won awards for GFOA annually
Timeliness of reports:• Payroll• Invoices
Reports submitted on time
• Payroll: must be submitted to OMES 5 days before payday
• Invoices: Paid the week after it’s received
Payroll hours accuracy
Accuracy of employee hours before entry into Peoplesoft • ~100%
Performance
* FTE, Classification, and Personnel Costs – Sourced from Agency provided Personnel files as of July 2020 ** Consultant Costs – FY19 consultant costs
Finance: OTA Profile (1 of 2)

% Tailored/User-Developed
People
ProcessInfrastructure
People
• Everyone wears many hats; staff is stretched thin, rely on heroics; no ability to take on more initiatives with existing resources
• Lack of documentation given people retiring/leaving the Agency, need to capture tribal knowledge
• Compensation impacting turnover and skilled hires (Controller and Finance) • People are spread thin; don’t have time to document processes or participate in
trainings
Process
• Standardization for budget practice coaching within different OTA divisions • End-to-end mapping of AP would be beneficial• KPIs not formally tracked in many areas• Revenue calculation is very manual• Workload and expectations• Information is siloed in some areas (e.g. mistakenly turned IVIS on at a Turnpike
then it drastically changed the financial reports but no communication with Finance division)
Infrastructure
• Need increased level of automation to increase efficiency (Power BI Dashboard for near-real-time budget viewing in TEST mode currently)
• IT that supports end-to-end mapping of Accounts Payable process is cumbersome and needs to be automated
• 150 people without employee self-service access to earning statements
Finance: OTA Profile (2 of 2)
128
Policies and Procedures Documents
Pain Points
Policy25%
Procedure10%
Report65%
Key Policies and Procedures• Reports: Budget, CAFR
• Recorded significant Operating Accounting Policies
• Monthly tracking of account balances
• Credit Card transaction summaries
IT Capabilities
Number of Applications13 38% $89K
Total Annualized Cost
Key Applications Function Annual Cost*Platinum Epicor (includes Crystal) Accounting software $40K
Spreadsheet Server/Budget Accelerator Storage of spreadsheets $22K
Critical Pain Point
Additional key apps: Insight, Sage (Fixed Asset), Violation Enforcement System, PlatePay system, CE, Kronos, Host (KEY), EPPS, Sign Now, Adobe, Spreadsheet Server
*IT cost signified as “$ -” when the cost is an Agency-wide tool, and (where available) cost included in IT Focus Area

129
Dedicated Personnel and Budget
Sub-Function Divisions FTE / %
ClassPersonnel
BudgetConsultant
Cost**
Accounts Payable Operations 1 / 0% Hidden -
Budget & Reporting Operations 0.4 / 0% Hidden -
Payroll OMES/Operations 0.1 / 0% Hidden -
Project Finance Operations 0^ Hidden -
Revenue Operations 0.5 / 0% Hidden -
Total 2 Hidden -
Volume of Work
Measure ValueRevenue from taxes monthly ~$350K/month
Annual P-card transactions ~170 transactions/year
Annual budget breakdown
83% Airport assistance11% Admin/operations
5% Aviation education program1% IT expenses
Number of open projects being managed ~50 projects
KPI Definition Performance Measurement
Timeliness of reports• Quarterly Budget• Financial Reporting
Submitting reports on or before the due date • 100% Timeliness
Invoice Turnaround Time Vendor payment invoice • Processed within 5 days
Travel Expense Turnaround Time Expense reports related to travel • Processed within 2 days
Performance
* FTE, Classification, and Personnel Costs – Sourced from Agency provided Personnel files as of July 2020 ** Consultant Costs – FY19 consultant costs
^OAC Project finance is accounted for in Project Setup in the Construction focus area
Finance: OAC Profile (1 of 2)

People
ProcessInfrastructure
People• Only two people managing all operations, short staffed and everyone wears
multiple hats• Need for additional cross-training
Process • Few KPIs• Balancing hitting milestones while achieving the day-to-day
Infrastructure • Financial reporting in Excel could be formalized
Finance: OAC Profile (2 of 2)
130
Policies and Procedures Documents
Pain Points
Report100%
Key Policies and Procedures• FY21 Budget Report
• Quarterly budget reports to state
• Uses state templates and processes for financial reporting
• Financial Reporting to Commission
IT Capabilities
Number of Applications2 0% $0
Total Annualized Cost
Key Applications Function Annual Cost*
Peoplesoft Financials State finance tracking system $ -
Microsoft Suite Excel used to record data and reports $ -
OAC IT costs centralized in IT focus area
% Tailored/User-Developed
Critical Pain Point
*IT cost signified as “$ -” when the cost is an Agency-wide tool, and (where available) cost included in IT Focus Area

Finance: Inter-Agency Comparison (1 of 3)
131
FTE Classified Personnel –Costs*
Consultant –Cost**
ODOT 65 100% $6M $67K
OTA 19 22% $2M $2M
OAC 2 0% Hidden -
Total 86 80.7% $8M $2.4M
Dedicated Personnel and Budget Volume and Performance
Agency Volume Performance
ODOT
• # of Annual Claims: 40.6K • # of Annual GAAP accounting
season packets prepared: ~20k• # of monthly project invoices
processed: 10-15
• Turnaround time for processing claims: 6-day
• Payroll hours validation accuracy: 100%
• Billing, requisitions, Journal entry accuracy rate: 92-98%
OTA
• # of monthly checks generated: ~70
• # of monthly PikePass refund checks : 300-400
• # of monthly revolving checks monthly: 300-400
• # of monthly requisitions: ~150
• Payroll hours validation accuracy: 100%
• High accuracy of financial statements
• Accounting awards annually
OAC
• # of annual P-card transactions: ~170
• # of concurrent open projects being managed: ~50
• Timeliness on quarterly budget and financial reporting: 100%
• Turnaround time for invoices: 5 days
• Processing time for travel expense reports: 2 days
IT Spend
ODOT$1.8M
$89K OTA
- OAC
Key Common IT Applications
Functionality ODOT OTA OAC
Financial Reporting/
payroll
Peoplesoft Financials/
TSO (ODOT Mainframe)
Peoplesoft Financials
Peoplesoft Financials
Financial Tracking/
Accounting
TSO (ODOT Mainframe) Platinum Epicor Peoplesoft
Financials
Report generation Oracle BI
Power BI, Spreadsheet
Server, Crystal, SSRS
Excel
Budgeting software
Equipment Watch
Budget Accelerator
Peoplesoft Financials
* FTE, Classification, and Personnel Costs – Sourced from Agency provided Personnel files as of July 2020 ** Consultant Costs – FY19 consultant costs

Finance: Inter-Agency Comparison (2 of 3)
Sub-Function
Agency Maturity Assessment
Supporting ObservationsPeople & Organization
Process & Performance
Infrastructure
Revenue• Accounts receivable• Acquires funding for projects• Account reconciliations• Managing revenue stream (Tolls, bonds,
tax revenue)
• People - OTA stretched and firefighting to achieve goals; OAC historical know how/leverage skills elsewhere; ODOT has strong PMPs, yet leadership and management feels some people are underutilized
• People - All Agencies risk impact of knowledge exit with retirements and all need better documentation• Process - ODOT has rigorous individual KPIs, and policies and procedures are rooted in well defined state,
federal requirements; OAC, OTA procedures lack documentation and reside with actual staff members• Process - All Agencies manage to timeliness and accuracy KPIs; OTA prioritizes intact revenue stream• Infrastructure - OTA process execution is manual and needs automation
Budget• Creating and tracks annual budget
• People - OTA connects and coaches every area on prep and iterations; ODOT does not train, and has limited standard work, and operates within silos. In addition, ODOT/OTA/OAC - need career path plans for tenured resources where mobility is limited
• Process- ODOT is more siloed with budget mgmt.. at divisions and could benefit from connecting front end budget w/backend A/P
• Process - OTA provides good budget coaching for timeliness and quality and has strong KPIs; OAC’s internal budgeting process is efficient
• Infrastructure - ODOT has multiple systems and could reduce manual steps; OTA uses budget accelerator that breaks down frequently; OAC submits budget in accordance with state requirements (through Excel)
Accounts Payable / Purchasing• Manages invoicing and vendor payments• Creates journal entries for General
Ledger• Approves requisition requests for funding
• People – There are concerns with ODOT’s knowledge capture; OTA is starting to store knowledge on shared drives, especially since new employees require extensive on-the-job training
• People – ODOT is headed in the right direction, new supervisor increased communication• Process - OTA and ODOT have solid KPIs e.g. Invoices paid, timeliness, claims/turnaround, training • Process – There are several efficiency opportunities at ODOT and OTA: ODOT can reduce process steps /
handoffs between depts; OTA can eliminate steps/manual moves; connect front end budget to backend AP• Infrastructure - OTA – involves Heavy manual inputs and Custom Software; ODOT – has 2 systems, and
Peoplesoft services failed twice before; OAC uses single system (Peoplesoft Financials)
ODOT ODOT
OAC
OTA
OAC
OTA
ODOT
OTA
OAC
ODOT ODOT
OAC
OTA
OAC
OTA
ODOT
OTA
OAC
ODOT ODOT
OAC
OTA
OAC
OTA
ODOT
OTA
OAC
Platform could be leveraged “as is”; Some strong practicesKey Platform functional; Upgrades driven by
overall Modernization strategic prioritizationPlatform in need of significant upgrade and/or
support
132

Finance: Inter-Agency Comparison (3 of 3)
Sub-Function
Agency Maturity Assessment
Supporting ObservationsPeople & Organization
Process & Performance
Infrastructure
Project Finance• Manages project funding• Tracks project financials
• People - OTA is stretched thin with few resources, and training is provided by division head; Leadership is concerned with resources to digitize collections; ODOT trains resources to be utility players, and training is led by leader
• Process - ODOT has strong KPIs, and procedures are rooted in rigorous state and federal requirements; KPIs at OTA are not formally tracked, though staff work closely with divisions to manage projects internally to hit end dates; OTA has signified great concern with lacking process infrastructure for AET
• Infrastructure - ODOT needs to transition away from mainframe from 1985; OTA utilizes various spreadsheets and manual systems for tracking spending and project costs; There exists automation priorities across Agencies
Reporting/Asset Tracking• GAAP reporting• Additional Financial reporting (CAFR,
asset reporting)
• People – ODOT lacks ability to measure roles and personnel constrained in work• Process – OTA has won accounting awards; ODOT has clear reporting KPIs • Infrastructure - Automation priorities at ODOT need to be defined and linked to other processes e.g. AP;
OTA is moving away from manual paper processes, some new dashboards created for metrics; OAC does all reporting in Excel which is very manual
Payroll• Processes payroll for payment• Validates employee hours tracking
• People - OTA is “downloading” institutional knowledge to the shared drives and provides extensive on the job training; ODOT provides training as alternate to limited mobility upward
• Process - ODOT includes multiple depts (HR/Payroll) in validating to avoid fraud; OTA has clear reporting KPIs
• Process - Common issue across Agencies is knowledge capture for standard work, knowledge management systems
• Infrastructure - ODOT has an opportunity to reduce 2 systems to one; OTA could automate and take advantage of self services opportunities
Right of Way (ROW)• Clears ROW prior to construction• Sets up and manages ROW projects
• People - Building out PMPs for individuals; coaching day to day; meet biannually• Process – Process efficiency and effectiveness: ODOT - solid KPIs and wants to be more streamlined• Infrastructure – Reduction of level of paper in processes
ODOT ODOT
OAC
OTA
OAC
OTA
ODOT
OTA
OAC
ODOT ODOT
OAC
OTA
OAC
OTA
ODOT
OTA
OAC
ODOT ODOT
OAC
OTA
OAC
OTA
ODOT
OTA
OAC
ODOT ODOTODOT
Note: OTA and OAC does not include ROW in Finance
Platform could be leveraged “as is”; Some strong practicesKey Platform functional; Upgrades driven by
overall Modernization strategic prioritizationPlatform in need of significant upgrade and/or
support
133

Human Resources: Focus Area Overview
134
Sub-Functions Key Responsibilities ODOT Divisions OTA Divisions OAC Divisions
Payroll
• Ensures employees are paid accurately and on time by producing accurate time reporting
• Makes changes/promotions in employee file• Manages federal and labor law compliance• Manages OTA leave system and matches it to Peoplesoft (OTA only)
Human ResourcesController Division
Administrative Services(Human Resources)
OMES
Operations• Manages benefits, recruiting, unemployment claims, supervisory workshop
enrollment, security awareness training, onboarding, FMLA, employee badge security access, and changes to employee file
• Works with OMES for retirement and insurance
Human Resources Administrative Services(Human Resources) Operations
Printing • Handles printing files and documentation needed• Currier services, mailroom, bank runs for all OTA divisions (OTA only) Office Services Administrative Services
(Procurement) N/A
Safety• Keeps employees safe and reduces risk, mainly for maintenance and toll divisions• Drug screening• Manages worker compensation, accident investigations, oversees CDL requirements,
evaluates all physicals from employees
Human Resources Administrative Services(Safety) Airport Division
Training• Develops specific training for organization, customer service• Manages all HR, SPOT trainings, and safety training• Runs the customer service new hire program (OTA)• Uses Learn system through OMES
Human Resources Administrative Services(Training) Position-specific
Leadership & Support
• Compensation, budget management, policy/procedure compliance, grievance management
• Centralized controls over employee management to mitigate risk of litigation• Manages and oversees Human Resources, Procurement• Ensures all disciplinary actions are consistent• Case management, liaisons with HR attorney on any litigation (OTA)• Complies with all Federal & State Regulations including Title VII (OTA)
Human Resources Administrative Services Chief Operations Officer
Sub-Functions and Agency Breakdown
Sub-Function Footnotes
ODOT• Printing• ODOT recruitment occurs in
Training & DevelopmentOTA • Knowledge Management
Committee OAC • No in-house training
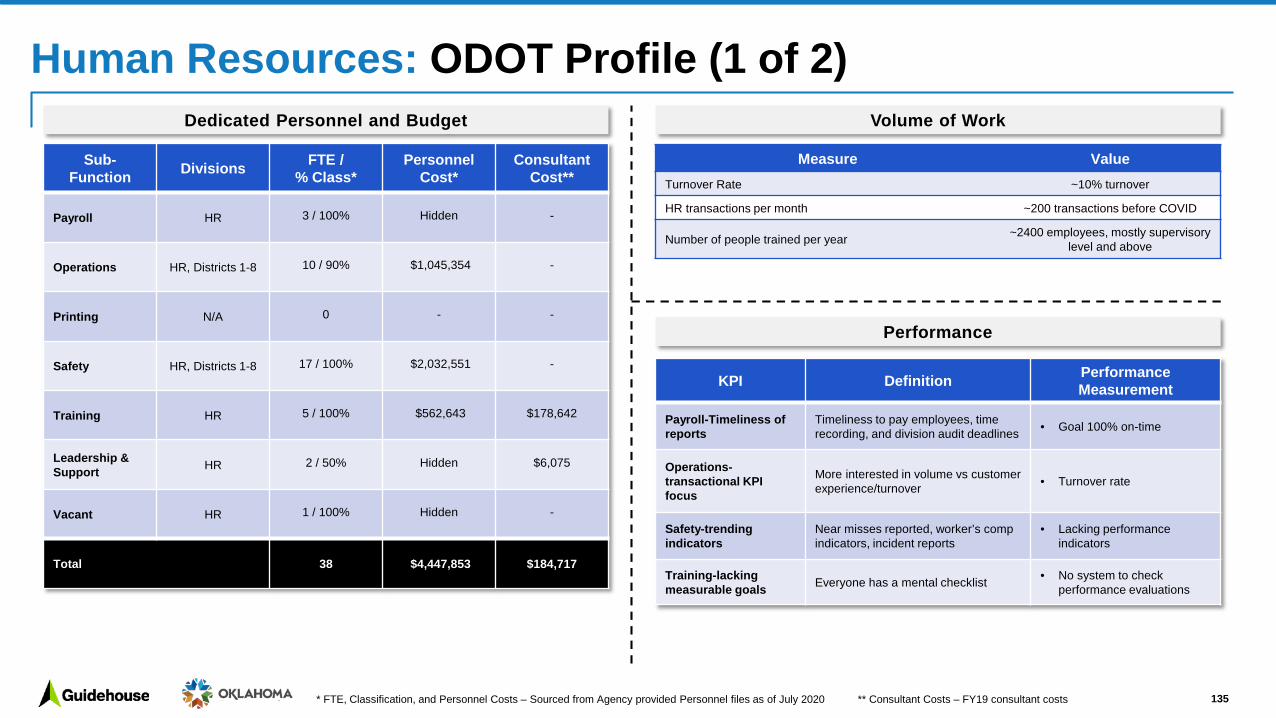
135
Dedicated Personnel and Budget
Sub-Function Divisions FTE /
% Class*Personnel
Cost*Consultant
Cost**
Payroll HR 3 / 100% Hidden -
Operations HR, Districts 1-8 10 / 90% $1,045,354 -
Printing N/A 0 - -
Safety HR, Districts 1-8 17 / 100% $2,032,551 -
Training HR 5 / 100% $562,643 $178,642
Leadership & Support HR 2 / 50% Hidden $6,075
Vacant HR 1 / 100% Hidden -
Total 38 $4,447,853 $184,717
Volume of Work
Measure ValueTurnover Rate ~10% turnover
HR transactions per month ~200 transactions before COVID
Number of people trained per year ~2400 employees, mostly supervisory level and above
KPI Definition Performance Measurement
Payroll-Timeliness of reports
Timeliness to pay employees, time recording, and division audit deadlines • Goal 100% on-time
Operations-transactional KPI focus
More interested in volume vs customer experience/turnover • Turnover rate
Safety-trending indicators
Near misses reported, worker’s comp indicators, incident reports
• Lacking performance indicators
Training-lacking measurable goals Everyone has a mental checklist • No system to check
performance evaluations
Performance
* FTE, Classification, and Personnel Costs – Sourced from Agency provided Personnel files as of July 2020 ** Consultant Costs – FY19 consultant costs
Human Resources: ODOT Profile (1 of 2)

20 35% $1.9M
People
ProcessInfrastructure
People
• Cultural misalignment: No incentive for employees to attend training• Identified need for emphasis on people and additional career development• Large percentage of staff retiring with no documentation of roles & responsibilities• HR liaison and safety staff reporting structure drives local needs vs system focus• Employees need more technology training, slow to embrace new technology
Process• Limited KPIs, and they are not integrated into PMPs• Many manual processes, still using paper and physically sending around copies• Distractions when running payroll makes process more difficult to complete• Internal communication could be improved
Infrastructure • TSO outputs a lot of paper waste• Many HR system used, workday may reduce number of HR systems used• Lack safety tracking systems
136
Policies and Procedures Documents
Pain Points
Policy27%
Procedure6%
Report67%Key Policies and Procedures
• Strict deadlines for payroll and works with OMES human capital management division
• Online training through OMES, uses facility for in-person training
• Safety procedures and policies governed by Public Employee Safety Occupation Program
IT Capabilities
Number of Applications
Total Annualized Cost
Key Applications Function Annual Cost*
CORE Employee Management HCM system for HR $170K
ODOT Mainframe/TSO Data entry and storage $1.2M
LinkedIn Learning HR Trainings $13K
Grooper (annual renewal) Electronification of employee information $500K
% Tailored/User-Developed
Critical Pain Point
*IT cost signified as “$ -” when the cost is an Agency-wide tool, and (where available) cost included in IT Focus Area
Human Resources: ODOT Profile (2 of 2)

137
Dedicated Personnel and Budget
Sub-Function Divisions FTE /
% Class*Personnel
Cost*Consultant
Cost**
Payroll Administrative Services
1 / 100% Hidden -
Operations Administrative Services
1 / 100% Hidden -
Printing Administrative Services
1 / 100% Hidden -
Safety Administrative Services
1 / 0% Hidden -
Training Administrative Services
3 / 0% Hidden -
Leadership & Support
Administrative Services
2 / 50% Hidden -
Vacant Administrative Services
1 / 100% Hidden -
Total 10 $960,455 -
Volume of Work
Measure ValueNumber of individual turnpike trainings annually 40 in-person facilitated trainings/year
Number of HR transactions per month Business driven (higher in months with more new hires)
KPI Definition Performance Measurement
Complaints received Number of complaints received • Minimized as close to 0 as possible
Payroll accuracy and timeliness
Payroll information submitted accurately and on time
• No payroll errors• Payroll deadlines are mid-
month and end of month
Turnover rate Percent of employees leaving/number of employees
• 12-14% annually• Equipment
operators• Toll collectors• Market-driven
Incident rate Incident rate is number of incidents per hour of work
• Below 1 injury/hour worked (currently at 0.7)
Performance
*One additional Administrative services staff in the Procurement focus area
* FTE, Classification, and Personnel Costs – Sourced from Agency provided Personnel files as of July 2020 ** Consultant Costs – FY19 consultant costs
Human Resources: OTA Profile (1 of 2)

People
ProcessInfrastructure
People
• It takes a long time to develop trainers to conduct training for the customer service new hire program
• Compensation and redundancy of staffing levels• Documentation and cross-training amidst people retiring/leaving the Agency• Communication for interdependent/interdepartmental impacts
Process• Onboarding could be moved to online system, currently in process of developing
process• COVID has greatly impacted hiring, employees, and resources
Infrastructure
• Learning Management System (LMS) is not customizable, managers cannot track their employee trainings directly
• Limited hardware dedicated to training (only one per plaza)• Homemade leave system is very taxing and manual• Need to digitize files• OTA Leave system; at times can be difficult for HR to make corrections and
adjustments
Human Resources: OTA Profile (2 of 2)
138
Policies and Procedures Documents
Pain Points
Policy76%
Procedure7%
Report17%
Key Policies and Procedures• Procedure: Works with OMES benefits group and OMES
insurance group
• Procedure: Sends complete payroll information to payroll group in Controller
• Uses OMES for Learning Management System (LMS) for employee training and training tracking, as well as in-house OTA core training and materials
• Federal and State laws, and OTA policy compliance
IT Capabilities
Number of Applications6 25% $64K
Total Annualized Cost
Key Applications Function Annual Cost*
OTA Leave System Legacy system to record leave time In-house
CORE Employee Management System HCM system $42K
Zoom Conferencing Virtual meeting software $-
Adobe Creative Cloud Document and content creation software services $15K
Benefit Administrative System Employee benefits system Through OMES
% Tailored/User-Developed
Critical Pain Point
*IT cost signified as “$ -” when the cost is an Agency-wide tool, and (where available) cost included in IT Focus Area

139
Dedicated Personnel and Budget
Sub-Function Divisions FTE /
% Class*Personnel
Cost*Consultant
Cost**
Payroll N/A-OMES 0 N/A -
Operations Operations 0.25 / 0% Hidden -
Printing N/A N/A N/A -
Safety Airport Division 0 N/A -
Training Division-specific 0 N/A -
Total 0.25 Hidden -
Volume of Work
Measure ValueHR-related questions per month ~10 questions
Training hours per year 16 hours target
Annual turnover rate 40% annually
Payroll information sent to OMES per month All 10-11 employee hours and time-cards
KPI Definition Performance Measurement
Increased staff moraleStreamlining and clarifying HR operations to improve staff longevity and morale
• Decreased turnover rate (40% currently)
Performance
* FTE, Classification, and Personnel Costs – Sourced from Agency provided Personnel files as of July 2020 ** Consultant Costs – FY19 consultant costs
Human Resources: OAC Profile (1 of 2)

People
ProcessInfrastructure
People• Turnover rate is high• Staff is stretched thin and wear multiple hats• HR process solidification would improve staff longevity and morale• No formalized training program (Some coordination for 16 hours on PMP)
Process • Weaker organizationally with KPIs• Hiring process needs refining
Infrastructure • Could use Peoplesoft system like ODOT instead of outsourcing to OMES• No system to track training across Agency
Human Resources: OAC Profile (2 of 2)
140
Policies and Procedures Documents
Pain Points
50% Policy50% Procedure
Key Policies and Procedures• Employee handbook (in need of updates)
• Internal accounting procedures
IT Capabilities
Number of Applications1 0% $780
Total Annualized Cost
Key Applications Function Annual Cost*CORE Employee Management System HCM for OAC $780
% Tailored/User-Developed
Critical Pain Point
*IT cost signified as “$ -” when the cost is an Agency-wide tool, and (where available) cost included in IT Focus Area

Human Resources: Inter-Agency Comparison (1 of 3)
141
FTE Classified Personnel –Costs*
Consultant –Cost**
ODOT 38 94.7% $5M $185K
OTA 10 40% $960K -
OAC 0.25 0% - -
Total 53.25 85% $6M $185K
Dedicated Personnel and Budget Volume and Performance
Agency Volume Performance
ODOT
• Annual turnover rate: ~10%• # of monthly HR transactions
(pre-COVID): ~200 • # of employees trained annually:
~2,400
• % Payroll reports timeliness: Goal of 100%
• OMES Employee engagement 2019
OTA
• Annual # of individual turnpike trainings: 40
• Annual turnover rate: 12-14%
• Reduction in # of complaints received
• % Payroll reports timeliness• Reduction in # of payroll errors• Staff injury rate/hour worked: 0.7• OMES Employee engagement
2020
OAC
• # of monthly HR transactions (pre-COVID): 10
• # of projected training hours per year: ~16
• Annual turnover rate: ~40% • Employee payroll information
sent to OMES monthly: ~10 – 11
• Staff morale by clarifying HR operations
• OMES Employee engagement 2020
IT Spend
ODOT$1.9M
$64K OTA
0.8K OAC
Key Common IT Applications
Function ODOT OTA OAC
HCM system
CORE Emp. Mgmt.
CORE Emp. Mgmt.
CORE Emp. Mgmt.
HR Training
OMES, other online training sites, ODOT
tracks in Excel
OMES, other online training sites, Custom TEDM (track
trainings)In-house training
OMES, other position-
specific tools
Payroll System
*Moving to WD 2022
TSO (Cobalt), CORE Emp.
Mgmt.
CORE Emp. Mgmt. N/A
Employee data storage
TSO (Cobalt), CORE,
Grooper/AX
Access Database, OTA Leave
System, CORE, Grooper/AX
CORE, Shared drive
* FTE, Classification, and Personnel Costs – Sourced from Agency provided Personnel files as of July 2020 ** Consultant Costs – FY19 consultant costs

Human Resources: Inter-Agency Comparison (2 of 3)
Sub-FunctionAgency Maturity Assessment
Supporting ObservationsPeople & Organization
Process & Performance
Infrastructure
Operations• Manages benefits, recruiting,
unemployment claims, supervisory workshop enrollment, security awareness training, password resets, onboarding, career/promotion, grievances, changes to employee files, HR Policy
• Works with OMES for retirement and insurance
• People - ODOT has a great culture; Emphasis needs to be more people vs. product; Career development exists but not career planning; desire to build better internal development programs e.g. leadership academy and developing leaders to be supervisors and managers. OTA has lots of retirement ready FTE and has concerns re: knowledge transfer; OAC – Need a focus on morale across most functions; everyone wears 4-6 hats; 40% high turnover rate
• People – ODOT’s structure includes HR liaisons reporting to District resources and measures tied to local needs of 8 Districts’ needs vs. overall system; training to use technology is a challenge
• Process – ODOT has limited KPIs with more volume measures, e.g. # reports vs. useful data; underlying data and processes are clean, but paper-based; and people doing too much busy work; OTA –Internal OTA-wide communication; OAC – weaker organizational KPIs and overall people focus is critical
• Infrastructure - ODOT has to Double enter transactions due to two systems: TSO and Peoplesoft for Federal; In addition, there is fragmented HR systems at the State and same info entered over and over (name, SS, address, dependents). e.g. HR payroll, separate system for benefits info; another for retirement. OAC – all transactions go through OMES and 3rd party consultant NTT can often make responsiveness a challenge
• Infrastructure - OTA: is moving files to electronic, onboarding, etc.
Payroll• Ensures employees paid accurately and on
time• Makes changes/promotions in employee
file• Manages federal and labor law compliance• Manages OTA leave system and matches
it to Peoplesoft
• People – ODOT faces impending retirement of critical staff, and more broadly faces a significant % of eligible retirements leading to knowledge loss risk, demonstrating a need to document or shadow replacements
• Process - ODOT has limited KPIs; heroics to address gaps before payroll run; clerks enter time into oracle sent to Peoplesoft, audits to ensure accuracy, after finished run process routes through TSO again; inefficient for HR Operations, yet TSO needed for payroll (Federal fund financials). OAC leader has shared service process with OMES partner
• Infrastructure – With ODOT, TSO accurate yet produces lot of paper and excel spreadsheets are a new adoption, yet each staff member does things their own way. OTA has a homegrown leave system and alsouses word, excel, Visio, and old personnel database. OAC could possibly leverage Peoplesoft vs. OMES for Payroll
ODOT ODOT
OAC
OTA
OAC
OTA
ODOT
OTA
OAC
ODOT ODOT
OAC
OTA
OAC
OTA
ODOT
OTA
OAC
Platform could be leveraged “as is”; Some strong practicesKey Platform functional; Upgrades driven by
overall Modernization strategic prioritizationPlatform in need of significant upgrade and/or
support
142
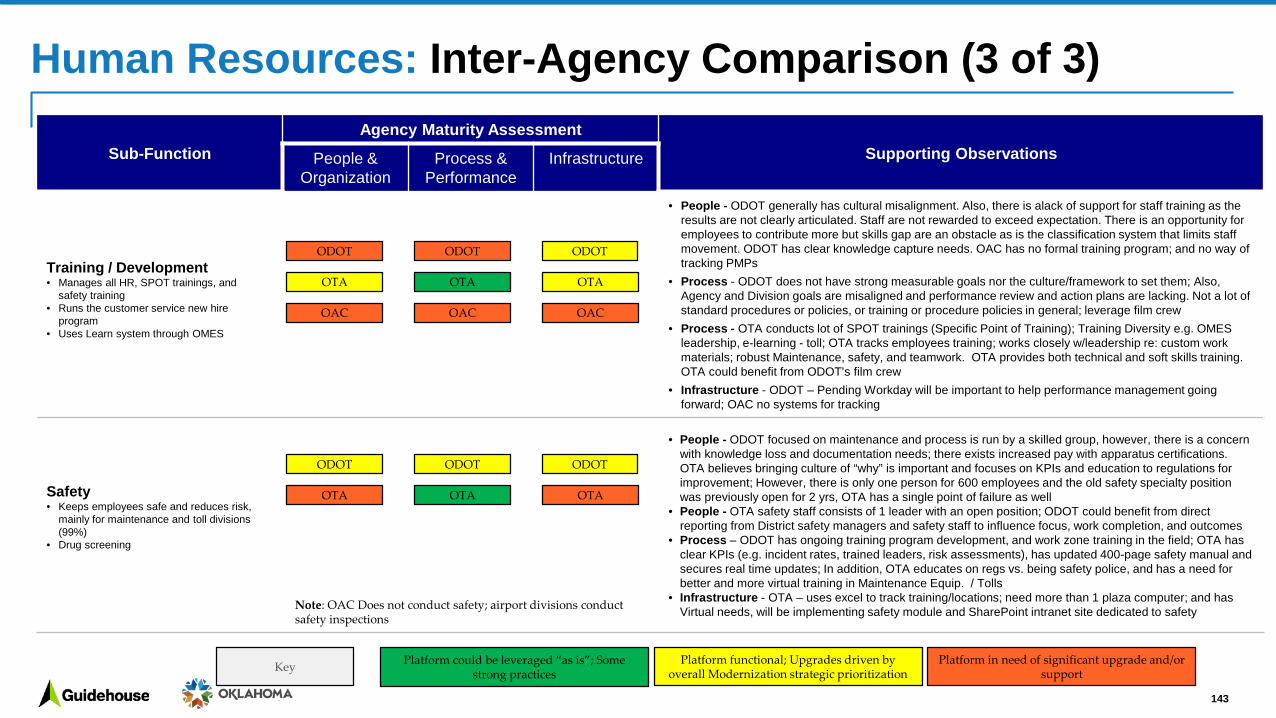
Human Resources: Inter-Agency Comparison (3 of 3)
Sub-FunctionAgency Maturity Assessment
Supporting ObservationsPeople & Organization
Process & Performance
Infrastructure
Training / Development• Manages all HR, SPOT trainings, and
safety training• Runs the customer service new hire
program• Uses Learn system through OMES
• People - ODOT generally has cultural misalignment. Also, there is alack of support for staff training as the results are not clearly articulated. Staff are not rewarded to exceed expectation. There is an opportunity for employees to contribute more but skills gap are an obstacle as is the classification system that limits staff movement. ODOT has clear knowledge capture needs. OAC has no formal training program; and no way of tracking PMPs
• Process - ODOT does not have strong measurable goals nor the culture/framework to set them; Also, Agency and Division goals are misaligned and performance review and action plans are lacking. Not a lot of standard procedures or policies, or training or procedure policies in general; leverage film crew
• Process - OTA conducts lot of SPOT trainings (Specific Point of Training); Training Diversity e.g. OMES leadership, e-learning - toll; OTA tracks employees training; works closely w/leadership re: custom work materials; robust Maintenance, safety, and teamwork. OTA provides both technical and soft skills training. OTA could benefit from ODOT’s film crew
• Infrastructure - ODOT – Pending Workday will be important to help performance management going forward; OAC no systems for tracking
Safety• Keeps employees safe and reduces risk,
mainly for maintenance and toll divisions (99%)
• Drug screening
• People - ODOT focused on maintenance and process is run by a skilled group, however, there is a concern with knowledge loss and documentation needs; there exists increased pay with apparatus certifications. OTA believes bringing culture of “why” is important and focuses on KPIs and education to regulations for improvement; However, there is only one person for 600 employees and the old safety specialty position was previously open for 2 yrs, OTA has a single point of failure as well
• People - OTA safety staff consists of 1 leader with an open position; ODOT could benefit from direct reporting from District safety managers and safety staff to influence focus, work completion, and outcomes
• Process – ODOT has ongoing training program development, and work zone training in the field; OTA has clear KPIs (e.g. incident rates, trained leaders, risk assessments), has updated 400-page safety manual and secures real time updates; In addition, OTA educates on regs vs. being safety police, and has a need for better and more virtual training in Maintenance Equip. / Tolls
• Infrastructure - OTA – uses excel to track training/locations; need more than 1 plaza computer; and has Virtual needs, will be implementing safety module and SharePoint intranet site dedicated to safety
ODOT ODOT
OAC
OTA
OAC
OTA
ODOT
OTA
OAC
ODOT ODOT
OTA OTA
ODOT
OTA
Note: OAC Does not conduct safety; airport divisions conduct safety inspections
Platform could be leveraged “as is”; Some strong practicesKey Platform functional; Upgrades driven by
overall Modernization strategic prioritizationPlatform in need of significant upgrade and/or
support
143

Sub-Functions Key Responsibilities ODOT Divisions OTA Divisions OAC Divisions
Document Imaging • Scans and documents physical copies used in each division• Digitizes historical Agency documents Office Services Information
Technology N/A
Asset Management • Manages IT purchases• Tracks and monitors end-of-life measures N/A Information
Technology N/A
Data Services• Provides database architecture and data management, maintains all SQL backups• Creates and maintains reports for software produced, updates, server migrations, and repositories• Manages analytics and dashboards for OTA divisions• Creates third party integrations to reduce dual-entries
OMES Information Technology OMES
Business Analysis(Enterprise analysts and IT
coordinators)
• Works with internal IT development team and divisions to plan project schedule• Liaise with other divisions to determine business need• Serves as the Agile project manager for IT projects
N/A Information Technology N/A
Network & System Administration
• Maintains servers and backups• Manages data center switches, fiber work, OHP, and tourism networks, telecommunications• Maintains infrastructure for exchange and VMWare environment, all storage and backups, and
cameras • New server set-up, new and upgraded OS, and vulnerability management program• Maintain IT security infrastructure for Paul Caesar’s security team
OMES, ITS (fiber/network-related)
Information Technology OMES
Contracts/Acquisitions • Purchases technology services and products needed within IT and across the agencies Office Services Information Technology N/A
Software Development• Develops custom applications for use Agency-wide• Maintains 3rd-party applications• Creates and maintains the OTA websites and expanding services to ODOT/OAC
OMES Information Technology OMES
Content Management• Manages all content generated by OTA (Application Xtender/WebXtender for document storage• Saves and stores necessary documentation• Utilizes SharePoint for document and access standardization
Office Services Information Technology N/A
Helpdesk • Provides technical support to all Agency employees • Mobility management and asset management inventory
OMES(NTT Data)
Information Technology
OMES(NTT Data)
Leadership & Support • Sets strategy for IT division• Working with the Agency to define Agency-specific strategy OMES CTO to ODOT Information
Technology OMES CTO to ODOT
Sub-Functions and Agency Breakdown
Sub-Function FootnotesODOT Asset Management OTA OAC • Content management
• Document Imaging
Information Technology: Focus Area Overview
144

145
Dedicated Personnel and Budget
Sub-Function Divisions FTE /% Class*
Personnel Cost*
Consultant Cost**
Document Imaging Office Services 4 / 100% Hidden $ -
Asset Management N/A 0 N/A $ -
Data Services N/A 0 N/A $ -
Business Analysis N/A 0 N/A $ -
Systems & Network N/A 0 N/A $ -
Contracts/Acquisitions Office Services 7 / 100% $757,786 $ -
Software Development N/A 0 N/A $ -
Content Management Office Services 1 / 100% Hidden $ -
Helpdesk N/A 0 N/A $ -
Leadership Office Services 1 / 100% Hidden $7,019,818
Vacant Office Services 1 / 100% Hidden $ -
Total 14 $1,312,973 $7,019,818
Volume of Work
Measure Value
Average monthly service requests 490 requests
Man-days dedicated to digitizing ODOT’s historical data 192 days
Number of FTEs supporting per application-Mainframe-Contract
OMES/Office Services not necessarily dedicated to IT
KPI Definition Performance Measurement
Service Request Tracking
Tracking the progress of service requests
• Not started, In progress, or standby
Video division metrics In the process of creating KPIs for the video division
• Currently not tracked, want to track in the future
Service Level Agreements for IT support
-Helpdesk response time-New Computer setup-Mainframe modification
• SLAs with OMES
Performance
* FTE, Classification, and Personnel Costs – Sourced from Agency provided Personnel files as of July 2020 ** Consultant Costs – FY19 consultant costs
Information Technology: ODOT Profile (1 of 2)

People
ProcessInfrastructure
People
• OMES subcontractor NTT’s helpdesk takes a long time to process tickets• NTT Data was not positioned well for success, ODOT wasn’t well informed of NTT
capabilities• ODOT assumes OMES has full responsibility for Agency IT, may not be the case
entirely
Process • Security and organization around plans and document management is unclear• Siloed documentation by division
Infrastructure • No organization of ODOT technologies and IT services Agency-wide• Critical document imaging needs: pallets of paper need to be digitized• Sunsetting legacy systems• ODOT needs ability to scale over time
146
Policies and Procedures Documents
Pain Points
Policy50%
Report50%
Key Policies and Procedures• Most of IT outsourced to OMES, ODOT pays 3 NTT
employees dedicated to ODOT helpdesk support
• ODOT handles some content management and document imaging capabilities in house in their Office Services Division
• Certain ODOT construction plans and documents must be provided to the public when requested
• SLAs with NTT Data and OMES for technology needs
IT Capabilities
Number of Applications10 40% $188K
Total Annualized Cost of Apps used in IT
Key Applications Function Annual Cost*Oracle BI fees Annual Oracle BI usage fees $59K
Production software/services
Stock images, stock library, Toad software, Ustream, Video 3D Modeling, Video Blocks, Vimeo $18K
SmartSheet Content management PM software $25K
BIS Document Imaging contract $86K
% Tailored/User-Developed
Critical Pain Point
Total (OMES) FY19 Annual MSA Hardware, Desktop, Network Support, Shared Services Support costs: ~ $4.6M
*IT cost signified as “$ -” when the cost is an Agency-wide tool, and (where available) cost included in IT Focus Area
Information Technology: ODOT Profile (2 of 2)

147
Dedicated Personnel and Budget Volume of Work
Measure ValueNumber of support calls 4,495 calls, Jan-Nov 2020
Average number of devices 458 Login Users518 Workstations
Total number of strategic IT objectives and initiatives 511 initiatives
Total OTA IT created applications 65 apps
Total 3rd-party applications 126 apps
KPI Definition Performance Measurement
Customer satisfaction Surveys go out every 10 tickets • 98% customer satisfaction
Note: Dashboards and metrics are currently being built out for IT, as well as other functions at OTA.
Performance
Sub-Function Divisions FTE /% Class* Contractors Personnel
Budget
Document Imaging Information Technology 2 / 100% 0 Hidden
Asset Management Information Technology 0 / 0% 1 Hidden
Data Services Information Technology 4 / 0% 7 $1,347,291
Business Analysis Information Technology 1 / 0% 8.25 $889,563.33
System & Network Information Technology 5.8 / 40% 2.5 $836,245
Contracts/ Acquisitions
Information Technology 0 / 0% 2 Hidden
Software Development Information Technology 1 / 0% 8.5 $1,167,705
Content Management Information Technology 0 / 0% 0.5 Hidden
Helpdesk Information Technology 3 / 0% 0 Hidden
Leadership Information Technology 5 / 0% 0 $746,419
Vacant Information Technology 7/ 0% 0 $750,069
Total 28.8 29.75 $6,237,745
* FTE, Classification, and Personnel Costs – Sourced from Agency provided Personnel files as of July 2020 ** Consultant Costs – FY19 consultant costs
Information Technology: OTA Profile (1 of 2)

People
ProcessInfrastructure
People• Difficult to attract and retain talent due to pay competitiveness• Better communications between divisions• Cross-system pathways are still developing
Process• Lacking governance around content management• Need to reinforce enterprise-wide strategy for IT project prioritization• Inconsistent KPIs• Must have approval from OMES before hiring IT personnel
Infrastructure • N/A
148
Policies and Procedures Documents
Pain Points
Procedure50%
Report50%
Key Policies and Procedures• New paperless automation procedure for cash receipts
from controller—utilizes Grooper to automate entire process from Bank to Controller and bypass content management/document imaging intermediate steps
• Strong Cross-training (primary, secondary, tertiary points-of-contact)
• All IT purchases must go through OMES for approval (IT handles this along with all IT Procurement for OTA)
IT Capabilities
Number of Applications135* 16% $1.9M
Annualized Cost of all OTA Apps
Key Applications Function Annual Cost
Application Xtender/Grooper OTA primary document repository, document imaging $48K
Atlassian JIRA/Confluence Ticket tracking for Agile, Managing information/documentation $10K
Lansweeper IT asset management software $8K
Slack Internal communication software $12K
Zoom Video conferencing software $22K
Manage Engine Patching, self service, Service Desk, etc. $53K
% Tailored/User-Developed
Critical Pain Point
* In addition to applications to support OTA IT core functions, OTA supports an additional 84 Agency wide applications
Total (OMES) FY19 Annual MSA Hardware, Desktop, Network Support, Shared Services Support costs: : ~ $595K
Information Technology: OTA Profile (2 of 2)

149
Dedicated Personnel and Budget Volume of Work
Measure Value
Average # days for each OMES helpdesk ticket to completion 16 days
Average number of OMES helpdesk tickets submitted monthly 17 requests
KPI Definition Performance Measurement
No KPI Data
Performance
Sub-Function Divisions FTE /% Class*
Personnel Cost*
Consultant Cost**
Document Imaging N/A 0 N/A $ -
Asset Management N/A 0 N/A $ -
Data Services OMES 0 N/A $ -
Business Analysis N/A 0 N/A $ -
Systems & Network OMES 0 N/A $ -
Contracts/ Acquisitions N/A 0^ N/A $ -
Software Development OMES 0 N/A $ -
Content Management Operations 0 N/A $ -
Helpdesk OMES 0 N/A $ -
Leadership N/A 0 N/A $ -
Total 0^ N/A $ -
* FTE, Classification, and Personnel Costs – Sourced from Agency provided Personnel files as of July 2020 ** Consultant Costs – FY19 consultant costs ^ minor staff time dedicated
Information Technology: OAC Profile (1 of 2)

People
ProcessInfrastructure
People • N/A-OAC does not have any dedicated IT staff• NTT Data was not positioned well for success
Process • NTT Data a large roadblock for helpdesk support, ticket completion time is slow
Infrastructure • Most reports are manual and completed through Excel
150
Policies and Procedures Documents
Pain Points
Policy100%
Key Policies and Procedures• No OAC employees dedicated to IT, contacts OMES for
technology needs
• Annual statement of work (Appendix C) detailing cost of OMES IT services
• Most reports generated on-site are created in Excel
IT Capabilities
Number of Applications3 33% $-
Total Annualized Cost
Key Applications Function Annual Cost*Adobe Content development $ -
Dropbox Document Management $ -
Microsoft Suite For user-built Excel reports $ -
% Tailored/User-Developed
Critical Pain Point
Total (OMES) FY19 Annual MSA Hardware, Desktop, Network Support, Shared Services Support costs: ~ $31k
*IT cost signified as “$ -” when the cost is an Agency-wide tool, and (where available) cost included in IT Focus Area
Information Technology: OAC Profile (2 of 2)

Information Technology: Inter-Agency Comparison (1 of 3)
151
FTE Classified Personnel –Costs*
Consultant –Cost**
ODOT 14 100% $1.3M $7.0M
OTA 59 7.5% $6.2M $0
OAC 0 - - -
Total 72 23% $7.5M $6.7M
Dedicated Personnel and Budget Volume and Performance
Agency Volume Performance
ODOT
• Average monthly # of service requests: 490
• Labor investment dedicated to digitizing ODOT historical: 192 days
• Service request status tracking• Video division metrics/KPIs
OTA
• Jan - Nov 2020 Total # of service calls: 4,495
• FY2020 IT objectives and initiatives: 511
• Total OTA IT created apps: 65 • Total 3rd party applications: 126• Average number of workstations
supported by IT: 518 Workstations
• Ticket uptime and response time• IT customer satisfaction: 95% • % of PCI transactions automated
OAC
• Average monthly # of service requests: 17
• Average completion time per ticket: 16 days
IT Spend
ODOT$188K
$1.9M OTA
$- OAC
Key Common IT Applications
Function ODOT OTA OAC
Content Management SmartSheet Application
Xtender Shared Drive
Ticket Tracking (OMES) JIRA, Service
Desk (OMES)
Asset management
software(OMES) Lansweeper,
RF Track Excel/OMES
Meeting software Zoom/Teams Zoom Zoom/Teams
OMES service overlap is not identified here
* FTE, Classification, and Personnel Costs – Sourced from Agency provided Personnel files as of July 2020 ** Consultant Costs – FY19 consultant costs

Information Technology: Inter-Agency Comparison (2 of 3)Sub-Function
Agency Maturity AssessmentSupporting ObservationsPeople &
OrganizationProcess &
PerformanceInfrastructure
System & Network Administration• Maintains servers and backups• Manages data center switches, fiber
work, OHP, and tourism networks• Maintains infrastructure for exchange and
VMWare environment• New server set-up, new OS, and
vulnerability scanning tasks
• People - OTA has a need for better communication between divisions with project implementation; currently, cross training exists within the Network Administration Sub-Function
• Process - OTA is working to create dashboards; Unclear resource cost per ticket; Networking is last in consideration for construction projects/need to improve Division communications with IT
• Infrastructure - OTA prioritizes network resiliency and does a good job on patch mgmt..• Infrastructure - OTA has automation opportunities for desktop builds and other hot spot areas• Infrastructure - ODOT/OAC network administration is managed through OMES
Help Desk• Provides technical support to all OTA
employees
• People - OTA has a training program; currently building help desk lab to advance skills; staff is easy to flip/no contractors with lower salaries, has upskilling and career path opportunity to move up
• Process - OTA is challenged to stay ahead of the tickets (manage service desk plus); working to create dashboards, skills, continue to seek self-service solutions to decrease burden on helpdesk
• Infrastructure - ODOT/OAC – NTT Data is the provider of help desk and desktop services; is less than favorable – inherited 5,000 ODOT tickets
Content Management / Document Imaging• Manages all content generated by
Agency• Saves and stores necessary
documentation• Scans and documents physical copies
used in each division• Electronifies historical Agency documents
• People - OTA/ODOT are unclear on responsibilities, for whom, and alignment of work/structure e.g. If communication/messaging, should be in marketing. If managing and storing, should be in IT
• Process - ODOT plans library is a research house that keeps all accurate metadata; OTA has no formalized KPIs, 3 FTEs w/no governance body or policy to vet documents sent for scanning
• Process - ODOT is currently working to digitize warehouse full of documents, both OTA/ODOT have contracts with BIS vendor and use the same software (Application Xtender AX. Grooper)
• Process - OAC has no process in place for content management, stores all documents on a shared drive• Infrastructure - ODOT does not have content mgt tool/leverage project wise and OMES maintains and
serves as administrators for AX/Grooper; OTA uses intranet SharePoint site build/content hub for each division; application extender to track documents/purging some required; pursuing automation with Grooper
• Infrastructure - ODOT is lacking robust document security controls for public-facing documents• Infrastructure – ODOT/OAC SLA development needed with OMES
ODOT-OMES ODOT-OMES
OAC-OMES
OTA
OAC-OMES
OTA
ODOT-OMES
OTA
OAC-OMES
ODOT-OMES ODOT-OMES
OAC-OMES
OTA
OAC-OMES
OTA
ODOT-OMES
OTA
OAC-OMES
ODOT ODOT-OMES
OAC
OTA
OAC
OTA
ODOT
OTA
OAC
Beyond Scope of ReviewPlatform could be leveraged “as is”; Some strong practicesKey Platform functional; Upgrades driven by
overall Modernization strategic prioritizationPlatform in need of significant upgrade
and/or support
152
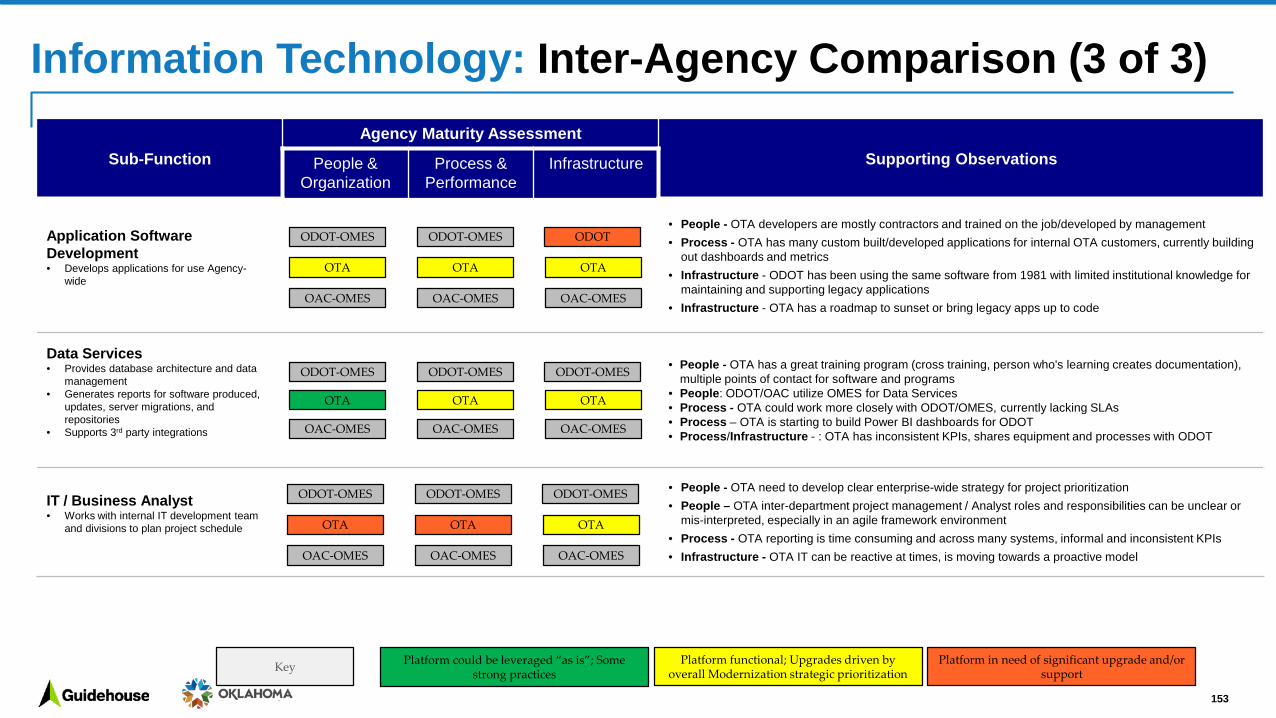
Information Technology: Inter-Agency Comparison (3 of 3)
Sub-FunctionAgency Maturity Assessment
Supporting ObservationsPeople & Organization
Process & Performance
Infrastructure
Application Software Development• Develops applications for use Agency-
wide
• People - OTA developers are mostly contractors and trained on the job/developed by management• Process - OTA has many custom built/developed applications for internal OTA customers, currently building
out dashboards and metrics• Infrastructure - ODOT has been using the same software from 1981 with limited institutional knowledge for
maintaining and supporting legacy applications• Infrastructure - OTA has a roadmap to sunset or bring legacy apps up to code
Data Services• Provides database architecture and data
management• Generates reports for software produced,
updates, server migrations, and repositories
• Supports 3rd party integrations
• People - OTA has a great training program (cross training, person who's learning creates documentation), multiple points of contact for software and programs
• People: ODOT/OAC utilize OMES for Data Services • Process - OTA could work more closely with ODOT/OMES, currently lacking SLAs• Process – OTA is starting to build Power BI dashboards for ODOT• Process/Infrastructure - : OTA has inconsistent KPIs, shares equipment and processes with ODOT
IT / Business Analyst• Works with internal IT development team
and divisions to plan project schedule
• People - OTA need to develop clear enterprise-wide strategy for project prioritization• People – OTA inter-department project management / Analyst roles and responsibilities can be unclear or
mis-interpreted, especially in an agile framework environment• Process - OTA reporting is time consuming and across many systems, informal and inconsistent KPIs• Infrastructure - OTA IT can be reactive at times, is moving towards a proactive model
ODOT-OMES ODOT
OAC-OMES
OTA
OAC-OMES
OTA
ODOT-OMES
OTA
OAC-OMES
ODOT-OMES ODOT-OMES
OAC-OMES
OTA
OAC-OMES
OTA
ODOT-OMES
OTA
OAC-OMES
ODOT-OMES ODOT-OMES
OTA OTA
ODOT-OMES
OTA
OAC-OMESOAC-OMES OAC-OMES
Platform could be leveraged “as is”; Some strong practicesKey Platform functional; Upgrades driven by
overall Modernization strategic prioritizationPlatform in need of significant upgrade and/or
support
153

Procurement: Focus Area Overview
154
Sub-Functions Key Responsibilities ODOT Divisions OTA Divisions OAC Divisions
Contracts & Acquisitions• Manages contracting and procurement• Creates task orders• Utilizes statewide contracts
Procurement All OTA divisions Grants Administrator & Operations
Purchase Orders• Creates purchase orders (POs)• Districts create requisition requests (ODOT)• Creates change orders • Matches invoice and PO to send to AP (OTA only)
Procurement & Districts 1-8
Administrative Services(Procurement)
Grants Administrator & Operations
Purchasing cards (P-card) • Manages P-card purchasing, approvals, training, and credit limit process• New staff training and continuing education Procurement N/A Operations
Sub-Functions and Agency Breakdown
Sub-Function Footnotes
ODOT OTA OTA does not use P-cards OAC
*For ODOT, there is an additional construction bidding process with similar legal needs included in the construction focus area

Dedicated Personnel and Budget
Sub-Function Divisions FTE /
% Class*Personnel
Cost*Consultant
Cost**
Contracts & Acquisitions
Procurement, Districts 1-8 27.5 / 100% $2,154,147 -
Leadership & Support Procurement 3 / 100% Hidden $4,682
Total 30.5 $2,495,187 $4,682
Volume of Work
Measure ValuePO annual volume ~$1.6B per year
P-card annual volume ~$16.5M per year
KPI Definition Performance Measurement
Accuracy and Timeliness
POs are processed accurately and in a timely manner
• Minimize POs with errors, minimize processing time
Request response time Time to respond to requisition request • Minimize number of
complaints received
Time to complete contracts
Time needed to complete contracts that are submitted for approval • 24-48 hours
Time spent training Need to figure out how much time is spent
• For P-cards, there’s an annual requirement (12 annually for CPO certificate)
• Need something in claims area
Performance
* FTE, Classification, and Personnel Costs – Sourced from Agency provided Personnel files as of July 2020 ** Consultant Costs – FY19 consultant costs
Procurement: ODOT Profile (1 of 2)
155

People
ProcessInfrastructure
People• People are customizing systems for own purposes, which makes it difficult to share• Guarded environment, lots of opportunity to create culture of collaboration• Inadequate training (tracking IT contract cycle time)
Process
• It would be more efficient to have one central system• Lack of robust reporting• OMES contracts sometimes have high admin fees• Process to track expiring contracts is highly manual• No clear culture of KPIs, but have ability to do so• OMES processes change and is not clearly cascaded down into ODOT divisions
Infrastructure • Peoplesoft does not have all modules needed• People using different systems (Oracle Apex customized locally)
Procurement: ODOT Profile (2 of 2)
156
Policies and Procedures Documents
Pain Points
Policy54%
Procedure32%
Report14%Key Policies and Procedures
• Procedure: Goods and services contracts are managed separately from the engineering and construction contracts
• Must follow the Brooks Act and state procurement policies
• All ODOT contracts are offered to OTA and OAC
• Separate Pcard process
IT Capabilities
Number of Applications5 50% $97K
Total Annualized Cost
Key Applications Function Annual Cost*
ePRO Cloud-based procurement system Embedded in OMES MSA
DocuSign Used for document signing $96K
PeopleSoft Financials Receiving requisition requests from other divisions $0
SmartSheet Dashboards, metrics $0.5K
Zoom Video conferencing software $20K
% Tailored/User-Developed
Critical Pain Point
*IT cost signified as “$ -” when the cost is an Agency-wide tool, and (where available) cost included in IT Focus Area
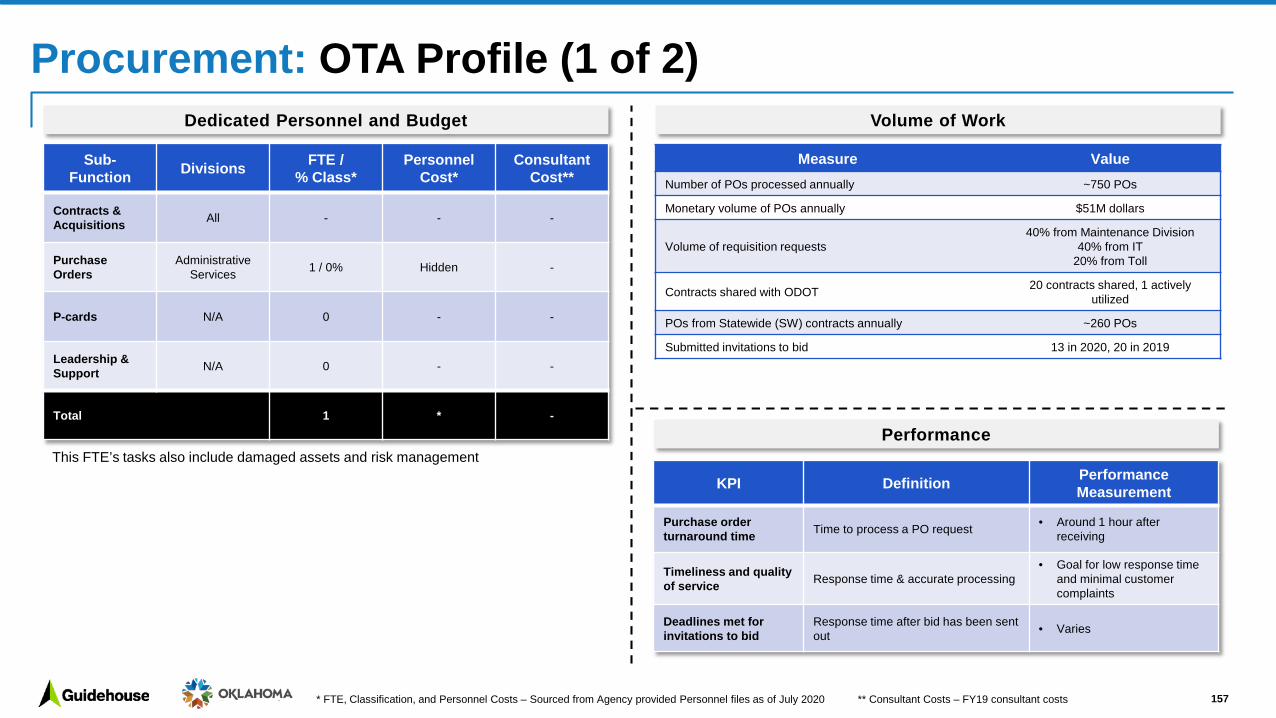
157
Dedicated Personnel and Budget Volume of Work
Measure ValueNumber of POs processed annually ~750 POs
Monetary volume of POs annually $51M dollars
Volume of requisition requests40% from Maintenance Division
40% from IT20% from Toll
Contracts shared with ODOT 20 contracts shared, 1 actively utilized
POs from Statewide (SW) contracts annually ~260 POs
Submitted invitations to bid 13 in 2020, 20 in 2019
KPI Definition Performance Measurement
Purchase order turnaround time Time to process a PO request • Around 1 hour after
receiving
Timeliness and quality of service Response time & accurate processing
• Goal for low response time and minimal customer complaints
Deadlines met for invitations to bid
Response time after bid has been sent out • Varies
Performance
Sub-Function Divisions FTE /
% Class*Personnel
Cost*Consultant
Cost**
Contracts & Acquisitions All - - -
Purchase Orders
Administrative Services 1 / 0% Hidden -
P-cards N/A 0 - -
Leadership & Support N/A 0 - -
Total 1 * -
This FTE’s tasks also include damaged assets and risk management
* FTE, Classification, and Personnel Costs – Sourced from Agency provided Personnel files as of July 2020 ** Consultant Costs – FY19 consultant costs
Procurement: OTA Profile (1 of 2)

People
ProcessInfrastructure
People • 1 staff responsible for all POs• 2 staff backups are cross trained / Burnout for existing employee
Process• Requisitions are dispersed around OTA• Processes are manual, opportunity for automation (Power BI dashboard currently
in TEST mode and data is currently being transferred)
Infrastructure • Other divisions are able to request authorization to have access to Application Extender, which documents all contracts
Procurement: OTA Profile (2 of 2)
158
Policies and Procedures Documents
Pain Points
Policy40%
Procedure40%
Report20%Key Policies and Procedures
• Largely follows the Oklahoma Purchasing Act
• OTA does not use P-cards
• Procedure: procurement also oversees risk management and damaged assets (Insurance for OTA and damage claims against OTA), damaged assets, and demolition for properties as part of any major construction program
IT Capabilities
Number of Applications5 50% $1K
Total Annualized Cost
Key Applications Function Annual Cost*Adobe Formfill Document viewing and signing $1K
Microsoft Suite Excel used to track all PO requests $ -
ApplicationXtender/Grooper/Scanner Stores all POs and documents needed $ -
SignNow For document signatures $ -
% Tailored/User-Developed
Critical Pain Point
*IT cost signified as “$ -” when the cost is an Agency-wide tool, and (where available) cost included in IT Focus Area

159
Dedicated Personnel and Budget Volume of Work
Measure ValueNumber of POs processed annually ~130 POs
Number of P-card transactions annually ~170 P-card transactions
Number of Change orders annually ~20 change orders
Number of invoices issued annually ~10-15 invoices
KPI Definition Performance Measurement
No Formalized KPIs currently
Performance
Sub-Function Divisions FTE /
% Class*Personnel
Cost*Consultant
Cost**
Contracts & Acquisitions
Operations, Airport Division 0.58 / 0% Hidden -
Leadership & Support Operations 0 - -
Total 0.58 ^ -
* FTE, Classification, and Personnel Costs – Sourced from Agency provided Personnel files as of July 2020 ** Consultant Costs – FY19 consultant costs
Procurement: OAC Profile (1 of 2)

People
ProcessInfrastructure
People • Short staffed-everyone wearing multiple hats
Process• Leverages OMES statewide contracts more than they leverage ODOT/OTA shared
contracts, Construction & Properties for construction projects requires more cycle time
Infrastructure • Hard copies of contracts are kept in office
Procurement: OAC Profile (2 of 2)
160
Policies and Procedures Documents
Pain Points
Policy34%
Procedure33%
Report33%
Key Policies and Procedures• Procedure: PO creation is split between operations, airport
projects, and change orders. POs over a certain amount must go through OMES
• Policy: Uses state’s credit card for P-cards and OAC receives a rebate annually
IT Capabilities
Number of Applications2 0% $399
Total Annualized Cost
Key Applications Function Annual Cost*
Peoplesoft Financials Used to track and enter POs $ -
Delphi US DOT invoicing system $399
% Tailored/User-Developed
Critical Pain Point
*IT cost signified as “$ -” when the cost is an Agency-wide tool, and (where available) cost included in IT Focus Area

Procurement: Inter-Agency Comparison (1 of 2)
161
FTE Classified Personnel –Costs*
Consultant –Cost**
ODOT 30.5 100% $2.4M $5K
OTA 1 0% $117K $0
OAC 0.6 0% Hidden $ -
Total 32.1 88% $2.5M $5K
Dedicated Personnel and Budget Volume and Performance
Agency Volume Performance
ODOT
• Annual PO volume: $1.6B• Annual P-card volume: $16.7M
• Reduction in POs with errors• PO turnaround time: ~48 hours• Reduction in requisition
response time• Contract completion turnaround
time
OTA
• # / Value of POs processed annually: ~750 / ~51M
• Volume of requisition requests from each division
• Average PO turnaround time: 1 hour
• Rush vs Standard processing times
OAC
• # of POs processed annually: ~130
• # of annual P-card transactions: ~170
• # of invoices issued annually: 10-15
• N/A
IT Spend
ODOT$97K
$1K OTA
$0.4K OAC
Key Common IT Applications
Functionality ODOT OTA OAC
Procurement system
Peoplesoft Financials
(ePro)Excel Peoplesoft
Financials
Purchase tracking
Peoplesoft Financials
ExcelPower BI
dashboard in testing
Peoplesoft Financials
Document Signing DocuSign
Adobe Formfill, Grooper, SignNow
Adobe Sign
Document storage
ODOT shared drive
Application Xtender Shared Drive
* FTE, Classification, and Personnel Costs – Sourced from Agency provided Personnel files as of July 2020 ** Consultant Costs – FY19 consultant costs

Procurement: Inter-Agency Comparison (2 of 2)
Sub-Function
Agency Maturity Assessment
Supporting ObservationsPeople & Organization
Process & Performance
Infrastructure
Contracting / Acquisitions• Manages contracting and procurement• Utilizes statewide contracts• Works with other divisions for requisition
requests/needs
• People - ODOT is well staffed and leverage statewide and local contracts. OTA/OAC contracting is not centralized under procurement
• Process - ODOT leverages existing contracts but responsibilities are split between two teams. OTA is decentralized contracting spread throughout Agency (IT, Maintenance, etc.). OAC, ODOT, & OTA IT utilizes statewide OMES central purchasing contracts, however, District offices report challenges with statewide contracting not yielding the best price or most effective method to deliver goods/services
• Infrastructure - ODOT/OTA have highly manual processes and need end-to-end automation and reporting capabilities
• Infrastructure – ODOT Engineering infrastructure is effective, however good & services needs new/better infrastructure
Purchase Orders• Creates purchase orders (POs)• Creates change orders and task orders
• People - ODOT has a dedicated team for creating POs. OTA only has one staff with two cross-trained backups. OAC has adequate staffing for its small volume
• Process - ODOT/OTA have manual but structured processes for receiving, tracking, and sending out purchase orders
• Infrastructure - ODOT/OTA need to utilize technology to streamline the requisition to PO-creation process. Before COVID, paper processes were abundant. Power BI tracking tool is currently in TEST mode to be used
P-Cards• Manages P-card purchasing, approvals,
training, and credit limit process
• People - ODOT/OAC have adequate staff to address P-card volume• Process - ODOT/OAC perform P-card approval, onboarding, training, and credit limit processes• Infrastructure - ODOT/OAC processes are manual and mainly through email
ODOT ODOT
OAC
OTA
OAC
OTA
ODOT
OTA
OAC
ODOT ODOT
OAC
OTA
OAC
OTA
ODOT
OTA
OAC
ODOT ODOT
OACOAC
ODOT
OAC
Note: OTA does not utilize p-cards for purchases
Platform could be leveraged “as is”; Some strong practicesKey Platform functional; Upgrades driven by
overall Modernization strategic prioritizationPlatform in need of significant upgrade and/or
support
162

163
Sub-Functions Key Responsibilities ODOT Divisions OTA Divisions OAC Divisions
Comms/Media/PR• Daily communications with public about accidents and road closures• Works with OK Highway patrol to get messages out via social media• Manages public switchboard and manages public perception• Provides PR counsel to other divisions and Agencies
Media & Public Relations Division Communications Director Operations
Marketing
• Buys TV station advertisements• Utilizes social media and other platforms to increase PikePass
usership/responsible for all social media• Strategize and oversee Agency marketing campaigns for OTA and ODOT• Coordinates with divisions on PikePass mobile store locations/setup and event
marketing• Responsible for graphic design of marketing materials• In coordination with IT, website design and upkeep
N/A(relies on OTA) Marketing Specialist N/A
(relies on OTA)
Production/Content Creation • Produces videos and content for trainings, public announcements, internal Agency announcements, and other communication-related outputs
Office Services DivisionMedia & Public Relations
DivisionMarketing Specialist(Also relies on ODOT)
N/A(relies on ODOT)
Sub-Functions and Agency Breakdown
Sub-Function Footnotes
ODOT Marketing OTA Production OAC • Marketing• Production
Communications, Media, and PR: Focus Area Overview

164
Dedicated Personnel and Budget
Sub-Function Divisions FTE /
% Class*Personnel
Cost*Consultant
Cost**
Media/PR Media & Public Relations
12 (4 vacant) / 90% $1,095,974 $60,962
Marketing N/A 0 N/A $ -
Production/ Content Creation/ Messaging
Office Services 13 (2 vacant) / 100% $1,198,395 $ -
Total 25 $2,294,369 $60,962
Volume of Work
Measure ValueNumber of Likes on Facebook page 20,813 likes
Number of Followers on Twitter 37,800 followers
Facebook & Twitter engagement-142K page impressions on Facebook
-Increase in new net monthly followers on Twitter
Email communications to public Email subscribers: 226K
Number of main switchboard phone line calls 400-500 calls per month
KPI Definition Performance Measurement
Positive to negative comment ratio Percent of positive/negative comments • 90% positive now
ROI for posts Engagement per post or public initiative
• Currently not tracked, want to track in the future
Performance
* FTE, Classification, and Personnel Costs – Sourced from Agency provided Personnel files as of July 2020 ** Consultant Costs – FY19 consultant costs
Communications, Media, and PR: ODOT Profile (1 of 2)

People
ProcessInfrastructure
People
• Works closely with Office Services Division but sometimes conflicting deadlines and priorities arise
• Desire to blend and share resources and staff with OTA/OAC beyond the informal• Resources feel limited against goals• Needs clarity around ownership, priorities, and roles, who is accountable for work
with limited resources• Need a deeper understanding of how shared services operate (can report to one
person but support multiple areas)
Process • External customer sometimes is confused where to go between ODOT and OTA• Challenges with trying to reach new drivers vs not abandoning older demographic
Infrastructure • No CRM tools or database, hard to keep track of all data and public
communications• Need more IT support for teleworking, need a performance measurement system
165
Policies and Procedures Documents
Pain Points
Policy100%
Key Policies and Procedures• Procedure: Provides PR counsel for other divisions within
ODOT
• Procedure: Leverages OTA when necessary for marketing capabilities
IT Capabilities
Number of Applications5 0% $13K
Total Annualized Cost
Key Applications Function Annual Cost*HootSuite Social media tracking $11K
WordPress Content creation $1K
Facebook, Twitter Social Media $0
Intranet and ODOT website $ -
Merlin Photo content storage application $ -
% Tailored/User-Developed
Critical Pain Point*IT cost signified as “$ -” when the cost is an Agency-wide tool, and (where available) cost included in IT Focus Area
Communications, Media, and PR: ODOT Profile (2 of 2)

166
Dedicated Personnel and Budget Volume of Work
Measure ValueNumber of Facebook likes on OTA page 16,804 likes
Number of Followers on Twitter 11,900 followers
Average website clicks per month Driving Forward – 1,430 clicksPlatePay - 1,000 clicks
Average monthly impressions from TV advertisements (November 2020)
~200K impressions from KOCO 5 news station
Average annual earned media impressions (2020) $801,930
Contest entrance for new PikePass accounts 14,355 new accounts in 4 months
KPI Definition Performance Measurement
Public perception of OTA
Score of how the public perceives OTA
• New PikePass accounts/passes issued
• (e.g. how many new passes after a big sports game)
Media impressions/ earned media Mentions in newspapers, media, etc..
• After event, tracks how many impressions from the public
Public engagement analytics
Social media analytics, Pikepass.com website metrics
• Pikepass.com clicks: Who’s clicking, what are they clicking?
Performance
Sub-Function Divisions FTE /
% Class*Personnel
Cost*Consultant
Cost**
Media/PR Director of Communication 0.5 / 0% Hidden $ -
Marketing Marketing Specialist 0.5 / 0% Hidden $ -
Production / Content Creation
N/A 0.5 / 0% Hidden $100,000
Vacant N/A 0 N/A $ -
Total 1.5 $196,949 $100,000
Additional staff member from MPR team are included in the Facilities focus area, and is responsible for the service plaza management and building management
* FTE, Classification, and Personnel Costs – Sourced from Agency provided Personnel files as of July 2020 ** Consultant Costs – FY19 consultant costs
Communications, Media, and PR: OTA Profile (1 of 2)
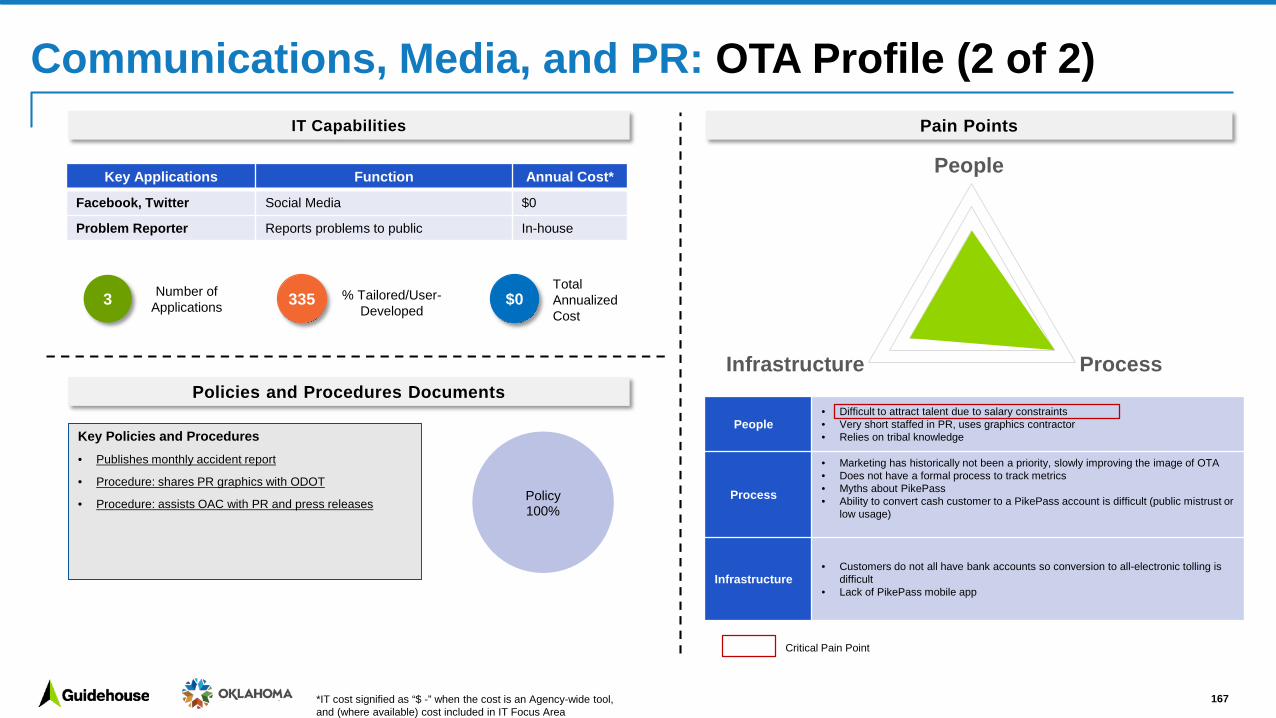
People
ProcessInfrastructure
People• Difficult to attract talent due to salary constraints• Very short staffed in PR, uses graphics contractor• Relies on tribal knowledge
Process
• Marketing has historically not been a priority, slowly improving the image of OTA• Does not have a formal process to track metrics• Myths about PikePass• Ability to convert cash customer to a PikePass account is difficult (public mistrust or
low usage)
Infrastructure • Customers do not all have bank accounts so conversion to all-electronic tolling is
difficult• Lack of PikePass mobile app
167
Policies and Procedures Documents
Pain Points
Policy100%
Key Policies and Procedures• Publishes monthly accident report
• Procedure: shares PR graphics with ODOT
• Procedure: assists OAC with PR and press releases
IT Capabilities
Number of Applications3 335 $0
Total Annualized Cost
Key Applications Function Annual Cost*
Facebook, Twitter Social Media $0
Problem Reporter Reports problems to public In-house
% Tailored/User-Developed
Critical Pain Point
*IT cost signified as “$ -” when the cost is an Agency-wide tool, and (where available) cost included in IT Focus Area
Communications, Media, and PR: OTA Profile (2 of 2)

168
Dedicated Personnel and Budget Volume of Work
Measure Value
Number of Likes on Facebook page 2,895 likes5,000 avg impressions/month
Number of Follows on Twitter 522 followers
Weekly “Flight Bytes” email newsletter 6,500 recipients, 95% success rate
Facebook engagement from different countries Likes and follows from 54 countries
KPI Definition Performance Measurement
None tracked formally, tracking performed on an ad hoc basis
Performance
Sub-Function Divisions FTE /
% Class*Personnel
Cost*Consultant
Cost**
Media/PR
Public Information & Government
Affairs
0.25 / 0% Hidden -
Marketing N/A 0 0 -
Production / Content Creation
N/A 0.25 / 0% Hidden -
Vacant N/A 0 0 -
Total 0.5 Hidden -
* FTE, Classification, and Personnel Costs – Sourced from Agency provided Personnel files as of July 2020 ** Consultant Costs – FY19 consultant costs
Communications, Media, and PR: OAC Profile (1 of 2)

People
ProcessInfrastructure
People • Short staffed, one part-time person oversees all Communications/PR• No formalized collaboration structure with OTA/ODOT
Process • No formal metrics/KPIs tracked
Infrastructure • Does not have access to the same IT platforms as ODOT/OTA
169
Policies and Procedures Documents
Pain Points
100% PolicyKey Policies and Procedures
• Facebook and Twitter Guidelines
IT Capabilities
Number of Applications4 0% $755
Total Annualized Cost
Key Applications Function Annual Cost*Microsoft Suite Word, Excel for creating PR materials $ -
Adobe InDesign Creation of graphics and external materials $755
Facebook, Twitter Communication with the general public $0
% Tailored/User-Developed
Critical Pain Point
*IT cost signified as “$ -” when the cost is an Agency-wide tool, and (where available) cost included in IT Focus Area
Communications, Media, and PR: OAC Profile (2 of 2)

170
FTE Classified Personnel –Costs*
Contracted Labor/ Consultant – Cost**
ODOT 25 96% $2.3M $61K
OTA 1.5 0% $197K $100K
OAC 0.5 0% Hidden $ -
Total 27 86% $2.5M $161K
Dedicated Personnel and Budget Volume and Performance
Agency Volume Performance
ODOT
• Current Facebook page likes: 20,813
• Current Twitter followers: 37,800 • HootSuite metrics for social
media page logs
• % conversation negative to positive comments: 90%
• ROI/engagement per public post• Public knowledge base—social
media engagement• Customer surveys (e.g. social
media)
OTA
• Current Facebook page likes: 16,804
• Current Twitter followers: 11,900 • Website clicks and TV
advertisement viewership• Clipping service/number of
media hits
• OTA public perception score• Customer surveys (e.g. social
media)
OAC
• Current Facebook page likes: 2,876
• Current Twitter followers: 517• Average # of Facebook page
impressions/month: 5,000 • Weekly # of email newsletter
recipients: 6,500
• N/A
IT Spend
ODOT13K
$- OTA
$0.8K OAC
Key Common IT Applications
Functionality ODOT OTA OAC
Social Media metrics HootSuite - -
Content Creation WordPress External
Consultant Adobe InDesign
Social Media Facebook, Twitter
Facebook, Twitter
Facebook, Twitter
Problem Reporter - Problem
Reporter -
Web Pages OMES is building a combined site for all three orgs & subscription services
Digital applications
Drive Oklahoma application—for ODOT/OTA customers to check road conditions etc.. OTA IT
builds & maintains OTA apps
* FTE, Classification, and Personnel Costs – Sourced from Agency provided Personnel files as of July 2020 ** Consultant Costs – FY19 consultant costs
Communications, Media & PR: Inter-Agency Comparison (1 of 2)

Sub-Function
Agency Maturity Assessment
Supporting ObservationsPeople & Organization
Process & Performance
Infrastructure
Communications/PR• Daily communications with public about
accidents and road closures• Works with OK Highway patrol to get
messages out via social media• Manages public switchboard and
manages public perception• Provides PR counsel to other divisions
and Agencies• Produces videos and content for
trainings, public announcements, internal Agency announcements, and other communication-related outputs
• People - ODOT has the opportunity to leverage OTA for marketing campaigns, ODOT PR can support OTA’s image and can blend and share resources (willing to pursue this path); OTA has one person managing all Media and Public Relations (MPR) and there’s difficulty attracting talent due to salary restrictions; OAC has one person handling all MPR and relies on ODOT/OTA for support
• People - ODOT/OTA – some people are resistant and nervous of change and collaboration; also need to recalibrate on the mindset of a good image (e.g. Agency image is not 7:30AM-4:30PM, it’s 24/7)
• Process - ODOT customers get confused between ODOT and OTA, they could provide more consistency in messaging to the public; OTA does not have formal process to track metrics; OAC heavily leverages ODOT and OTA for press release revisions
• Infrastructure - ODOT technology is antiquated, and need technology ability to communicate with public in a timely manner
• Infrastructure - All Agencies have access to social media metrics in some form
Marketing• Buys TV station advertisements• Utilizes social media and other platforms
to increase PikePass usership
• People - OTA has one dedicated staff to Marketing and social media and hires an external firm for graphics and content creation support
• Process - OTA assist ODOT/OAC for marketing and PR needs through informal processes, including TV advertisements and press release revisions. They also share PR graphics with ODOT
• Infrastructure - OTA utilizes social media tracking software to track public sentiment, relies on TV stations for advertising metrics and measures
Production / Content Creation• Produces videos and content for
trainings, public announcements, internal Agency announcements, and other communication-related outputs
• People – Highly skilled content creation staff reside in all three Agencies; OTA is aided by an external PR firm for graphics/PR support. OAC staff recently reduced from 1 FTE to 0.5 FTEs, relies heavily on other Agency’s support
• Process - ODOT has very good graphics and video production people but MPR does not have adequate and direct access to these areas and resources
• Infrastructure - Lack of centralized tool or set of tools between Agencies; technology silos exist
ODOT ODOT
OAC
OTA
OAC
OTA
ODOT
OTA
OAC
OTA OTAOTA
ODOT ODOT
OAC
OTA
OAC
OTA
ODOT
OTA
OAC
Platform could be leveraged “as is”; Some strong practicesKey Platform functional; Upgrades driven by
overall Modernization strategic prioritizationPlatform in need of significant upgrade and/or
support
Communications, Media & PR: Inter-Agency Comparison (2 of 2)
171

Audit: Focus Area Overview
Sub-Functions Key Responsibilities ODOT Divisions OTA Divisions OAC Divisions
Internal Audit• Creates annual internal audit plan to assess risk within different divisions• Performs risk assessments of projects• Presents recommendations to divisions post-audit• Sends reports to leadership and state auditors (ODOT only)
Districts 1-8, and Operations Review &
EvaluationInternal Audit N/A
External Audit (ODOT only)• Performs audits and releases recommendations and findings• Works with state CPAs and ensures projects are compliant with federal and
state rules, regulations, and laws• Audits utility relocation and railroad projects, as well as materials and labor
Districts 1-8, and Operations Review &
EvaluationN/A N/A
External Audit
Government-mandated Audits
Bondholder-mandated Audits• Bondholders require an external CPA audit of financial reports annually
State Auditor and OMESInternal Audit & External
CPA audit for bondholders State Auditor and OMES
Sub-Functions and Agency Breakdown
Sub-Function Footnotes
ODOT OTA • No external audit in-house (utilizes external CPA) OAC • No internal or external audit
in-house
172

173
Dedicated Personnel and Budget
Sub-Function Divisions FTE /
% Class*Personnel
Cost*Consultant
Cost**
Internal Audit Audit 4 / 75% Hidden $ -
External Audit Audit 5 / 100% $541,695 $ -
Leadership & Support Audit 2 / 50% Hidden $306,138.57
Vacant Audit 0 N/A $ -
Total 11 $1,255,748 $306,138.57
Volume of Work
Measure ValueExternal Audit requests per month 70-80 requests
External Audits completed annually ~300 audits
External Audit annual hours 8,840 hours
Internal Audit annual hours 5,530 hours
KPI Definition Performance Measurement
External monthly reports
Monthly reports for committee that shows different types of audits and findings
• Report accuracy
Audit plan progress reports
Show progress on annual audit plan and status of audits
• Started, planning, field, reporting phase
Performance
* FTE, Classification, and Personnel Costs – Sourced from Agency provided Personnel files as of July 2020 ** Consultant Costs – FY19 consultant costs
Audit: ODOT Profile (1 of 2)

People
ProcessInfrastructure
People• Need more cross-training, tribal knowledge sometimes lost due to retirements and
resignations• Takes a lot of training for new people in specialized roles, many vacant roles in the
horizon (as early as 2021)
Process• Processes between internal and external audit differ• Risk assessments may not reflect the highest risk• Need more robust process to follow-up on audit findings
Infrastructure • Currently using legacy accounting system, opportunity to move to more modern
software• Overall ODOT infrastructure improvements would enable audit speed and accuracy
Audit: ODOT Profile (2 of 2)
174
Policies and Procedures Documents
Pain Points
Policy50%
Procedure25%
Report25%
Key Policies and Procedures • Internal Audit Policy: Uses Red book (institute of internal
auditors)
• External Audit Policy: Uses Yellow book (statewide general practices)
• Procedures: ODOT specific audit manual
IT Capabilities
Number of Applications4 50% $13K
Total Annualized Cost
Key Applications Function Annual Cost*Engagement Audit Software Audit software used by state auditors $8K
Legacy accounting system Oracle BI system for data storage $ -
Microsoft Suite Excel used to track audits $ -
Convercent Internet-based, audit hotline software $5K
% Tailored/User-Developed
Critical Pain Point
*IT cost signified as “$ -” when the cost is an Agency-wide tool, and (where available) cost included in IT Focus Area

175
Dedicated Personnel and Budget Volume of Work
Measure ValueNumber of audits performed annually (construction, maintenance, accounting, engineering, miscellaneous) ~60 audits
Audit reports with follow-ups (in constant contact with auditee throughout the audit process, no follow-up needed) N/A
Quality Assurance and reconciliation accuracy for toll collectors ~400 audits/checks
Transcore coin machine audits ~30 audits
Purchasing/procurement audit 1 annual audit
KPI Definition Performance Measurement
Auditor’s time spent Capturing where each auditor’s time is spent
• N/A currently, looking to build out that capability; working with IT
Toll collection error rates
Errors captured in audit and passed along to Toll division
• Must have 1% Error rate or less to be considered acceptable
IVIS Equipment accuracy verification
Ensures that vehicles are being identified and upcharged correctly • Target 95%+ accuracy rate
Performance
Sub-Function Divisions FTE /
% Class*Personnel
Cost*Consultant
Cost**
Internal Audit Internal Audit 4 / 100% Hidden -
External Audit N/A 0 - -
Leadership & Support Internal Audit 1 / 0% Hidden -
Vacant Internal Audit 2 / 50% Hidden -
Total 7 $547,895 -
* FTE, Classification, and Personnel Costs – Sourced from Agency provided Personnel files as of July 2020 ** Consultant Costs – FY19 consultant costs
Audit: OTA Profile (1 of 2)

People
ProcessInfrastructure
People, • Very small group with vacancies• Lack documentation of tribal knowledge and succession planning
Process • Internal audit process could be supported with additional documentation• Looking to build up KPIs and capture where audit hours are spent
Infrastructure • Documents used for audits are paper-based to an extent• Need a consolidated place for document storage (currently stored locally and
scattered)
Audit: OTA Profile (2 of 2)
176
Policies and Procedures Documents
Pain Points
Policy67%
Procedure0%
Report33%
Key Policies and Procedures• Procedure: Audit programs for most but not all audits (toll
collector audits)
• Policies: no regulatory requirements from states, but must adhere to bond covenants
IT Capabilities
Number of Applications4 100% $10k
Total Annualized Cost
Key Applications $ Function Annual Cost*
EPPS Used for construction audits $10 K
Microsoft Suite Excel used to create spreadsheets/track audits, Word used to create reports $ -
OTA custom audit reports
Data pulled and reports generated by IT for toll reports online (coin and toll collector audits)
$ -
SSRS Reports Used to generate reports for audits $ -
% Tailored/User-Developed
Critical Pain Point
*IT cost signified as “$ -” when the cost is an Agency-wide tool, and (where available) cost included in IT Focus Area

Audit: Inter-Agency Comparison (1 of 2)
177
FTE Classified Personnel –Costs*
Consultant/ Professional Services –
Cost
ODOT 11 80% $1.3M $306K
OTA 7 71% $548K $0
OAC 0 - - -
Total 18 77% $1.8M $306K
Dedicated Personnel and Budget Volume and Performance
Agency Volume Performance
ODOT
• # of Monthly external audit requests: 70-80
• # of annual external audits: ~300 • Annual external audit hours: 8,840 • Annual internal audit hours: 5,530
• Report accuracy of monthly external audit reports
• Regular audit plan progress reports, typical timing for each type of audit
OTA
• Number of audits performed annually (construction, maintenance, accounting, engineering, miscellaneous): ~60
• Quality Assurance and reconciliation accuracy for toll collectors: ~400
• # of annual purchasing audits: 1
• Toll collection error rate: <1% • Target accuracy rate for IVIS
vehicle identification: 95%+
OAC
• N/A • N/A
IT Spend
ODOT13K
$10K OTA
- OAC
Key Common IT Applications
Function ODOT OTA OAC
Audit Software
Engagement Audit Software
OTA custom apps N/A
Audit tracking Excel Excel N/A
Financial systems
Legacy accounting
system- N/A
Audit reports Oracle BI OTA custom
apps, SQL N/A
* FTE, Classification, and Personnel Costs – Sourced from Agency provided Personnel files as of July 2020 ** Consultant Costs – FY19 consultant costs

Audit: Inter-Agency Comparison (2 of 2)
Sub-Function
Agency Maturity Assessment
Supporting ObservationsPeople & Organization
Process & Performance
Infrastructure
Internal Audit• Creates annual internal audit plan to
assess risk within different districts• Evaluates highest risk• Presents recommendations to districts
post-audit• Reports to leadership and state auditors• Audits utility relocation and railroad
projects, as well as materials and labor
• People - ODOT foresees many vacant roles on the horizon (2021) and is concerned with loss of tribal knowledge, providing a lot of training for specialized roles and a need more cross training. OTA lacks documentation of tribal knowledge and succession planning
• Process - ODOT lacks a robust protocol to follow-up on audit findings; and risk assessments may not reflect the highest risk. OTA would benefit from additional documentation and knowledge management of audit process, however a smaller division and co-location lessens the priority currently
• Infrastructure – ODOT’s old accounting software is old and all would benefit from improvements within districts; They are moving to Engagement in 2021. OTA’s reports performed in Excel and would benefit from other technologies for reporting, currently in process of being transitioned to Quickbase Dashboards
External Audit - Financial Statement• Performs audits and releases
recommendations and findings• Works with state CPAs and ensures
projects are compliant with federal and state rules, regulations, and laws
• People -OTA – internal auditors assist with inputs (e.g. end-of-year inventory counts, construction contract audits) to review financial statements
• Process - OTA – Leverages 3rd party CPAs; OAC – audits conducted by OMES central purchasing and the state
• Infrastructure - N/A
External Audit - Quality Assurance
• People - ODOT role is more of quality assurance - audit projects and take an external look at select contracts and evaluate reimbursable amounts and agree to monies
ODOT ODOT
OTA OTA
ODOT
OTA
OTA
OAC
OTA
OAC
ODOT ODOTODOT
OTA
OAC
Note: OAC does not conduct internal audits
Note: ODOT external audit conducted by State Auditor’s Office
Platform could be leveraged “as is”; Some strong practicesKey Platform functional; Upgrades driven by
overall Modernization strategic prioritizationPlatform in need of significant upgrade and/or
support
178

Facilities and Land Management: Focus Area Overview
179
Sub-Functions Key Responsibilities ODOT Divisions OTA Divisions OAC Divisions*
Facilities Construction
• Assessing facility condition• Identifying and planning facility capital improvement
projects• Building / re-building maintenance yards, residencies,
and HQ buildings
Facilities(Const. Project Mgmt.)
MaintenanceEngineeringConstruction
Communications and Facilities
N/A
Facilities Maintenance & Management
• Maintenance of existing facilities• Execution of administrative activities such as vendor
payments, lease payments, contract management etc... • Managing the Port of Entries
District Offices (Maint. Techs)
Maintenance(Mech.Techs/Turnpike Crews)
Communications and Facilities
Chief Operations Officer
Lease Management • Management of all leases for Agency owned property Facilities(Lease Manager)
Communications and Facilities N/A
Right of Way• ROW acquisition primarily for Construction Project
Activities• Surplus property disposal and highway removal
Facilities (Surplus Property)ROW Construction (Administration) N/A
Sub-Functions and Agency Breakdown
ODOT OTA • Lease Management• Special Programs OAC
• OAC is not responsible for any Sub-Functions within this category except Facilities Management
Sub-Functions Footnotes
* Facilities and Land Management for OAC is limited to management of office space and as a result, a Focus Area Profile will not be provided for OAC

Facilities and Land Management : ODOT Profile (1 of 2)
180
Dedicated Personnel and Budget
Sub-Function Divisions FTE /% Class*
Personnel Cost*
Consultant Cost**
Facilities Construction Facilities 2 /
100% Hidden $655,740
Facilities Maintenance & Management
District Offices 16 /100% $1,242,532 $655,740
Lease Management Facilities 1.25 /100% Hidden Not Available
Right of Way FacilitiesROW
57 /93% $5,849,226 $8,955,365
Administrative All 5 /100% $706,657 N/A
Vacancies All 4 Hidden N/A
Total 85.25 $ 8,435,124 $ 10,266,845
Volume of Work
Measure ValueAnnual Number of Facilities Constructed - FY19 2 / $ 20 M
Number of Appraisals prepared – FY19 509
Appraisals of Surplus Properties Conducted – FY19 29
Number of Land Parcels Secured in FY19/Associated Cost 1,063 / $41 M
Annual parcels of Surplus Property Sold - FY19 46 / $2 M
KPI Definition MeasurePercent of Facilities Constructed On-time -FY19
Percent of Facilities Constructed On-time 100%
Percent of Facilities Constructed Under-budget - FY19
Percent of Facilities Constructed Under-budget 0% / +2.7% on average
Total Legal Settlements and Jury Verdicts over ROW offers and % difference – FY19
The difference between the final ROW costs and the original ROW offer for cases
that were settled or litigated$2.58M / 57%
Number and percentage of projects certified for the scheduled letting –FY19
Number and percentage of projects certified for the scheduled letting (does not include LG projects or project not requiring
ROW)
121 / 100%
Performance
* FTE, Classification, and Personnel Costs – Sourced from Agency provided Personnel files as of July 2020 ** Consultant Costs – FY19 consultant costs

People
ProcessInfrastructure
People
• A lot of experience will be lost soon when Managers begin to retire across the divisions; Relocation will significantly be affected
• District techs have varying levels of experience, formal certifications, and experience
• Lack of coordination between resources who do buying/selling of land because they are in 2 separate divisions and report to different executives
Process
• Centralization will be a difficult process due to field resources tending to listen to field supervisors vs those at Headquarters
• There is no broader facilities strategy that also includes the consideration of surplus properties
• Working with utility companies and working around the federal regulations causes delays
• To receive federal funding for Environmental projects the NEPA process must be completed which causes slow downs
Infrastructure
• Facility footprint outweighs Department need resulting in lack of sufficient funding for capital improvements (timeline extended to 2048) and staff (2 centralized PMs) to maintain existing facilities
• Lack of a true technological support/partner is hindering the meeting of business needs
Facilities and Land Management : ODOT Profile (2 of 2)
181
Policies and Procedures Documents
Pain Points
Policy16%
Procedure17%
Report67%
Key Policies and Procedures• FMD Asset Management Plan 2020
• Field Division Preventative Maintenance Checklist
• Property Management Manual
• ODOT Facility Locations
• ODOT/OTA/OAC- 2019 Real Property Asset Data
• ODOT ROW Manual
IT Capabilities
Number of Applications16
Key Applications Function Annual Cost*Bentley MicroStation CAD design and drafting $750 K
ESRI Stack Facility geolocation $444 K
Agile Assets Inventory of all facility assets $1 M
C-Cure 9000 Manages badges and badge readers $7 K
PV Plus Identification of adjacent landowners $22 K
12% $3MTotal Annualized Cost
Critical Pain Point
% Tailored/User-Developed
*IT cost signified as “$ -” when the cost is an Agency-wide tool, and (where available) cost included in IT Focus Area

Facilities and Land Management : OTA Profile (1 of 2)
182
Dedicated Personnel and Budget Volume of Work
Measure ValueNew facilities being built in 2020-2021 7 facilities / $ 5 M
Building and Equipment Repairs - FY19 15,492 hours / $831 K
Annual Number of Land parcels Acquired - FY19 119 parcels
Annual Spend to Secure ROW - FY19 $18 M
Annual parcels of Surplus Property Sold - FY19 17 parcels surplus / 8 sold for $311K
Headquarters Maintenance Expenses – FY19 $78 K
Man Hours for Toll Repairs 3,490 / $ 296 K
KPI Definition Measure
Capital Improvement Capital Improvement Plan for Facilities Completion of all listed projects
ROW Acquisitions and Disposal – FY19
Annual Number, and percentage, of parcel acquisition that was over OTA offer
58 / 49% over
Lease Management Annual Lease True-ups of lease revenue to OTA
Completion of all lease true ups for timely payments from Lessees
Performance
Sub-Function Divisions FTE /% Class*
Personnel Cost*
Consultant Cost**
Facilities Construction
EngineeringMaintenanceConstruction
0.5 /100% Hidden $905,357
Facilities Maintenance & Management
MaintenanceComms & Facilities
6.25 /100% $ 450,578 $160,069
Lease Management Comms & Facilities 0.75 / 0% Hidden $ -
Right of Way Construction 0.33 /100% Hidden $1,351,497
Special Programs N/A N/A N/A N/A
Administrative All N/A N/A N/A
Vacancies All 0 N/A N/A
Total 7.83 $ 619,001 $ 2,416,923
* FTE, Classification, and Personnel Costs – Sourced from Agency provided Personnel files as of July 2020 ** Consultant Costs – FY19 consultant costs

People
ProcessInfrastructure
Facilities and Land Management : OTA Profile (2 of 2)
183
Policies and Procedures Documents
Pain Points
People • Insufficient staff to manage ROW acquisition and disposal and a significant portion of activities needs to be contracted to consultants to meet timelines
Process• ROW processes had to be built from the ground up by ODOT Construction
Administration Staff Member• No feedback processes and a lack of transparency makes it hard to stay “in the
loop” within Communication and Facilities Management
Infrastructure • Manual paper processes with a lot of redundancies within Communication and Facilities
Policy20%
Procedure0%
Report80%
Key Policies and Procedures• Quail Brook Plaza Lease Agreement
• Comprehensive Facilities Catalog
• OTA Floorplan
• PikePass Memorial Building Layout
IT Capabilities
Number of Applications6
Key Applications Function Annual Cost*Parcel Viewer Used to view ROW parcel documents $ -
Alert Media Mass notifications across existing infrastructure $8 K
C-Cure 9000 / Bravo Manages badges and badge readers at HQ and Customer Service Centers $7 K
TeamGo - Visitor Management
Non-employee / Visitor tracking at HQ & Customer Service Centers $529
16% $8KTotal Annualized Cost
Critical Pain Point
% Tailored/User-Developed
*IT cost signified as “$ -” when the cost is an Agency-wide tool, and (where available) cost included in IT Focus Area

Facilities: Inter-Agency Comparison (1 of 3)
184
FTE Classified Personnel –Costs*
Consultant –Cost**
ODOT 85.3 95.1% $8 M $10 M
OTA 7.8 80.8% $619 K $2 M
OAC N/A N/A N/A N/A
Total 93.1 88% $9 M $12 M
Dedicated Personnel and Budget Volume and Performance
Agency Volume Performance
ODOT
• FY19 # / cost of Facilities Constructed: 2 / $ 20.5 M
• FY19 # of Appraisals prepared: 509
• FY19 # of Appraisals of Surplus Properties Conducted: 29
• FY19 # of Land Parcels Secured / Associated Cost: 1,063 / $41.1M
• FY19 # of parcels of Surplus Property Sold: 46 / $2.4 M
• FY19 % of Facilities Constructed On-time: 100%
• FY19 % of Facilities Constructed Under-budget: 0% / +2.7% average
• FY19 value / % of Legal Settlements over ROW offers in FY19: $2.58M / 57%
• FY19 # and % of Projects certified for the scheduled letting: 121 / 100%
OTA
• FY21 New facilities being built: 7 facilities / $ 5.3 M
• FY19 # of Land Parcels Secured / Associated Cost: 119 / $18.4M
• FY19 # of parcels of Surplus Property Sold: 8 / $311K
• FY19 Headquarters Maintenance Expenses - $78.7 K
• F19 Building and Equipment Repairs: 15,492 hours / $831 K
• Fy19 Man Hours for Toll Repairs -3,490 / $ 296,257
• FY19 Capital Improvement -Completion of all listed projects
• FY19 # and % ROW Acquisitions over offer: 58 / 49% over
• FY19 Lease Management -Completion of all lease true ups for timely payments
OAC N/A N/A
IT Spend
ODOT$2.7M
$8K OTA
N/A OAC
Key Common IT Applications
Function ODOT OTA OAC
Project Management ProCore MS Suite N/A
Workflow Management PowerBI MS Suite N/A
Data Management ESRI MS Suite N/A
Core Function MicroStation ParcelViewer N/A
* FTE, Classification, and Personnel Costs – Sourced from Agency provided Personnel files as of July 2020 ** Consultant Costs – FY19 consultant costs

Facilities: Inter-Agency Comparison (2 of 3)
185
Sub-FunctionAgency Maturity Assessment
ObservationsPeople & Organization
Process & Performance
Infrastructure
Facilities Construction• Assessing facility condition• Identifying and planning facility
capital improvement projects• Building / re-building
maintenance yards, residencies, and HQ buildings
• People – ODOT has a team of 2 dedicated resources to manage all aspects of Facilities construction across all the Districts. However, OTA utilizes different resources across different divisions in order to do the Planning (Maintenance), Portfolio Management (Engineering), and Execution (Construction)
• Process – ODOT has a Facilities Rebuild Plan that spans to 2048. This will result in some structures surpassing 100 years of age and has the potential to be very costly in the near future. OTA lacks formal documented processes
• Process – ODOT has a disconnect between having excess ROW and facilities construction because there isn’t a focus on aligning your divisions goals with the goals of the other divisions
• Infrastructure - ODOT has an “industry standard” facilities construction project management software applications in ProCore and Bentley MicroStation. OTA currently utilizes Microsoft Suite of products, however VueWorks will be implemented selectively within the next 3 months and rolled out across the Agency within 1-2 years
Facilities Maintenance & Management
• Maintenance of existing facilities
• Execution of administrative activities such as vendor payments, lease payments, contract management etc...
• Managing the Port of Entries
• People – ODOT has a single centralized resource who is responsible for maintenance and management of facilities across the entire state with the help of maintenance techs from the Districts. However, these District resources are sometimes deployed to highway maintenance activities, diluting their ability to attend to maintenance needs. OTA utilizes their Maintenance Division’s Mech.Tech. positions for basic maintenance needs (HVAC, electrical, etc.), and their turnpike crews for more major facilities maintenance functions
• Process – ODOT and OTA currently utilize a decentralized process to conduct their facilities maintenance activities. This might create siloed data and reporting which could hamper proactive maintenance activities. OTA lacks formal documented processes
• Infrastructure - ODOT has an “industry standard” facilities maintenance and management software applications in Agile Assets and the ESRI “stack.” OTA, on the other hand, utilizes a host of applications from Microsoft Suite of products in order to manage their facilities management
ODOT ODOT
OTA OTA
ODOT
OTA
ODOT ODOT
OTA OTA
ODOT
OTA
Note: For OAC the only facilities obligation is managing office space; therefore, there is very little to report on volume, performance, IT, and Pain Points
Note: For OAC the only facilities obligation is managing office space; therefore, there is very little to report on volume, performance, IT, and Pain Points
Platform could be leveraged “as is”; Some strong practicesKey Platform functional; Upgrades driven by
overall Modernization strategic prioritizationPlatform in need of significant upgrade and/or
support

Facilities: Inter-Agency Comparison (3 of 3)
186
Sub-Function
Agency Maturity Assessment
ObservationsPeople & Organization
Process & Performance
Infrastructure
Right of Way• ROW acquisition primarily for
Construction Project Activities• Surplus property disposal and
highway removal
• People – OTA has a single resource to manage right of way, however a large portion of the work is outsourced to consultants (Driving Forward and Poe) to ensure that recent historical ROW acquisition met pre-construction/design schedules. ODOT has a large pool of dedicated resources who are responsible for all aspects of acquisition. ROW disposal responsibilities lie within Facilities Management that are executed by a smaller pool of resources
• Process – ODOT has comprehensive formal documentation for its ROW acquisition processes and their efforts yield positive results. ODOT owns a lot of property that is unaccounted for and a tedious process of cataloguing these properties is currently underway. There seems to have been a lack of a concrete methodology/tools in the past to track all these properties, and there still might be a gap in terms of a defined process for the current situation. OTA tries to structure their ROW processes to that of ODOT but can bypass any federal requirements while adding OTA specific customizations
• Infrastructure – ODOT uses many software tools in order to facilitate right of way management, such as: PVPlus and Net Deed Plotter. OTA, on the other hand, utilizes Microsoft applications along with Parcel Viewer, however
ODOT ODOT
OTA OTA
ODOT
OTA
Note: For OAC the only facilities obligation is managing office space; therefore, there is very little to report on volume, performance, IT, and Pain Points
Platform could be leveraged “as is”; Some strong practicesKey Platform functional; Upgrades driven by
overall Modernization strategic prioritizationPlatform in need of significant upgrade and/or
support