Management Report 2013 - Unicasa Móveis · Alexandre Grendene Bartelle Chairman Juvenil Antônio...
67
1 Management Report 2013
Transcript of Management Report 2013 - Unicasa Móveis · Alexandre Grendene Bartelle Chairman Juvenil Antônio...

1
Management Report
2013

BOARD OF DIRECTORS
Alexandre Grendene Bartelle Chairman
Juvenil Antônio Zietolie
Vice Chairman
Frank Zietolie Director
Hugo Antônio Jordão Bethlem
Independent Director
Renato Ochman Director
BOARD
Frank Zietolie President
Kelly Zietolie
Vice President
Paulo Eduardo Junqueira de Arantes Filho Financial and Investor Relations Officer
Thiago Proença Baisch
Commercial Officer
Ivanir Moro Accoutant
CRC/RS-053351/O-7

To The Shareholders,
In compliance with applicable laws and Bylaws of the company, the Management of Unicasa
Indústria de Móveis S.A. hereby presentes the Management Report and the Financial Statements
prepared according to the International Financial Reporting Standards (IFRS) issued by International
Accounting Standards Board (IASB), the generally accepted accounting principles in Brazil and the rules
issued by the Securities and Exchange Comission of Brazil (CVM). The Company adopted all the standars,
revisions of standards and interpretations issued by IASB and which are effective for the financial
statements ended on December 31, 2013.
The Financial Statements of Unicasa Indústria de Móveis S.A. as of December 31, 2013, were
prepared in accordance with the generally accepted accounting principles in Brazil and the rules issued
by the Securities and Exchange Comissions of Brazil (CVM), while also complying with the accounting
guidelines from corporate law (Law 6,404/76), which include the new provisions introduced, amended
and canceled by Law 11,638 of December 28, 2007 and Law 11,941 of May 27, 2009. These practices
differ from the IFRS applicable to separate financial statements only with regard to the valuation of
investments in subsidiaries, which are valued using the equity income method, whereas they would be
valued at cost or fair value according to IFRS.

MESSAGE FROM THE MANAGEMENT
In 2013, we began operations at five own stores, of which four were located in the city of São
Paulo and one in the city of Manaus. The opening of the sixth and final store planed in our own store
project should occur in the second half of 2014, in the city of São Paulo. Launched in 2012, the project
will help us acquire experience in the operation of stores to allow us to identify good practices and
efficiency gains to implement throughout our retail network. The direct relationship with final
consumers allows us to amass a great body of knowledge on the sales process, from the development of
project for environments to the final assembly of products.
This year, we launched operations for our new brand Casa Brasileira, which is marketed through
franchises and the multibrand stores. Inspired by the concept of Brazilianness and the country’s different
regions, the brand’s positioning is the product of a study on the Brazilian way of being and the country's
culture. The brand explores the need to create furniture that is especially designed for smaller
environments and faithful to the space currently available.
Over the course of the year, we made progress on repositioning the brands Dell Anno and Favorita,
which involved converting small stores with low sales and little impact on the Company’s results into
multibrand stores or shutting them down. Our objective is to make our chain more homogenous and
with our brands present in the markets best suited to their proposition.
The fourth quarter of 2013 brought signs of recovery in the revenue generated by the brands
Dell Anno and Favorita, signaling the end of the cycle of adverse revenue impacts related to the
comprehensive store repositioning carried out in 2012.
In 2013, we enjoyed strong cash generation, despite the lower-than-expected results. In the
year, we paid dividends and interest on equity, reduced our net debt, invested in CAPEX and settled our
tax liabilities by adhering to the REFIS tax amnesty program. However, despite this large volume of
expenditures, we ended the year with a cash position that, based on our projections, will enable us to
meet our investment obligations and working capital needs for 2014.
This year, we will consolidate part of our strategies, but we are cautious to project their effects
on the Company’s results, given the atypical year in 2014, with the World Cup and presidential elections,
which increases uncertainty on the country’s economic and political scenarios.
We thank you for your trust and support in this year marked by investments in our own store
operations and by the consolidation of our strategies. To our shareholders, dealers and their teams,
clients, suppliers and our employees, who are all steadfastly dedicated and committed to the Company’s
success, we say thank you.

SALES AND DISTRIBUTION CHANNELS
Continuing the process to reposition the brands Dell Anno and Favorita, as announced in 2Q13, which
basically consists of replacing stores located in markets with low acceptance of the brand proposition
and low revenue and results, we reduced the reseller base by 58 stores in 4Q13 and converted 27 of
these stores into Multibrand Casa Brasileira stores.
Our multibrand distribution channel reached 2,852 stores in 4Q13. We ended 4Q13 with 650 New and
Casa Brasileira multibrand stores and 2,202 points of sales in the retail chain under the Telasul Modular
brand.
Unicasa’s network of exclusive dealers reached 832 stores in the period, of which 381 were Dell Anno
and Favorita stores and 451 were New and Casa Brasileira franchise stores.
The evolution in our distribution channels is shown below:
Period 2012 1Q13 2Q13 3Q13 4Q13 ∆
Exclusive, Franchise and Own Stores 922 929 923 906 832 (74)
Dell Anno and Favorita 463 463 456 439 381 (58)
New and Casa Brasileira Franchise 459 466 467 467 451 (16)
Multibrand 2,131 2,161 2,761 2,820 2,852 32
New and Casa Brasileira Multibrand 576 576 594 618 650 32
Telasul Modular 1,555 1,585 2,167 2,202 2,202 -
SALES PERFORMANCE
Gross Revenue ex-IPI
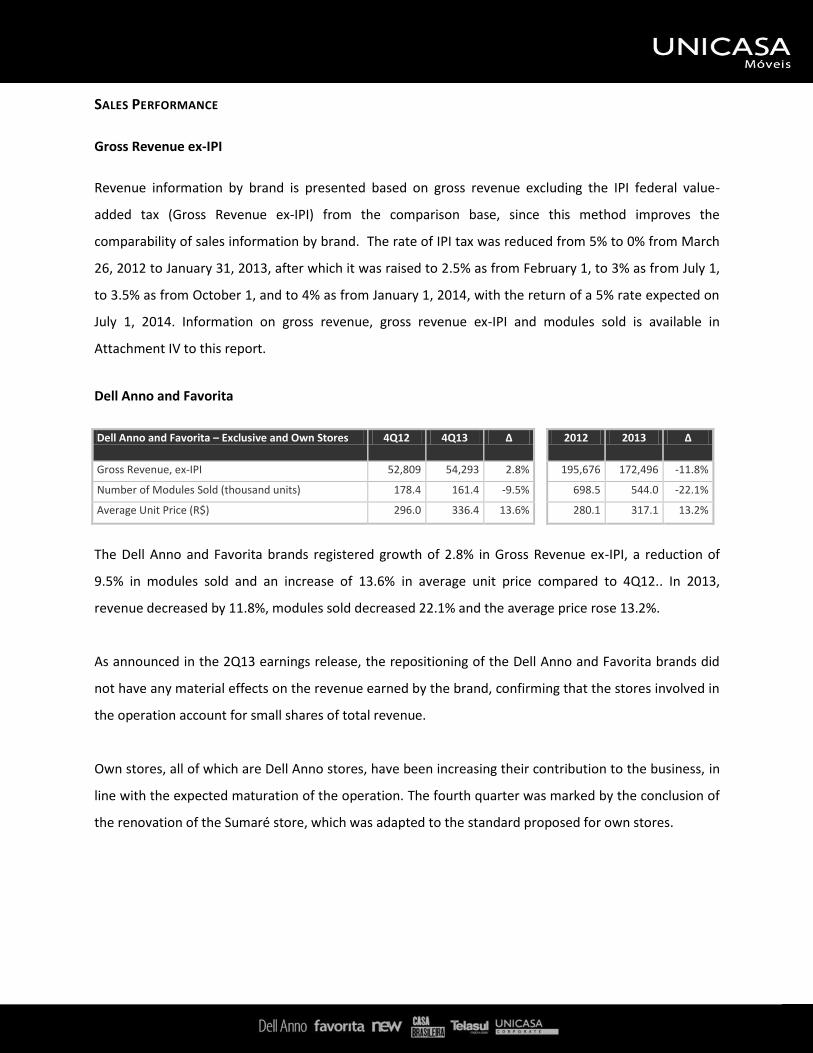
Revenue information by brand is presented based on gross revenue excluding the IPI federal value-
added tax (Gross Revenue ex-IPI) from the comparison base, since this method improves the
comparability of sales information by brand. The rate of IPI tax was reduced from 5% to 0% from March
26, 2012 to January 31, 2013, after which it was raised to 2.5% as from February 1, to 3% as from July 1,
to 3.5% as from October 1, and to 4% as from January 1, 2014, with the return of a 5% rate expected on
July 1, 2014. Information on gross revenue, gross revenue ex-IPI and modules sold is available in
Attachment IV to this report.
Dell Anno and Favorita
Dell Anno and Favorita – Exclusive and Own Stores 4Q12 4Q13 Δ 2012 2013 Δ
Gross Revenue, ex-IPI 52,809 54,293 2.8% 195,676 172,496 -11.8%
Number of Modules Sold (thousand units) 178.4 161.4 -9.5% 698.5 544.0 -22.1%
Average Unit Price (R$) 296.0 336.4 13.6% 280.1 317.1 13.2%
The Dell Anno and Favorita brands registered growth of 2.8% in Gross Revenue ex-IPI, a reduction of
9.5% in modules sold and an increase of 13.6% in average unit price compared to 4Q12.. In 2013,
revenue decreased by 11.8%, modules sold decreased 22.1% and the average price rose 13.2%.
As announced in the 2Q13 earnings release, the repositioning of the Dell Anno and Favorita brands did
not have any material effects on the revenue earned by the brand, confirming that the stores involved in
the operation account for small shares of total revenue.
Own stores, all of which are Dell Anno stores, have been increasing their contribution to the business, in
line with the expected maturation of the operation. The fourth quarter was marked by the conclusion of
the renovation of the Sumaré store, which was adapted to the standard proposed for own stores.

New and Casa Brasileira
New Exclusive Dealers and Casa Brasileira Franchise Stores
4Q12 4Q13 Δ 2012 2013 Δ
Gross Revenue, ex-IPI 25,430 25,188 -1.0% 91,756 92,465 0.8%
Number of Modules Sold (thousand units) 138.0 125.2 -9.3% 488.0 474.1 -2.8%
Average Unit Price (R$) 184.3 201.2 9.2% 188.0 195.0 3.7%
Multibrands 4Q12 4Q13 Δ 2012 2013 Δ
Gross Revenue, ex-IPI 10,271 9,750 -5.1% 38,159 37,093 -2.8%
Number of Modules Sold (thousand units) 66.9 61.8 -7.6% 241.7 232.8 -3.7%
Average Unit Price (R$) 153.5 157.8 2.8% 157.9 159.3 0.9%
Note: Revenue for 2012 refers to sales under the brand Telasul in the Exclusive and Multibrand channels, plus revenue from the New brand in
the Multibrand channel.
Gross revenue ex-IPI from the Exclusive channels of the New brand and the franchise stores of the Casa
Brasileira brand decreased by 1.0% compared to 4Q12, with modules sold decreasing 9.3% and the
average unit price increasing 9.2%. In the year, revenue and average price of modules increased 0.8%
and 3.7%, respectively, while sales volume decreased 2.8%.
The Multibrand channel (New, Casa Brasileira and other) recorded a decrease in Gross Revenue ex-IPI of
5.1% in 4Q13 and 2.8% in the year, while the number of modules sold fell 7.6% in 4Q13 and 3.7% in the
year and average unit price increased 2.8% in 4Q13 and 0.9% in the year.
Telasul Modular
The Telasul brand was marketed through the Exclusive, Multibrand and Department Store channels and
was reported on a consolidated basis. With the creation of the Casa Brasileira brand in March 2013, the
former Telasul Exclusive and Multibrand channels of Telasul were transformed into Casa Brasileira
Multibrand, which began to be reported together with New Multibrand. The Department Store channel
continues to be served by the Telasul Modulados brand, which offers modular furniture to retail chains.
Telasul Modular 4Q12 4Q13 Δ 2012 2013 Δ
Gross Revenue, ex-IPI 5,606 3,870 -31.0% 18,568 13,945 -24.9%
Number of Modules Sold (thousand units) 46.0 36.1 -21.5% 155.3 120.0 -22.7%
Average Unit Price (R$) 121.9 107.2 -12.1% 119.6 116.2 -2.8%
The performance of the Telasul Modulados brand was marked by reductions of 31.0% in Gross Revenue
ex-IPI, 21.5% in sales volume and 12.1% in average price.

Unicasa Corporate
This segment registered growth in Gross Revenue ex-IPI of 90.7%, with sales volume growing 169.0% and
average unit price decreasing 29.1%.
Unicasa Corporate 4Q12 4Q13 Δ 2012 2013 Δ
Gross Revenue, ex-IPI 1,189 2,267 90.7% 4,868 5,793 19.0%
Number of Modules Sold (thousand units) 2.9 7.8 169.0% 19.7 19.7 0.0%
Average Unit Price (R$) 410.0 290.6 -29.1% 247.1 294.1 19.0%
Other Revenues
Other revenues are derived from sales to employees, suppliers, freight operators and other.
Other Revenues 4Q12 4Q13 Δ 2012 2013 Δ
Gross Revenue, ex-IPI 1,435 1,451 1.1% 6,112 4,973 -18.6%
Number of Modules Sold (thousand units) 11.8 14.2 20.3% 27.8 56.9 104.7%
Average Unit Price (R$) 121.6 102.2 -16.0% 219.9 87.4 -60.3%
Export Market
Exports registered increases of 17.1% in revenue and 43.8% in sales volume, and a decrease of 18.5% in
the average price.
Export Market 4Q12 4Q13 Δ 2012 2013 Δ
Gross Revenue, ex-IPI 1,753 2,052 17.1% 8,063 8,970 11.2%
Number of Modules Sold (thousand units) 11.2 16.1 43.8% 66.1 124.6 88.5%
Average Unit Price (R$) 156.5 127.5 -18.5% 122.0 72.0 -41.0%
Consolidated Indicators Unicasa
Unicasa Indústria de Móveis 4Q12 4Q13 Δ 2012 2013 Δ
Gross Revenue, ex-IPI 98,493 98,871 0.4% 363,202 335,735 -7.6%
Number of Modules Sold (thousand units) 455.2 422.6 -7.2% 1,697.0 1,572.1 -7.4%
Average Unit Price (R$) 216.4 234.0 8.1% 214.0 213.6 -0.2%
Domestic Market 4Q12 4Q13 Δ 2012 2013 Δ
Gross Revenue, ex-IPI 96,740 96,819 0.1% 355,139 326,765 -8.0%
Number of Modules Sold (thousand units) 444.0 406.5 -8.4% 1,630.9 1,447.5 -11.2%
Average Unit Price (R$) 217.9 238.2 9.3% 217.8 225.7 3.6%
Export Market 4Q12 4Q13 Δ 2012 2013 Δ
Gross Revenue, ex-IPI 1,753 2,052 17.1% 8,063 8,970 11.2%
Number of Modules Sold (thousand units) 11.2 16.1 43.8% 66.1 124.6 88.5%
Average Unit Price (R$) 156.5 127.5 -18.5% 122.0 72.0 -41.0%
FINANCIAL PERFORMANCE
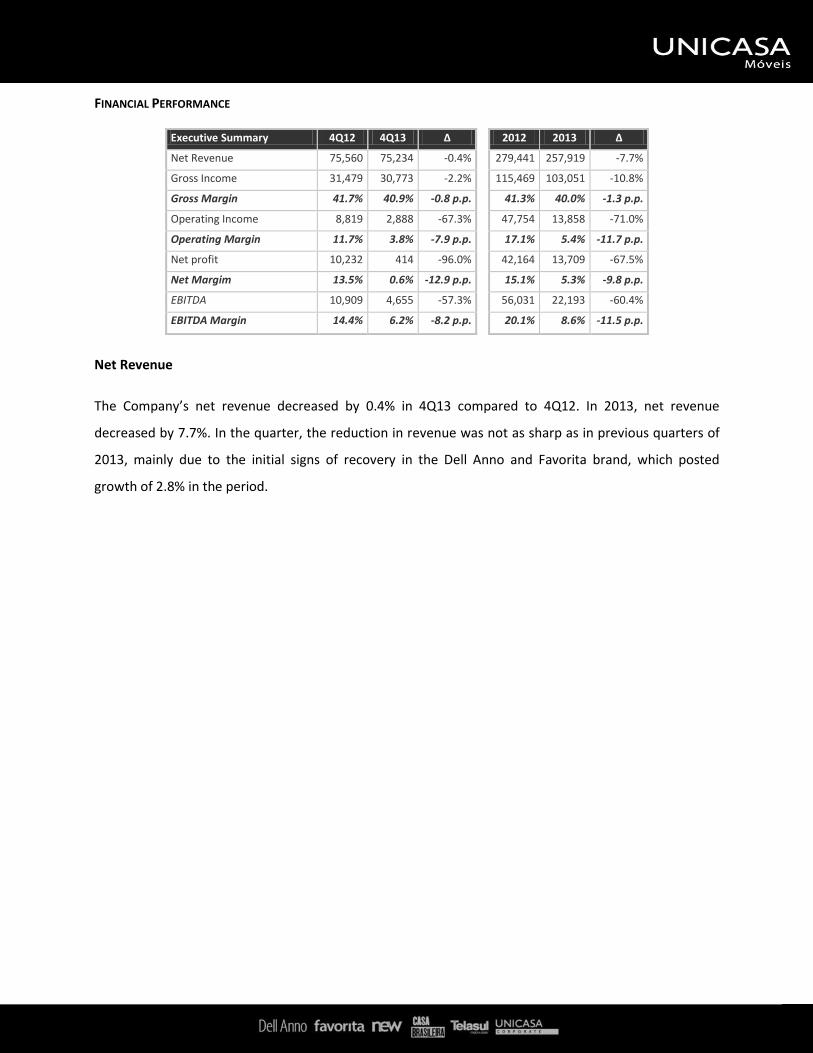
Executive Summary 4Q12 4Q13 Δ 2012 2013 Δ
Net Revenue 75,560 75,234 -0.4% 279,441 257,919 -7.7%
Gross Income 31,479 30,773 -2.2% 115,469 103,051 -10.8%
Gross Margin 41.7% 40.9% -0.8 p.p. 41.3% 40.0% -1.3 p.p.
Operating Income 8,819 2,888 -67.3% 47,754 13,858 -71.0%
Operating Margin 11.7% 3.8% -7.9 p.p. 17.1% 5.4% -11.7 p.p.
Net profit 10,232 414 -96.0% 42,164 13,709 -67.5%
Net Margim 13.5% 0.6% -12.9 p.p. 15.1% 5.3% -9.8 p.p.
EBITDA 10,909 4,655 -57.3% 56,031 22,193 -60.4%
EBITDA Margin 14.4% 6.2% -8.2 p.p. 20.1% 8.6% -11.5 p.p.
Net Revenue
The Company’s net revenue decreased by 0.4% in 4Q13 compared to 4Q12. In 2013, net revenue
decreased by 7.7%. In the quarter, the reduction in revenue was not as sharp as in previous quarters of
2013, mainly due to the initial signs of recovery in the Dell Anno and Favorita brand, which posted
growth of 2.8% in the period.

Cost of Goods Sold (COGS)
Cost per module sold increased 8.6%, from R$96.84 in 4Q12 to R$105.21 in 4Q13, mainly due to the
higher personnel expenses in the period. The nominal increase in COGS between 4Q12 and 4Q13 was
R$0.4 million, or 0.9%. Some of the main factors contributing to this result were:
i) the R$1.0 million increase in personnel expenses driven mainly by the growth in headcount a) in
the flexible production line, which was in the ramp-up phase in 4Q12; and b) in the painting line, and
also by the wage increases under the collective bargaining agreement;
ii) the R$0.9 million reduction in depreciation due to the revision in the useful life of property, plant
and equipment, which was partially offset by the depreciation of assets acquired for painting and flexible
production;
iii) the improvements obtained in our inventory control enabled us to reverse in 4Q12 the amount
provisioned for stock obsolescence. As a result, the reversal made in 2012 did not recur in 2013,
resulting in an increase of R$0.3 million in the provision for this expense in the comparison period.
The following chart presents the reconciliation of Cost of Goods Sold in 4Q12 and 4Q13(¹):
(1) In R$ million.
In 2013, cost of goods sold corresponded to 60.0% of net revenue from sales, compared to 58.7% in
2012. The increase was mainly due to the higher unit cost per module sold, which increased from
R$96.63 in 2012 to R$98.51 in 2013. This increase is explained by:
(i) primarily by personnel expenses. In 2012, the Flexible Production line was in the pre-operational
stage, while in 2013 the lacquer painting line started operations, therefore the impacts from these lines
combined represented an additional expense of R$3.48 million in 2013. Meanwhile, the wage increases
under the collective bargaining agreement resulted in a R$1.03 million increase in personnel expenses;
44.1 44.5
1.0 0.9 0.3
COGS4Q12 Personnel Depreciation Provision
COGS4Q13

(ii) the lower Net Revenue and change in the sales mix, which supported a reduction in costs of around
R$12.57 million;
(iii) the R$0.80 million reduction in depreciation expenses due to the new estimates for useful life of
assets adopted as of September 2013;
(iv) the R$0.24 million increase in other general manufacturing expenses.
The following chart presents a reconciliation of Cost of Goods Sold in 2012 and 2013(¹):
(1) In R$ million.
Gross Profit and Gross Margin
Gross Profit in the quarter amounted to R$30.8 million, with Gross Margin of 40.9%. Gross margin
contracted by 0.8 p.p. from 4Q12, driven mainly by higher personnel expenses, which were partially
offset by the improvement in the sales mix in the period. Compared to 3Q13, gross margin expanded by
1.9%, mainly due to the better sales mix and the higher revenue in the period, which helped dilute fixed
costs.
Selling, General and Administrative Expenses (SG&A)
Selling, general and administrative expenses amounted to R$29.1 million in 4Q13, increasing 21.9%
compared to 4Q12 and corresponding to 38.7% of Net Revenue.
Selling General and Administrative Expenses 4Q12 4Q13 Δ 2012 2013 Δ
Total (23,875) (29,113) 21.9% (77,059) (93,543) 21.4%
Selling Expenses (18,192) (19,501) 7.2% (57,422) (69,148) 20.4%
% of Net Revenue 24.1% 25.9% 1.8 p.p. 20.5% 26.8% 6.3 p.p.
Administrative Expenses (5,683) (9,612) 69.14% (19,637) (24,395) 24.2%
% of Net Revenue 7.5% 12.8% 5.3 p.p. 7.0% 9.5% 2.5 p.p.
SG&A % of Net Revenue 31.6% 38.7% 7.1 p.p. 27.5% 36.3% 8.8 p.p.
163.4 154.9
12.6 0.8 4.5 0.3
COGS2012 Volume Depreciation Personnel Others
COGS2013

Expenses with Own Stores and the Service Center increased R$4.4 million in the quarter, led mainly by
personnel and rental expenses. In 2013, these expenses increased by R$13.0 million. Note that in 2012,
these expenses were less relevant, since own stores were starting their pre-operational cycle.
Expenses with clients increased by R$0.5 million from 4Q12 and by R$3.4 million from 2012. These
expenses are related to the expenses with services rendered to final consumers at the closed stores.
The amortization of commercial points, which began in 3Q13, increased operating expenses by R$0.6
million in 4Q13 and by R$0.8 million in 2013.
The participation in the Refis tax amnesty program, which was announced in the Material Fact notice
dated December 16, 2013, affected administrative expenses, net of provisions by R$2.2 million.
Expenses with provisions decreased by R$2.3 million compared to 4Q12, mainly due to the lower
allowance for doubtful accounts recorded in 4Q13. In 2013, the R$3.78 million decrease was mainly due
to the accrual of nonrecurring provisions in 2Q12.
Marketing and other expenses net of the abovementioned effects decreased by R$0.2 million compared
to 4Q12, mainly due to the decrease in marketing expenses in the period, which, in turn, is mainly
explained by the annualized deferment in 2013 of the recovery in marketing expenses In 2013, other
expenses reached R$0.8 million, mainly due to the consulting services contracted in the period.
The following chart presents the reconciliation of Selling, General and Administrative Expenses in 4Q12
and 4Q13(1):
(1) In R$ million.
23.9
29.1
4.4 0.5 0.6 2.2
2.3 0.2
SG&A4Q13
Own stores andshared service
centerExpenses with
clientsDepreciation and
amortization Refis ProvisionsMarketing and
othersSG&A4Q13
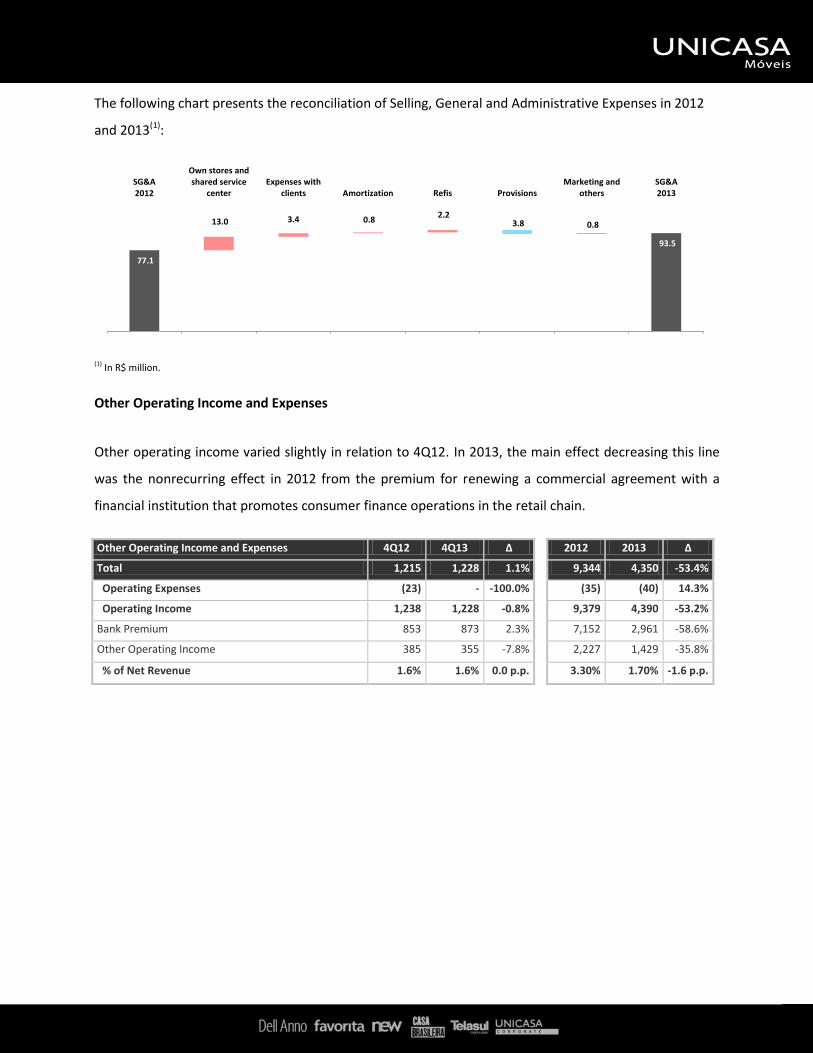
The following chart presents the reconciliation of Selling, General and Administrative Expenses in 2012
and 2013(1):
(1) In R$ million.
Other Operating Income and Expenses
Other operating income varied slightly in relation to 4Q12. In 2013, the main effect decreasing this line
was the nonrecurring effect in 2012 from the premium for renewing a commercial agreement with a
financial institution that promotes consumer finance operations in the retail chain.
Other Operating Income and Expenses 4Q12 4Q13 Δ 2012 2013 Δ
Total 1,215 1,228 1.1% 9,344 4,350 -53.4%
Operating Expenses (23) - -100.0% (35) (40) 14.3%
Operating Income 1,238 1,228 -0.8% 9,379 4,390 -53.2%
Bank Premium 853 873 2.3% 7,152 2,961 -58.6%
Other Operating Income 385 355 -7.8% 2,227 1,429 -35.8%
% of Net Revenue 1.6% 1.6% 0.0 p.p. 3.30% 1.70% -1.6 p.p.
77.1
93.5
13.0 3.4 0.8 2.2
3.8 0.8
SG&A2012
Own stores andshared service
centerExpenses with
clients Amortization Refis ProvisionsMarketing and
othersSG&A2013

Net Financial Result
The net financial result decreased 247.0% compared to 4Q12. The net financial result is presented
below:
Financial Result 4Q12 4Q13 Δ 2012 2013 Δ
Net Financial Result 1,846 (2,714) -247.0% 9,192 1,553 -83.1%
Financial Expenses (909) (5,365) 490.2% (3,075) (8,505) 176.6%
IOF charge and bank fees (119) (181) 52.1% (622) (686) 10.3%
Loans and financing expenses (128) (15) -88.3% (547) (259) -52.7%
Exchange variation expenses (104) (34) -67.3% (413) (414) 0.2%
Present value adjustment - AVP - (206) n/a (342) (365) 6.7%
Other financial expenses (558) (4,929) 783.3% (1,151) (6,781) 489%
Financial Income 2,755 2,651 -3.8% 12,267 10,058 -18.0%
Interest income 819 594 -27.5% 3,346 2,399 -28.3%
Discounts 67 47 -29.9% 516 156 -69.8%
Yield from short-term investments 465 567 21.9% 2,487 1,858 -25.3%
Exchange variation income 103 281 172.8% 314 645 105.4%
Present value adjustment - AVP 1,139 1,023 -10.2% 5,033 4,533 -9.9%
Other financial income 162 139 -14.2% 571 467 -18.2%
The participation in the Refis tax amnesty program, as announced through the Material Fact notice dated
December 16, 2013, affected the item “other financial expenses” in the amount of R$2.2 million related
to the interest paid in the process. The same item recorded financial discounts of R$2.8 million in 4Q13
arising from negotiations with dealers that resulted in the recovery of receivables and involved the
incorporation of assets. Note that both of these effects are nonrecurring.
The main factors impacting the result in the year were: (i) the R$3.5 million increase in discounts granted
to clients; (ii) the amount of R$2.2 million related to the Refis tax amnesty program, as commented
above; (iii) the lower interest income due to the lower balance related to contracts, R$0.9 million; (iv)
the lower yield from financial investments, since in 2012 the Company held cash arising from the sale of
shares up to the date of the effective payment of dividends to partners, R$0.6 million.
Net Income Net income declined by 96.0% from 4Q12, mainly due to the nonrecurring effects from Refis and the
discounts granted, as well as the higher expenses with own stores and with services rendered to final
consumers. In the year, the 67.5% decrease is explained by, in addition to the same factors that

impacted net income in the quarter augmented in the year, the accounting of the nonrecurring other
operating income recorded in 2012.
EBITDA and EBITDA Margin
EBITDA decreased by 57.3%, from R$10.9 million in 4Q12 to R$4.7 million in 4Q13. In the year, EBITDA
decreased by 60.4%, from R$56.0 million in 2012 to R$22.2 million in 2013. EBITDA margin was 6.2% in
the quarter and 8.6% in the year. The decline is explained by the same reasons that affected net income.
EBITDA 4Q12 4Q13 Δ 2012 2013 Δ
Net Income for the Period 10,232 414 -96.0% 42,164 13,709 -67.5%
(-) Income Tax and Social Contribution (433) 240 -155.4% (14,782) (1,702) -88.5%
(-) Financial Result 1,846 (2,714) -247.0% 9,192 1,553 -83.1%
EBIT 8,819 2,888 -67.3% 47,754 13,858 -71.0%
(-) Depreciation and Amortization (2,090) (1,767) -15.5% (8,277) (8,335) 0.7%
EBITDA 10,909 4,655 -57.3% 56,031 22,193 -60.4%
EBITDA Margin 14.4% 6.2% -8.2 p.p. 20.1% 8.6% -11.5 p.p.
The following chart presents the reconciliation of EBITDA in 4Q12 and 4Q13(1):
(1) In R$ million.
The following chart presents the reconciliation of EBITDA in 2012 and 2013(1):
(1) In R$ million
10.9
4.7
0.3
0.4 1.3
3.9
0.3
EBITDA4Q12
Netrevenue COGS
Salesexpenses
Admnistrativeexpenses Depreciation
EBITDA4Q13
56.0
22.1
21.5
9.1 11.7
4.8 5.0
EBITDA2012
Netrevenue COGS
Salesexpenses
Admnistrativeexpenses
Other non-recuringincome
EBITDA2013

Net Cash
On December 31, 2013, the Company held a cash balance of R$11.0 million, or 51.9% lower than in the
same period last year. In 2013, the Company paid dividends and interest on equity related to fiscal year
2012 in the amount of R$34.0 million, decreased its net debt by R$5.0 million, paid R$4.9 million related
to tax liabilities under the Refis tax amnesty program and effected an advance for CAPEX investments of
R$6.8 million.
Net Cash 12/31/2012 12/31/2013 Δ 12/31/2012 Δ(1)
Short Term Debt 5,128 557 -89.1% 5,128 -89.1%
Long Term Debt 557 - -100.0% 557 -100.0%
Gross Debt 5,685 557 -90.2% 5,685 -90.2%
Cash and Cash Equivalents 28,719 11,629 -59.5% 28,719 -59.5%
Net Cash 23,034 11,072 -51.9% 23,034 -51.9%
Return on Invested Capital (ROIC)
The Company’s net ROIC in the last twelve months (LTM) to 4Q13 was 6.1%, down 11.2 p.p. from the
same period last year.
Return on Invested Capital (ROIC) 4Q12 4Q13 Δ
EBIT (LTM) 47,754 13,858 -71.0%
Average of Operating Assets 203,713 204,615 0.4%
ROIC 23.4% 6.8% -16.6 p.p.
Effective IR + CSLL rate (LTM) 26.0% 11.0% -15.0 p.p.
ROIC, Net 17.3% 6.1% -11.2 p.p.
Allocation of net income for the year
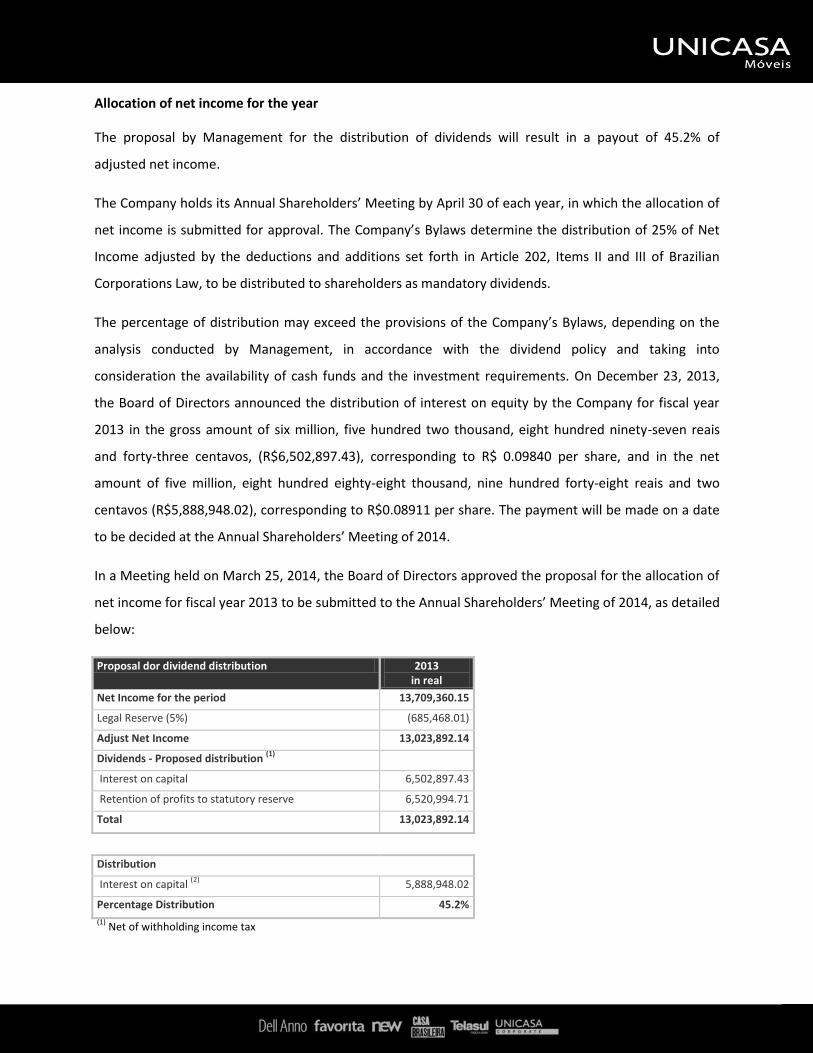
The proposal by Management for the distribution of dividends will result in a payout of 45.2% of
adjusted net income.
The Company holds its Annual Shareholders’ Meeting by April 30 of each year, in which the allocation of
net income is submitted for approval. The Company’s Bylaws determine the distribution of 25% of Net
Income adjusted by the deductions and additions set forth in Article 202, Items II and III of Brazilian
Corporations Law, to be distributed to shareholders as mandatory dividends.
The percentage of distribution may exceed the provisions of the Company’s Bylaws, depending on the
analysis conducted by Management, in accordance with the dividend policy and taking into
consideration the availability of cash funds and the investment requirements. On December 23, 2013,
the Board of Directors announced the distribution of interest on equity by the Company for fiscal year
2013 in the gross amount of six million, five hundred two thousand, eight hundred ninety-seven reais
and forty-three centavos, (R$6,502,897.43), corresponding to R$ 0.09840 per share, and in the net
amount of five million, eight hundred eighty-eight thousand, nine hundred forty-eight reais and two
centavos (R$5,888,948.02), corresponding to R$0.08911 per share. The payment will be made on a date
to be decided at the Annual Shareholders’ Meeting of 2014.
In a Meeting held on March 25, 2014, the Board of Directors approved the proposal for the allocation of
net income for fiscal year 2013 to be submitted to the Annual Shareholders’ Meeting of 2014, as detailed
below:
Proposal dor dividend distribution 2013 in real
Net Income for the period 13,709,360.15
Legal Reserve (5%) (685,468.01)
Adjust Net Income 13,023,892.14
Dividends - Proposed distribution (1)
Interest on capital 6,502,897.43
Retention of profits to statutory reserve 6,520,994.71
Total 13,023,892.14
Distribution
Interest on capital (2)
5,888,948.02
Percentage Distribution 45.2%
(1) Net of withholding income tax

Capital budget
The following table presents the capital budget for fiscal year 2014, in compliance with Instruction
480/09 issued by the Securities and Exchange Commission of Brazil (CVM) on December 7, 2009.
The business projections and outlook presented in the proposed capital budget involve risks,
uncertainties and assumptions, and therefore depend on circumstances that may or may not occur.
The conditions of the general economy and the industry and other operational factors could affect the
projected amounts for the allocation to fixed assets.
To ensure the financial feasibility of the investments planned for the Company’s expansion plan,
Management proposes the retention of 47.57% of net income for fiscal year 2013, in the amount of
R$6,521 thousand, bringing the aggregate balance of the Profit Reserve for Investment and Expansion on
December 31, 2013 to R$11,518 thousand.
Sources of finance R$ mil
Retained Profits in Profits Reserve for Investment and Expansion 11,518
Own resources (generated from operational activities during the year) 1,867
Total sources of finance 13,385
Capital expenditures budget – Investment of resources 2014
Forecast
Property, plant and equipment (13,385)
Machinery and Equipment (8,113)
Equipment and IT programs (2,944)
Leasehold improvements (1,180)
Others (1,148)
Total of capital expenditure (13,385)
The Company's Management believes it is necessary to maintain the Profit Reserve for Expansion at
current levels, which will be augmented by the retained profits for fiscal year 2013 and operating cash
flow in 2014 to support the expansion plan to be implemented over the course of the year.

Responsibility and Social and Environment Protection Projects
Unicasa complies with all environmental laws applicable to its industrial segment. Following are the
practices aimed at protecting the environment:
Separation and disposal of solid waste generated in the manufacturing process;
Treatment of industrial effluents;
Rouse of 100% of the water used in our plants;
Reuse of by-products generated during the production process, such as sawdust, wood, plastic,
and cardboard, which are used by other sectors of economy;
Substitution of diesel oil by LPG (liquefed petroleum gas);
Use of packaging made of recycable plastic to transport the furniture we produce;
Use of raw material acquired only from companie, that adopt na economically viable,
ecologically correct and socially just system, certified ISO 14001, which guarantees that the
impacts of their activities are controlled and that they undertake to use the wood from certified
planted forests, owned by the Company or by third parties, or acquired from controlled sources,
in accordance with the principles and criteria of the Forest Stewardship Council (FSC). This wood
is employed in the production of reconstituted wood boards and could also be used to produce;
Air Pollution Control System.

Independent Auditors
In compliance with Article 2 of CVM Instruction 381/03, the Company informs that Ernst& Young Terco
Auditores Independentes S.S. (“Ernst”) was engaged by the Company in the following services:
Full audit conducted in accordance with Brazilian and international audit standards of the parent
company and consolidated financial statements of the Company, prepared in accordance with the
accounting practices adopted in Brazil (parent company and consolidated) and with IFRS
(consolidated), for the fiscal year ended December 31, 2013, and the review of the Company’s Interim
Quarterly Financial Information of March 31, June 30, and September 30, 2013, for total fees of
R$156,970.00. Date of contract: April 25, 2013, duration until: April 24, 2014;
Translation of the parent company and consolidated financial statements of the Company, prepared
in accordance with the accounting practices adopted in Brazil (parent company and consolidated) and
with IFRS (consolidated), for the fiscal year ended December 31, 2013, and of the Company’s
Quarterly Financial Information as of March 31, June 30, and September 30, 2013, for total fees of
R$7,030.00, representing 4.5% of the fees paid for the audit of the financial statements. Date of
contract: April 25, 2013, duration until: April 24, 2014;
Review of the valuation reports of the market value of the store use rights (“key money”) acquired by
the Company, prepared by an expert company, for total fees of R$12,250.00, representing 7.8% of
the fees paid for the audit of the financial statements;
Tax advisory services on the review of the fiscal impact on the operations conducted by the Company
in the incorporation of the Commercial Unit (Unicasa Comércio de Móveis Ltda.) and analysis of the
compliance of the tax procedures adopted with state and federal law and with judicial and
administrative jurisprudence, with the assessment of any risks related to the present operation, with
fees based exclusively on the hours effectively worked, multiplied by the average rate of R$250.00,
with total fees in 2013 of R$12,000.00, representing 7.6% of the fees paid for the audit of the
financial statements. Date of contract: May 20, 2013, duration until: May 19, 2014;
The Company’s policy in hiring any services unrelated to the external audit from the independent auditor
is based on principles that preserve the independence of the auditor, which are: (a) auditors should not
audit their own work; (b) auditors should not perform managerial functions at their client; and (c)
auditors should not promote the interests of their client.

The Company declares that it has received a letter from Ernst on the services it provided to the Company
stating that they do not compromise the principle of independence of Ernst in relation to the external
audit services rendered to the Company.
Statement by Executive Officers
Pursuant to CVM Instruction 480/09, the executive officers hereby declare that they have reviewed,
discused and agree with financial statements for the fiscal year ended December 31, 2013 and the
opinions contained in the independent auditors’ report.

Financial Statements
Unicasa Indústria de Móveis S.A.
December 31, 2013 and 2012 with independent auditor’s report on financial statements

UNICASA INDÚSTRIA DE MÓVEIS S.A. Financial Statements December 31, 2013 and 2012 Contents Independent auditor’s report on financial statements ......................................................... 1 Audited Financial Statements Balance sheets .................................................................................................................. 3 Statements of income ....................................................................................................... 5 Statements of comprehensive income .............................................................................. 6 Statements of changes in equity ......................................... ................................................7 Statements of cash flow .................................................................................................... 8 Statements of value added ................................................................................................ 9 Notes to the financial statements .................................................................................... 10

1
A free translation from Portuguese into English of Independent Auditor’s Report on Individual Financial Statements in accordance with accounting practices adopted in Brazil and on Consolidated Financial Statements in accordance with International Financial Reporting Standards (IFRS) and also with accounting practices adopted in Brazil.
Independent auditor’s report on financial statements The Shareholders, Board of Directors and Officers
Unicasa Indústria de Móveis S.A. Bento Gonçalves – RS We have audited the accompanying individual and consolidated financial statements of Unicasa Indústria de Móveis S.A. (“Company”), identified as Company and Consolidated, respectively, which comprise the balance sheet as at December 31, 2013 and the related statement of income, comprehensive income, changes in equity and cash flow for the year then ended, and a summary of significant accounting practices and other explanatory information. Management's responsibility for the financial statements Management is responsible for the preparation and fair presentation of the individual financial statements in accordance with accounting practices adopted in Brazil and of the consolidated financial statements in accordance with the International Financial Reporting Standards (IFRS), issued by the International Accounting Standards Board (IASB), and in conformity with the accounting practices adopted in Brazil, and for such internal control as management determines is necessary to enable the preparation of financial statements that are free from material misstatement, whether due to fraud or error. Auditor’s responsibility Our responsibility is to express an opinion on these financial statements based on our audit. We conducted our audit in accordance with the Brazilian and international standards on auditing. Those standards require that we comply with ethical requirements and plan and perform the audit to obtain reasonable assurance about whether the financial statements are free from material misstatements. An audit involves performing procedures to obtain audit evidence about the amounts and disclosures in the financial statements. The procedures selected depend on the auditor's judgment, including the assessment of the risks of material misstatement of the financial statements, whether due to fraud or error. In making those risk assessments, the auditor considers internal control relevant to the Company’s preparation and fair presentation of the Company’s financial statements in order to design audit procedures that are appropriate in the circumstances, but not for the purpose of expressing an opinion on the effectiveness of the Company's internal control. An audit also includes evaluating the appropriateness of accounting practices used and the reasonableness of accounting estimates made by management, as well as evaluating the overall presentation of the financial statements. We believe that the audit evidence we have obtained is sufficient and appropriate to provide a basis for our audit opinion. Opinion on the individual financial statements In our opinion, the individual financial statements referred to above present fairly, in all material respects, the financial position of Unicasa Indústria de Móveis S.A. at December 31, 2013, and its financial performance and its cash flows for the year then ended in accordance with the accounting practices adopted in Brazil.

2
Opinion on the consolidated financial statements In our opinion, the consolidated financial statements referred to above present fairly, in all material respects, the consolidated financial position of Unicasa Indústria de Móveis S.A. as at December 31, 2013, and its consolidated financial performance and its consolidated cash flows for the year then ended, in accordance with the International Financial Reporting Standards (IFRS), issued by the International Accounting Standards Board (IASB) and with the accounting practices adopted in Brazil. Emphasis of a matter As described in Note 2.1, the individual financial statements were prepared in accordance with accounting practices adopted in Brazil. In the case of Unicasa Indústria de Móveis S.A., these practices differ from IFRS, applicable to the separate financial statements, solely with respect to the measurement of investments in subsidiaries under the equity method, while such investments would be measured at cost or fair value for IFRS purposes. Our opinion is not qualified in respect of this matter. Other matters Statements of value added We have also audited the individual and consolidated statement of value added for the year ended December 31, 2013, prepared under the Company’s Management responsibility, the presentation of which is required by the Brazilian Corporation Law for publicly held companies, and an supplementary information under the IFRS, whereby no statement of value added presentation is required. These statements have been subject to the same auditing procedures previously described and, in our opinion, are presented fairly, in all material respects, in relation to the overall financial statements. Porto Alegre, March 10, 2014. ERNST & YOUNG Auditores Independentes S.S. CRC-2SP015199/O-6/F/RS
Américo F. Ferreira Neto Accountant CRC-1SP192685/O-9

3
A free translation from Portuguese into English of Individual Financial Statements in accordance with accounting practices adopted in Brazil and on Consolidated Financial Statements in accordance with International Financial Reporting Standards (IFRS), and also with accounting practices adopted in Brazil.
UNICASA INDÚSTRIA DE MÓVEIS S.A. Balance sheets Years ended December 31, 2013 and 2012 (In thousands of reais)
Company Consolidated
Note 2013 2012 2013
Assets
Current assets
Cash and cash equivalents 4 11,316 28,719 11,629
Trade accounts receivable 5 64,308 77,732 65,342
Inventories 6 21,875 19,296 23,304
Advances and prepayments 1,449 1,038 1,559
Loans granted 8 1,287 1,971 1,287
Prepaid expenses 2,361 1,868 2,386
Taxes recoverable 6,220 3,104 6,230
Other assets 12 2,612 2,377 2,648
Total current assets 111,428 136,105 114,385
Noncurrent
Long-term receivables
Trade accounts receivable 5 9,369 15,476 9,369
Loans granted 8 2,387 5,547 2,387
Noncurrent asset held for sale 7 12,668 8,848 12,668
Deferred income and social contribution taxes 15 6,489 6,734 9,481 Taxes recoverable 18 25 18
Prepaid expenses 88 251 88
Judicial deposits 16 3,555 2,140 3,555
Other assets 12 1,975 2,004 1,975
36,549 41,025 39,541
Investments 9 784 404 82
Property, plant and equipment (PP&E) 10 80,119 78,373 81,758
Intangible assets 11 21,117 18,312 21,120
102,020 97,089 102,960
Total noncurrent assets 138,569 138,114 142,501
Total assets 249,997 274,219 256,886

4
Company Consolidated
Note 2013 2012 2013
Liabilities
Current liabilities
Loans and financing 13 557 5,128 557
Trade accounts payable 14 6,245 6,698 6,311
Tax obligations 4,196 4,961 4,636
Interest on equity payable 17.c 5,889 7,990 5,889
Salaries and social charges 4,826 4,507 5,983
Advances from customers 16,840 14,002 22,037
Mandatory dividends to be distributed 17.c - 2,024 -
Other current liabilities 985 1,057 1,014
Total current liabilities 39,538 46,367 46,427
Noncurrent
Loans and financing 13 - 557 -
Provision for tax, civil and labor contingencies 16 5,156 5,165 5,156
Total noncurrent liabilities 5,156 5,722 5,156
Equity 17
Capital 187,709 187,709 187,709
Capital reserves (2,658) (2,658) (2,658)
Income reserves 20,252 13,045 20,252
Proposed additional dividends - 24,034 -
Total equity 205,303 222,130 205,303
Total liabilities and equity 249,997 274,219 256,886
See accompanying notes.

5
UNICASA INDÚSTRIA DE MÓVEIS S.A. Statement of income Years ended December 31, 2013 and 2012 (In thousands of reais, except earnings per share)
Company Consolidated
Note 2013 2012 2013
Net sales revenue 22 256,706 279,441 257,919 Cost of sales (156,159) (163,972) (154,868)
Gross profit 100,547 115,469 103,051
Operating income (expenses)
Selling expenses (61,868) (57,422) (69,148) Administrative expenses (19,830) (19,637) (24,395)
Other operating revenues, net 19 4,020 9,344 4,350 Equity pickup 9 (6,098) - -
(83,776) (67,715) (89,193)
Income before profit or loss 16,771 47,754 13,858
Financial income (expenses), net
Financial expenses 20 (8,423) (3,075) (8,505)
Financial income 20 10,055 12,267 10,058
1,632 9,192 1,553
Income before income and social contribution taxes 18,403 56,946 15,411
Income and social contribution tax expenses 15
Current (4,449) (15,719) (4,449) Deferred (245) 937 2,747
(4,694) (14,782) (1,702)
Net income for the year 13,709 42,164 13,709
Basic and diluted earnings per share (R$) 18 0.21 0.67 0.21
See accompanying notes.

6
UNICASA INDÚSTRIA DE MÓVEIS S.A. Statements of comprehensive income Years ended December 31, 2013 and 2012 (In thousands of reais)
Company Consolidated
2013 2012 2013
Net income for the year 13,709 42,164 13,709
Other comprehensive income - - -
Total comprehensive income for the year, net of taxes 13,709 42,164 13,709
See accompanying notes.

]
7
UNICASA INDÚSTRIA DE MÓVEIS S.A. Statements of changes in equity Years ended December 31, 2013 and 2012 (In thousands of reais)
Income reserves
Paid in capital
Capital reserve
Legal reserve
Reserve for expansion
Proposed additional dividends Retained earnings Total
Balances at December 31, 2011 29,699 - 5,939 - 160,101 - 195,739 Capital increase (Note 17.a) 158,010 - - - (30,101) - 127,909 Share issuance expenses (Note 17.b) - (2,658) - - - - (2,658) Distributed dividends (Note 17.c) - - - - (130,000) - (130,000) Net income for the year - - - - - 42,164 42,164 Allocation of income:
Interest on equity (Note 17.c) - - - - - (9,000) (9,000) Mandatory minimum dividends - - - - - (2,024) (2,024) Additional dividends proposed (Note 17.c) - - - - 24,034 (24,034) - Retained earnings (Note 17.b) - - 2,109 4,997 - (7,106) -
Balances at December 31, 2012 187,709 (2,658) 8,048 4,997 24,034 - 222,130 Distributed dividends (Note 17.c) - - - - (24,034) - (24,034) Net income for the year - - - - - 13,709 13,709 Allocation of income:
Interest on equity (Note 17.c) - - - - - (6,502) (6,502) Retained earnings (Note 17.b) - - 686 6,521 - (7,207) -
Balances at December 31, 2013 187,709 (2,658) 8,734 11,518 - - 205,303
See accompanying notes.

]
8
UNICASA INDÚSTRIA DE MÓVEIS S.A. Statement of cash flow Years ended December 31, 2013 and 2012 (In thousands of reais)
Company Consolidated
2013 2012 2013
Income before income and social contribution taxes 18,403 56,946 15,411 Adjustments to reconcile net income to cash and cash equivalents:
Depreciation and amortization 8,286 8,277 8,335 Foreign exchange variation - customers (87) 73 (87) Exchange variation - Suppliers (57) (15) (57) Interest appropriation 259 547 259 Provision for labor, tax and civil risks (9) 1,776 (9) Provision for obsolescence (27) (694) (27) Allowance for doubtful accounts 3,420 4,123 3,420 Provision for losses with sureties - 2,468 - Write-offs of PP&E 442 122 442 Equity pickup 6,098 - -
36,728 73,623 27,687 Changes in assets and liabilities:
Trade accounts receivable 12,987 (369) 11,953 Inventories (2,552) 3,542 (3,981) Taxes recoverable 1,591 (178) 1,581 Restricted short-term investments - 323 - Loans granted 3,844 3,184 3,844 Prepaid expenses (330) 4,081 (355) Judicial deposits (1,415) (721) (1,415) Other current or noncurrent assets (616) (4,444) (762) Noncurrent assets held for sale (3,820) (2,097) (3,820) Trade accounts payable 497 (784) 563 Advance from customers 2,838 (267) 8,035 Tax obligations (1,379) (2,831) (939) Other current and noncurrent liabilities 247 (49) 1,433 Payment of income and social contribution taxes (9,149) (26,395) (9,149)
Net cash provided by operating activities 39,471 46,618 34,675
Cash flow from investing activities:
In investments (6,800) - - In PP&E (10,106) (11,205) (11,794) In intangible assets (533) (3,137) (536)
Cash flow used in investing activities (17,439) (14,342) (12,330)
Cash flow from financing activities
Capital increase – issue of shares - 127,909 - Share issue expenses - (4,027) - Loan repayments (5,387) (1,665) (5,387) Payment of interest on equity (7,990) (7,905) (7,990) Dividend paid (26,058) (130,000) (26,058)
Cash flow used in financing activities (39,435) (15,688) (39,435)
Increase/(decrease) in cash and cash equivalents (17,403) 16,588 (17,090)
Statement of changes in cash and cash equivalents
At beginning of year 28,719 12,131 28,719 At the end of year 11,316 28,719 11,629
Increase/(decrease) in cash and cash equivalents (17,403) 16,588 (17,090)
See accompanying notes.

]
9
UNICASA INDÚSTRIA DE MÓVEIS S.A. Statements of value added Years ended December 31, 2013 and 2012 (In thousands of reais)
Company Consolidated
2013 2012 2013
Revenue from product sale, net of returns and adjustment to present value
335,831 357,958
338,337
Other revenues 3,773 8,955 4,103 Allowance for doubtful accounts (3,420) (4,123) (3,420)
336,184 362,790 339,020 Inputs acquired from third parties Cost of products and goods sold (163,567) (174,153) (163,024) Materials, energy, third-party services (47,122) (41,619) (49,595) Other (9,586) (14,448) (9,630)
(220,275) (230,220) (222,249) Gross value added 115,909 132,570 116,771 Depreciation and amortization (8,286) (8,277) (8,335)
Gross value added generated by the Company 107,623 124,293 108,436
Value added received in transfer Equity pickup (6,098) - - Financial income 10,055 12,267 10,058
3,957 12,267 10,058
Total unpaid value added 111,580 136,560 118,494
Personnel
Direct compensation 31,705 27,597 37,889 Benefits 3,547 5,251 3,949 Unemployment Compensation Fund (FGTS) 2,734 2,017 3,289
37,986 34,865 45,127 Taxes, fees and contributions Federal 28,257 34,121 25,998 State 19,723 21,830 20,071 Municipal 96 61 126
48,076 56,012 46,195 Debt remuneration Rent 3,589 444 5,161 Interest 259 547 259 Other 7,961 2,528 8,043
11,809 3,519 13,463 Equity remuneration Dividends and interest on equity 6,502 35,058 6,502 Retained profits 7,207 7,106 7,207
13,709 42,164 13,709
Total value added distributed 111,580 136,560 118,494
See accompanying notes.

10
1. Operations Unicasa Indústria de Móveis S.A. (the “Company”) was established in 1985 and is primarily engaged in manufacturing, importing and exporting furniture made of wood, iron, steel and aluminum, kitchen furniture and other commercial and residential furniture items. The Company is a publicly-held company, headquartered in the city of Bento Gonçalves, state of Rio Grande do Sul. Its shares have been traded in the New Market segment of Brazilian Securities, Commodities and Futures Exchange (BM&FBovespa S.A.), under the stock ticker symbol UCAS3 since April 27, 2012. The Company has a broad chain of exclusive retailers and multi-brand stores in Brazil and abroad selling products of the following brands: “Dell Anno”, “Favorita”, “New”, “Telasul Modulados” and “Casa Brasileira”. The Company’s modern manufacturing plant has state-of-the-art technology, developing, manufacturing, distributing and selling furniture and other products for all types of residential and commercial environments, reaching all consumption segments. Following is the Company’s subsidiary included in the consolidated quarterly information: Unicasa Comércio de Móveis Ltda. Unicasa Comércio de Móveis Ltda. was incorporated on October 8, 2012 and is engaged in the retail sale of planned furniture, with stores in operation in the city of São Paulo and Manaus. Unicasa Comércio de Móveis Ltda. started operations in April 2013.
2. Summary of significant accounting practices
2.1 Basis for preparation and presentation of financial statements The financial statements were prepared in accordance with accounting practices adopted in Brazil, which comprise the rules and regulations issued by the Brazilian Securities Commission (CVM) and the pronouncements, interpretations and guidance issued by the Brazilian Accounting Standards Committee (CPC), and in accordance with the International Financial Reporting Standards (IFRS), as issued by the International Accounting Standards Board (IASB). The Board of Directors’ meeting held on March 5, 2014 authorized the issue of the Company’s financial statements (Company and consolidated) for the year ended December 31, 2013. The preparation of these financial statements requires the use of certain accounting estimates and judgment by the Company management, the most significant of which are disclosed in Note 3. The Company reviewed and adopted all standards, revisions and interpretations issued by IASB and CPC that are effective for the financial statements for year ended December 31, 2013 and 2012.

11
2. Summary of significant accounting practices (Continued)
2.2 Basis of consolidation The subsidiary Unicasa Comércio de Móveis Ltda. is fully consolidated as of the establishment date, on which the Company acquired the control thereof and will continued to be consolidated until this control ceases to exist. The financial statements of the subsidiary are prepared for the same reporting period as that of the Company, using consistent accounting practices. All intragroup balances, revenue and expenses and unrealized gains and losses, arising from companies’ transactions are fully eliminated. The change in interest equity on a subsidiary that does not result in loss of control is accounted for as a transaction between shareholders under equity.
2.3 Investments in subsidiaries The investment in the subsidiary is assessed at the equity method, in accordance with CPC 18.
Based on the equity method, investments in subsidiaries are recorded in the Company’s balance sheets at cost, plus changes after acquisition of equity interest in the subsidiary. The equity interest in the subsidiary will be demonstrated in the Company’s income statement as equity pickup, representing the net income attributable to Company’s shareholders. After the equity method is applied for disclosure of the Company’s financial statements, the Company determines whether it is necessary to recognize additional impairment losses on its investments in subsidiaries. The Company determines, at each balance sheet date, whether there is objective evidence of impairment in the subsidiaries’ investments. If such evidence is identified, the Company calculates impairment as the difference between the recoverable and book value of the subsidiary, and recognizes the resulting amount in the Company’s income statement.
2.4 Revenue recognition Revenue is recognized to the extent that it is probable that the economic benefits will flow to the Company and can be reliably measured. Revenue is measured based on fair value of the consideration received, net of discounts, rebates and taxes or charges on sales. The Company assesses revenue transactions in accordance with specific criteria to determine if it is the agent or principal and thus concluded it has been acting as the principal in all its sales contracts. The following specific criteria must also be satisfied before revenue recognition: Sale of products Sales revenue is recognized when significant risks and rewards of ownership of the products are transferred to the buyer, which generally occurs upon delivery thereof.

12
2. Summary of significant accounting practices (Continued)
2.4 Revenue recognition (Continued) Financial income For all financial instruments stated at amortized cost, interest income or expense is recorded at the effective interest rate, discounting exactly the payments or estimated future receipts of cash during the estimated life of the financial instruments or in a shorter period of time, where applicable, at net book value of financial assets or liabilities. Interest income is recognized under “Financial income”, in the income statement.
2.5 Translation of foreign currency denominated balances These financial statements are presented in Brazilian reais (R$), which is the Company’s functional currency. Transactions in foreign currency are initially recorded at the foreign currency exchange rate on the transaction date. Monetary assets and liabilities stated in foreign currency are translated at the foreign exchange rate effective on the balance sheet date. All differences are recorded in the income statement.
2.6 Cash and cash equivalents Cash and cash equivalents include cash, balances in bank account, short-term investments redeemable up to three months as of the date of acquisition and with insignificant risk of change in their market value
2.7 Trade accounts receivable Trade accounts receivable are recorded at billed amount, adjusted at present value when applicable, including the corresponding direct taxes incumbent upon the Company. Trade accounts receivable from foreign customers are updated as disclosed in Note 25. If the receipt period corresponds to one year or less, these accounts receivable will be classified as current assets. Otherwise, these will be classified under non-current assets. Allowance for doubtful accounts was recorded in an amount considered sufficient by the Company’s management to cover any losses arising from the realization of credits, based on the analysis of balances of customers with default risk.

13
2. Summary of significant accounting practices (Continued)
2.8 Inventories Inventories are stated at cost or net realizable value, whichever is lower. Costs incurred in bringing each product to its current location and conditions are accounted as follows: (i) Raw-materials – acquisition cost based on average cost. (ii) Finished products and work in process – cost of direct materials and labor and a
proportional portion of overhead costs, based on regular operating capacity. Net realizable value corresponds to sales price in the normal course of business, less estimated conclusion costs and estimated selling costs. Provisions for slow-moving or obsolete inventories are recognized when deemed necessary by Company management.
2.9 Noncurrent assets held for sale Noncurrent assets classified as held for sale are measured based on the lower amount between book value and fair value, deducted of cost to sell. Noncurrent assets are classified as held for sale when the related book values are recovered by means of a sale transaction, rather than through continuous use. This condition is only met when the sale is highly probable and the group of assets/assets for sale is available for immediate sale in their current condition. Management should be committed the sale. Once classified as held for sale, the assets are not depreciated or amortized.
2.10 Property, plant and equipment These are recorded at acquisition or construction cost. Depreciation is calculated on a straight-line basis at rates considering the estimated useful life of assets as described in Note 10. PP&E is stated net of Social Contribution Tax on Gross Revenue for Social Integration Program (PIS)/Social Contribution Tax on Gross Revenue for Social Security Financing (COFINS) and State VAT (ICMS) credits, recorded against taxes recoverable. An item of property, plant and equipment is derecognized on disposal or when no future economic benefits are expected from its use or sale. Possible gains or losses from assets written off - calculated as the difference between net sales and book value of assets - are included in the income statement in the year in which the asset is written off. Repair and maintenance costs are recognized in the income statement, when incurred. The net book value and useful life of assets and depreciation methods are reviewed at each year-end, and prospectively adjusted, if so necessary.

14
2. Summary of significant accounting practices (Continued)
2.11 Intangible assets Intangible assets acquired separately are measured on initial recognition at cost. Following initial recognition, intangible assets are carried at cost less accumulated amortization, when applicable. Intangible assets internally generated are not capitalized, being recognized in the income statement in the year as incurred. The useful life of intangible assets is evaluated as finite and indefinite. Intangible assets with finite lives are amortized over the useful economic life and assessed for impairment whenever there is an indication that the intangible asset may be impaired. The amortization period and method for an intangible asset with a finite useful life are reviewed at least at the each financial year-end. Changes in the estimated useful life or the expected pattern of consumption of future economic benefits embodied in the asset are accounted for by changing the amortization period or method, as appropriate, and treated as changes in accounting estimates. The amortization charges on finite-lived intangible assets are recognized in the income statement in the expense category consistent with the use of the intangible asset. Intangible assets with indefinite useful lives are not amortized; however they are annually tested to determine impairment losses, individually or in relation to cash-generating unit. The useful life of an intangible asset having indefinite life is reviewed annually to determine whether indefinite life assessment remains supportable. Otherwise, change in the useful life assessment from indefinite to finite shall be performed on prospective basis.
2.12 Impairment of non-financial assets Management regularly reviews the net book value of assets in order to evaluate events or changes in the operating or technological economic circumstances that may indicate deterioration or impairment. When such evidence is identified and the net book value exceeds the recoverable amount, a valuation allowance is set up by adjusting the net book value at recoverable amount The recoverable amount of an asset or a cash-generating unit is defined as the higher of value in use and fair value less costs to sell. In order to estimate the asset’s value in use, estimated future cash flows are discounted to present value by using a discount rate before taxes that reflects the weighted average cost of capital for the industry in which the cash-generating unit operates. The net sale price is determined, whenever possible, considering firm sale contracts on an arm’s length basis, between knowledgeable, willing parties, adjusted by costs to sell the asset, or, in the absence of firm sale contracts, based on the observable market price in an active market, or on the most recent transaction price involving similar assets. At December 31, 2013, no impairment risks were identified; accordingly, no provision for impairment losses was required.

15
2. Summary of significant accounting practices (Continued)
2.13 Present value adjustment of assets and liabilities Current and noncurrent monetary assets and liabilities are adjusted to present value, when the effect is considered significant in relation to the overall accompanying overall financial statements. At December 31, 2013 and 2012, only trade accounts receivable and loans granted to customers were considered significant and subject to present value adjustment. There were no other current or noncurrent assets and liabilities, which required present value adjustment. The present value is calculated at the interest rate reflecting term and risk of each transaction, also considering contractual cash flows and explicit and sometimes implicit interest rate, interest rate of the respective assets and liabilities. For forward transactions, the Company uses Selic rate variation, since this is the benchmark rate used in this type of transaction. Present value adjustment of trade accounts receivable is recorded against gross revenue in P&L and the difference between present value of a transaction and face value of billing is considered as a financial income and will be allocated based on amortized cost.
2.14 Provisions General Provisions are recognized when the Company has a present, legal or not formalized obligation arising from a past event, the settlement of which is likely to require an outflow of economic benefits, and such obligation amount may be reliably estimated. Provisions for tax, civil and labor risks The Company is party to various lawsuits and administrative proceedings. Provisions are set up for all contingencies related to lawsuits for which an outflow of resources is probable to settle the contingency/obligation and when its amount may be reasonably estimated. The assessment of the chances of loss includes analysis of available evidence, hierarchy of laws, available case law, recent court decisions and their relevance in the legal system, as well as the opinion of the Company’s outside legal counsel. Provisions are reviewed and adjusted so as to consider changes in circumstances, such as applicable prescription period, tax inspection conclusions or additional exposures identified based on new matters or court decisions.
2.15 Taxation Sales tax Revenues, expenses and assets are recognized net of sales tax, except:
when taxes on sales incurred on the purchase of goods or services are not recoverable with the tax authorities, case in which taxes on sales are recognized as part of the acquisition cost or of expense item, as follows;
when amounts receivable and payable are presented together with sales tax.
when net sales taxes, either recoverable or payable, are included as a component of amounts receivable or payable in the balance sheet.
16
2. Summary of significant accounting practices (Continued)
2.15 Taxation (Continued) Sales tax (Continued) Sales revenues are subject to the following taxes and contributions at the statutory rates below:
Rates
State VAT (ICMS) 7.00% to 17.00% Federal VAT (IPI) (*) 5.00% to 10.00% Social Contribution Tax on Gross Revenue for Social Security (COFINS) 7.60% Social Contribution Tax on Gross Revenue for Social Integration (PIS) 1.65% Social Security Tax (INSS) 1.00%
* The Federal Government reduced to zero the Federal VAT (IPI) rate through Decree No 7705, 7770, 7796 and 7879 from March 26, 2012 to January 31, 2013. Through Decrees No. 7879, 8035 and 8116 entered into in 2013, it established IPI rates at 2.5% from February 1 to June 30, at 3% from July 1 to September 30 and 3.5% from October 1 to December 31, respectively. . Sales revenues are stated net of these taxes in income statement for the year. Credits arising from noncumulative PIS/COFINS are recorded by deducting the cost of sales. Current income and social contribution taxes Current tax assets and liabilities are measured at expected recoverable value or payable to tax authorities, and are stated as current assets or liabilities, according to their expected realization and/or settlement. The tax rates and tax laws used to calculate the amount are those in force or substantially in force at balance sheet date. Deferred income and social contribution taxes Deferred taxes arise from temporary differences at the balance sheet date between the tax bases of assets and liabilities and their book value. Deferred taxes are recognized for all deductible temporary differences, to the extent it is probable that a taxable profit will be available against which the deductible temporary differences, except when the deferred tax assets or liabilities relating to the deductible temporary difference arises from the initial recognition of an asset or liability in a transaction other than a business combination and, at the time of the transaction, affects neither the accounting profit nor the taxable profit or loss The carrying value of deferred tax assets is reviewed at each balance sheet date and written-off to the extent that it is no longer probable that taxable profits will be available to allow all or part of the deferred tax assets to be used. Deferred tax assets and liabilities are recorded under noncurrent assets or liabilities and are measured at tax rates expected to be applied in the year, in which the asset is realized, based on tax rates (and tax laws) duly enacted at the reporting date.

17
2. Summary of significant accounting practices (Continued)
2.16 Other employee benefits Benefits granted to Company’s employees and managing officers include, in addition to fixed compensation (salaries and social security contributions, vacation pay and 13th monthly salary pay), variable compensation, such as profit sharing, health care plan and education allowance. These benefits are recorded in the income statement for the year when the Company has an obligation on an accrual basis, as incurred.
2.17 Earnings per share The Company calculates its basic and diluted earnings per share using the weighted average number of common shares outstanding over the corresponding period.
2.18 Cash flow statement and statement of value added
The cash flow statements were prepared under the indirect method and are presented in accordance with CPC 03 R2 (IAS 7) - Cash Flow Statement issued by the Brazilian Accounting Standards Committee (CPC). The statement of value added was prepared in accordance with CPC 09.
2.19 Financial instruments - Initial recognition and subsequent measurement
Initial recognition and measurement Financial instruments are initially recognized at fair value plus transaction costs directly attributable to their acquisition or issue, except for financial assets and liabilities classified at fair value through profit or loss, when such costs are directly charged to P&L for the year. The main financial assets recognized by the Company comprise; cash and cash equivalents, trade accounts receivable and loans granted to customers. These assets were classified under loans and receivable. The main financial liabilities comprise; trade accounts payable, other accounts payable and loans and financing. These instruments are classified as loans and financing and measured at amortized cost. Subsequent measurement The subsequent measurement of financial instruments is performed at each balance sheet date according to classification of financial asset and liability under the following categories: fair value through profit or loss, held-to-maturity investments, loans and receivables and loans and financing. The Company’s financial assets and liabilities were classified into the following categories:

18
2. Summary of significant accounting practices (Continued)
2.19 Financial instruments - Initial recognition and subsequent measurement (Continued) Subsequent measurement - (Continued) Loans and receivable Loans and receivables are non-derivative financial assets with fixed or determinable payments not quoted in an active market. After initial measurement, such financial assets are subsequently measured at amortized cost at the effective interest rate method less impairment. Amortized cost is calculated by taking into account any discount or premium upon acquisition and fees or costs incurred. The amortization of the effective interest rate method is recorded under financial income under P&L. Impairment losses are recognized as financial expenses under P&L. Loans and financing After initial recognition, interest bearing loans and financing are subsequently measured at amortized cost using the effective interest rate method. Gains and losses are recognized in P&L when the liabilities are written off, as well as upon amortization under the effective interest rate method.
2.20 Information by segment The Company’s operations involve developing, manufacturing, marketing and providing furniture-related services (modular and planned) for both the domestic and international markets, which are organized in a single operating segment. Although products are sold through specific sales channels, according to their category, the Company manages and controls its products on an integrated basis. The corresponding operating results are also monitored and assessed on an integrated basis
2.21 Lease agreements
Finance leases that transfer basically all the risks and rewards related to ownership of the leased item to the Company are capitalized at the inception of the lease at fair value of the leased asset or, if lower, the present value of minimum lease payments. Costs will be increased by the initial directed costs incurred in the transaction, where applicable. Payments of finance lease transactions are allocated to financial charges and reduction of liabilities of finance lease transactions in order to obtain a constant interest rate on the remaining balance of the liabilities. The financial charges are recognized in the income statement. The leased assets are depreciated over their useful lives. However, when there is no reasonable certainty that the Company will obtain ownership at the end of the lease term, the asset is depreciated over its estimated useful life or within the lease term, whichever is shorter. The operating lease payments are recognized as expense in the income statement at a straight-line method over the lease transaction term.

19
2. Summary of significant accounting practices (Continued)
2.22 IFRS standards not yet effective as of December 31, 2013
Standards issued but not yet effective Following are the standards and interpretations issued but not yet effective on this reporting date. The Company intends to adopt these pronouncements, if applicable, once they become effective. IAS 32 Offsetting of Financial Assets and Financial Liabilities – Amendments to IAS 32 These amendments explain the meaning of “currently have a legally enforceable right of set-off”. The amendments also explain the adoption of the offset criteria of IAS 32 for the settlement systems (such as the clearing house systems), which apply gross mechanisms of settlement that are not simultaneous. These amendments will not have an impact on the Company’s financial position, performance or disclosures effective for annual periods beginning on or after January 1, 2014. IFRS 9 — “Financial Instruments: Classification and measurement IFRS 9 Financial Instruments- Recognition and Measurement IFRS 9, as originally issued, reflects the first Phase 1 of IASB’s work to replace IAS 39 in its entirety. It is applicable to recognition and measurement of financial assets and financial liabilities, such as established in IAS 39. IFRS 9 was initially effective for periods beginning after January 1, 2013, however; Amendments to IFRS9 – Effective date of IFRS 9 and Transition Disclosures, issued in December 2011, amended the effective date of IFRS 9 to January 1, 2015. IASB will subsequently address the impairment methodology and hedge accounting of financial assets. The Company does not expect this amendment to affect its financial statements. IFRIC 21 Levies IFRIC 21 provides guidance on when to recognize a liability for a tax or levy when the obligating event occurs. For a levy that is triggered upon reaching a given metric, the interpretation indicates that no liability should be recognized before the specified metric is reached. IFRIC 21 is applicable for annual periods beginning on or after January 1, 2014. Management does not anticipate any material impact from IFRIC 21 on the financial statements of the Company. There are no other standards and interpretations issued but not yet adopted that may, in the management opinion, have a significant impact on the income or equity disclosed by the Company.
.

20
3. Significant accounting judgments, estimates and assumptions The preparation of the Company’s financial statements require Management to make judgments and estimates and adopt assumptions that affect the presented revenues, expenses, assets and liabilities as well as the disclosures of contingent liabilities at the reporting date. However, the uncertainty related to these assumptions and estimates could lead to results that require significant adjustment at the book value of the asset or liability affected in future periods. Estimates and assumptions Significant assumptions, regarding the uncertainty sources of future estimates and other significant estimate-related sources of uncertainty as of the balance sheet date, involving significant risk of future adjustments in assets and liabilities’ book value for the following financial year, are discussed below: Provisions for tax, civil and labor risks: The assessment of the chances of loss includes analysis of available evidence, hierarchy of laws, available case law, recent court decisions and their relevance in the legal system, as well as the opinion of the Company’s outside legal counsel. Provisions are reviewed and adjusted to consider changes in circumstances, such as: applicable prescription period, tax audit conclusions or additional exposures identified based on new matters or court decisions. Impairment loss of non-financial assets: Impairment losses exist when the book value of an asset or cash-generating unit exceeds its recoverable value, which is the highest amount between fair value less selling cost and value in use. The calculation of fair value less selling costs is based on information available on sales’ transactions of similar assets or market prices less any additional costs to dispose of the asset. Calculation of value in use is based on discounted cash flow model. Cash flows derive from budget for the following five years and include no restructuring activities to which the Company is not yet committed or significant investments that may improve the asset base of the cash generating unit subject to test. The recoverable value is sensitive to the discount rate used in discounted cash flow method, as well as to the receipt of estimated future cash flows and the growth rate used for extrapolation purposes. Taxes: There are uncertainties regarding the interpretation of complex tax regulations, and the amount and timing of future taxable results. Given the nature and the complexity of existing contractual instruments, differences between actual results and assumptions adopted, or future changes in these assumptions could require future adjustments in the already recorded revenue and tax expenses. The Company records provisions for contingencies that may arise as a result of tax audits by competent authorities in the jurisdictions in which it operates. The amount of these provisions is based on various factors, such as past tax audit experience and different interpretations of tax regulations by the taxable entity and by the relevant tax authority. These differences of interpretation may arise on a wide variety of subjects depending on conditions prevailing in the Company’s domicile. Settlement of transactions involving these estimates may result in amounts significantly different from those recorded in the financial statements due to the probabilistic treatment inherent to the estimate process. The Company reviews its estimates and assumptions at least on a quarterly basis.

21
4. Cash and cash equivalents
Company Consolidated
2013 2012 2013
Cash and banks 396 1,728 709
Short-term investments
Bank Deposit Certificate (CDB) 10,920 26,991 10,920
11,316 28,719 11,629
These highly liquid short-term investments are immediately convertible into known cash amounts and subject to insignificant risk of any changes in value
Short-term investments are made with first tier banks (Brazil’s ten largest bank institutions), earnings of which are pegged to Interbank Deposit Certificate (approximately 101.7% of CDI).
5. Trade accounts receivable
Company Consolidated
2013 2012 2013
Domestic market third parties related parties (Note 21)
72,819 1,002
95,071 135
74,755 20
Foreign Market
third parties 3,985 3,723 3,985 Checks receivable 9,488 5,302 9,568
87,294 104,231 88,328
(-) Allowance for doubtful accounts (11,726) (8,306) (11,726)
(-) Present value adjustment (PVA) (1,891) (2,717) (1,891)
73,677 93,208 74,711
Current assets 64,308 77,732 65,342
Noncurrent assets 9,369 15,476 9,369
73,677 93,208 74,711
At December 30, 2013 and 2012, the average receipt terms were 42 and 46 days, respectively.
The changes in the allowance for doubtful accounts are shown below:
Company Consolidated
2013 2012 2013
Balance at beginning of year (8,306) (5,069) (8,306)
Additions (4,255) (12,341) (4,255)
Amounts recovered / realized 624 7,011 624
Write-off due to bad debts 211 2,093 211
Balance at end of year (11,726) (8,306) (11,726)
Analysis of trade accounts receivable at December 31, 2013 and 2012 by maturity:
Company Consolidated
2013 2012 2013
Falling due 63,717 91,603 63,405
Overdue:
1 to 30 days 3,906 2,538 4,293
31 to 60 days 1,974 1,295 2,310
61 to 90 days 1,275 1,835 1,663
91 to 180 days 2,920 3,472 3,115
Over 181 days 13,502 3,488 13,542
87,294 104,231 88,328

22
6. Inventories Company Consolidated
2013 2012 2013
Finished products 86 17 1,473
Products in process 3,224 2,834 3,224
Goods for resale 314 417 356
Raw materials 14,804 12,495 14,804
Packing materials 277 185 277
Intermediate materials 2,026 2,044 2,026
Advances to suppliers 256 488 256
Sundry materials 1,234 1,189 1,234
Provision for obsolescence (346) (373) (346)
21,875 19,296 23,304
Changes in the provision for obsolescence are as follows: Company Consolidated
2013 2012 2013
Balance at beginning of year (373) (1,067) (373)
Additions (912) (808) (912)
Amounts recovered / realized 939 1,502 939
Balance at end of year (346) (373) (346)
7. Noncurrent asset held for sale At December 31, 2013, the balance of R$12,668 (R$8,848 at December 31, 2012) comprises mostly plots of land, apartments and other real estate properties received in debt negotiations with customers and are available for immediate sale. The Company hired expert brokers in the sale of real estate properties and it believes these goods may be sold in the short term. The assets are held at their book values, being lower than their fair values, and deducted of selling expenses.
8. Loans granted Company Consolidated
2013 2012 2013
Loans granted 4,045 7,790 4,045
(-) Present value adjustment (PVA) (371) (272) (371)
3,674 7,518 3,674
Current assets 1,287 1,971 1,287
Noncurrent assets 2,387 5,547 2,387
3,674 7,518 3,674
These refer to loans granted by the Company to customers, with the purpose of financing the expansion of authorized and exclusive retailers’ chain stores. The loans bear average interest of 8.76% p.a. The Company has letters of credit from the store partners, as well as first-degree mortgage guarantees, as collaterals for the loans granted

23
9. Investments
Company
Consolidated
2013 2012
2013
Unicasa Comércio de Móveis Ltda. 702 -
-
Other investments 82 404
82
784 404
82
Changes in subsidiary’s balances:
Unicasa Comércio de Móveis Ltda.
2013 2012
Current assets 4,247 - Noncurrent assets 4,634 - Current liabilities 7,890 - Equity 991 - Capital 6,800 - Net revenue 4,643 - Loss for the year (5,809) - % Interest 99.99% - Investment 991 - Equity pickup (*) (6,098) - * Exempted from profits not realized in inventories in the amount of R$289.
Changes in investments are as follows:
Company
Consolidated
2013 2012
2013
Balance at beginning of year 404 704
404
Capital payment 100 -
-
Advances for future capital contributions 6,700 -
-
Equity pickup (6,098) -
-
Transfer to intangible assets (322) (300)
(322)
Balance at end of year 784 404
82

24
10. Property, plant and equipment (PP&E)
Company
PP&E cost Land Buildings Improvements Facilities Machinery and
equipment Vehicles Furniture
and fixtures IT equipment Construction in progress Advances Total
2012 balances 1,378 19,249 3,325 4,167 83,933 120 2,429 4,473 3,112 751 122,937
Acquisitions - 119 270 69 1,011 - 446 475 885 6,158 9,433
Write-offs - - - - (30) - (392) (142) (58) - (622)
Transfers - 1,067 2,597 490 661 - - - (3,342) (1,473) -
2013 balances 1,378 20,435 6,192 4,726 85,575 120 2,483 4,806 597 5,436 131,748
Accumulated depreciation Land Buildings Improvements Facilities
Machinery and equipment Vehicles
Furniture and fixtures IT equipment
Construction in progress Advances Total
2012 balances - (4,875) (619) (702) (34,127) (47) (968) (3,226) - - (44,564)
Depreciation - (610) (197) (366) (5,452) (15) (202) (403) - - (7,245)
write-offs - - - - 18 - 52 110 - - 180
2013 balances - (5,485) (816) (1,068) (39,561) (62) (1,118) (3,519) - - (51,629)
PP&E, net
2012 balances 1,378 14,374 2,706 3,465 49,806 73 1,461 1,247 3,112 751 78,373
2013 balances 1,378 14,950 5,376 3,658 46,014 58 1,365 1,287 597 5,436 80,119
Consolidated
PP&E cost Land Buildings Improvements Facilities Machinery and
equipment Vehicles Furniture
and fixtures IT equipment Construction in progress Advances Total
Opening balances 1,378 19,249 3,325 4,167 83,933 120 2,429 4,473 3,112 751 122,937
Acquisitions - 119 400 139 1,032 - 1,087 697 885 6,762 11,121
Write-offs - - - - (30) - (392) (142) (58) - (622)
Transfers - 1,067 2,727 490 661 - 19 14 (3,342) (1,636) -
2013 balances 1,378 20,435 6,452 4,796 85,596 120 3,143 5,042 597 5,877 133,436
Accumulated depreciation Land Buildings Improvements Facilities
Machinery and equipment Vehicles
Furniture and fixtures IT equipment
Construction in progress Advances Total
Opening balances - (4,875) (619) (702) (34,127) (47) (968) (3,226) - - (44,564)
Depreciations - (610) (208) (369) (5,452) (15) (224) (416) - - (7,294)
Write-offs - - - - 18 - 52 110 - - 180
2013 balances - (5,485) (827) (1,071) (39,561) (62) (1,140) (3,532) - - (51,678)
PP&E, net
Balance in 2013 1,378 14,950 5,625 3,725 46,035 58 2,003 1,510 597 5,877 81,758
Cash disbursements with the acquisition of PP&E items are shown below: Company Consolidated
2013 2012 2013
Acquisitions performed and settled in the year 9,433 10,547 11,121
Acquisitions of PP&E in installments performed in prior years and settled in the current year. 950 943 950
Non cash effect of exchange variation on settlements of acquisitions in installments (57) (15) (57)
Acquisition without cash impact (Note 27) (220) (270) (220)
10,106 11,205 11,794

25
10. Property, plant and equipment (Continued) Depreciation is calculated on a straight-line basis considering the assets’ useful lives. In the process of the annual review of its PP&E, the Company hires a company specialized in evaluations. Following are the weighted useful lives of the categories of PP&E items according to the evaluation performed by the specialized company:
Weighted useful life – new (in years)
Weighted useful life – previous (in years)
Buildings 77.99 25 Improvements 37.83 25 Facilities 21.10 10 Machinery and equipment 18.69 10 Vehicles 16.43 5 Furniture and fixtures 15.18 10 IT equipment 7.44 5
This change resulted in the reduction of R$1,600 in depreciation expense in 2013 in comparison with
2012.
11. Intangible assets Company
Software
Trademarks and patents Store use rights Total
2012 balances 669 107 17,536 18,312
Acquisitions 533 - 2,991 3,524
Transfer of investments - - 322 322
Amortization (265) (17) (759) (1,041)
2013 balances 937 90 20,090 21,117
Consolidated
Software
Trademarks and patents Store use rights Total
Opening balances 669 107 17,536 18,312
Acquisitions 536 - 2,991 3,527
Transfer of investments - - 322 322
Amortization (265) (17) (759) (1,041)
2013 balances 940 90 20,090 21,120
The Company maintains the intangible assets by the acquisition cost. The amortization is recognized in P&L by the straight-line method throughout the estimated useful life of intangible assets. Based on the annual review procedure of the useful lives of intangible assets, the Company changed the useful lives of intangible assets as shown in the table below:
Weighted useful life – new
(in years) Weighted useful life –
previous (in years)
Software 5.78 5
Trademarks and patents 12.88 10 Store use rights 9.26 Undetermined

26
11. Intangible assets (Continued) Store use rights According to the initial analysis of Company management of December 2012 and considering its intention to remain in these locations, it would not be possible to estimate a period in which the Company would be able to remain in these locations until the conclusion of the useful life annual review of assets, which is scheduled to take place in 2013. The initial expectation of the Company is that the business of own stores continues indefinitely. Accordingly, the Company rated these intangible assets as of indefinite life in 2012 and up to the completion of useful life of assets in the third quarter of 2013. Based on the annual review procedure of the useful life of its store use rights and as a result of a greater experience in managing own stores, the Company has determined the new useful life of these assets and started to amortize them. The Company management concluded that the useful lives of these intangible assets are directly related to the deadlines agreed upon in the lease agreements of properties, for which the Company acquired such store use rights. In the first quarter of 2013, the Company acquired a new store use rights from one of its major customers in the amount of R$2,991. This transaction was settled by offsetting balances of accounts receivable existing on the date.
Impairment testing The recovery test of Company’s intangible assets did not result in the need for recognition of loss for the year ended December 31, 2013, since the net fair value of selling expenses is higher than the net book value on the valuation date. In preparing these financial statements, the Company assessed the existence of factors that could impact the value of its assets and found no evidence that they may be impaired. Research and development The expenses with research and development of the Company’s new products did not meet the capitalization criteria, therefore they were recognized in the P&L of the Company and Consolidated for the year in the amount of R$4,787 (R$3,251 at December 31, 2012).
12. Other assets
Company Consolidated
2013 2012 2013
Recovery of expenses (a) 2,157 2,044 2,193
Taxes recoverable (b) 4,233 4,333 4,233
Other (c) 665 472 665
(-) Provision for losses with credits recoverable (b) (2,468) (2,468) (2,468)
Total 4,587 4,381 4,623
Current assets 2,612 2,377 2,648
Noncurrent assets 1,975 2,004 1,975
4,587 4,381 4,623
(a) Refers mostly to expenses incurred by the Company in marketing campaigns, to be reimbursed by exclusive retailers in
an average period of six months. (b) Refers to receivables from exclusive retailers from surety provided in the past and agreements entered into. The net
receivable balance, after the provisions, totaled R$1,765 at December 31, 2013. (c) Substantially composed of receivables from financial institutions as described in Note 19.

27
13. Loans and financing
Company Consolidated
Interest rates
Final maturity 2013 2012 2013
PP&E financing
Banco Votorantim 9% p.a. 06/15/2014 557 1,672 557
Export financing
Banco Santander – BNDES 9% p.a. 06/15/2013 - 4,013 -
557 5,685 557
Current liabilities 557 5,128 557
Noncurrent liabilities - 557 -
557 5,685 557
The Company’s controlling shareholders provided sureties on the loans and financing. The Company’s loans and financing do not have covenant clauses.
14. Trade accounts payable The breakdown of trade accounts payable at December 31, 2013 and 2012 is summarized below:
Company Consolidated
2013 2012 2013
Domestic market
Inputs
of third parties 4,482 4,589 4,498
Sundry materials 561 526 567
Services 1,202 633 1,246
6,245 5,748 6,311
In the foreign market
Property, plant and equipment (PP&E) - 950 -
Total domestic and foreign markets 6,245 6,698 6,311

28
15. Income and social contribution taxes
MP 627 and IN RFB 1.397 The Brazilian IRS Revenue Procedure (IN RFB) No. 1397 was published on September 17, 2013, and the Provisional Executive Order (MP) No. 627 was published on November 12, 2013: (i) repealing the Transition Tax Regime (RTT) as of 2015, introducing a new tax regime, (ii) amending the Law Decree No. 1598/77 related to the calculation of legal entity’s income tax and the legislation on the Social Contribution Tax on Net Profit (CSLL). The new tax regime provided for in MP No. 627 becomes effective as of 2014, if the entity exercises such option. We may highlight some provisions within MP No. 627 that approach profit sharing and distribution of dividends, tax base on interest on equity and calculation criteria of equity through the term of RTT. The Company prepared a study of the potential effects from the application of MP No. 627 and IN No. 1397 and concluded that there will not be significant effects on its operations and on its financial statements for the year ended December 31, 2013, based on the best interpretation of the current wording of the MP. The possible conversion of MP No. 627 in Law may change the Company’s conclusion; therefore, the Company is awaiting the progress of amendments to the wording of MP No. 627, so it can chose for their early adoption in 2014.
Amounts recorded in profit or loss
The breakdown of income and social contribution tax expenses at December 31, 2013 and 2012 is described below: Company Consolidated
2013 2012 2013
Current income and social contribution taxes: Current income and social contribution tax expenses (4,449) (15,719) (4,449) Deferred income and social contribution taxes:
Related to set up and reversal of temporary differences (245) 2,306 2,747 Tax credit on expenses with issue of shares for IPO process - (1,369) -
Income and social contribution tax expenses recorded in P&L (4,694) (14,782) (1,702)

29
15. Income and social contribution taxes (Continued) Reconciliation of income tax expenses with statutory rates Following is the reconciliation between tax expenses and the result from multiplication of book profit at prevailing local tax rates for the years ended December 31, 2013 and 2012:
Company Consolidated
2013 2012 2013
Income
tax Social
contribution Income
tax Social
contribution Income
tax Social
contribution
Income before taxes 18,403 18,403 56,946 56,946 15,411 15,411 Income and social contribution
taxes at statutory rate of 25% and 9%, respectively (4,600) (1,656) (14,237) (5,125) (3,853) (1,387)
Adjustments to effective tax rate: Interest on equity 1,626 585 2,250 810 1,626 585 Tax incentive (technological
innovation) 957 345 650 234 957 345 Equity pickup (1,525) (549) - - - - Other exclusions/ additions 58 (15) 508 56 (14) (41) Tax incentive for deduction of
income tax (PAT) 56 - 48 - 56 - Income surtax 24 - 24 - 24 -
Amount recorded in P&L (3,404) (1,290) (10,757) (4,025) (1,204) (498)
Total income and social contribution taxes (4,694) (14,782) (1,702)
Effective rate 18% 7% 19% 7% 8% 3%
Deferred income and social contribution taxes Breakdown of deferred income and social contribution taxes is described below:
Company Consolidated
Balance sheets P&L
Balance sheets P&L
2013 2012 2013 2012 2013 2013
Allowance for doubtful accounts 3,987 2,824 1,163 1,402 3,987 1,163 Provision for adjustment of obsolete
inventories 118 127 (9) (236)
118 (9) Provision for losses on sureties 839 839 - 839 839 - Provision for tax, civil and labor risks 1,753 1,756 (3) 604 1,753 (3) Tax loss - - - - 2,992 2,992 Present value adjustment (PVA) 769 1,016 (247) (318) 769 (247) Difference between tax and
corporate depreciation (1,194) - (1,194) -
(1,194) (1,194) Other temporary provisions and differences 217 172 45 15
217 45
6,489 6,734 (245) 2,306 9,481 2,747

30
15. Income and social contribution taxes (Continued)
Tax credits The studies and projections made by Company management indicate the generation of future taxable income at an amount that allows for the offset of future tax credits over the next years, as under:
Company Consolidated
2013 2013
2014 862 862 2015 2,026
2,126
2016 401 664
2017 401 752
Over 2017 2,799 5,077
Total 6,489 9,481
16. Provision for tax, civil and labor contingencies
I) Provisions The Company figures as defendant in several labor, tax and civil proceedings. The provision for contingencies was set up based on the legal counsel’s opinion, in an amount deemed sufficient to cover probable losses arising from unfavorable court decisions. At December 31, 2013 and 2012, the provision for contingencies breaks down as follows:
Company Consolidated
2013 2012 2013
Provision for labor risks 1,391 1,867 1,391
Provision for tax risks 1,144 2,319 1,144
Provision for civil risks 2,621 979 2,621
5,156 5,165 5,156
Labor – these refer to lawsuits essentially seeking overtime pay, and health and risk exposure premiums, among others. Tax – the Company is party to several tax proceedings, mostly related to tax on import and Social Security Tax (INSS). Civil – these refer to proceedings involving retailers and end consumers in which the Company is a jointly liable party. Based on the opinion of legal counsel and the history of the outcomes of these demands, management believes the accrued amounts are sufficient to cover probable losses. At December 31, 2013, civil proceedings with losses rated as possible totaled R$13,350. Labor and tax claims totaled R$1,728 and R$391, respectively.

31
16. Provision for tax, civil and labor contingencies (Continued)
I) Provisions (Continued) In December 2013, the Company joined the Tax Recovery Program (REFIS) introduced by Law No. 11941/09 with a view to equalizing and settling tax liabilities using a special method of payment and installments. The amount included in Refis refers to notice concerning the offset of IPI credits. The option chosen by the Company was to offset in a sole installment the amount of R$4,863 in December 2013. The amount recognized in P&L in the year in the group of administrative expenses totaled R$2,697 (R$2,158, net amount of provisions) as described in Note 23 and financial expenses totaled R$2,166 related to interest incurred in the process as described in Note 20. Changes in the provision for contingencies are shown below:
Company Consolidated
2013 2012 2013
Balance at beginning of year 5,165 3,389 5,165
Additions 5,660 3,802 5,660
Amounts recovered / realized (5,669) (2,026) (5,669)
Balance at end of year 5,156 5,165 5,156
II) Judicial deposits The Company has judicial deposits related to various tax, labor and civil proceedings, as follows:
Company Consolidated
2013 2012 2013
Judicial deposits due to labor proceedings 416 105 416
Judicial deposits due to tax proceedings 716 716 716
Judicial deposits due to civil proceedings 2,423 1,319 2,423
3,555 2,140 3,555
17. Equity a) Capital
The General Shareholders and Special General Meeting of February 24, 2012, revalidated by the Special General Meeting (SGM) of February 27, 2012, approved the Company’s capital increase by R$30,101 through the capitalization of income reserve and without issuing new shares; thus, the Company’s capital increased from R$ 29,699 at December 31, 2011 to R$ 59,800 at March 31, 2012. The Special General Meeting of March 30, 2012 approved the split of Company’s common registered shares with no par value at the proportion of 10.3547337 new common registered shares with no par value for each one (01) existing common registered shares with no par value, reflecting an increase of 51,450,100 shares, totaling 59,950,000 common registered shares with no par value at March 31, 2012.
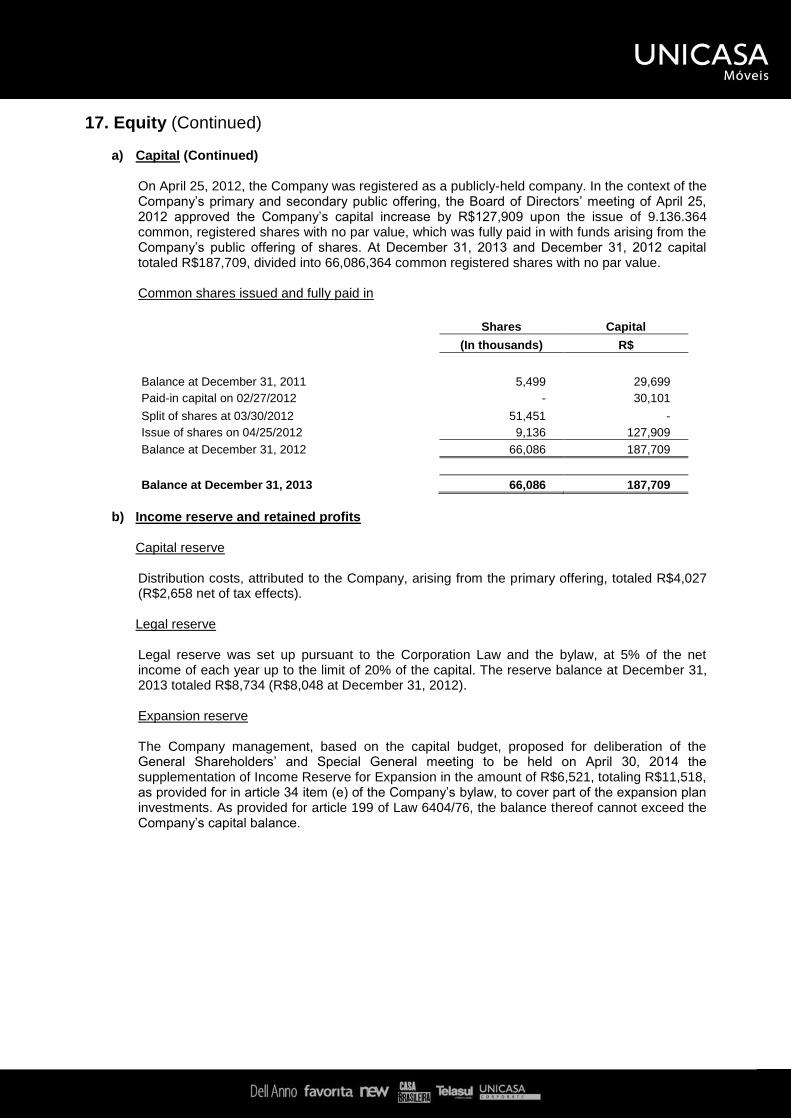
32
17. Equity (Continued) a) Capital (Continued)
On April 25, 2012, the Company was registered as a publicly-held company. In the context of the Company’s primary and secondary public offering, the Board of Directors’ meeting of April 25, 2012 approved the Company’s capital increase by R$127,909 upon the issue of 9.136.364 common, registered shares with no par value, which was fully paid in with funds arising from the Company’s public offering of shares. At December 31, 2013 and December 31, 2012 capital totaled R$187,709, divided into 66,086,364 common registered shares with no par value. Common shares issued and fully paid in
Shares Capital
(In thousands) R$
Balance at December 31, 2011 5,499 29,699
Paid-in capital on 02/27/2012 - 30,101
Split of shares at 03/30/2012 51,451 -
Issue of shares on 04/25/2012 9,136 127,909
Balance at December 31, 2012 66,086 187,709
Balance at December 31, 2013 66,086 187,709
b) Income reserve and retained profits
Capital reserve Distribution costs, attributed to the Company, arising from the primary offering, totaled R$4,027 (R$2,658 net of tax effects). Legal reserve Legal reserve was set up pursuant to the Corporation Law and the bylaw, at 5% of the net income of each year up to the limit of 20% of the capital. The reserve balance at December 31, 2013 totaled R$8,734 (R$8,048 at December 31, 2012). Expansion reserve The Company management, based on the capital budget, proposed for deliberation of the General Shareholders’ and Special General meeting to be held on April 30, 2014 the supplementation of Income Reserve for Expansion in the amount of R$6,521, totaling R$11,518, as provided for in article 34 item (e) of the Company’s bylaw, to cover part of the expansion plan investments. As provided for article 199 of Law 6404/76, the balance thereof cannot exceed the Company’s capital balance.
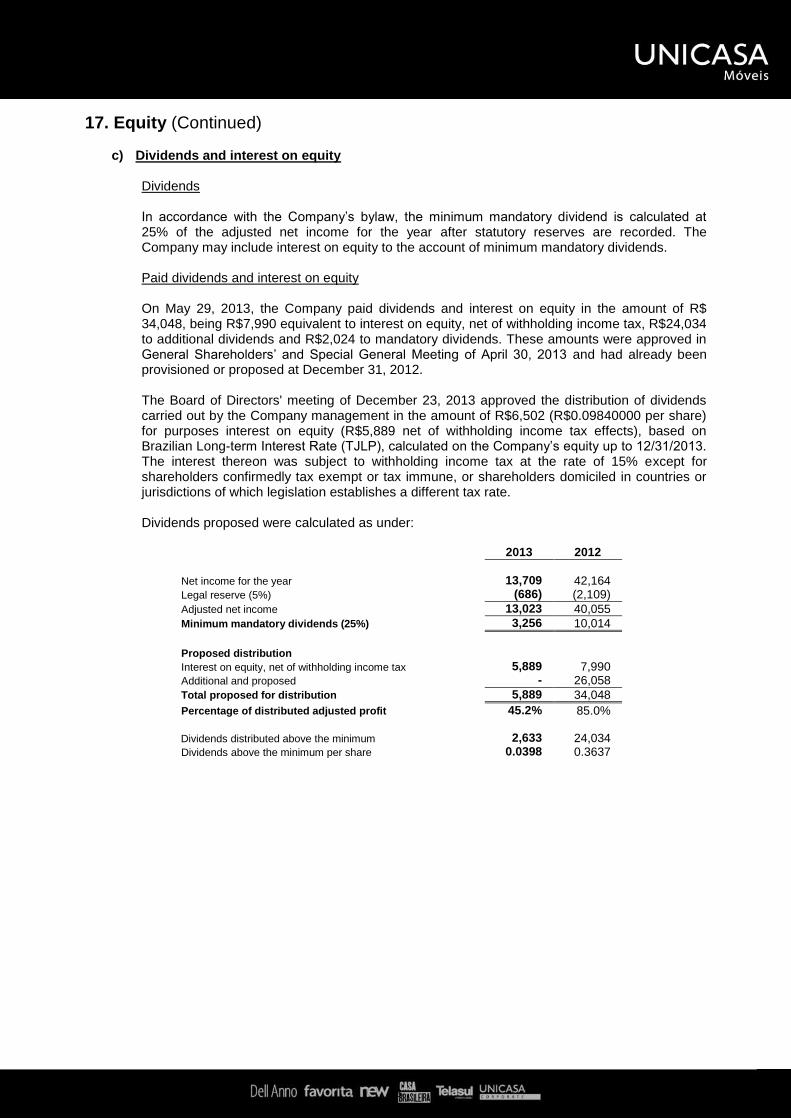
33
17. Equity (Continued)
c) Dividends and interest on equity Dividends
In accordance with the Company’s bylaw, the minimum mandatory dividend is calculated at 25% of the adjusted net income for the year after statutory reserves are recorded. The Company may include interest on equity to the account of minimum mandatory dividends. Paid dividends and interest on equity
On May 29, 2013, the Company paid dividends and interest on equity in the amount of R$ 34,048, being R$7,990 equivalent to interest on equity, net of withholding income tax, R$24,034 to additional dividends and R$2,024 to mandatory dividends. These amounts were approved in General Shareholders’ and Special General Meeting of April 30, 2013 and had already been provisioned or proposed at December 31, 2012. The Board of Directors' meeting of December 23, 2013 approved the distribution of dividends carried out by the Company management in the amount of R$6,502 (R$0.09840000 per share) for purposes interest on equity (R$5,889 net of withholding income tax effects), based on Brazilian Long-term Interest Rate (TJLP), calculated on the Company’s equity up to 12/31/2013. The interest thereon was subject to withholding income tax at the rate of 15% except for shareholders confirmedly tax exempt or tax immune, or shareholders domiciled in countries or jurisdictions of which legislation establishes a different tax rate. Dividends proposed were calculated as under:
2013 2012
Net income for the year 13,709 42,164 Legal reserve (5%) (686) (2,109)
Adjusted net income 13,023 40,055
Minimum mandatory dividends (25%) 3,256 10,014
Proposed distribution Interest on equity, net of withholding income tax 5,889 7,990 Additional and proposed - 26,058
Total proposed for distribution 5,889 34,048
Percentage of distributed adjusted profit 45.2% 85.0% Dividends distributed above the minimum 2,633 24,034 Dividends above the minimum per share 0.0398 0.3637

34
18. Earnings per share The basic calculation of earnings per share is made through the division of net income for the year, attributed to the Company’s common shareholders, by the weighted average number of common shares available in the year. There is no difference between the calculation of basic and diluted earnings per share, given the absence of dilutive potential shares. The table below presents P&L and share data used to calculate basic and diluted earnings per share: Company Consolidated
2013 2012 2013
Net income for the year 13,709 42,164 13,709
Weighted average number of shares issued (in thousands)* 66,086 63,208
66,086
Earnings per share - base and diluted (R$) 0.21 0.67
0.21 * Considering the split of shares approved by the Special General Meeting held on March 30, 2012.
There were no other transactions involving common or potential common shares between the balance sheet date and the completion date of these financial statements.
19. Other operating income, net Company Consolidated
2013 2012 2013
Operating income Losses on the disposal of PP&E items (40) (35) (40)
(40) (35) (40)
Operating income
Gains on the disposal of PP&E items 386 10 386
Bank premium* 2,961 7,152 2,961
Other operating expenses 713 2,217 1,043
4,060 9,379 4,390
Other operating income, net 4,020 9,344 4,350
* Refers to amounts received from financial institutions based on the volume of financing contracted through the chain of stores served by the Company, being recorded as a contra entry of other assets.

35
20. Financial income (expenses), net Company Consolidated
2013 2012 2013
Financial expenses
Tax on Financial Transactions (IOF) expenses and banking fees (636)
(622) (686)
Loans and financing expenses (259) (547) (259)
Foreign exchange losses (414) (413) (414)
Present value adjustment (PVA) (365) (342) (365)
Discounts granted (4,532) (1,086) (4,561)
Other financial expenses (*) (2,217) (65) (2,220)
(8,423) (3,075) (8,505)
Financial income
Interest received 2,399 3,346 2,399
Discounts obtained 153 516 156
Short-term investment yield 1,858 2,487 1,858
Foreign exchange gains 645 314 645
Present value adjustment (PVA) 4,533 5,033 4,533
Other financial income 467 571 467
10,055 12,267 10,058
Financial income (expenses), net 1,632 9,192 1,553
*The adhesion to Refis, communicated through a Material Fact on December 16, 2013, affected the financial expenses, in the line of “other financial expenses” in the amount of R$ 2,166 related to interest incurred in the process.
21. Related-party transactions and balances For the year ended December 31, 2013 and 2012, the Company carried out the following transactions with related parties: Company Consolidated
2013 2012 2013
Current assets
Accounts receivable
Unicasa Comércio de Móveis Ltda. 982 - -
Telasul S.A. 20 135 20
Total assets 1,002 135 20
Income statement
Sales
Other related parties (*) 18 26 18
Unicasa Comércio de Móveis Ltda. 4,134 - -
Telasul S.A. 566 502 566
4,718 528 584
Purchases
Telasul S.A. 12,217 11,498 12,265
12,217 11,498 12,265
(*) Operations with shareholders.
Transactions involving the Company and the related party Telasul S.A., refers to purchase of inputs (aluminum doors, aluminum profiles and metal accessories) used in the production process for manufacturing of modular furniture. Unicasa also sells various finished products to Telasul S.A. (office furniture, modular furniture, among others). Operations are conducted at market price with an average purchase and sale term of seven days.

36
21. Transactions and balances with related parties (Continued) Transactions involving the Company and the subsidiary Unicasa Comércio de Móveis Ltda. refer to purchase of finished products (office furniture, modular furniture, among others) for purposes of resale to end consumers. Transactions are carried at market observable prices with an average thirty-day purchase and sale term. The Company maintains the lease of one aircraft. For the year ended December 31, 2013, lease expenses and expenditures related to the aircraft maintenance and up keeping totaled R$1,919 (R$1,776 at December 31, 2012), which were fully reimbursed by shareholders for the use thereof. Company’s transaction terms and conditions Telasul S.A. is controlled by the Company’s controlling shareholders. Balances outstanding at the year-end are not secured and shall be settled in cash within terms similar to third-party transactions. Unicasa Comércio de Móveis Ltda. is controlled by the Company. Balances outstanding at the year-end are not secured and shall be settled in cash within terms similar to third-party transactions. No guarantees were provided or received regarding any accounts receivable or payable involving related parties. Management compensation The Company paid its managing officers (Statutory Officers and Board of Directors) compensation of R$2,799 in the year ended December 31, 2013 (R$2,555 at December 31, 2012). The Company does not provide its key personnel with the following compensation benefits: (i) post-employment benefit, (ii) long-term benefit, (iii) termination benefits and (iv) share-based payment
22. Net sales revenue The breakdown of net revenue from sales is as follows: Company Consolidated
2013 2012 2013
Gross sales revenue 342,141 367,072 344,647
Federal VAT (IPI) on sales (8,892) (3,870) (8,892)
State VAT under tax substitution taxation system (ICMS-ST) on sales (27)
(28) (27)
Gross sales revenue (-) IPI and tax substitution on sales 333,222 363,174 335,728
State VAT (ICMS) on sales (37,194) (40,437) (37,876)
Other sales tax (PIS/COFINS/INSS) (33,012) (34,182) (33,623)
Sales returns (2,869) (5,356) (2,869)
Present value adjustment (3,441) (3,758) (3,441)
256,706 279,441 257,919
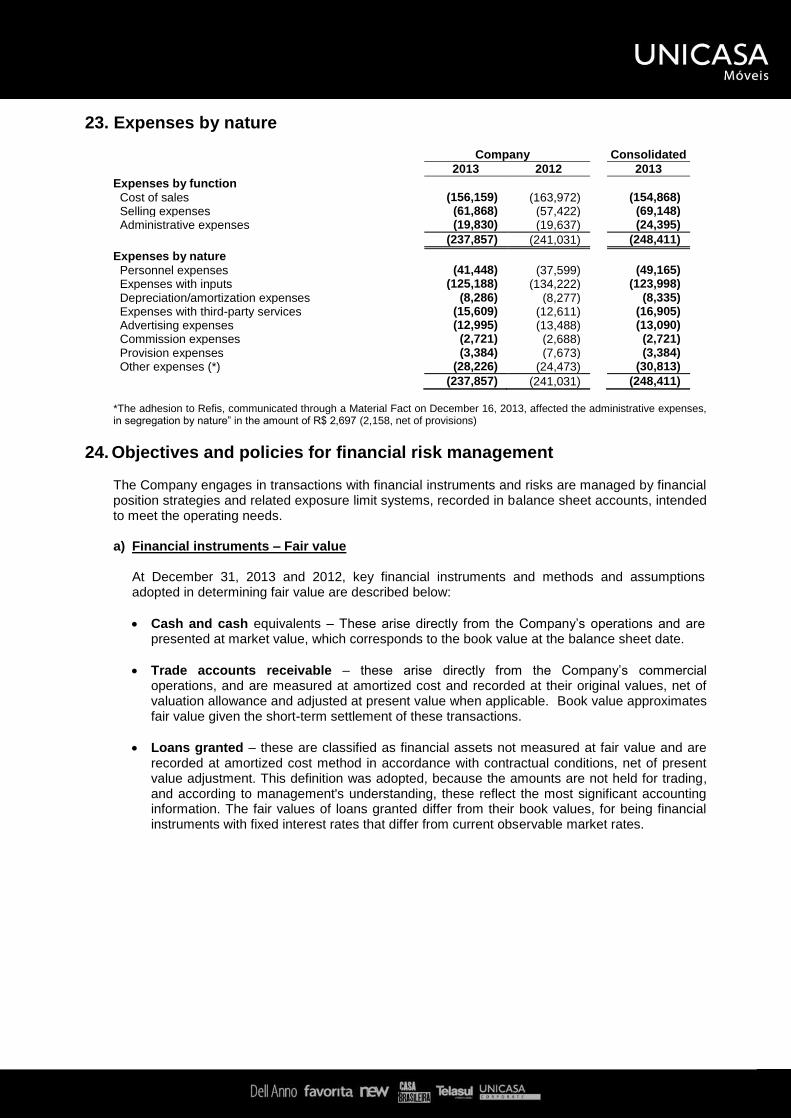
37
23. Expenses by nature Company Consolidated
2013 2012 2013
Expenses by function
Cost of sales (156,159) (163,972) (154,868)
Selling expenses (61,868) (57,422) (69,148)
Administrative expenses (19,830) (19,637) (24,395)
(237,857) (241,031) (248,411)
Expenses by nature Personnel expenses (41,448) (37,599) (49,165)
Expenses with inputs (125,188) (134,222) (123,998)
Depreciation/amortization expenses (8,286) (8,277) (8,335)
Expenses with third-party services (15,609) (12,611) (16,905)
Advertising expenses (12,995) (13,488) (13,090)
Commission expenses (2,721) (2,688) (2,721)
Provision expenses (3,384) (7,673) (3,384)
Other expenses (*) (28,226) (24,473) (30,813)
(237,857) (241,031) (248,411)
*The adhesion to Refis, communicated through a Material Fact on December 16, 2013, affected the administrative expenses, in segregation by nature” in the amount of R$ 2,697 (2,158, net of provisions)
24. Objectives and policies for financial risk management The Company engages in transactions with financial instruments and risks are managed by financial position strategies and related exposure limit systems, recorded in balance sheet accounts, intended to meet the operating needs. a) Financial instruments – Fair value
At December 31, 2013 and 2012, key financial instruments and methods and assumptions adopted in determining fair value are described below:
Cash and cash equivalents – These arise directly from the Company’s operations and are presented at market value, which corresponds to the book value at the balance sheet date.
Trade accounts receivable – these arise directly from the Company’s commercial operations, and are measured at amortized cost and recorded at their original values, net of valuation allowance and adjusted at present value when applicable. Book value approximates fair value given the short-term settlement of these transactions.
Loans granted – these are classified as financial assets not measured at fair value and are recorded at amortized cost method in accordance with contractual conditions, net of present value adjustment. This definition was adopted, because the amounts are not held for trading, and according to management's understanding, these reflect the most significant accounting information. The fair values of loans granted differ from their book values, for being financial instruments with fixed interest rates that differ from current observable market rates.
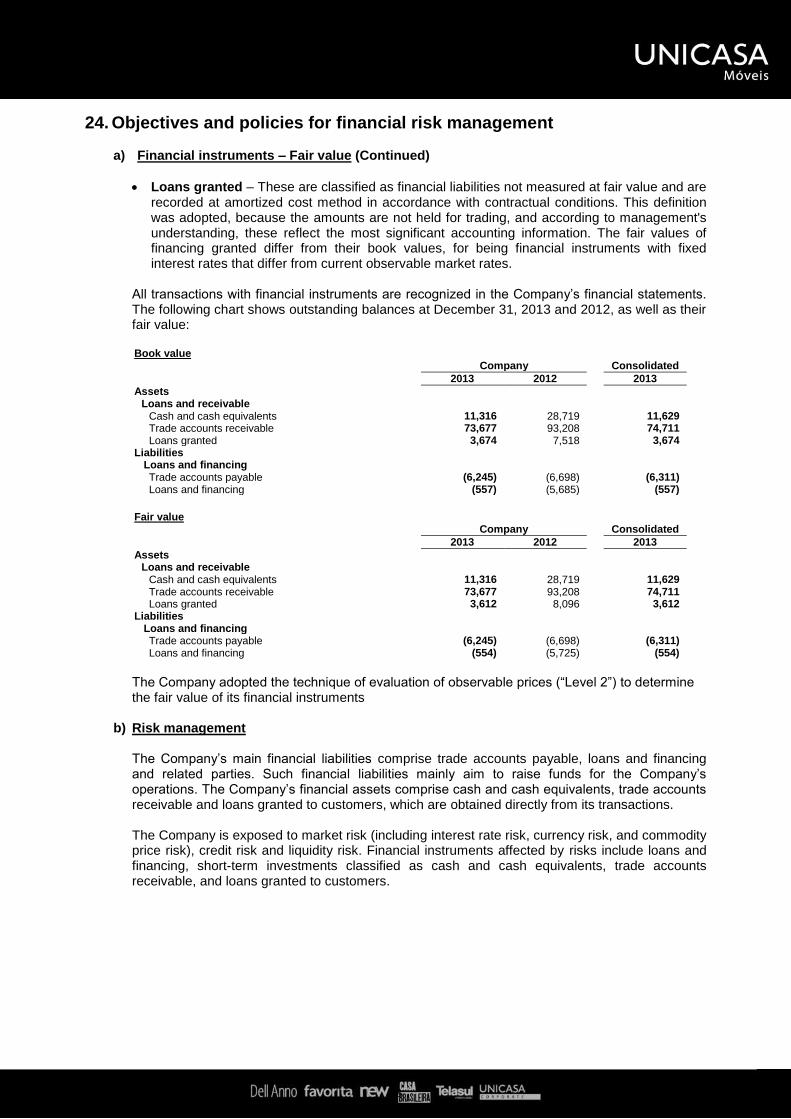
38
24. Objectives and policies for financial risk management
a) Financial instruments – Fair value (Continued)
Loans granted – These are classified as financial liabilities not measured at fair value and are recorded at amortized cost method in accordance with contractual conditions. This definition was adopted, because the amounts are not held for trading, and according to management's understanding, these reflect the most significant accounting information. The fair values of financing granted differ from their book values, for being financial instruments with fixed interest rates that differ from current observable market rates.
All transactions with financial instruments are recognized in the Company’s financial statements. The following chart shows outstanding balances at December 31, 2013 and 2012, as well as their fair value: Book value
Company Consolidated
2013 2012 2013
Assets Loans and receivable
Cash and cash equivalents 11,316 28,719 11,629 Trade accounts receivable 73,677 93,208 74,711 Loans granted 3,674 7,518 3,674
Liabilities Loans and financing Trade accounts payable (6,245) (6,698) (6,311) Loans and financing (557) (5,685) (557)
Fair value
Company Consolidated
2013 2012 2013
Assets Loans and receivable
Cash and cash equivalents 11,316 28,719 11,629 Trade accounts receivable 73,677 93,208 74,711 Loans granted 3,612 8,096 3,612
Liabilities Loans and financing Trade accounts payable (6,245) (6,698) (6,311) Loans and financing (554) (5,725) (554)
The Company adopted the technique of evaluation of observable prices (“Level 2”) to determine the fair value of its financial instruments
b) Risk management The Company’s main financial liabilities comprise trade accounts payable, loans and financing and related parties. Such financial liabilities mainly aim to raise funds for the Company’s operations. The Company’s financial assets comprise cash and cash equivalents, trade accounts receivable and loans granted to customers, which are obtained directly from its transactions. The Company is exposed to market risk (including interest rate risk, currency risk, and commodity price risk), credit risk and liquidity risk. Financial instruments affected by risks include loans and financing, short-term investments classified as cash and cash equivalents, trade accounts receivable, and loans granted to customers.

39
24. Financial risk management objectives and policies (Continued)
b) Risk management (Continued) Risk management activities are consistent with the Company’s risk management policy; and are managed by its directors. These risks are managed based on control policy, which establishes exposure ongoing monitoring and measurement techniques. The Company does not carry out transactions with derivative instruments or any other type of transaction for speculative purposes.
Market risk
Market risk is the risk that the fair value of future cash flows of a financial instrument will fluctuate due to changes in market prices. Market prices comprise three types of risk: interest rate risk, currency risk, price risk - which may include, among others, commodities price risk. Financial instruments affected by market risk include loans payable and receivable and trade accounts payable.
Interest rate risk
Interest rate risk is the risk that the fair value or future cash flows of a financial instrument fluctuates due to changes in the market’s interest rates. The Company’s risk exposure to changes in market interest rates relates primarily to the Company’s long-term debt obligations subject to variable interest rates. The Company manages its interest rate risk by keeping a balanced portfolio of loans receivable and payable subject to fixed and variable rates. In order to mitigate these risks, the Company makes it a practice to spread fund raising in terms of fixed and floating rates, and permanent analysis of financial institution risks.
Currency risks Company’s P&L is subject to variation, due to volatility effects of floating exchange rate on
transactions pegged to foreign currencies, basically in the export of finished product. The Company has been successful in adjusting its cost structure and sales prices so as to absorb foreign exchange rate fluctuation. At December 31, 2012, the Company’s trade accounts receivable from sales to the foreign market totaled USD 1,703 thousand.
Foreign currency sensitivity
A foreign currency sensitivity analyses and three different scenarios were established in
order to check the price index sensitivity of assets and liabilities in foreign currency to which the Company’s financial investments was exposed at December 31, 2013.
Three scenarios have been considered, with the probable scenario being adopted by the
Company. These scenarios have been defined based on management expectation for exchange rate variations on maturity dates of the corresponding contracts subject to these risks.
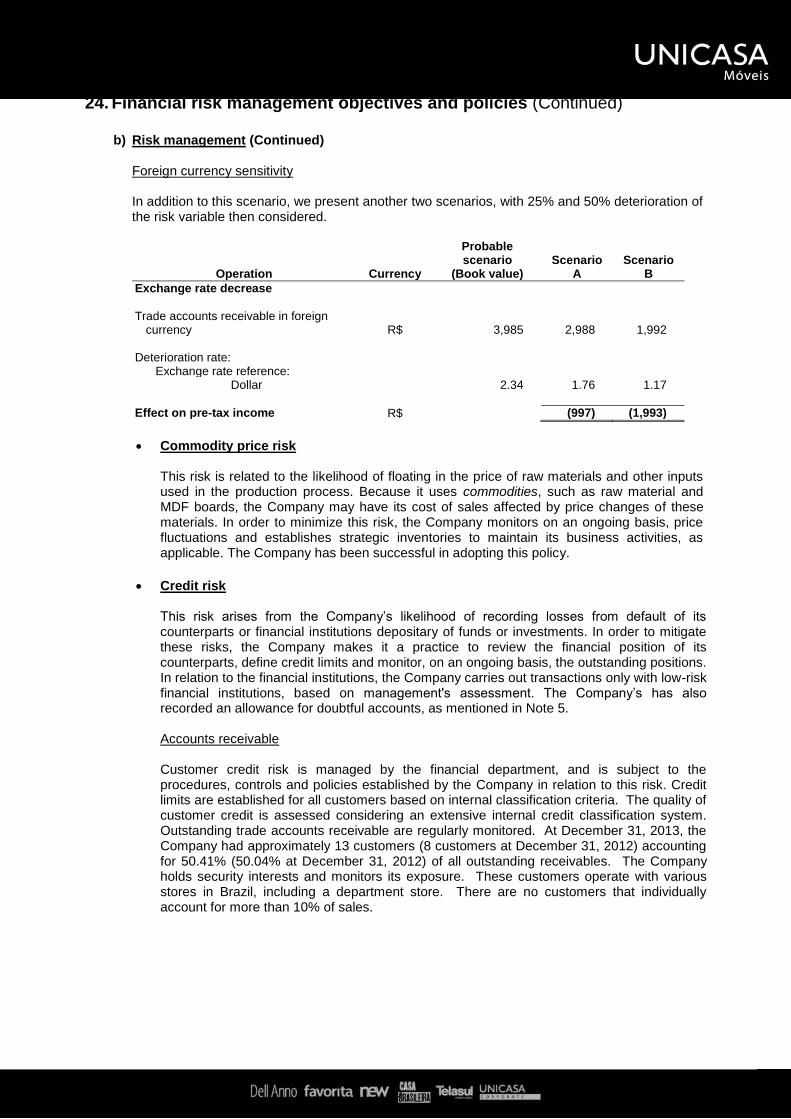
40
24. Financial risk management objectives and policies (Continued)
b) Risk management (Continued)
Foreign currency sensitivity In addition to this scenario, we present another two scenarios, with 25% and 50% deterioration of
the risk variable then considered.
Operation Currency
Probable scenario
(Book value) Scenario
A Scenario
B
Exchange rate decrease
Trade accounts receivable in foreign currency R$ 3,985 2,988 1,992
Deterioration rate:
Exchange rate reference: Dollar 2.34 1.76 1.17
Effect on pre-tax income R$ (997) (1,993)
Commodity price risk This risk is related to the likelihood of floating in the price of raw materials and other inputs
used in the production process. Because it uses commodities, such as raw material and MDF boards, the Company may have its cost of sales affected by price changes of these materials. In order to minimize this risk, the Company monitors on an ongoing basis, price fluctuations and establishes strategic inventories to maintain its business activities, as applicable. The Company has been successful in adopting this policy.
Credit risk
This risk arises from the Company’s likelihood of recording losses from default of its counterparts or financial institutions depositary of funds or investments. In order to mitigate these risks, the Company makes it a practice to review the financial position of its counterparts, define credit limits and monitor, on an ongoing basis, the outstanding positions. In relation to the financial institutions, the Company carries out transactions only with low-risk financial institutions, based on management's assessment. The Company’s has also recorded an allowance for doubtful accounts, as mentioned in Note 5. Accounts receivable Customer credit risk is managed by the financial department, and is subject to the procedures, controls and policies established by the Company in relation to this risk. Credit limits are established for all customers based on internal classification criteria. The quality of customer credit is assessed considering an extensive internal credit classification system. Outstanding trade accounts receivable are regularly monitored. At December 31, 2013, the Company had approximately 13 customers (8 customers at December 31, 2012) accounting for 50.41% (50.04% at December 31, 2012) of all outstanding receivables. The Company holds security interests and monitors its exposure. These customers operate with various stores in Brazil, including a department store. There are no customers that individually account for more than 10% of sales.
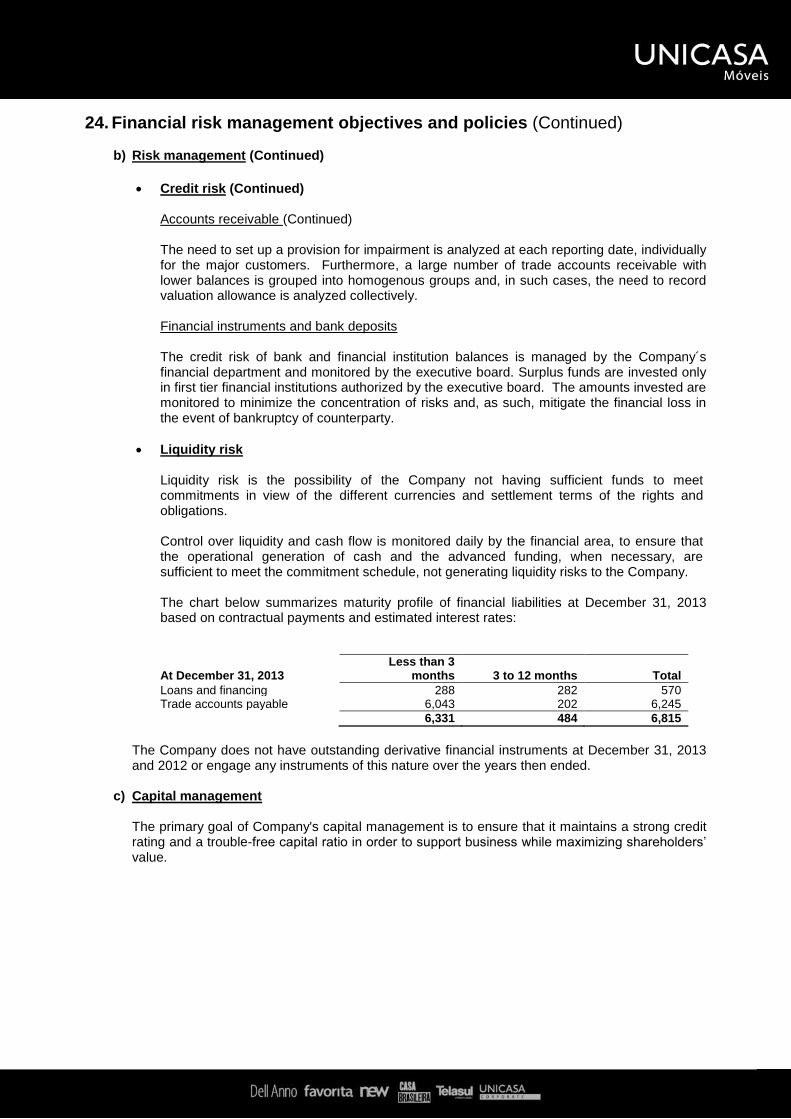
41
24. Financial risk management objectives and policies (Continued) b) Risk management (Continued)
Credit risk (Continued)
Accounts receivable (Continued)
The need to set up a provision for impairment is analyzed at each reporting date, individually for the major customers. Furthermore, a large number of trade accounts receivable with lower balances is grouped into homogenous groups and, in such cases, the need to record valuation allowance is analyzed collectively. Financial instruments and bank deposits The credit risk of bank and financial institution balances is managed by the Company´s financial department and monitored by the executive board. Surplus funds are invested only in first tier financial institutions authorized by the executive board. The amounts invested are monitored to minimize the concentration of risks and, as such, mitigate the financial loss in the event of bankruptcy of counterparty.
Liquidity risk
Liquidity risk is the possibility of the Company not having sufficient funds to meet commitments in view of the different currencies and settlement terms of the rights and obligations.
Control over liquidity and cash flow is monitored daily by the financial area, to ensure that the operational generation of cash and the advanced funding, when necessary, are sufficient to meet the commitment schedule, not generating liquidity risks to the Company.
The chart below summarizes maturity profile of financial liabilities at December 31, 2013 based on contractual payments and estimated interest rates:
At December 31, 2013 Less than 3
months 3 to 12 months Total
Loans and financing 288 282 570 Trade accounts payable 6,043 202 6,245
6,331 484 6,815
The Company does not have outstanding derivative financial instruments at December 31, 2013 and 2012 or engage any instruments of this nature over the years then ended.
c) Capital management
The primary goal of Company's capital management is to ensure that it maintains a strong credit rating and a trouble-free capital ratio in order to support business while maximizing shareholders’ value.

42
24. Financial risk management objectives and policies (Continued)
c) Capital management (Continued)
The Company manages its capital structure and adjusts it based on changes in economic conditions. The capital structure or financial risk arises from the choice between own capital (capital contribution and retained profits) and third-party capital used by the Company to finance its operations. In order to mitigate liquidity risks and leverage the weighted average cost of capital, the Company permanently monitors its debt-to-equity levels in accordance with market standards. Furthermore, there were no changes in the objectives, policies or processes during the years ended December 31, 2013 and 2012.
The Company’s net debt includes loans and financing and trade accounts payable, less cash and cash equivalents and restricted short-term investments not immediately redeemable, as stated below:
Company Consolidated
2013 2012 2013
Loans and financing 557 5,685 557
Trade accounts payable 6,245 6,698 6,311
(-) Cash and cash equivalents (11,316) (28,719) (11,629)
Net debt (4,514) (16,336) (4,761)
Equity 205,303 222,130 205,303
Equity and net debt 200,789 205,794 200,542
25. Insurance
The Company has insurance coverage considered sufficient by management to cover risks, if any, to its assets and/or liabilities. The main insurance categories are stated below:
Effective year
Coverage From Up to Amount insured
Fire, storm and electrical damage
Machinery and equipment 2013 2014 100,500
Inventories 2013 2014 21,827
Buildings 2013 2014 36,000
Loss of profits 2013 2014 17,712
Civil liability for managing officers 2013 2014 10,000

43
26. Segment information
The Company’s operations involve the production and sale of planned furniture. The Company’s products, although sold to various end consumers, these are not controlled and managed by the management as independent segments; accordingly, the Company’s profit or loss is managed, monitored and assessed as a single operating segment. Gross sales revenue in the domestic and foreign markets is represented below:
Company Consolidated
Gross sales revenue 2013 2012 2013
Domestic market 333,171 359,009 335,677
Foreign market 8,970 8,063 8,970
342,141 367,072 344,647
Foreign market revenue is not being individually presented by geographic area, it accounts for 3% (2% in 2012) of gross revenue at December 31, 2013.
27. Transactions with no impact on cash
The cash flow statements were prepared under the indirect method and are presented in accordance with CPC 03 - Cash Flow Statement, issued by the Brazilian FASB (CPC).
Following are the transactions without impact on cash: Company Consolidated
2013 2012 2013
Capital increase - 30,101 -
Transfer of investment sale outlet to intangible assets
(322) (300) (322)
Purchase of PP&E in installments - 943 -
Acquisition of sale outlets and PP&E with credits receivable from shop owners
Accounts receivable (3,211) (13,820) (3,211)
Loans granted - (924) -
Other - (2) -
Store use rights – Intangible assets (Note 11) 2,991 14,476 2,991
Property and equipment (Note 10) 220 270 220

44
28. Commitments with operating lease – lease of stores At December 31, 2013, the Company had lease agreements entered into with third-parties, agreements of which the Company analyzed and concluded to fall under the classification of operating lease agreement. The minimum mandatory operating lease payments breakdown as follows:
Minimum payment in 2013
(Consolidated)
Up to one year 1,655
Over one year and up to five years 4,175
The average monthly rent expenses is R$154 (R$88 in 2012). These lease agreements mature between four to five years, subject to financial charges related to the General Price Index – Market (IGPM) variation p.a., as specified in each agreement. Rent amounts settled within the current month, leaving no outstanding balance payable at the end of the year. A substantial portion of some rent amounts is linked to shops turnover, being established a minimum amount. Additionally the contractual grace period is not representative for purposes of compliance with the expected linear expenses.


![[BPM Day Porto Alegre] Luciano André Merigo (Unicasa) - Ganhos rápidos (quick wins) nas iniciativas de BPM da UNICASA MÓVEIS](https://static.fdocuments.net/doc/165x107/557ca37ad8b42aaa598b495f/bpm-day-porto-alegre-luciano-andre-merigo-unicasa-ganhos-rapidos-quick-wins-nas-iniciativas-de-bpm-da-unicasa-moveis.jpg)