Management Plan for the South Australian Commercial Marine ... · Fisheries Management (MSF)...
89
Management Plan for the South Australian Commercial Marine Scalefish Fishery Part B - Management arrangements for the taking of sardines NOVEMBER 2014
Transcript of Management Plan for the South Australian Commercial Marine ... · Fisheries Management (MSF)...

Management Plan for the South Australian Commercial Marine Scalefish Fishery Part B - Management arrangements for the taking of sardinesNOVEMBER 2014

1
MANAGEMENT PLAN FOR THE SOUTH AUSTRALIAN COMMERCIAL
MARINE SCALEFISH FISHERY
PART B –MANAGEMENT ARRANGEMENTS FOR THE TAKING OF SARDINES
Approved by the Minister for Agriculture, Food and Fisheries pursuant to Section 44 of the Fisheries Management Act 2007.
Hon Leon Bignell MP
1 November 2014

2
PIRSA Fisheries and Aquaculture (A Division of Primary Industries and Regions South Australia) GPO Box 1625 ADELAIDE SA 5001 www.pir.sa.gov.au/fisheries Tel: (08) 8226 0900 Fax: (08) 8226 0434
© Primary Industries and Regions South Australia 2014
Disclaimer
This management plan has been prepared pursuant to the Fisheries Management Act 2007 (South Australia) for the purpose of the administration of that Act. The Department of Primary Industries and Regions SA (and the Government of South Australia) make no representation, express or implied, as to the accuracy or completeness of the information contained in this management plan or as to the suitability of that information for any particular purpose. Use of or reliance upon information contained in this management plan is at the sole risk of the user in all things and the Department of Primary Industries and Regions SA (and the Government of South Australia) disclaim any responsibility for that use or reliance and any liability to the user.
Copyright Notice
This work is copyright. Copyright in this work is owned by the Government of South Australia. Apart from any use permitted under the Copyright Act 1968 (Commonwealth), no part of this work may be reproduced by any process without written permission of the Government of South Australia. Requests and enquiries concerning reproduction of this work should be addressed to the Chief Executive, Department of Primary Industries and Regions SA, 25 Grenfell Street, Adelaide, SA, 5000 (marked attention Executive Director, Fisheries and Aquaculture Division).
The South Australian Fisheries Management Series Paper number 68: Management plan for the South Australian Commercial Marine Scalefish Fishery, Part B– management arrangements for the taking of sardines
ISBN 978-0-9924621-3-0 ISSN 1322-8072 Cover photo courtesy of the South Australian Sardine Industry Association Inc.

3
CONTENTS
1 FISHERY TO WHICH THIS PLAN APPLIES ....................................................................... 7
2 CONSISTENCY WITH OTHER MANAGEMENT PLANS ..................................................... 7
3 TERM OF PLAN ................................................................................................................... 7
4 DESCRIPTION OF CLASS OF FISHING ACTIVITY ............................................................ 8
4.1 Historical overview ....................................................................................................... 9 4.2 Target species ............................................................................................................ 11 4.3 Other species ............................................................................................................. 12 4.4 Threatened, endangered and protected (TEPS) species ........................................... 12 4.5 Ecosystem and habitat ............................................................................................... 14 4.6 Biology ....................................................................................................................... 15 4.7 Current biological status of Australian Sardines ......................................................... 16 4.8 Economic characteristics ............................................................................................ 16 4.9 Social characteristics .................................................................................................. 26
5 ECOLOGICALLY SUSTAINABLE DEVELOPMENT ASSESSMENT................................ 28
6 GOALS AND OBJECTIVES ............................................................................................... 30
7 CO-MANAGEMENT ARRANGEMENTS ............................................................................ 40
8 ALLOCATION OF ACCESS BETWEEN SECTORS .......................................................... 41
8.1 Current allocated shares of the resource .................................................................... 41 8.2 Information for adjusting allocations of access in future ............................................. 42 8.3 Allocation triggers ....................................................................................................... 42 8.4 Review of allocations of access in future .................................................................... 42
9 HARVEST STRATEGY ...................................................................................................... 45
9.1 Introduction ................................................................................................................. 45 9.2 Objectives................................................................................................................... 45 9.3 Species ...................................................................................................................... 46 9.4 Assessment method ................................................................................................... 46 9.5 Previous strategies ..................................................................................................... 47 9.6 Reference points ........................................................................................................ 48 9.7 Spatial management .................................................................................................. 49 9.8 Monitoring................................................................................................................... 50 9.9 Decision rules ............................................................................................................. 52 9.10 Meta-rules .................................................................................................................. 54 9.11 Decision-making process ........................................................................................... 55 9.12 Examples.................................................................................................................... 55 9.13 Review ....................................................................................................................... 56
10 OTHER FISHING ................................................................................................................ 57
10.1 Marine Scalefish Fishing ............................................................................................ 57 10.2 Recreational fishing sector ......................................................................................... 57

4
10.3 Aboriginal traditional fishing sector ............................................................................. 57 10.4 Exploratory and developmental fishing ....................................................................... 57
11 STOCK ASSESSMENT AND RESEARCH ........................................................................ 58
11.1 Research services ...................................................................................................... 58 11.2 Data collection and analysis ....................................................................................... 58 11.3 Strategic research plan .............................................................................................. 59
12 COMPLIANCE AND MONITORING ................................................................................... 60
12.1 Objectives................................................................................................................... 60 12.2 Planning ..................................................................................................................... 60 12.3 Compliance status report............................................................................................ 61
13 REGULATORY ARRANGEMENTS ................................................................................... 62
13.1 Licensing .................................................................................................................... 62 13.2 Current management arrangements .......................................................................... 64 13.3 Fish processing .......................................................................................................... 65
14 REVIEW OF PLAN ............................................................................................................. 66
15 RESOURCES REQUIRED TO IMPLEMENT THE PLAN ................................................... 67
15.1 Cost-recovery overview .............................................................................................. 67
16 REFERENCES.................................................................................................................... 68
17 ACRONYMS ....................................................................................................................... 71
18 GLOSSARY OF COMMON FISHERIES MANAGEMENT TERMS .................................... 72
19 APPENDICES ..................................................................................................................... 76
19.1 Risk assessment for the sardine fishery ..................................................................... 76 19.2 Overview of the risk assessment ................................................................................ 84
LIST OF TABLES
Table 1: A chronology of major management milestones in the sardine fishery since 1991. ....... 10 Table 2: Catch and gross value of production of the sardine fishery, 1990-91 to 2010-11. Source: Econsearch 2012. ........................................................................................................................ 17 Table 3: Economic rent in the sardine fishery, 2001-02 to 2010-11 ($’000). Source: Econsearch 2012................................................. ............................................................................................ 23 Table 4: The economic impact of the sardine fishery in South Australia, 2010-11. Source: Econsearch 2012. ........................................................................................................................ 25 Table 5: Risk assessment of ecological components of fishery. .................................................. 29 Table 6: Goals, objectives, strategies for the management of the sardine fishery. ...................... 32 Table 7: Descriptions for the stock status categories used in the Sardine Harvest Strategy. ...... 49

5
Table 8: Harvest decision table for the Sardine Harvest Strategy to guide levels of exploitation (and TACC) and frequency of surveys and assessment for each tier following the most recent spawning biomass (SpB) estimate. Abbreviations: TRP, target reference point; LRP, limit reference point. ............................................................................................................................ 52 Table 9: Catch allocation decision table for the Sardine Harvest Strategy to guide the maximum catch allowed from the GZ. .......................................................................................................... 54 Table 10: Management arrangements for the sardine fishery for the 2012 fishing season. ......... 64 Table 11: Primary ESD components examined in the risk assessment process. ........................ 78 Table 12: Risk matrix to develop risk score. ................................................................................ 79 Table 13: Risk categories, management responses and reporting requirements. ....................... 79 Table 14: Likelihood definitions – these are usually defined for the likelihood of a particular consequence level actually occurring within the assessment period. .......................................... 79 Table 15: Consequence categories for the major target/vulnerable species. The default objective is to maintain the biomass above the target reference point. ....................................................... 80 Table 16: Consequence categories for the by-product species/minor by-catch species. The default objective is to maintain appropriate levels of biomass of by-catch species to minimise any significant impact on their dynamics and the broader ecosystem. ............................................... 80 Table 17: Consequence categories for the by-catch of protected species. The default objective is to maintain levels of catch of these species at acceptable levels. ............................................... 81 Table 18: Consequence categories for the impacts on habitats. The default objective is to maintain the spatial extent of habitat impacts from the fishing activity to a comparatively small percentage of the habitat/ community. ......................................................................................... 81 Table 19: Consequence categories for economic outcomes. The default objective is maintenance or enhancement of economic activity. .......................................................................................... 82 Table 20: Consequence categories for social disruptions. The default objective is maintenance or enhancement of appropriate social structures and outcomes. ..................................................... 82 Table 21: Suggested consequence levels for economic outcomes. The default objective is maintenance or enhancement of economic activity. .................................................................... 83
LIST OF FIGURES
Figure 1: The area of waters of the sardine fishery. ....................................................................... 8 Figure 2: Catch, price and gross value of production (GVP) of sardines, South Australia, 1991-92 to 2010-11.Source: Econsearch 2012.......................................................................................... 18 Figure 3: Price indices for sardine fishery (1997-98=100) a a 1997-98 is the reference year against which all other years are compared. Source: Econsearch 2012. ................................................ 19 Figure 4: Average income licence holder in the sardine fishery, 2001-02 to 2010-11 aa . Estimates of average boat gross income are expressed in nominal terms. Source: Econsearch 2012. ....... 19 Figure 5: Cost shares in the sardine fishery, 2001-02 to 2010-11 a fishery, 2001-02 to 2010-11 aa Financial performance estimates were based on different survey samples and techniques. Some of the difference between years is, therefore, attributable to sampling variability. Source: Econsearch 2012 ......................................................................................................................... 20 Figure 6: Management fee per licence holder and as a proportion of GVP, sardine fishery, 2000-01 to 2010-11. Source: Econsearch 2012 .................................................................................... 21

6
Figure 7: Average total costs in the sardine fishery 2001-02 to 2010-11 a. Estimates of average costs are expressed in nominal terms. Source: Econsearch 2012 .............................................. 21 Figure 8: Average income and profit per boat in the sardine fishery, 2001-02 to 2010-11 a ........ 22 Figure 9: Economic rent as a proportion of GVP in the sardine fishery, 2001-02 to 2010-11. Source: Econsearch 2012. ........................................................................................................... 23 Figure 10: Return on investment in the sardine fishery, 2001-02 to 2010-11. Source: Econsearch 2012.......... ................................................................................................................................... 24 Figure 11: Total employment and household income impact of the sardine fishery on the South Australian economy, 2001-02 to 2010-11. Source: Econsearch 2012. ........................................ 26 Figure 12: The two spatial management zones for the Sardine Harvest Strategy. Abbreviations: OZ, Outside Zone; GZ, Gulfs Zone. ............................................................................................. 50 Figure 13: Average fork length (FL) of sardines in catches from the Gulfs Zone by year (2013 is a partial data set) with the catch allocation decision reference points shown as solid lines. ........... 51 Figure 14: The relationship between spawning biomass, stock status and level of exploitation (or TACC) of the Sardine Harvest Strategy for each tier (abbreviations: LRP: limit reference point; TRP: target reference point). ....................................................................................................... 53 Figure 15: Flow diagram of the steps required to develop a management plan for South Australian fisheries. ..................................................................................................................... 77

7
1 FISHERY TO WHICH THIS PLAN APPLIES
This plan is part of the ‘Management Plan for the South Australian Commercial Marine Scalefish Fishery’(hereafter referred to as the MSF management plan) adopted by the Minister on 1 October 2013 (PIRSA 2013a),and applies to the class of commercial fishing activities involving the taking of Australian Sardines and Australian Anchovy in South Australian coastal waters using the purse seine method (using a sardine net) pursuant to a Marine Scalefish Fishery (MSF) licence. This class of fishing activity is part of the MSF that is formally constituted by the Fisheries Management (Marine Scalefish Fisheries) Regulations 2006 (hereafter referred to as the Fisheries Management (MSF) Regulations).The activity of using a sardine net to target sardines is referred to as the ‘sardine fishery’ for the remainder of this management plan (and supporting documents) and this plan describes the management framework for the fishery. It is acknowledged that this reference to the fishery does not purport to establish a fishery separate to that established by regulation under the Fisheries Management (MSF) Regulations.
MSF licence holders have access to species listed on Schedule 1 of the Fisheries Management (MSF) Regulations. The management framework for these activities is provided by the MSF management plan.
2 CONSISTENCY WITH OTHER MANAGEMENT PLANS
This management plan has been developed to be consistent with other management plans and is part of the MSF management plan.
This management plan has also been developed so that it can be integrated with any Aboriginal traditional fishing management plans that are made in the future that apply to the waters of this fishery. No Indigenous land use agreements (ILUA) and therefore no Aboriginal traditional fishing management plans had been made at the time of writing this management plan.
3 TERM OF PLAN
This management plan applies from 1 November 2014 until 30 September 2023, which coincides with the MSF management plan. A comprehensive review of this management plan will be undertaken after the fifth anniversary of the commencement of this plan to determine whether it should be amended, replaced or reinstated without amendment. Section 44 of the Fisheries Management Act 2007 (hereafter referred to as the Act) prescribes the requirements for replacing or extending this management plan upon expiry (see Section 14).

8
4 DESCRIPTION OF CLASS OF FISHING ACTIVITY
The sardine fishery is primarily based on the capture of Australian Sardine (Sardinops sagax) using a sardine net. The take of Australian Anchovy (Engraulis australis) is also permitted. Access to the sardine fishery is provided through a licence for the MSF with a sardine net endorsement. The net endorsement allows the licence holder to use a small-mesh (14-22 mm) purse seine net when fishing for marine scalefish.
Figure 1: The area of waters of the sardine fishery.
The area of the sardine fishery includes all the waters adjacent to the state of South Australia to the edge of the 200-nautical-mile Australian Fishing Zone (Figure 1), with the exception of closed areas. The legislative instrument defining the area of jurisdiction for the sardine fishery is the 1996 Offshore Constitutional Settlement arrangements for scalefish species between South Australia and the Commonwealth of Australia.
The fishery is managed through an individual transferrable quota (ITQ) system with a total allowable commercial catch (TACC) set for each 12 month period. Under the current arrangements, the TACC is divided equally between the licence holders, and the quota period commences on 1 January of each year. Since 2010, spatial management zones have been used to encourage the development of the fishery outside of Spencer Gulf and Gulf St Vincent. In 2013, the zones were amended on a temporary basis to address concerns regarding declines in size and age composition of sardines caught in southern Spencer Gulf.
The fishery has complementary input controls including limited entry and gear restrictions.

9
Sardines are primarily used as feed for Southern Bluefin Tuna, which are farmed by the aquaculture industry near Port Lincoln, South Australia. Small amounts are also sold for human consumption and as recreational fishing bait.
4.1 Historical overview
In February 1991 the (then) Department of Fisheries wrote to the MSF licence holders who had a net endorsement on their licence seeking expressions of interest in establishing a fishery for Australian Sardines (then called ‘pilchards’) using a small-mesh purse seine net. As a result, 20 licence holders gained access to take sardines using this method (Mackie 1995).
Catches among the 20 licence holders were low, as very few took up sardine fishing on a full-time basis or made the commitment to purchase purpose-built fishing gear. Consequently, those in the fishery were unable to supply the newly established tuna farms with their required supply of sardines for feedstock.
The access entitlement was subsequently reviewed and the (then) Scalefish Management Committee decided to provide continued access to the following groups:
• Australian Tuna Boat Owners Association (ATBOA).
• A special permit holder (a Western Australian sardine fisher).
• MSF licence holders who had supplied sardine catch and effort data to PIRSA Fisheries.
In June 1993, these arrangements were reviewed as a result of the following new access arrangements being established. Permit holders endorsed in the developmental Pilchard Fishery during the 1992-93 season were considered eligible to apply for entry into the fishery if:
• They had a proven significant catch history of at least 30 t during the period 1 July 1992 to 30 June 1993 or
• The permit holder had proven significant financial investment in a specific sardine purse seine fishing vessel during the period 1 July 1992 to 2 April 1993.
As a result of these new access arrangements, seven MSF licence holders and seven fishers previously nominated by the ATBOA were granted access to sardines. Access was administered by ministerial exemptions.
In March 2000, a Pilchard Fishery Independent Advisory Allocation Panel was established to provide advice to the Minister in regard to future access to the sardine resource. The advice of the panel (subsequently adopted by the Minister), was that the current 14 fishers should maintain their access to the sardine resource in waters adjacent to South Australia; seven by virtue of holding a commercial licence in the MSF and seven as nominees of the ATBOA.
Access was also granted in 1996 to licence holders with a Commonwealth Southern Bluefin Tuna Permit to take the genera/species Emmelichthyes, Trachurus, Sardinops, Clupea, Scomber australasicus and Engraulis for bait purposes. These management arrangements were legislated pursuant to the 1996 Offshore Constitutional Settlement arrangements for scalefish species between South Australia and the Commonwealth.

10
In addition to the development of management arrangements in the fishery, the most significant events in the short history of the fishery were the 1995 and 1998 mass mortality events, which saw the fishery closed for a short period during each event. These events have been attributed to a Herpes-like virus of unknown origin (Ward et al.2001b) and killed approximately 70 per cent of the spawning biomass (SpB) in South Australian waters (Ward et al. 2001b). Difficulties in reliably estimating sardine age have impeded the assessment of the fishery’s capacity to recover from these events (Ward et al. 2012), but the fact that recoveries have occurred relatively quickly highlights the fishery’s robustness. Table 1 provides a summary of the major milestones in the development of the sardine fishery.
Date Event
1991 The government wrote to MSF licence holders seeking expressions of interest in establishing a sardine fishery using purse seine nets.
1991 The government gave access to 20 MSF licence holders to take sardines using purse seine nets.
1992 Access entitlements were reviewed due to low catches and limited commitment to the fishery. Access arrangements were continued for the ATBOA, certain MSF licence holders who had supplied catch and effort data, and a Western Australian sardine fisher.
1993 New arrangements were established where permit holders had to prove a catch history of at least 30 t or significant financial investment during a certain time period. As a result, seven MSF licence holders and seven fishers nominated by the ATBOA were granted access to sardines.
1995 The first management plan was implemented for the sardine fishery.
1995 The first daily egg production method survey was completed and research costs were recovered from the industry.
1995 A mass mortality event occurred and was attributed to the Herpes-like virus of unknown origin.
1996 Access was granted for Commonwealth Southern Bluefin Tuna statutory fishing right holders to take sardines and anchovies. These arrangements were legislated through the 1996 Offshore Constitutional Settlement.
1998 A mass mortality event occurred and was attributed to the Herpes-like virus of unknown origin.
2000 An independent advisory panel provided advice in regard to future access of the resource. Fourteen fishers retained access to the sardine fishery (seven who had a MSF licence and the seven nominated by the ATBOA).
2004 The first ecological study was completed for the fishery.
2005 The 2005 management plan was implemented and replaced the 1995 management plan.
2005 The sardine fishery was closed due to evidence of common dolphin mortalities in sardine nets. The fishery was reopened two months later upon the introduction of a code of practice to reduce encirclements and mortalities. An ongoing Independent Observer Program was implemented to monitor and report on interactions with threatened, endangered and protected species.
2007 A revised Harvest Strategy was implemented through an addendum to the 2005 management plan.
2010 Spatial management zones were introduced to explore the feasibility of sardine fishing outside the gulf systems in non-traditional fishing areas.
2012 The TACC was increased mid-season by 2000 t to address an unanticipated shortfall of feed for the Southern Bluefin Tuna farming sector.
2013 The 2013 TACC was reduced by 2000 t in response to the additional quota provided in 2012.
2013 Temporary spatial management measures were implemented in the fishery to limit the 32,000 TACC to 25,000 t inside Spencer Gulf and the eastern area of the fishery, in response to a decline in size and age of sardines caught in southern Spencer Gulf in the previous seasons.
Table 1: A chronology of major management milestones in the sardine fishery since 1991.

11
The first management plan for the fishery, ‘A Management Plan for the Experimental Pilchard Fishery’, was developed in 1995 and set out the objectives for management of the fishery, management arrangements, and the primary indicators for assessing the fishery. A decade later the ‘Management Plan for the South Australian Pilchard Fishery’ was released with the first Harvest Strategy introduced in the management plan.This Harvest Strategy was updated in 2007 through an addendum to the 2005 management plan.
The addendum to the 2005 management plan set out the Harvest Strategy objectives, reference points and decision rules. Development of that Harvest Strategy considered:
• The level at which a baseline TACC should be set.
• The target range of SpB estimates in which the TACC should remain at the baseline level.
• The frequency of SpB estimates under different scenarios.
• The exploitation rate limits within which fishing is believed to be sustainable.
The Harvest Strategy aimed to achieve: • Sustainability of the resource.
• Greater certainty and stability.
• Optimal productivity and profitability.
4.2 Target species
The sardine fishery primarily harvests Australian Sardine (Sardinops sagax), although Australian Anchovy (Engraulis australis) may also be taken.
Australian Sardines are found in northern and southern hemispheres where, along with a southern Australian species, Australian Anchovy, it commonly dominates the fish biomass in upwelling regions (Ward et al. 2012). In Australia, sardines are found between Rockhampton, Queensland and Shark Bay, Western Australia, including in northern Tasmania (Ward et al. 2012). Waters off South Australia are the centre of the sardine’s Australian distribution and support the largest component of the Australian population (Ward et al. 2012).
Sardine is the dominant clupeid off South Australia, occurring from the southern parts of both gulfs to past the continental shelf (Ward et al. 2001b). When sardine biomass is high, the Australian Anchovy occurs mainly in the northern gulfs, but when sardine biomass is low anchovies have the capacity to increase in abundance and expand their distribution into shelf waters (Ward et al. 2012).
Since the fishery’s inception, fishers targeted Australian Pilchard (Sardinops neopilchardus) until 1 December 2007 when the introduction of the Fisheries Management (MSF) Regulations updated species names in line with the Australian Fish Names Standard. This meant the name Australian Pilchard (S. neopilchardus) was changed to Australian Sardine (S. sagax).

12
A sizeable stock of Australian Anchovy occurs in South Australian waters (Dimmlich et al. 2004, Dimmlich et al. 2009). In 2000, daily egg production method (DEPM) surveys conducted for sardines were extended into the northern part of the Gulf St Vincent and Spencer Gulf so a SpB estimate of anchovy could be completed (Dimmlichet al. 2009). The SpB for Australian Anchovy in South Australian waters in 2000 was over 126,000 t (Dimmlich et al. 2009). This information was used to set a precautionary TACC for Australian Anchovy.
4.3 Other species
Historically,species from the families Engraulididae and Clupeidae have been incorporated in the scope of previous management plans (Shanks 2005, Mackie 1995), and include Blue Sprat (Spratelloides robustus), Sandy Sprat (Hyperlophus vittatus) and Maray (Etrumeus teres).
Of the families Engraulididae and Clupeidae, only Australian Sardines and Australian Anchovy are listed in Schedule 1 of the Fisheries Management (MSF) Regulations as aquatic resources prescribed for the MSF. Therefore, under the current management arrangements the sardine net (the registered device) may only be used for the taking these species unless exempt under Section 115 of the Act.
In recent years, the fishery has held a ministerial exemption to take Redbait (Emmelichthys nitidus) and mackerel species (Trachurus declivis, T. symmetricus, T. novaezelandiae, Scomber australasicus) as incidental caught by-product in coastal waters. If any of these species are incidentally taken, they are to be recorded on catch disposal record (CDR) forms as ‘sardine’ or ‘anchovy’ catch for quota monitoring purposes. The exemption to take Redbait and mackerel for the fishery expired and was not renewed from May 2013 at the request of the South Australian Sardine Industry Association (SASIA).
4.4 Threatened, endangered and protected (TEPS) species
In November 2004 a targeted seven-month independent monitoring program was initiated to monitor interactions of the sardine fishery with threatened, endangered and protected species (TEPS). The program was implemented to address recommendations from the Part 13 and Part 13A accreditation under the Commonwealth Environmental Protection and Biodiversity Conservation Act 1999. The recommendations from the (then) Australian Government Department of the Environment, Water, Heritage and the Arts stipulated, among other things, that:
• Mechanisms be established to allow fishers to record interactions with TEPS at a species level and at an appropriate level of accuracy, and
• If available information indicated that the sardine fishery was having significant interactions with any TEPS, measures to mitigate those interactions should be implemented within 12 months.
The results from this monitoring program revealed that the fishery was having high interaction rates with common dolphins (Delphinus delphis) and therefore an independent program was put in place to monitor 10 per cent of fishing nights, which was increased to 30 per cent in July 2007 due to the level of interaction rates (Hamer et al. 2009).

13
In response to the interactions, industry implemented a code of practice (CoP) that mitigated against interactions with common dolphins by introducing an avoidance and delay approach. This CoP raised awareness within the industry and saw a reduction in the interaction rates with common dolphins (Hamer et al. 2009). In 2008 the CoP was reviewed and refinements were made, including requirements that operators delay the commencement of fishing prior to setting the net and dropping the front of the net if they noticed a dolphin enclosed in the net. This, together with improved implementation of the CoP, saw an increase in the effectiveness of the sardine industry to mitigate against interactions (Hamer et al. 2009).
In July 2010 the required level of observer coverage returned to 10 per cent due to industry’s improved ability to reduce the number of dolphin interactions, and in 2013 observer coverage changed from being based on nights fished to the number of net sets, in order to improve the effectiveness and transparency of the program.
A project was undertaken during 2010 to analyse the effectiveness of the CoP regarding interactions with dolphins, and found it to be highly effective and successful (Ward et al. 2010b). The report also highlighted that observer data and logbook data were statistically different, with observer encirclements being 15 times higher and observer mortalities being 24 times higher than their respective logbook rates in the 2006-07 financial year (Ward et al. 2010b). This difference decreased in 2009-10 to 2.9 times higher and two times higher respectively (Ward et al. 2010b). Ward et al. (2010b) attributed the reduction in encirclements to the industry’s avoidance procedures and the reduction in mortalities to industry’s reaction times and the success of the adopted release procedures. However, a discrepancy between the observer interaction rates and the logbook interaction rates remained (Ward et al. 2010b).
In late October 2011, SASIA started collecting real-time information on interactions to help improve transparency and remove discrepancy between interaction rates. In the most recently published reports of TEPS interactions (Tsolos and Boyle 2013), five dolphin mortalities were recorded in logbooks during 2011-12. Over the same period, one mortality1 was recorded by observers with approximately seven per cent observer coverage. In comparison, unpublished data from 2012-13 suggests there were four logbook mortalities and one observer mortality recorded, with approximately 10 per cent observer coverage, suggesting further reduction in the number of dolphin interactions.
Industry have continuously been proactive in implementing any measures they consider appropriate to help reduce the discrepancy between the two rates and to reduce the level of interactions with dolphins. SASIA has established a TEPS working group that holds quarterly meetings to monitor and report to PIRSA on the level of interactions and differences between the two interaction rates, and to review international standards for mitigation of interactions with marine mammals. Annual reports of reported TEPS interactions are published by SARDI and are available on their website.
1Observer-recorded mortalities are included in the logbook recorded mortalities.

14
4.5 Ecosystem and habitat
4.5.1 Movement patterns
Sardines have been known to undertake extensive migrations, and while movement patterns in waters off South Australia are largely unknown, sardines off South Australia also behave in this way (Ward et al. 2012). There is some evidence of size and age structure in the stock with larger, older fish most commonly found in shelf waters and smaller, younger fish mainly found in embayments including in Spencer Gulf (Goldsworthy et al. 2011). Improved understanding of structure has been identified as a priority for the fishery due to the high concentration of effort in southern Spencer Gulf while the majority of the SpB is in the Great Australian Bight (Goldsworthy et al. 2011).
A recent project provided some evidence of separate populations between the southern and eastern coastal populations. This analysis also concluded that changes in the population sub-structure off South Australia are possibly driven by environmental factors (Goldsworthy et al. 2011).
4.5.2 Oceanography
The Great Australian Bight contains a broad continental shelf (up to 200 km wide) that is the location of the world’s only northern boundary current upwelling ecosystem (Goldsworthy et al. 2011). The area where the continental shelf waters and the southern Spencer Gulf meet forms a complex oceanographic system (Goldsworthy et al. 2011). At the mouth of the gulf, thermal and salinity fronts limit the exchange between cool, low-salinity water (outside the gulf) and the warmer, higher salinity water (inside the gulf). The system is not greatly understood but is thought to play an important ecological role in the region (Goldsworthy et al. 2011).
This region supports coastal upwelling in summer and autumn, as well as numerous currents along the continental shelf – providing a complex interaction of oceanographic processes. These processes support a high level of planktonic production during upwelling periods and a diverse range of marine species with high conservation significance and substantial economic value to local ecological communities (Goldsworthy et al. 2011). These conditions are suitable for the spawning, survival and growth of a diverse small pelagic fish comprising of six families– Clupeidae, Engraulidae, Scombridae, Carangidae, Emmelichthyidae and Scomberesocidae (Goldsworthy et al. 2011). From these six families there are 10 key species found in South Australia – Australian Sardine (S.sagax), Australian Anchovy (E. australis), Maray (Etrumeus teres), Sandy Sprat (Hyperlophus vittatus), Blue Sprat (Spratelloides robustus), mackerels (Trachurus declivis and T. novaezelandiae), Blue Mackerel (Scomber australasicus), Redbait (Emmelichthys nitidus) and King Gar (Scomberesox saurus). Of these small pelagic fish the family Clupeidae is dominant, with five species occurring in the region (Goldsworthy et al. 2011).

15
4.6 Biology
4.6.1 Taxonomy
Historically, five species have been recognised in the genus Sardinops, but recently this has been revised to be mono-specific with no valid sub-species and the name Sardinops sagax has taken taxonomic priority (Ward et al. 2012). Prior to 2007, sardines were referred to as pilchards but during the implementation of the Act, fish names were updated across all South Australian fisheries. The name Australian Sardine is also used by the Australian Fish Names Standard.
4.6.2 Distribution
Sardines occur in cool, temperate to subtropical waters along with species of anchovy, and commonly dominate fish biomass in upwelling regions (Ward et al. 2012). In Australia they are found between Rockhampton, Queensland and Shark Bay, Western Australia, including in northern Tasmania (Ward et al. 2012).
Australian Anchovies are also abundant off South Australia and occur mostly in the northern part of the gulfs when sardine biomass is high, but with the capacity to increase abundance and expand distribution into shelf waters when sardine abundance is reduced (Ward et al. 2012).
4.6.3 Behaviour and feeding
Australian Sardines have a complex schooling behaviour that varies over space and time (Ward et al. 2012). Previous studies have shown that sardine densities remain constant during the day and on other occasions densities change during the afternoon. One study also observed schools displaying anti-predator behaviour, dispersing at night and reforming at sunrise and remaining in schools during the day (Ward et al. 2012).
Schooling behaviours vary within and among locations, days, months and years, and complicate the application of acoustic techniques for stock assessment (Ward et al. 2012). There is also some evidence that spawning influences schooling behaviour, with spawning females underrepresented in commercial catches (Ward et al. 2012).
Sardines have two feeding modes depending on food density – filter feeding on microzooplankton and phytoplankton and particulate feeding on macrozooplankton (Ward et al. 2012).
4.6.4 Reproduction
Sardines are serial spawners and release numerous batches of pelagic eggs. These batches are directly related to female size but vary between years and regions (Ward et al. 2012). The eggs are released throughout the spawning season, which occurs once a year (on occasion it is possible for sardines to have two spawning seasons per year) (Ward et al. 2012). Spawning occurs during January to April with approximately 10,000 to 30,000 eggs spawned per female each week (Ward et al. 2012).

16
4.6.5 Age growth and size
After fertilisation, sardine eggs take two days to hatch, which is followed by a relatively long larval phase of one to two months. Larval survival rates have a large effect on biomass levels, with large fluctuations caused by recruitment success (Ward et al. 2012). In South Australia, larvae are abundant at the mouth of the gulfs and along the shelf waters, coinciding with the upwelling periods (Ward et al. 2012).
Sardine size and age to sexual maturity varies between locations and ranges between 100mm to 180mm fork length, and 1.8 to 2.8 years. In South Australia, approximately 50 per cent of sardines reach sexual maturity at 146mm (males) and 150mm (females) (Ward et al. 2012). Despite difficulties in using certain ageing methodologies, sardines found in South Australian waters have shown higher growth rates than sardines in other parts of Australia (Ward et al. 2012).
4.6.6 Role in the ecosystem
Small pelagic fish live in the upper layers of the water column. These low trophic species play an important role in the ecosystem, being highly connected in the food web.
4.7 Current biological status of Australian Sardines
The performance indicator (PI) for the sardine fishery is primarily the estimate of SpB obtained from undertaking a DEPM survey, which was first completed in 1995.
In the most recent stock assessment (Ward et al. 2012), the SpB of the Australian Sardine is in a relatively strong position with estimates (from surveys in 2011) well above the limit reference point of 75,000 t. Further, the 2012 assessment states that the model outputs suggest the SpB has been relatively stable at approximately 170,000 t to 200,000 t over the last decade.
4.8 Economic characteristics
A time series of economic information in relation to the sardine fishery has been collected since 1997-98 and presented in a series of economic indicators reports. The most recent report at the time of making this management plan relates to 2010-11 (Econsearch 2012).
The economic climate of the sardine fishery has many variables, including the value of the Australian dollar, Southern Bluefin Tuna Fishery available TACC, Southern Bluefin Tuna market prices, the sardine size caught, whether sardines are sold fresh or frozen, etc. These variables make determining the reasons for certain trends difficult to understand, and make forecasting predictions difficult also.
Economics of the sardine fishery are difficult to interpret because many of the companies that operate in the fishery are vertically integrated (where a business owns multiple stages of production). In this case, sardine fishers who own a processing facility and possibly Southern Bluefin Tuna quota rights to the Commonwealth’s Southern Bluefin Tuna Fishery, and also aquaculture leases to farm the tuna (the main market for sardines).

17
4.8.1 Catch and gross value of production
The gross landed value of production (GVP) of the sardine fishery peaked in 2004-05 at approximately $28.5 million when almost 57,000 t were landed. The total catch in 2010-11 was 33,220 t with a total GVP of over $19.3 million (Table 2).
Since the establishment of the fishery in 1990-91, the GVP and total catch fluctuated but generally followed an increasing trend until 2004-05 before dropping the following year due to a reduced TACC. Catches have since ranged between 27,850 t in 2008-09 and 36,573 t in 2009-10.
Table 2: Catch and gross value of production of the sardine fishery, 1990-91 to 2010-11. Source: Econsearch 2012.
During the 2004-05 peak, the nominal value of the sardine catch was more than seven times its value in 1997-98, which in turn was three times the value recorded in 1993-94 when the fishery’s experimental period commenced (Figure 2). This significant increase in value corresponds closely
Year TACC Catch Value of Catch(tonnes set in calendar years) (tonnes) ($ '000)
1990-91 n/a n/a n/a1991-92 n/a 145 1641992-93 n/a 1,230 7571993-94 n/a 2,377 1,3601994-95 n/a 2,803 1,6301995-96 3,500 3,708 2,5241996-97 3,500 3,428 2,1971997-98 3,500 6,041 3,8461998-99 9,000 4,465 2,5001999-00 4,700 3,836 2,6852000-01 3,800 7,368 5,1572001-02 9,100 12,165 8,5162002-03 17,750 21,741 17,8272003-04 36,000 33,160 22,5492004-05 40,000 56,952 28,4762005-06 51,100 28,626 16,0312006-07 25,462 30,355 18,5172007-08 32,000 29,692 16,3312008-09 30,000 27,850 17,5462009-10 30,000 36,573 23,0412010-11 34,000 33,220 19,2682011-12 34,000 36,962 20,6992012-13 36,000 n/a n/a2013-14 32,000 n/a n/a

18
with increased catches to meet the growing demand for feedstock from Port Lincoln’s tuna farming industry. Between 2005-06 and 2009-10, the nominal value of catch increased by approximately 44% ($16.0 million in 2005-06 to $23.0 million in 2009-10). In 2010-11 the nominal value of catch decreased as a result of a fall in catch and average price.
Since its peak, the nominal price of sardines fell 39 per cent to $0.50/kg in 2004-05. The price recovered slightly in subsequent years, reaching $0.56/kg in 2005-06 and $0.61/kg in 2006-07. Since then, the average price of sardines has fluctuated and in 2010-11 the average nominal price fell to $0.58/kg, an 8 per cent decline on the previous year.
From 1997-98 to 2010-11 there was a 9 per cent decrease in the nominal beach price of sardines. This equates to a 39 per cent decline in the real price (adjusted for CPI) over that period (Figure 2), which can be explained by the increase in volume caught by the fishery over the same period.
Figure 2: Catch, price and gross value of production (GVP) of sardines, South Australia, 1991-92 to 2010-11.Source: Econsearch 2012.

19
Figure 3: Price indices for sardine fishery (1997-98=100) a a1997-98 is the reference year against which all other years are compared. Source: Econsearch 2012.
4.8.2 Income and costs
Income in the fishery has fluctuated since 1991-92, with a dramatic decline in 2004-05 due to the increase in TACC influencing supply (Figure 4). Since 2005-06, fluctuating income has largely been due to fluctuating sardine prices.
Figure 4: Average income licence holder in the sardine fishery, 2001-02 to 2010-11 aa . Estimates of average boat gross income are expressed in nominal terms.Source: Econsearch 2012.

20
A breakdown of major cost items as a proportion of total cash costs shows that labour costs accounted for the largest share of total cash costs, at approximately 45 per cent (Figure 5). These labour costs are comprised of payments to licence owners and crew as well as an imputed wage to those licence owners and other family members who are not paid a wage directly by the business. Other significant cash costs included fuel, repairs and maintenance, licence fees and, in recent years interest (Figure 5).
One of the objectives of the fishery’s management is full cost-recovery. To achieve this objective, licence fees are set at a level sufficient to recover management costs attributable to the commercial sector.
The total cost of management in 2010-11 was $991,000, which represents just over a 50 per cent increase from the previous year due to agreed research priorities and increased observer costs. As a percentage of GVP, the total cost of management was 5.1 per cent in 2010-11 (Econsearch 2012).
The average management fee per licence holder and the licence fee as a proportion of GVP are illustrated in Figure 6. Licence fees as a percentage of GVP have fluctuated between years since the fishery began.
Figure 5: Cost shares in the sardine fishery, 2001-02 to 2010-11 a fishery, 2001-02 to 2010-11 aa Financial performance estimates were based on different survey samples and techniques. Some of the difference between years is, therefore, attributable to sampling variability. Source: Econsearch 2012

21
The cash costs detailed in Figure 7 can be categorised as either variable or fixed costs. Total variable costs increased between 2001-02 and 2004-05, and have fluctuated in subsequent years but generally followed a slight decreasing trend. As would be expected, total fixed costs have fluctuated much less from year to year but followed an increasing trend over the entire period of analysis (Figure 7).
Figure 6: Management fee per licence holder and as a proportion of GVP, sardine fishery, 2000-01 to 2010-11. Source: Econsearch 2012
Figure 7: Average total costs in the sardine fishery 2001-02 to 2010-11 a. Estimates of average costs are expressed in nominal terms. Source: Econsearch 2012

22
4.8.3 Profitability
Selected measures of profitability for the sardine fishery are summarised in Figure 8 for the years 2001-02 to 2010-11. Changes in each of the profitability measures for the fishery were closely related to average income earned. Profitability followed an increasing trend between 2001-02 and 2004-05 before declining significantly in 2005-06 as a result of the reduction in TACC. Productivity improved slightly between 2005-06 and 2010-11. The average gross income per surveyed licence in the fishery was approximately $1.2 million in 2010-11, down 16 per cent from 2009-10 ($1.4 million) (Figure 8).
Figure 8: Average income and profit per boat in the sardine fishery, 2001-02 to 2010-11 a
a Estimates of income and profitability measures are expressed in nominal terms. Source: Econsearch 2012.
Gross operating surplus of all licences in 2010-11 was approximately $362,000, 27 per cent lower than in 2009-10 ($495,000). Gross operating surplus and boat business profit give an indication of the capacity of the operator to remain in the fishery in the short to medium term. In 2010-11, the average boat business profit was almost $180,000, representing a significant decline on the previous year ($323,000).
Profit at full equity is a useful absolute measure of the economic performance of fishing firms.In 2010-11 (approximately $251,000 per licence) was significantly less than the estimate for the previous year (around $393,000).
4.8.4 Economic rent
Economic rent is defined as the difference between the price of a good produced using a natural resource and the unit costs of turning that natural resource into the good, including the opportunity cost of capital. In this case, the natural resource is the sardine fishery and the good produced is the landed fish.
All long-term costs of operating a fishing business need to be covered if the licence holder is to remain in the fishery. These long-term costs include direct operating costs such as fuel, labour (including the opportunity cost of a self-employed fisher’s own labour), overheads (administration and licences), and the cost of capital invested in the boat and gear (excluding licence).

23
The economic rent generated in the sardine fishery was estimated to be approximately -$988,000 in 2010-11 (Table 3). Such an annual economic rent represents a return of -1.9 per cent of the capital value of the fishery.
Table 3: Economic rent in the sardine fishery, 2001-02 to 2010-11 ($’000). Source: Econsearch 2012.
Economic rent expressed as a percentage of GVP is a useful indicator for analysing a fishery over time and for comparing different fisheries. This indicator shows an increase between 2001-02 and 2004-05 before a sharp decline in 2005-06, then a significant improvement in 2008-09 and 2009-10 before another decline in 2010-11 (Figure 9).
Gross Income
Less Labour Less Cash Costs
Less Depreciation
Less Opportunity Cost of Capital
(@10%)
Economic Rent
2001/02 8,516 3,029 2,263 1,101 1,046 1,078
2002/03 22,025 7,754 3,439 2,629 2,497 5,706
2003/04 22,549 7,939 3,763 2,192 2,082 6,574
2004/05 28,476 10,026 4,620 1,961 1,863 10,006
2005/06 16,031 6,650 6,554 2,709 3,656 -3,538
2006/07 18,517 7,610 6,514 2,979 3,889 -2,475
2007/08 16,331 6,729 6,488 3,060 3,995 -3,941
2008/09 17,546 5,849 6,045 2,230 4,329 -907
2009/10 23,041 7,616 6,785 2,395 4,648 1,598
2010/11 19,268 6,627 6,072 2,570 4,988 -988
Figure 9: Economic rent as a proportion of GVP in the sardine fishery, 2001-02 to 2010-11. Source: Econsearch 2012.

24
When economic rent is generated in a fishery and there are transferable licences, the rent represents a return to the value of the licences. Between 2001-02 and 2004-05 the estimated rate of return on investment increased from 5 per cent to almost 10 per cent. The estimated return on investment fell significantly in 2005-06 but has improved in subsequent years as a result of a slight increase in profitability of the fishery. The estimated average licence value over the period 1997-98 to 2010-11 was also closely linked to changes in the profitability of the fishery (Figure 10).
4.8.5 Contribution to the South Australian economy
In 2010-11 the sardine fishery was responsible for the direct employment of around 48 full-time equivalents (FTEs) and downstream activities (i.e., processing,transport, retail/food services and capital expenditure), and created employment of 23 FTE jobs statewide (Table 4). Flow-on business activity was estimated to generate a further 106 FTE jobs statewide. These jobs were concentrated in the trade (32), manufacturing (19), business services (12) and transport (5) sectors.
The total employment impact in South Australia was estimated to be 178 FTE jobs (including 108 FTE jobs in the Eyre/Western2 region).
2 The Eyre and Western region is consistent with the South Australian Government region, as defined by the Department of Planning and Local Government.
Figure 10: Return on investment in the sardine fishery, 2001-02 to 2010-11. Source: Econsearch 2012

25
Table 4: The economic impact of the sardine fishery in South Australia, 2010-11.Source: Econsearch 2012.
aFull-time equivalent (FTE) jobs. Direct employment in the fishing sector comprised 13 full-time jobs and 67 part-time jobs, which was estimated to equate to 48 FTE jobs. bCapital expenditure includes fishing-related expenditure (boats, fishing gear and equipment, sheds and buildings, motor vehicles and other equipment) and processing relating expenditure (sheds, buildings and freezers). cTotals may not sum due to rounding.
Contribution to gross state product or gross regional product is measured as value of output less the cost of goods and services (including imports) used in producing the output. In 2010-11, total sardine fishery related contribution to gross state product in South Australia was $27.1 million (including $20.1 million in the Eyre/Western region), $13.8 million generated by fishing directly, $1.5 million generated by downstream activities, and $11.8 million generated in other sectors of the State’s economy.
There has been an increase in the total employment impact of the sardine fishery on the South Australian economy between 2001-02 and 2010-11 (Figure 11). This increase can be primarily attributed to an increase in indirect employment.
($m) % (fte jobs) % ($m) % ($m) %
Direct effects
Fishing 19.3 41.2% 48 26.9% 5.8 43.9% 13.8 51.0%
Processing 1.9 4.0% 6 3.6% 0.4 3.2% 0.6 2.2%
Transport 0.0 0.0% 0 0.0% 0.0 0.0% 0.0 0.0%
Retail 1.1 2.4% 12 6.6% 0.4 3.1% 0.6 2.1%
Food services 0.0 0.0% 0 0.0% 0.0 0.0% 0.0 0.0%
Capital expenditure b 0.8 1.8% 6 3.2% 0.2 1.8% 0.3 1.3%
Total Direct c 23.1 47.7% 71 37.0% 6.9 50.1% 15.3 55.3%
Flow-on effects
Trade 3.9 8.4% 32 17.9% 1.3 9.8% 1.9 6.9%
Manufacturing 5.6 12.1% 19 10.7% 1.3 9.5% 1.8 6.7%
Business Services 2.8 6.0% 12 6.6% 1.0 7.3% 1.3 4.9%
Transport 1.4 3.0% 5 2.8% 0.3 2.5% 0.6 2.2%
Other Sectors 9.9 21.1% 39 21.8% 2.5 18.9% 6.2 22.7%
Total Flow-on c 23.6 50.6% 106 59.8% 6.4 48.1% 11.8 43.4%
Total c 46.7 100.0% 178 100.0% 13.3 100.0% 27.1 100.0%
Total/Direct 2.0 - 2.5 - 1.9 - 1.8 -
Total/Tonne $1,600 - 0.01 - $400 - $973 -
SectorOutput Contribution to GSPEmployment a Household Income

26
Figure 11: Total employment and household income impact of the sardine fishery on the South Australian economy, 2001-02 to 2010-11.Source:Econsearch 2012.
4.9 Social characteristics
The sardine fishery is a relatively new fishery that has developed through demand for sardines to be used as feed in the Southern Bluefin Tuna farms. The fishery has historically been based in Port Lincoln and provides employment and flow-on benefits to this region.
The fishery is extremely visible, using up to 10 vessels of varying sizes based in the line of sight of the main town and accessible to the general public. This provides Port Lincoln with the ambience of a fishing town – a tourist attraction for recreational fishers and tourists alike.
This fishery is regarded as lifestyle ‘friendly’ compared to a range of other fisheries, with trips normally undertaken overnight and fewer sea-nights undertaken each year compared to most fisheries in the region. This means the lifestyle usually has less impact on family relationships. Fishing generally does not occur in rough or windy weather, while most other fisheries would regularly work in this weather. Also the fishery is less physically demanding than other fisheries, not requiring the manual handling of fish when loading and unloading.
The fishery is likely not to suffer from a lack of qualified workers due to sardine fishery work being sought after amongst other fishers who work out of Port Lincoln; although there are some early signs of a general trade skills shortage due to the attractive salaries offered by the mining sector. However, the supply of qualified workers to industries such as commercial fishing may increase if the scaling back of mining operations continues.
Expansion of the fishery outside of the historical effort areas may result in fishers taking longer trips away and possibly higher fuel costs, which would detract from wages. This could alter the perception of the sardine industry to workers in the future.

27
4.9.1 Expansion of the fishery
In 2010 spatial management arrangements were introduced in the fishery to encourage fishing in non-traditional fishing grounds, including in the far west region of the fishery. The development of the non-traditional fishing ground was undertaken in conjunction with the Fisheries Research and Development Corporation Project 2009/021 to examine movement patterns of sardines in southern Australia.
The management arrangements that allowed for the development of the non-traditional fishing zone and exploratory fishing quota have been amended under this management plan. The Harvest Strategy in Section 9 describes the new management arrangements.

28
5 ECOLOGICALLY SUSTAINABLE DEVELOPMENT ASSESSMENT
The Act requires that ecological impacts be identified and assessed as the first step in developing a management plan. A goal of this plan is the management of the sardine fishery resources as a part of the broader ecosystem, using an ecosystem-based fisheries management (EBFM) approach. The Act specifically requires that the following impacts are identified:
• Current known impacts of the fishery on the ecosystem.
• Potential impacts of the fishery on the ecosystem.
• Ecological factors that could have an impact on the performance of the fishery.
These impacts must be assessed to determine the most serious risks, and strategies for addressing them must be developed.
The ecological impacts associated with the fishery have been identified and assessed through the process of conducting an ecologically sustainable development (ESD) risk assessment for the sardine fishery,using the National Ecologically Sustainable Development Reporting Framework for Australian Fisheries (Fletcher et al. 2002) to guide the assessment.
In accordance with the ESD object in the Act, this approach is aimed at assisting PIRSA to identify and prioritise all of the important ecological, social and economic factors that affect the management of the fishery. Risks and important issues in the fishery were identified in consultation with stakeholders and prioritised using risk ratings from ‘negligible’ to ‘high’. Risks identified as ‘medium’ or ‘high’ are summarised in Table 5, which also includes references to specific management objectives and strategies that have been developed to address these risks. A more detailed description of the management goals, objectives and strategies is provided in Section 6 and Table 6.
An overview of the ESD risk assessment for the sardine fishery is provided in Section 19.1. For more detailed information about the fishery and the outcomes of the ESD risk assessment, refer to the Ecologically Sustainable Development Risk Assessment for the Commercial Sardine Fishery (PIRSA in prep.).

29
Tabl
e 5:R
isk as
sess
men
t of e
colo
gica
l com
pone
nts o
f fish
ery.
Com
pone
nt
Risk
/issu
e De
scrip
tion
Risk
/impo
rtanc
e Ob
jectiv
e St
rate
gies
Re
taine
d spe
cies
Austr
alian
Sar
dines
Ri
sk of
fishe
ry im
pacts
on S
pB of
sard
ines –
prim
ary s
pecie
s Me
dium
1a
, 1b
4c
1a(i)
, 1a(
ii), 1a
(iii)
1b(i)
, 1b(
ii), 1b
(iii),
1b(iv
), 1b
(v)
4c(i)
No
n-re
taine
d spe
cies
Comm
on do
lphin–
socia
l Ri
sk to
the f
isher
y fro
m so
cial a
ccep
tance
to im
pacts
with
comm
on do
lphins
–th
reate
ned,
enda
nger
ed an
d pro
tected
spec
ies
Medi
um
3a, 3
b, 3c
3a
(i), 3
a(ii),
3a(iii
), 3a
(iv)
3b(i)
, 3b(
ii), 3b
(iii),
3b(iv
), 3b
(v), 3
b(vi)
3c
(i)
Gene
ral e
cosy
stem
impa
cts of
fishin
g W
ater q
uality
– br
ine di
scha
rge
Risk
of th
e fish
ery f
rom
brine
disc
harg
e - w
ater q
uality
Hi
gh
3a
3a(v)
Gene
ral c
ommu
nity
W
ork,
healt
h and
safet
y Ri
sk to
the f
isher
y fro
m wo
rk, he
alth a
nd sa
fety l
egisl
ative
chan
ges a
nd
accid
ents
– fish
ing in
dustr
y Me
dium
Ensu
re sk
ipper
s are
awar
e of O
HS&W
re
quire
ments
and d
ocum
entat
ion is
curre
nt
Marke
t Ri
sk to
the f
isher
y fro
m lac
k of m
arke
t dem
and
Medi
um
2a, 2
b 2a
(iii)
2b(i)
Inf
rastr
uctur
e – P
ort L
incoln
Ri
sk to
the f
isher
y fro
m lac
k of in
frastr
uctur
e Me
dium
2b
2b
(iii)
Infra
struc
ture –
wes
tern E
yre P
enins
ula
Risk
to th
e fish
ery f
rom
lack o
f infra
struc
ture
High
2b
2b
(iii)
Socia
l valu
e – pu
blic a
ccep
tance
Risk
to th
e fish
ery f
rom
the la
ck of
publi
c acc
eptan
ce of
fishin
g Hi
gh
1a, 1
b, 3a
, 3b
2a
3c
4c
1a(i)
, 1a(
ii), 1a
(iii)
1b(i)
, 1b(
ii), 1b
(iii)
2a(iv
) 3a
(i), 3
a(ii),
3a(iii
) 3b
(i), 3
b(ii),
3b(iii
), 3b
(iv),
3b(v)
, 3b(
vi)
3c(i)
, 3c(i
i) 4c
(i), 4
c(ii),
4c(iii
), 4c
(v)
Gove
rnan
ce
Polic
y and
man
agem
ent –
comp
lianc
e Ri
sk to
the f
isher
y thr
ough
lack
of co
mplia
nce
High
4c
4c
(i), 4
c(ii),
4c(iii
), 4c
(v), 4
c(vi)
Lega
l fram
ewor
k – al
locati
on/O
ffsho
re C
onsti
tution
al Se
ttleme
nt Ex
plicit
alloc
ation
of re
sour
ce
Medi
um
2d
2d(i)
, 2d(
ii)
Othe
r age
ncies
–Dep
artm
ent o
f Plan
ning,
Tran
spor
t an
d Infr
astru
cture
Ri
sk to
the f
isher
y fro
m lac
k of in
frastr
uctur
e Me
dium
2b
2b
(iii)
Othe
r age
ncies
– Au
strali
an F
isher
ies M
anag
emen
t Au
thority
/DAF
F (ca
tch sh
aring
) Ri
sk to
the f
isher
y fro
m Co
mmon
wealt
h catc
hes
Medi
um
2d
2d(ii)
Othe
rs –s
ocial
licen
ce to
oper
ate
Risk
to th
e fish
ery f
rom
not h
aving
a so
cial li
cenc
e to o
pera
te Me
dium
2a
, 3b,
4c
2a(iv
) 3b
(i), 3
b(ii),
3b(iii
), 3b
(iv),
3b(v)
4c
(i)
Exter
nal fa
ctors
affec
ting t
he
perfo
rman
ce of
the f
isher
y
Ecolo
gical
impa
cts– b
iolog
ical
Risk
to th
e fish
ery f
rom
biolog
ical d
iseas
es
Medi
um
3d
3d(i)
Econ
omic
– mar
ket fo
rces/d
eman
d Ri
sk to
the f
isher
y fro
m a l
ack o
f Sou
thern
Blue
fin T
una q
uota
being
set b
y the
Com
monw
ealth
and h
igh A
ustra
lian d
ollar
Me
dium
2a
, 2b
2a(iii
) 2b
(i)
Acce
ss –
unloa
d fac
ilities
– we
st co
ast
Risk
to th
e fish
ery f
rom
a lac
k of in
frastr
uctur
e and
unloa
ding f
acilit
ies on
the
west
coas
t of E
yre P
enins
ula
High
2b
2b
(iii)

30
6 GOALS AND OBJECTIVES
Section 7 of the Act states that the objectives of the Act are to protect, manage, use and develop the aquatic resources of the State in a manner that is consistent with ESD. The Act also requires that management plans must be consistent with the Act’s objects.
The Act identifies a number of biological, social and economic factors that must be balanced in pursuing ESD; however, the principle of avoiding over-exploitation of resources and ensuring that those resources are not endangered is specified as the primary consideration.
The four key goals for the sardine fishery are set out below and are linked to the operational objectives for the fishery. PIs and reference points for each objective are provided to allow for assessment of the management plan in meeting the identified goals.
Goal 1: Maintain harvest of sardines at ecologically sustainable levels
This goal relates to the sustainability of the target stock. The operational objective of this management plan in relation to sustainability is:
• That South Australian sardine stocks are maintained at a sustainable stock status.
This objective aims to ensure that sardine resources are harvested within sustainable limits as defined by the target reference point included in the Harvest Strategy at Section 9.
The main strategies for ensuring the sustainability of the resource include spatially discrete TACCs, limited entry, gear restrictions, and the Harvest Strategy for the fishery.
Goal 2: Optimum utilisation and equitable distribution
This goal relates to the economic and social benefits derived from the fishery. Optimising the use of the fishery focuses on allowing for economic efficiency of the fishing operations. The objective of this management plan in relation to optimum utilisation is:
• An economically efficient fleet without compromising sustainability objectives.
The strategies to achieve this goal are focused on a Harvest Strategy that allows for flexible fishing operations within sustainable limits.
With regard to equitable distribution, this fishery is exclusively a commercial fishery by virtue of the limiting management arrangements. The objectives in this plan ensure access of the resource is in line with requirements under the Act. The operational objective related to resource access is:
• To provide access to the resource as per the PIRSA Allocation Policy: Allocation of Access to Fisheries Resources Between Fishing Sectors (PIRSA 2011) (hereafter referred to as the Allocation Policy).

31
Goal 3: Protect and conserve aquatic resources, habitats and ecosystems
This goal relates to the management of the fishery using an EBFM approach.
To achieve this goal, this management plan’s objectives are that:
• Fishery impacts on by-catch and by-product species are sustainable.
• Fishery impacts on TEPSs are sustainable.
• Fishery impacts on benthic habitat and associated species communities are sustainable.
Management strategies to achieve this goal include controls on fishing effort, closed areas, and promoting activities that reduce impacts of fishing activity.
Goal 4: Cost effective and consultative co-management of the fishery
The overall objectives of this goal are to ensure that stakeholders and government fisheries administration have involvement and share responsibility through consultative and, where possible, collaborative co-management3 in the decision-making processes for developing and implementing management arrangements, and to ensure that management arrangements are complied with. The cost-effectiveness of these arrangements also needs to be considered in the development process as the management costs are recovered from fishers in accordance with the government’s cost-recovery policy for fisheries (PIRSA 2013b).
The operational objectives of this management plan in relation to co-management, planning and cost-recovery are:
• Industry participation in management through co-operative arrangements.
• Management arrangements support cohesion between the fishing industry and wider community.
• Maximising stewardship of fisheries resources.
• Costs of management of the fishery are funded by relevant stakeholders.
3Consultative and collaborative co-management are two prescribed co-management levels in the Policy for the Co-Management of Fisheries in South Australia.

32
Tabl
e 6: G
oals,
obj
ectiv
es, s
trate
gies
for t
he m
anag
emen
t of t
he sa
rdin
e fish
ery.
Goal
1: M
ainta
in ec
olog
ically
sust
ainab
le sa
rdin
e bio
mas
s.
Objec
tive
Stra
tegy
Ad
dres
sing
risk
Perfo
rman
ce in
dica
tor
Desc
riptio
n Re
fere
nce P
oint
1a M
aintai
n sar
dine s
tocks
ab
ove t
he ta
rget
refer
ence
po
int by
man
aging
total
ca
tch ac
ross
the f
isher
y and
pr
even
ting t
he de
pletio
n of
large
sard
ines i
n the
Gulf
s Zo
ne
1a(i)
Set
aTAC
C for
sard
ine an
nuall
yus
ing fr
amew
ork s
et ou
t in th
e Har
vest
Stra
tegy
1a(ii)
Main
tain e
ntry a
nd ge
ar
restr
iction
s
1a(iii
) Mon
itor a
vera
ge si
ze of
ha
rveste
d sar
dines
durin
g sea
son
Austr
alian
Sar
dines
-fis
hery
impa
cts on
the t
arge
t spe
cies
– effe
ctive
ness
of
mana
geme
nt of
Austr
alian
Sa
rdine
s
Spaw
ning b
iomas
s fro
m sa
rdine
su
rvey (
or st
ock a
sses
smen
t if
asse
ssme
nt is
not c
omple
ted)
Mean
size
of sa
rdine
s
Spaw
ning b
iomas
s esti
mates
of
sard
ines i
s the
prim
ary
indica
tor of
stoc
k abu
ndan
ce in
the
sard
ine fis
hery
Mean
size
of sa
rdine
s is t
he
indica
tor to
mon
itor w
hethe
r de
pletio
n of ta
rget
size
sard
ines i
s occ
urrin
g in t
he
gulfs
syste
m
Targ
et re
feren
ce po
int –
spaw
ning s
tock b
iomas
s >1
50,00
0 t
Limit r
efere
nce p
oint –
spaw
ning
stock
biom
ass >
75,00
0 t
Refer
ence
point
– me
an si
ze of
ha
rveste
d sar
dines
> 14
5 mm
Limit r
efere
nce p
oint –
mea
n size
of
harve
sted s
ardin
es >
135 m
m
1b E
nsur
e suff
icien
t data
is
colle
cted t
o und
ertak
e a
stock
asse
ssme
nt
1b(i)
Coll
ect fi
sher
y dep
ende
nt da
ta thr
ough
comm
ercia
l logb
ooks
and
CDRs
1b(ii)
Main
tain i
ndep
ende
nt mo
nitor
ing
prog
ram
to co
llect
biolog
ical s
ample
s of
sard
ines f
or th
e dev
elopm
ent o
f size
fre
quen
cies a
nd ag
e dete
rmina
tion
1b(iii
) Und
ertak
e a D
EPM
surve
y and
sto
ck as
sess
ment
1b(iv
) Rev
iew an
d upd
ate th
e stra
tegic
rese
arch
and m
onito
ring p
lan re
gular
ly
1b(v)
Wor
k with
indu
stry,
wher
e ne
cess
ary,
to de
velop
an in
dustr
y led
re
al-tim
e size
mon
itorin
g pro
gram
Austr
alian
Sar
dines
-fis
hery
impa
cts on
the t
arge
t spe
cies
– res
earch
and d
evelo
pmen
t
Numb
ers o
f logb
ooks
and C
DRs
prov
ided
Stoc
k ass
essm
ent a
nd/or
a da
ily
egg p
rodu
ction
meth
od su
rvey i
s co
mplet
ed
Annu
al sto
ck as
sess
ment
or
fishe
ry as
sess
ment
repo
rt pu
blish
ed
All c
omme
rcial
fishe
ries
prov
ide sp
atial
and t
empo
ral
catch
and e
ffort
data
The a
ppro
priat
e pop
ulatio
n mo
del a
sses
smen
t is us
ed to
de
termi
ne th
e stoc
k stat
us
Licen
ce ho
lders
prov
ide lo
gboo
k re
cord
s for
each
fishin
g trip
CDRs
are p
rovid
ed fo
r eac
h off
-load
of ha
rveste
d sar
dines
Stoc
k ass
essm
ent s
urve
y co
mplet
ed to
mee
t crite
ria fo
r ex
ploita
tion l
evel
set in
the
Harve
st St
rateg
y(i.e.
annu
ally o
r bi-
annu
ally)
DEPM
surve
ys co
mplet
ed to
me
et cri
teria
for ex
ploita
tion l
evel
set in
the H
arve
st St
rateg
y(i.e.
an
nuall
y or b
i-ann
ually
)
Annu
al sto
ck as
sess
ment
or
fishe
ry as
sess
ment
repo
rt pu
blish
ed

33
1c Li
mit a
nd m
onito
r Au
strali
an A
ncho
vy ca
tches
1c
(i) S
et a T
ACC
for an
chov
y ann
ually
wi
thin s
ustai
nable
limits
1c(ii)
Main
tain e
ntry a
nd ge
ar
restr
iction
s
1c(iii
) Mon
itor c
atch l
evels
of ha
rveste
d an
chov
y dur
ing se
ason
1c(iv
) Ado
pt a p
reca
ution
ary p
rincip
le to
make
decis
ions w
hen r
obus
t inf
orma
tion i
s lac
king
Austr
alian
Anc
hovy
–fish
ery
impa
cts on
the t
arge
t spe
cies
– effe
ctive
ness
of
mana
geme
nt
Catch
leve
ls of
anch
ovy
Monit
or ca
tches
of A
ustra
lian
Anch
ovy a
gains
t the T
ACC
as
an in
dicato
r tha
t has
been
set
for th
e spe
cies
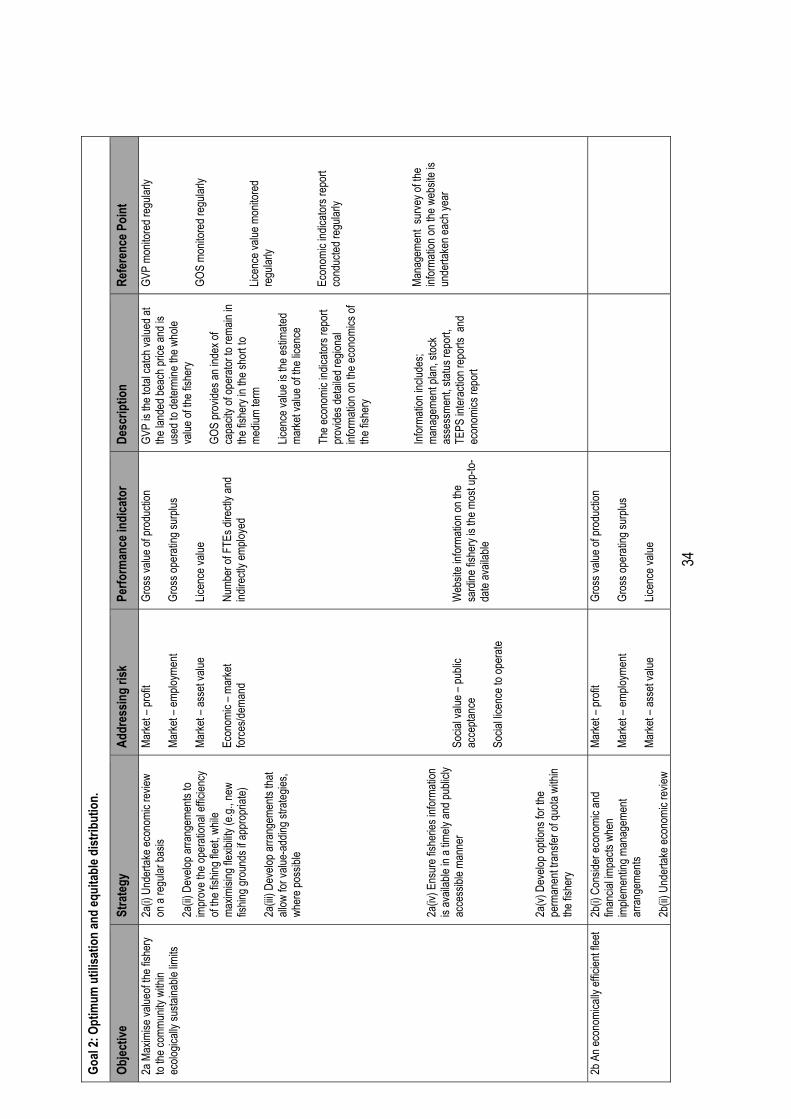
34
Goal
2: O
ptim
um u
tilisa
tion
and
equi
tabl
e dist
ribut
ion.
Objec
tive
Stra
tegy
Ad
dres
sing
risk
Perfo
rman
ce in
dica
tor
Desc
riptio
n Re
fere
nce P
oint
2a M
axim
ise va
lueof
the fis
hery
to the
comm
unity
with
in ec
ologic
ally s
ustai
nable
limits
2a(i)
Und
ertak
e eco
nomi
c rev
iew
on a
regu
lar ba
sis
2a(ii)
Dev
elop a
rrang
emen
ts to
impr
ove t
he op
erati
onal
effici
ency
of
the fis
hing f
leet, w
hile
maxim
ising
flexib
ility (
e.g., n
ew
fishin
g gro
unds
if ap
prop
riate)
2a(iii
) Dev
elop a
rrang
emen
ts tha
t all
ow fo
r valu
e-ad
ding s
trateg
ies,
wher
e pos
sible
2a(iv
) Ens
ure f
isher
ies in
forma
tion
is av
ailab
le in
a tim
ely an
d pub
licly
acce
ssibl
e man
ner
2a(v)
Dev
elop o
ption
s for
the
perm
anen
t tran
sfer o
f quo
ta wi
thin
the fis
hery
Marke
t –pr
ofit
Marke
t – em
ploym
ent
Marke
t – as
set v
alue
Econ
omic
– mar
ket
force
s/dem
and
Socia
l valu
e – pu
blic
acce
ptanc
e
Socia
l lice
nce t
o ope
rate
Gros
s valu
e of p
rodu
ction
Gros
s ope
ratin
g sur
plus
Licen
ce va
lue
Numb
er of
FTE
s dire
ctly a
nd
indire
ctly e
mploy
ed
Web
site i
nform
ation
on th
e sa
rdine
fishe
ry is
the m
ost u
p-to-
date
avail
able
GVP
is the
total
catch
value
d at
the la
nded
beac
h pric
e and
is
used
to de
termi
ne th
e who
le va
lue of
the f
isher
y
GOS
prov
ides a
n ind
ex of
ca
pacit
y of o
pera
tor to
rema
in in
the fis
hery
in the
shor
t to
mediu
m ter
m
Licen
ce va
lue is
the e
stima
ted
marke
t valu
e of th
e lice
nce
The e
cono
mic i
ndica
tors r
epor
t pr
ovide
s deta
iled r
egion
al inf
orma
tion o
n the
econ
omics
of
the fis
hery
Infor
matio
n inc
ludes
; ma
nage
ment
plan,
stock
as
sess
ment,
statu
s rep
ort,
TEPS
inter
actio
n rep
orts
and
econ
omics
repo
rt
GVP
monit
ored
regu
larly
GOS
monit
ored
regu
larly
Licen
ce va
lue m
onito
red
regu
larly
Econ
omic
indica
tors r
epor
t co
nduc
ted re
gular
ly
Mana
geme
nt su
rvey o
f the
infor
matio
n on t
he w
ebsit
e is
unde
rtake
n eac
h yea
r
2b A
n eco
nomi
cally
effic
ient fl
eet
2b(i)
Con
sider
econ
omic
and
finan
cial im
pacts
whe
n im
pleme
nting
man
agem
ent
arra
ngem
ents
2b(ii)
Und
ertak
e eco
nomi
c rev
iew
Marke
t –pr
ofit
Marke
t – em
ploym
ent
Marke
t – as
set v
alue
Gros
s valu
e ofp
rodu
ction
Gros
s ope
ratin
g sur
plus
Licen
ce va
lue

35
on a
regu
lar ba
sis
2b(iii
) Whe
re ap
prop
riate,
and i
f po
ssibl
e, inf
luenc
e othe
r pro
cess
es
that im
pact
on in
frastr
uctur
e de
velop
ment
Infra
struc
turea
ndac
cess
to
unloa
d fac
ilities
Ec
onom
ic ind
icator
s ass
esse
d in
econ
omic
indica
tors r
epor
t
2c E
nsur
e suff
icien
t eco
nomi
c inf
orma
tion i
s use
d to m
ake
infor
med m
anag
emen
t dec
ision
s
2c(i)
Und
ertak
e eco
nomi
c sur
veys
to
acce
ss th
e eco
nomi
c pe
rform
ance
of th
e fish
ery
Rese
arch
andd
ata co
llecti
onEc
onom
ic ind
icator
s ass
esse
d in
econ
omic
indica
tors r
epor
t Th
e eco
nomi
c ind
icator
s rep
ort
prov
ides d
etaile
d reg
ional
infor
matio
n on t
he ec
onom
ics of
the
fishe
ry
The e
cono
mic i
ndica
torsr
epor
t is
publi
shed
regu
larly
2d A
lloca
te ac
cess
to th
e fish
ery
reso
urce
s and
man
age s
hare
s to
optim
ise ut
ilisati
on an
d eq
uitab
le dis
tributi
on
2d(i)
Allo
cate
acce
ss to
sard
ine
and a
ncho
vy re
sour
ce an
d co
mmer
cial, r
ecre
ation
al an
d Ab
origi
nal tr
aditio
nal fi
shing
se
ctors,
in ac
cord
ance
with
the A
ct.
2d(ii)
Mon
itor m
ortal
ity le
vels
from
other
sour
ces (
e.g.,F
isher
ies
Man
agem
ent A
ct 19
91).
Lega
l fram
ewor
k –Al
locati
on/O
ffsho
re
Cons
titutio
nal S
ettlem
ent
Revie
w of
alloc
ation
betw
een
secto
rs un
derta
ken p
eriod
ically
or
whe
n nec
essa
ry
Total
catch
in th
e sar
dine f
isher
y
Total
by-ca
tch of
Aus
tralia
n Sa
rdine
s by o
ther f
isher
ies (e
.g.,
Comm
onwe
alth S
mall P
elagic
Fis
hery)
Alloc
ation
revie
wed w
hen
appr
opria
te

36
Goal
3: P
rote
ct an
d co
nser
ve aq
uatic
reso
urce
s, ha
bita
ts an
d ec
osys
tem
s.
Objec
tive
Stra
tegy
Ad
dres
sing
risk
Perfo
rman
ce in
dica
tor
Desc
riptio
n Re
fere
nce p
oint
3a F
isher
y imp
acts
on by
-catch
sp
ecies
are m
onito
red a
nd
arra
ngem
ents
used
to lim
it fis
hery
impa
ct on
the e
cosy
stem
3a(i)
Main
tain P
art 1
3 and
13A
accre
ditati
on un
der t
he
Envir
onme
ntal P
rotec
tion a
nd
Biod
iversi
ty Co
nser
vatio
n Act
1999
3a(ii)
Main
tain i
nput
arra
ngem
ents
that c
ontro
l effo
rt an
d gea
r
3a(iii
) Mon
itor c
atche
s of b
y-catc
h sp
ecies
3a(iv
) Dev
elop a
rrang
emen
ts wh
ere n
eces
sary
to mi
nimise
the
fishe
ry im
pacts
on th
e eco
syste
m
3a(v)
Whe
re ap
prop
riate,
and i
f po
ssibl
e, inf
luenc
e othe
r pro
cess
es
that im
pact
on th
e app
licati
on of
the
EPA
(Env
ironm
ent P
rotec
tion
Autho
rity) W
ater
Qua
lity P
olicy
3a(vi
) Ens
ure f
isher
ies in
forma
tion
is av
ailab
le in
a tim
ely an
d pub
licly
acce
ssibl
e man
ner
By-p
rodu
ct an
dnon
-retai
ned
spec
ies
Ecos
ystem
effec
ts
Impa
cts on
trop
hic st
ructu
re
Socia
l valu
e – pu
blic
acce
ptanc
e
Wate
r qua
lity –
brine
disc
harg
e
Deve
lop ba
se lin
e info
rmati
on
of by
-catch
rates
Web
site i
nform
ation
on th
e sa
rdine
fishe
ry is
the m
ost u
p-to-
date
avail
able
Use t
he in
depe
nden
t mon
itorin
g pr
ogra
m to
quali
tative
ly mo
nitor
ne
t sets
for b
y-catc
h
Infor
matio
n inc
ludes
; ma
nage
ment
plan,
stock
as
sess
ment,
statu
s rep
ort, T
EPS
inter
actio
n rep
orts
and
econ
omics
repo
rt
Mana
geme
nt su
rvey o
f the
infor
matio
n on t
he w
ebsit
e is
unde
rtake
n eac
h yea
r
3b M
inimi
se fis
hery
impa
cts on
TE
PS
3b(i)
Dev
elop P
Is an
d guid
eline
s for
settin
g the
annu
al lev
el of
obse
rver c
over
age
3b(ii)
Main
tain a
repr
esen
tative
ind
epen
dent
monit
oring
prog
ram
to co
llect
infor
matio
n and
mon
itor
TEPS
inter
actio
ns
3b(iii
) Inv
estig
ate, d
evelo
p and
im
prov
e arra
ngem
ents,
whe
re
Non-
retai
ned –
TEPS
Ecos
ystem
effec
ts
Impa
cts on
trop
hic st
ructu
re
Socia
l valu
e– pu
blic
acce
ptanc
e
Monit
or w
hethe
r the
obse
rver
cove
rage
is re
pres
entat
ive of
co
mmer
cial o
pera
tions
Leve
l of in
depe
nden
t mo
nitor
ing co
mpar
ed to
targ
et lev
el
The n
umbe
r of c
ommo
n do
lphin
morta
lities
each
year
Ratio
of T
EPS
inter
actio
ns
repo
rted i
n wild
life in
terac
tion
logbo
oks c
ompa
red t
o obs
erve
r-re
porte
d inte
racti
ons
Dolph
in int
erac
tions
(tota
l fish
ery
inter
actio
ns fr
om ob
serve
d data
Incre
asing
tren
d in i
ndep
ende
ntly
monit
ored
mor
tality
rates
over

37
poss
ible,
to re
duce
TEP
S int
erac
tions
to ze
ro or
as cl
ose a
s po
ssibl
e
3b(iv
) Mon
itor T
EPS
inter
actio
ns
throu
gh w
ildlife
inter
actio
n log
book
s
3b(v)
Main
tain T
EPS
worki
ng gr
oup
3b(vi
) Ens
ure f
isher
ies in
forma
tion
is av
ailab
le in
a tim
ely an
d pub
licly
acce
ssibl
e man
ner
Indus
try’s
CoP
prov
ided t
o sk
ipper
s
Web
site i
nform
ation
on th
e sa
rdine
fishe
ry is
the m
ost u
p-to-
date
avail
able
and e
xtrap
olated
acro
ss th
e fis
hery)
Infor
matio
n inc
ludes
; ma
nage
ment
plan,
stock
as
sess
ment,
statu
s rep
ort a
nd
econ
omics
repo
rt
three
year
perio
d4
Adhe
renc
e with
indu
stry C
oP an
d re
gulat
ions
Maint
ain m
eetin
gs to
mon
itor a
nd
discu
ss T
EPS
inter
actio
ns
Monit
or le
vel o
f actu
al ob
serve
r co
vera
ge co
mpar
ed to
targ
et lev
el.
TEPS
inter
actio
n rep
orts
made
pu
blica
lly av
ailab
le
Mana
geme
nt su
rvey o
f the
infor
matio
n on t
he w
ebsit
e is
unde
rtake
n eac
h yea
r
3c Li
mit th
e fish
ery i
mpac
ts on
the
trop
hic st
ructu
re by
ma
intain
ing st
ocks
abov
e the
tar
get r
efere
nce p
oint a
nd
prev
entin
g the
deple
tion o
f larg
e sa
rdine
s in t
he G
ulfs Z
one
3c(i)
Ado
pt a p
reca
ution
ary
princ
iple t
o mak
e dec
ision
s whe
n ro
bust
infor
matio
n is l
ackin
g
3c(ii)
Main
tain a
repr
esen
tative
ind
epen
dent
monit
oring
prog
ram
to co
llect
infor
matio
n and
mon
itor
TEPS
inter
actio
ns
Impa
cts on
trop
hic st
ructu
re
Socia
l valu
e – pu
blic
acce
ptanc
e
Comm
unity
relat
ionsh
ips
Web
site i
nform
ation
on th
e sa
rdine
fishe
ry is
the m
ost u
p-to-
date
avail
able
Infor
matio
n inc
ludes
; ma
nage
ment
plan,
stock
as
sess
ment,
statu
s rep
ort a
nd
econ
omics
repo
rt
Mana
geme
nt su
rvey o
f the
infor
matio
n on t
he w
ebsit
e is
unde
rtake
n eac
h yea
r
3d M
anag
e dise
ases
to m
inimi
se
the im
pact
on th
e res
ource
s 3d
(i) W
here
appr
opria
te, an
d if
poss
ible,
influe
nce a
nd im
prov
e pr
oces
ses b
etwee
n age
ncies
re
spon
sible
for bi
osec
urity
and
natur
al re
sour
ce m
anag
emen
t
Ecolo
gical
impa
cts–b
iolog
ical
4 Any
incre
ase i
n inte
racti
on an
d mor
tality
rates
betw
een y
ears
will b
e inv
estig
ated.
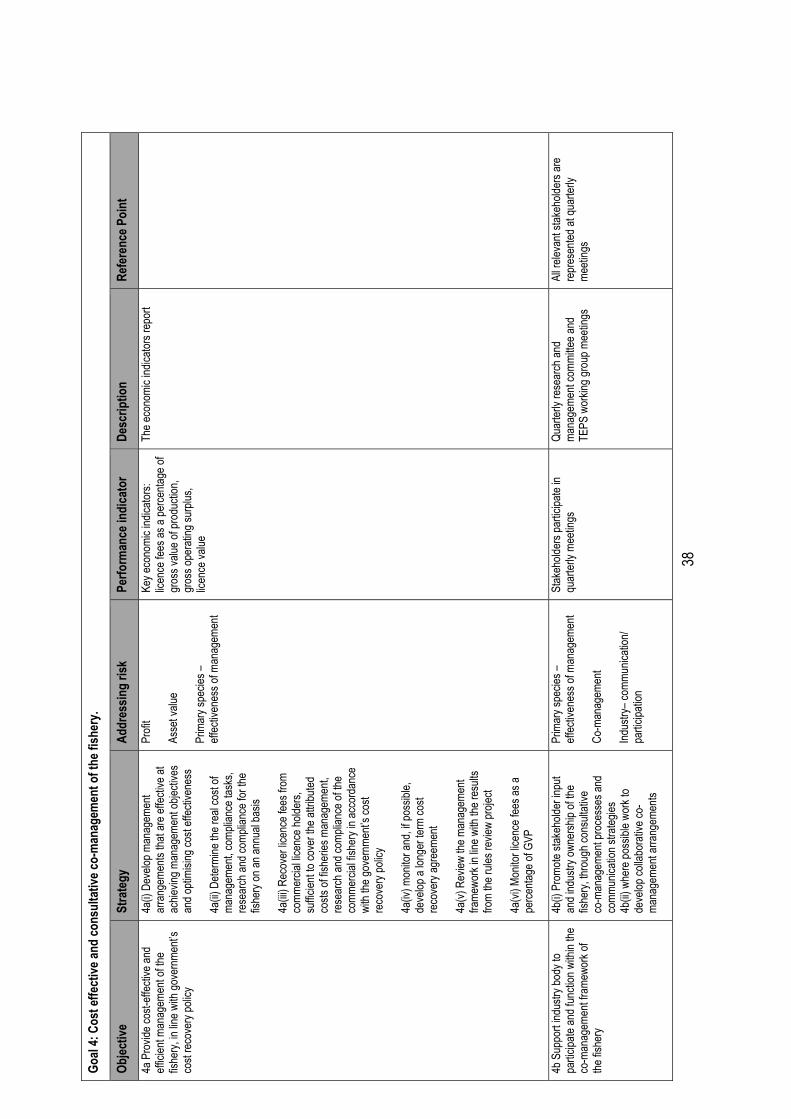
38
Goal
4: C
ost e
ffect
ive an
d co
nsul
tativ
e co-
man
agem
ent o
f the
fish
ery.
Objec
tive
Stra
tegy
Ad
dres
sing
risk
Perfo
rman
ce in
dica
tor
Desc
riptio
n Re
fere
nce P
oint
4a P
rovid
e cos
t-effe
ctive
and
effici
ent m
anag
emen
t of th
e fis
hery,
in lin
e with
gove
rnme
nt’s
cost
reco
very
polic
y
4a(i)
Dev
elop m
anag
emen
t ar
rang
emen
ts tha
t are
effec
tive a
t ac
hievin
g man
agem
ent o
bjecti
ves
and o
ptimi
sing c
ost e
ffecti
vene
ss
4a(ii)
Dete
rmine
the r
eal c
ost o
f ma
nage
ment,
comp
lianc
e tas
ks,
rese
arch
and c
ompli
ance
for t
he
fishe
ry on
an an
nual
basis
4a(iii
) Rec
over
licen
ce fe
es fr
om
comm
ercia
l lice
nce h
older
s, su
fficien
t to co
ver t
he at
tribute
d co
sts of
fishe
ries m
anag
emen
t, re
sear
ch an
d com
plian
ce of
the
comm
ercia
l fish
ery i
n acc
orda
nce
with
the go
vern
ment’
s cos
t re
cove
ry po
licy
4a(iv
) mon
itor a
nd, if
poss
ible,
deve
lop a
longe
r ter
m co
st re
cove
ry ag
reem
ent
4a(v)
Rev
iew th
e man
agem
ent
frame
work
in lin
e with
the r
esult
s fro
m the
rules
revie
w pr
oject
4a(vi
) Mon
itor li
cenc
e fee
s as a
pe
rcenta
ge of
GVP
Profi
t
Asse
t valu
e
Prim
ary s
pecie
s –
effec
tiven
ess o
f man
agem
ent
Key e
cono
mic i
ndica
tors:
licen
ce fe
es as
a pe
rcenta
ge of
gr
oss v
alue o
f pro
ducti
on,
gros
s ope
ratin
g sur
plus,
licen
ce va
lue
The e
cono
mic i
ndica
tors r
epor
t
4b S
uppo
rt ind
ustry
body
to
partic
ipate
and f
uncti
on w
ithin
the
co-m
anag
emen
t fram
ewor
k of
the fis
hery
4b(i)
Pro
mote
stake
holde
r inpu
t an
d ind
ustry
owne
rship
of the
fis
hery,
thro
ugh c
onsu
ltativ
e co
-man
agem
ent p
roce
sses
and
comm
unica
tion s
trateg
ies
4b(ii)
whe
re po
ssibl
e wor
k to
deve
lop co
llabo
rativ
e co-
mana
geme
nt ar
rang
emen
ts
Prim
ary s
pecie
s –eff
ectiv
enes
s of m
anag
emen
t
Co-m
anag
emen
t
Indus
try– c
ommu
nicati
on/
partic
ipatio
n
Stak
ehold
ers p
artic
ipate
in qu
arter
ly me
eting
s
Quar
terly
rese
arch
and
mana
geme
nt co
mmitte
e and
TE
PS w
orkin
g gro
up m
eetin
gs
All re
levan
t stak
ehold
ers a
re
repr
esen
ted at
quar
terly
meeti
ngs

39
4b(iii
) Ens
ure f
isher
ies in
forma
tion
is av
ailab
le in
a tim
ely an
d pub
licly
acce
ssibl
e
4b(iv
) Atte
nd in
dustr
y qua
rterly
me
eting
s and
prom
ote st
akeh
older
att
enda
nce
W
ebsit
e info
rmati
on on
the
sard
ine fis
hery
is the
mos
t up-
to-da
te av
ailab
le
Infor
matio
n inc
ludes
; ma
nage
ment
plan,
stock
as
sess
ment,
statu
s rep
ort, T
EPS
inter
actio
n rep
orts
and
econ
omics
repo
rt
Mana
geme
nt su
rvey o
f the
infor
matio
n on t
he w
ebsit
e is
unde
rtake
n eac
h yea
r
4c E
ffecti
ve co
mplia
nce p
rogr
am
for th
e fish
ery
4c(i)
Und
ertak
e ann
ual c
ompli
ance
ris
k ass
essm
ent a
nd ad
dres
s tho
se
risks
4c(ii)
Rev
iew ex
isting
repo
rting a
nd
monit
oring
arra
ngem
ents
wher
e ne
cess
ary,
includ
ing a
revie
w of
weigh
t esti
mates
at of
f-load
4c(iii
) Dev
elop a
nd im
pleme
nt ma
nage
ment
arra
ngem
ents
that
are c
lear a
nd un
comp
licate
d to
prom
ote vo
luntar
y com
plian
ce an
d as
sist w
ith su
cces
sful e
nforce
ment
4c(iv
) Whe
re po
ssibl
e, de
velop
and
imple
ment
licen
sing,
comp
lianc
e an
d mon
itorin
g arra
ngem
ents
that
are c
onsis
tent w
ith ot
her f
isher
ies
to re
duce
admi
nistra
tive c
osts
4c(v)
Enc
oura
ge th
e com
munit
y an
d ind
ustry
to re
port
fishe
ries
offen
ces t
o Fish
watch
.
4c(vi
) Dev
elop f
orma
l relat
ionsh
ips
betw
een i
ndus
try an
d fish
eries
off
icers
to im
prov
e effe
ctive
co
mplia
nce
Prim
ary s
pecie
s –ma
nage
ment
effec
tiven
ess
Comp
lianc
e – qu
ota in
tegrity
Socia
l valu
e – pu
blic
acce
ptanc
e
Socia
l lice
nce t
o ope
rate
Quota
use r
epor
ted th
roug
hout
the se
ason
Fishe
ries o
fficer
s to p
artic
ipate
in ind
ustry
mee
tings
Numb
er of
pros
ecuti
ons
relat
ed to
the s
ardin
e fish
ery
Deve
lop ef
fectiv
e meth
odolo
gy
for w
eight
estim
ates a
t unlo
ad
Comp
lianc
e risk
asse
ssme
nt un
derta
ken
Quota
use i
s mon
itore
d by
PIRS
A thr
ough
CDR
form
retur
ns
Whe
re ne
cess
ary,
fishe
ries
office
rs pa
rticipa
te in
quar
terly
meeti
ngs
Quota
use r
epor
ted th
roug
hout
the se
ason
Whe
re ne
cess
ary,
fishe
ries
office
rs to
partic
ipate
in ind
ustry
me
eting
s
Numb
er of
pros
ecuti
ons o
ver
three
year
s doe
s not
incre
ase
signif
icantl
y
Comp
lianc
e risk
asse
ssme
nt un
derta
ken a
nnua
lly
Imple
ment
a stan
dard
ised
proc
ess f
or es
timati
ng w
eights
at
unloa
d

40
7 CO-MANAGEMENT ARRANGEMENTS
Co-management is an arrangement whereby responsibilities and obligations for sustainable fisheries management are negotiated, shared and delegated at appropriate levels between government, the commercial fishing industry, recreational fishers, Aboriginal traditional fishers, and other key stakeholders such as conservation groups (Neville 2008). Co-management is recognised as comprising various levels – starting from centralised government regulation with no industry input at one end to more autonomous management by industry groups and key stakeholders at the other, where government plays more of an audit role. It is designed to achieve efficient regulatory practice (among many other things) and is by no means a way of industry or other key stakeholders avoiding regulatory scrutiny and influence.
PIRSA has adopted a Policy for the Co-Management of Fisheries in South Australia (PIRSA 2013b) (hereafter referred to as the Policy for the Co-management of Fisheries) to inform discussion with the wider commercial fishing industry and other stakeholder groups as to how best to promote and implement co-management.
The policy proposes that implementation of a preferred co-management model should be through a phased approach that allows industry and key stakeholders to build their capacity over time and a government audit process to measure performance and success.
SASIA has been recognised by PIRSA as the peak representative industry body for the commercial sardine fishery. Whilst the Minister has oversight of the management of the fishery under this management plan, day-to-day management is conducted by PIRSA in consultation with SASIA.
Consultative co-management arrangements have been established in the sardine fishery, where PIRSA administers fisheries legislation and makes decisions on fisheries management through consultative processes with fishers and other key stakeholders. Fisheries management decisions are discussed and debated through SASIA.
SASIA holds regular meetings with PIRSA Fisheries and Aquaculture and SARDI Aquatic Sciences to discuss research and management issues in the fishery. SASIA has established the Threatened, Endangered and Protected Species Working Group to provide advice on management of the industry’s TEPS code of conduct and the Independent Observer Program. Membership of the working group includes sardine fishery licence holders, PIRSA, SARDI and the Department of Environment, Water and Natural Resources.
Under this management plan, the responsibility for reporting on and taking action in regard to issues such as breaching reference points in the Harvest Strategy rules lie with both SASIA and PIRSA.
Opportunities to improve the co-management arrangements for the sardine fishery will continue to be pursued in accordance with the principles provided in the Policy for the Co-management of Fisheries.

41
8 ALLOCATION OF ACCESS BETWEEN SECTORS
8.1 Current allocated shares of the resource
The Act provides that a management plan must specify the share of the fishery to be allocated to each fishing sector under the plan (43(2)(h)).
The Act also provides that, in determining the share of aquatic resources to be allocated to a particular fishing sector under the first management plan for an existing fishery, the share of aquatic resources to which that fishing sector had access at the time the Minister requested preparation of the plan (based on the most recent information available to the Minister) must be taken into account (43(3)).
The Minister formally requested preparation of this management plan on 17 June 2010. Therefore, this plan must take into account the share of the sardine fishery that the commercial fishing sector had access to on that date. Allocations for the recreational and Aboriginal traditional fishing sectors must be determined at the same time.
The Offshore Constitutional Settlement agreement between South Australia and the Commonwealth of Australia sets out that sardines are managed by South Australia. Any allocation discussed in this management plan refers to South Australian fishing sectors only.
Sardine and anchovy TACCs are allocated 100 per cent to the commercial sector, reflecting the shares of the resource between the three sectors at the time the Minister requested the preparation of the plan. The most recent recreational fishing survey highlighted that the recreational sector does not take sardines or anchovies. Likewise, there is no record of these species being taken by Aboriginal fishers and there have been no claims relating to sardines and anchovies in the Native Title claims that relate to South Australia.
It should be noted that this allocation of resource shares does not prohibit the recreational or Aboriginal traditional take of these species. In the future, if either of the non-commercial sectors increases their take of Australian Sardine or Australian Anchovy, the allocation of shares may be reviewed, as set out in Section 8.4.
The shares allocated to each sector in relation to the sardine fishery are set out in Table 7. Sardine and anchovy have not been allocated in the MSF management plan as the sardine net is the only registered device on a MSF licence that has the ability to catch these species.
Species Commercial % Recreational % Aboriginal traditional %
Australian Sardines 100.0 0.0 0.0
Australian Anchovy 100.0 0.0 0.0
Table 7: Shares of sardine fishery allocated to each fishing sector.

42
8.2 Information for adjusting allocations of access in future
Catch data used to allocate shares has been collected through commercial logbooks submitted in accordance with the regulations. Recreational data is set out in the report of the Recreational Fishing Survey 2007-08 (Jones 2009).
Access to South Australia’s fisheries resources by Aboriginal communities under the Act will be provided through Aboriginal traditional fishing management plans. These plans may be developed when an ILUA, agreed to resolve a Native Title claim, is in place in relation to a Native Title claim area. The State is currently engaged in ILUA negotiations with Native Title claimants and other stakeholder groups, including the fishing industry. The agreements arising from these negotiation processes will inform the way that access to fisheries resources by Aboriginal communities is defined and implemented. Aboriginal traditional fishing under the Act only relates to fishing agreed through the ILUA process. Aboriginal people are also recreational fishers outside of these arrangements.
8.3 Allocation triggers
An important component of the allocation of shares is monitoring to identify a change in the relative value of those shares over time. The value of shares can be measured in a variety of ways, including catch and effort, economic value and social values. Measuring the social values of a fishery is an evolving area of natural resource management and there are no clearly identifiable indicators of social value that can be readily incorporated into an assessment of share value at this point in time. For these reasons, catch will be used as the indicator to measure changes in the value of shares (catch has been used to determine the first shares in this management plan). Catch estimates are available annually for all commercial fisheries. Estimates of recreational catches will be available at a minimum of once every five years from recreational fishing surveys.
Without recreational catch data it is not possible to undertake an accurate assessment of all sector allocations in years when recreational survey data is unavailable. Therefore, comprehensive reviews of all sector allocations will only be undertaken in years for which recreational catch information is available.
Due to sardines being 100% allocated to the commercial sector, there are no allocation triggers described in this management plan. Allocation triggers are usually set at a level commensurate with the initial allocation, allowing for variability in catches. Where a sector has been allocated over 91%, no trigger limit has been set as any shares greater than this amount are considered to be within normal fluctuation ranges. More details on the trigger limit calculations are available in the MSF management plan5.
8.4 Review of allocations of access in future
The Act requires that each management plan, in addition to allocating shares, outlines the framework for adjusting shares in the future. Specifically, Section 43(2)(i) and (j) provide that a management plan must:
5http://www.pir.sa.gov.au/fisheries/commercial_fishing/fisheries_management/management_plan

43
• Prescribe a method, or establish an open and transparent process for determining the method, for adjusting allocations of aquatic resources between the different fishing sectors during the term of the plan, or
• Provide that compensation will be paid to persons whose licences or licence entitlements are compulsorily acquired in order to reduce the share of aquatic resources allocated to the commercial fishing sector and increase the share allocated to another sector.
Allocation of access to Australian Sardine and Australian Anchovy stocks is unlikely to change in the future, given the physical and regulatory limitations to taking sardines and anchovies for non-commercial fishing. Nevertheless, allocations between sectors may be reviewed in accordance with PIRSA’s Allocation Policy under the following scenarios:
• A review of the management plan, which will reassess the appropriateness of shares and may trigger an adjustment.
• One or more sectors exceed their allocation of Australian Sardine or Australian Anchovy.
• A major change in the management of a species and/or a sector that results in a shift of allocations to a sector(s).
The declaration of a Marine Protected Area that would result in a reallocation of shares would be given effect through the Marine Parks Act 2007 and policies applying under that Act. That Act provides that compensation may be paid to licensed fishers affected by the closure of an area or restrictions of activities within a marine park.
The process to review allocations under the scenarios described above will be in two stages. The first stage is an initial assessment to determine whether a full assessment (the second stage) is necessary or appropriate.
8.4.1 Initial assessment
The initial assessment will be conducted by PIRSA in consultation with the relevant sectors of the fishery. Once the need for a review has been recognised, an assessment committee will be established. The committee will be required to assess the need for a second-stage assessment based on the following:
• Whether there has been a shift in the access value of the fishery or there is new information available that suggests a reallocation of shares would bring additional social and economic benefits to the State.
• A trigger limit6 has been breached, and whether that breach can be readily explained and justified.
• Whether the potential change in shares is significant and considered long-term as a minor shift/anomaly may not require a full review.
A written report will be prepared by the committee to PIRSA, with a recommendation to proceed to a full evaluation or not. PIRSA will determine whether to move to a full evaluation or may refer a recommendation to the Minister. 6Trigger limits are not described in this management plan as the resources are 100 per cent allocated to a sector. Recreational triggers will be described within their respective management plans.

44
8.4.2 Full assessment
As with the initial assessment, a full assessment of allocation will be conducted by PIRSA in consultation with relevant stakeholders. An evaluation panel will be established with membership including independent experts as required.
The evaluation panel must evaluate how the value of one or more sectors is changing and the likely trends in the future. In the context of these changes, all options being considered should be evaluated against the option of maintaining the status quo and the potential flow-on effects with regard to:
• contribution to gross state product
• contribution to employment
• access to fresh seafood for consumers
• maintenance, growth and wellbeing of regional communities
• health impacts
• sport and recreation opportunities
• consistency with tourism policies
• other criteria relevant to the fishery.
8.4.3 Assessment outcomes
Following the full assessment, the Allocation Policy provides that the review panel may recommend to the Minister one of two actions, to:
1. Manage each sector within the existing allocated shares.
2. Proceed to adjust shares.
8.4.4 Process for adjusting allocations
Adjustments to the shares will, in the first instance, be implemented through a voluntary process and through direct negotiations between the relevant sectors. Where possible, market mechanisms will be used to adjust shares. Where there are no or limited market mechanisms available, adjustments to shares will be made in a similar manner used to manage shares within existing allocations.
Adjusting commercial shares within the sardine fishery is likely to be achieved through a variety of controls consistent with current management arrangements. If required, managing adjustments of recreational shares would likely require consideration of current management arrangements.
If agreement cannot be reached, a process of compulsory acquisition may occur in accordance with the Allocation Policy, and acquisition of entitlements will be compensated in accordance with the provisions of the policy. Adjustments are to be finalised within two years.

45
9 HARVEST STRATEGY
9.1 Introduction
Harvest strategies offer an effective fisheries management tool to integrate the ecological, social and economic dimensions of fisheries management into a single framework for fisheries management decision making (Sloan et al. 2014).
Essential components of the Sardine Harvest Strategy are: • A monitoring strategy for collection of data to estimate performance of the sardine fishery.
• A process for conducting assessments of the status of the sardine fishery relative to the objectives.
• Decision rules that control the level of exploitation of sardines according to the status of the sardine fishery and relative to target and limit reference points.
• Decision rules that control the spatial distribution of the catch.
• A process for periodic review.
This harvest strategy includes a set of decision rules that provide for fixed exploitation rates to allow for removal of a fixed fraction of the stock during a set period (normally annually).
Consistent with the National Guidelines to Develop Fishery Harvest Strategies (Sloan et al. 2014), the Sardine Harvest Strategy is defined as a framework that sets out the management actions necessary, using fixed exploitation rates and maintaining biomass above agreed levels, to control the exploitation of sardines in order to achieve the ecological, economic and social objectives of the sardine fishery.
9.2 Objectives
The Sardine Harvest Strategy aims to achieve the following objectives, to: • Maintain the sardine spawning biomass at a sustainable stock status, as defined in section 9.6.
• Optimise economic returns within these sustainability imperatives.
• Provide greater certainty and stability for industry stakeholders.
• Establish a simple and practical guide for fishery managers, researchers and industry stakeholders.
• Ensure cost-effectiveness of management.
The Sardine Harvest Strategy is designed to support the ecologically sustainable management of the sardine fishing industry. The framework allows for harvesting of sardines at ecologically sustainable levels through TACCs that are set based on catching a conservative percentage (exploitation rate) of the estimated SpB. The exploitation rate can vary depending on the level of monitoring and the

46
assessment that is undertaken (see the decision rules at section 9.9). As with the Commonwealth Small Pelagic Fishery7, the three-tiered approach of the Sardine Harvest Strategy aims to achieve a balance between risk associated with various levels of exploitation (TACCs) with the information provided by the monitoring and assessment program. It is recognised that the costs for monitoring and assessment increase as the level of exploitation moves up from Tier 3 to Tier 1.
Key design principles of the Sardine Harvest Strategy include: • Exploitation limits that do not exceed 25 per cent, which historical data from the fishery
suggests is a conservative approach that takes into account the ecological importance of sardines.
• Stock status is explicitly linked with SpB estimates.
9.3 Species
The Sardine Harvest Strategy only applies to the primary target species, Australian Sardine (S. sagax). Although the Australian Anchovy (E. australis) is also targeted in the sardine fishery, the level of exploitation is considered to be set at a precautionary catch level. Should expansion of anchovy fishing operations occur in the future, there is the potential to develop a Harvest Strategy for the anchovy fishery that is conceptually similar to the Sardine Harvest Strategy, with appropriate levels of research.
9.4 Assessment method
The primary biological PI for the Sardine Harvest Strategy is calculation of the SpB using the daily egg production method (DEPM )(Lasker 1985). The DEPM is recognised internationally as a practical and cost-effective method for estimating the SpB of small pelagic fishes (Stratoudakis et al. 2006, Ward et al. 2011a). Using the most recent SpB value, the recommended TACC for the sardine fishery is determined as a proportion of the SpB (exploitation rate) within sustainable limits. Although SpB estimates derived from the DEPM are considered accurate, they can be relatively imprecise, mainly due to uncertainties associated with estimation of total daily egg production (Fletcher et al. 1996, McGarvey and Kinloch 2001, Ward et al. 2001a, Gaughan et al. 2004, Stratoudakis et al. 2006). Imprecision of the DEPM was partly addressed in the previous Harvest Strategy by establishing a conservative baseline TACC over a relatively wide SpB target range. The same approach has been carried over to the new Sardine Harvest Strategy, in conjunction with the tiered framework. The development of methods to improve the precision of SpB estimates has been identified as a research and management priority, including the use of a continuous underway fish egg sampler, which is used routinely in surveys of S. sagax off California (Lo et al. 2001).
Supporting the DEPM assessment is a sardine fishery stock assessment, which synthesises updated information relevant to the sardine fishery, assesses the status of the stock, and comments on the management arrangements from a biological perspective.
Despite concerns regarding the precision of DEPM-derived SpB estimates, the DEPM is considered the best technique available to assess the status of the sardine fishery. A recently developed age-
7http://www.afma.gov.au/wp-content/uploads/2013/04/Small-Pelagic-Fishery-Harvest-Strategy.pdf

47
structured population model is also used to inform the status of the stock by producing SpB estimates, but uncertainty regarding natural mortality rates, recruitment variability and biases in the age samples mean the DEPM survey is preferred (Ward et al. 2005) as the primary indicator. In years when there is no DEPM survey completed, the stock assessment model results are used to inform the status of the stock.
The recently developed age-structured model revealed that, among a number of changes that could be made to improve precision, DEPM-derived SpB estimates are likely to be conservative relative to the actual SpB (Ward et al. 2010a).
9.5 Previous strategies
The first Harvest Strategy is contained in the 2005 management plan for the fishery (Shanks 2005), and the second Harvest Strategy was implemented in 2007 as an addendum to the 2005 management plan. Each Harvest Strategy reflects progressive understanding of the biology, movement and spatial structure of South Australian sardine stocks (Ward et al. 2010a, Ward et al. 2011a, Ward et al. 2011b, Izzo et al. 2012), their importance to ecosystem health (Goldsworthy et al. 2011, Smith et al. 2011), and changes in strategic direction and development of the sardine fishing industry.
The first DEPM survey was conducted in 1995 and the resulting SpB estimates were used from 1998 onwards to inform the TACC. Starting with a maximum exploitation rate of 10 per cent, over time the exploitation rate was slowly increased before the implementation of the first Harvest Strategy.
The first Harvest Strategy recommended maintaining the harvest of sardines within exploitation rate limits of 10 per cent to 17.5 per cent. The actual TACC recommendation was dependent on the magnitude of the SpB (where stepwise increases in exploitation rate were possible with increasing SpB) and the proportion of 2- and 3-year-old age classes in the population (>40% indicated high levels of egg production, thus allowing the TACC to be recommended at a slightly higher exploitation rate than if the proportion was ≤40%).
The second Harvest Strategy established that a precautionary baseline TACC of 30,000 t be maintained, while the latest SpB estimate remained between 150,000 and 300,000 t, corresponding to exploitation rates of 20 per cent and 10 per cent respectively. The reason for this addendum to the first Harvest Strategy was to provide industry with greater certainty and stability, and thereby allow fishing operations and the supply of sardines (mainly as feed for the Southern Bluefin Tuna aquaculture sector) to be planned with confidence.

48
This, the third Harvest Strategy, adopts the same approach of the second Harvest Strategy in maintaining a baseline TACC within a target range of SpB estimates. However, it builds upon the second Harvest Strategy with the introduction of two new features:
1. A tiered Harvest Strategy framework.
2. Rules for spatial management of the catch.
9.6 Reference points
As the SpB estimate is the primary biological PI for the sardine fishery, the following SpB reference points have been established to explicitly link SpB estimates with stock status:
1. If the SpB is greater than the target reference point (TRP) of 150,000 t, the sardine fishery is considered to be ‘sustainable’.
2. If the SpB is less than or equal to the TRP of 150,000 t but greater than the limit reference point (LRP) of 75,000 t, the sardine fishery is considered to be ‘transitional’.
3. If the SpB is less than or equal to the LRP of 75,000 t, the sardine fishery is considered to be ‘overfished’.
The TRP of 150,000 t has been selected because historically the stock has been shown to be stable above this level and has quickly recovered from below this biomass level (Ward et al. 2012). Secondly in consideration of ecosystem impacts, impacts would be relatively minor on ecologically dependant species (such as marine mammals and seabirds) at this level (Goldsworthy et al. 2013).
The LRP has been selected as 0.5 TRP and the stock has been shown to recover twice from mass mortality events that drove the fishery to an estimated biomass lower than 75,000 t. In these instances, the fishery recovered from this level relatively quickly. This has provided the evidence that the LRP has been set at a conservative level.
The maximum exploitation rate of 25 per cent has been developed from examining historical exploitation rates in the fishery. These have ranged from 12 per cent to 28 per cent since 2002 and only once exceeded 25 per cent. In this particular year, the following two years had the highest SpB estimates on record.
The stock status categories used in the Sardine Harvest Strategy are consistent with the national Harvest Strategy framework, described in Table 7.
In 1995 and 1998 the sardine fishery has thought to have been in the overfished category due to an outbreak of Herpes-like virus of unknown origin (Ward et al. 2001b), which killed approximately 70 per cent of the SpB in South Australian waters (Ward et al. 2001b). In both of these instances, fishing levels and/ or poor management were not the causes of the fishery being in the overfished category.

49
Stock status category
Description
Sustainable Stock for which biomass (or biomass proxy) is at a level sufficient to ensure that, on average, future levels of recruitment are adequate (i.e. not recruitment overfished) and for which fishing pressure is adequately controlled to avoid the stock becoming recruitment overfished
Transitional Recovering stock – biomass is recruitment overfished, but management measures are in place to promote stock recovery, and recovery is occurring, OR
Deteriorating stock – biomass is not yet recruitment overfished, but fishing pressure is too high and moving the stock in the direction of becoming recruitment overfished
Overfished Stock is recruitment overfished, and current management is not adequate to recover the stock; or adequate management measures have been put in place but have not yet resulted in measureable improvements
Table 7: Descriptions for the stock status categories used in the Sardine Harvest Strategy.
9.7 Spatial management
Conservative exploitation rates are important for preventing ecosystem effects but may not be sufficient when fishing is highly concentrated in a small part of total area occupied by the stock. Because of the inherent difficulties and high costs of establishing strong evidence for the depletion of adult small pelagic species and high levels of community concerns about fisheries that fish for low trophic level species, a precautionary approach should be adopted to address potential ecological impacts. This approach is consistent with the ‘World’s Best Practice’ adopted by Commission for the Conservation of Antarctic Marine Living Resources, where a range of precautionary management arrangements, including conservative exploitation rates and spatial management, have been established to prevent ecological impacts from depleting the food sources of seabirds and marine mammals, even in the absence of evidence that such effects have actually occurred.
Ecosystem and trophic impacts from possible depletion of adult sardines in Spencer Gulf due to the increased prevalence of juveniles in southern Spencer Gulf catches were first raised as concerns in 2004 and 2005 (Goldsworthy et al. 2011). There was a downward trend in sardine size from 2002 to 2012 in the area of Spencer Gulf (within the ‘Gulfs Zone’) (Figure 13). The average sardine size increased substantially in 2013 in that zone.
To protect southern Spencer Gulf from depletion of target-sized fish and adverse impacts on the ecosystem, this Harvest Strategy establishes a spatial management framework for the sardine fishery. During the development of these spatial management arrangements, various options were considered by industry, management and researchers to manage the depletion of adult-sized sardines. The options included both exploitation rate and sardine size as proxies, capping catch from high effort areas, move-on rules, and spatial and temporal closures. Sardine size as a proxy for the depletion of adult-sized sardines was considered the most practical option, having the least social and economic impact.

50
This Harvest Strategy formally defines two zones in the sardine fishery – the Gulfs Zone (GZ) and the Outside Zone (OZ) (see Figure 12).
• Gulfs Zone (GZ) covers the waters adjacent to South Australia, east of the meridian of longitude 135°37ʹ30”E (extending south from near Cape Carnot, Eyre Peninsula) and north of latitude 35°52ʹ00”S (extending to Kangaroo Island, in the vicinity of Vennachar Point). Then north of a line between Penneshaw, Kangaroo Island and Cape Jervis, Fleurieu Peninsula; enclosing the gulf waters (see Figure 12).
• Outside Zone (OZ) covers the waters adjacent to South Australia, excluding the GZ (see Figure 12).
Under this spatial management framework, no more than 30,000 t of sardines will be taken from the GZ in any single quota period (fishing season). Furthermore, where there is evidence of reductions in the mean size of fish taken from the GZ, the maximum catch will be reduced even further (i.e., to 27,000 or 24,000 t depending on the mean size of fish taken in the previous quota period).
Figure 12: The two spatial management zones for the Sardine Harvest Strategy. Abbreviations: OZ, Outside Zone; GZ, Gulfs Zone.
9.8 Monitoring
Under the previous Harvest Strategy, the SpB estimate was provided every two years (with a stock assessment of the sardine fishery undertaken in alternate years), provided that the previous SpB estimate remained above 150,000 t. The previous Harvest Strategy operated over a two-year cycle, with the DEPM survey being undertaken and a fishery assessment report delivered in the first year, and the SpB report delivered in the second year.

51
Under this Harvest Strategy, the monitoring requirements for each tier level are as follows: • Tier 3: biennial stock assessment and biennial fishery survey (alternating each year), as per the
previous Harvest Strategy.
• Tier 2: biennial stock assessment and an annual fishery survey.
• Tier 1: annual stock assessment and annual fishery survey.
For the purpose of implementing this Harvest Strategy for the first time, the sardine fishery is currently considered at Tier 3.
Whilst the SpB estimate is currently the primary source of information for recommending the TACC, the mean size of sardines in the catch has been identified as the appropriate basis for determining the spatial distribution of the catch because it appears to reflect the abundance of adult sardines in southern Spencer Gulf.
The mean length of sardines obtained from fishery dependent samples over 2010-12 was lower than the long-term mean (Figure 13). It is unclear whether this reduction in size was attributed to reduced growth rates resulting from adverse environmental conditions, changes in size-based distribution or movement patterns, or the concentration of fishing effort in Spencer Gulf, or a combination of factors. This Harvest Strategy uses information on the mean size of sardines in catches to spatially manage the distribution of catch in the following season, as outlined in the decision rules section (Section 9.9).
Figure 13:Average fork length (FL) of sardines in catches from the Gulfs Zone by year (2013 is a partial data set) with the catch allocation decision reference points shown as solid lines.

52
9.9
Dec
isio
n ru
les
9.9.
1 H
arve
st d
ecis
ion
rule
s
Once
the S
pB es
timate
has b
een c
alcula
ted a
nd st
ock s
tatus
assig
ned,
the co
rresp
ondin
g har
vest
decis
ion ru
les th
at gu
ide th
e app
ropr
iate l
evels
of ex
ploita
tion
(and
ther
efore
the T
ACC)
acro
ss th
e thr
ee tie
rs ca
n be c
onsid
ered
.
The d
ecisi
on ru
les ar
e pro
vided
in th
e har
vest
decis
ion ta
ble (T
able
8), w
hich o
utline
s the
relat
ionsh
ip be
twee
n SpB
, stoc
k stat
us, le
vel o
f exp
loitat
ion an
d TAC
C re
comm
enda
tions
inclu
ding t
he fr
eque
ncy o
f fish
ery s
urve
ys an
d ass
essm
ents.
Figu
re 14
grap
hicall
y rep
rese
nts th
e TAC
C se
tting d
ecisi
on ru
les.
Tabl
e 8: H
arve
st d
ecisi
on ta
ble f
or th
e Sar
dine
Har
vest
Stra
tegy
to g
uide
leve
ls of
expl
oita
tion
(and
TAC
C) an
d fre
quen
cy o
f sur
veys
and
asse
ssm
ent f
or ea
ch ti
er fo
llowi
ng th
e m
ost r
ecen
t spa
wnin
g bi
omas
s (Sp
B) es
timat
e. Ab
brev
iatio
ns: T
RP, t
arge
t ref
eren
ce p
oint
; LRP
, lim
it re
fere
nce p
oint
.
TACC
(t)
Max
imum
Ex
ploi
tatio
nDE
PM Su
rvey
Stoc
k As
sess
men
tTA
CC (t
)M
axim
um
Expl
oita
tion
DEPM
Su
rvey
Stoc
k As
sess
men
tTA
CC (t
)M
axim
um
Expl
oita
tion
DEPM
Su
rvey
Stoc
k As
sess
men
t
1900
00 t
<Sp
B> T
RPSu
stai
nabl
e47
,500
t25
%An
nual
Annu
al42
,750
t22
.5%
Annu
alBi
enni
el38
,000
t20
%Bi
enni
elBi
enni
el
1700
00 t
<Sp
B≤ 1
9000
0 t
> TRP
Sust
aina
ble
42,5
00 t
25%
Annu
alAn
nual
38,2
50 t
22.5
%An
nual
Bien
niel
34,0
00 t
20%
Bien
niel
Bien
niel
1500
00 t
<Sp
B≤ 1
7000
0 t
> TRP
Sust
aina
ble
37,5
00 t
25%
Annu
alAn
nual
33,7
50 t
22.5
%An
nual
Bien
niel
30,0
00 t
20%
Bien
niel
Bien
niel
1000
00 t
<Sp
B≤ 1
5000
0 t
LRP
- TRP
Tran
sitio
nal
20%
of S
pB20
%An
nual
Annu
al17
.5%
of S
pB17
.5%
Annu
alBi
enni
el15
% o
f SpB
15%
Bien
niel
Bien
niel
75,0
00 t
<Sp
B≤ 1
0000
0 t
LRP
- TRP
Tran
sitio
nal
15%
of S
pB15
%An
nual
Annu
al12
.5%
of S
pB12
.5%
Annu
alBi
enni
el10
% o
f SpB
10%
Bien
niel
Bien
niel
SpB
≤ 750
00 t
< LRP
Over
fishe
dCl
osed
0%An
nual
Annu
alCl
osed
0%An
nual
Bien
niel
Clos
ed0%
Bien
niel
Bien
niel
Spaw
ning
Bio
mas
sRe
fere
nce
Poin
tsSt
ock S
tatu
sTi
er 1
Tier
2Ti
er 3

53
Figure 14:The relationship between spawning biomass, stock status and level of exploitation (or TACC) of the Sardine Harvest Strategy for each tier (abbreviations: LRP:limit reference point; TRP: target reference point).
9.9.2 Catch allocation decision rules
Once the TACC has been determined using the harvest decision rules, the maximum catch to come from the GZ will be determined on the basis of the mean size of the catch from the GZ reported by SARDI for the period up to 30 June. These decision rules have been implemented to prevent the depletion of target size fish and maximise catches of optimal-sized sardines from the GZ.
Mean sizes and total catch limits are set out in the catch limit decision (Table 9), but in the calculation of mean sizes, certain data requirements must be met (as agreed to by the SASIA Research and Management Committee).
No more than 30,000 t should be taken from the GZ in any one quota period, and if the mean size of sardines falls below 142 mm no more than 27,000 t can be taken from the GZ in the following season.
If the mean size of sardines falls below 135 mm in the GZ in any one quota period, no more than 24,000 t can be taken from the GZ in the following season.

54
Mean size of sardines (MSS) in GZ Maximum catch
limits for GZ 142 mm < MSS 30,000 t
135 mm < MSS ≤ 142 mm 27,000 t
MSS ≤ 135 mm 24,000 t
Table 9: Catch allocation decision table for the Sardine Harvest Strategy to guide the maximum catch allowed from the GZ.
Fifty per cent of sardines are sexually mature at 139 mm (males) and 145 mm (females) (Ward et al. 2010a). The midway point between the two sizes was used as the reference point at which maximum catch limit in the GZ is reduced from 30,000 t to 27,000 t. The point at which the maximum catch limit in the GZ is reduced from 27,000 t to 24,000 t was selected as at this size the number of fish taken from the stock substantially increases.
On occasions where the TACC is reduced below the SpB TRP, the SASIA Research and Management Committee will be required to assess the most recent information regarding sardine egg distribution and size of fish to make a decision about the allocation of catch.
9.10 Meta-rules
In addition to the monitoring requirements and harvest decision rules, the following meta-rules apply for the Sardine Harvest Strategy:
1. Where a recommended increase in TACC requires moving up to a higher tier, a stepwise increase can only occur one tier at a time; i.e., stepping up from Tier 3 to Tier 2 and from Tier 2 to Tier 1 is permitted, but not from Tier 3 to Tier 1 (in contrast, there are no such restrictions when moving down to a lower tier).
2. Where a recommendation to move up a tier level has occurred under this Harvest Strategy, the TACC recommendation can be based on that corresponding tier level.
3. In moving from Tier 3 to Tier 2, the industry commits to a minimum of three DEPM surveys over three years to closely monitor any changes in SpB after changing the maximum exploitation rate. Stock assessments will be undertaken biennially at this tier level.
4. In moving from Tier 2 to Tier 1, the industry must commit to a minimum of three stock assessments in three years; and during this time DEPM surveys will be undertaken annually.
5. Where a recommended increase in TACC requires moving up to a higher tier for the first time under this Harvest Strategy, annual SpB estimates will be obtained for three years as soon as practicable after moving up to the higher tier (with the aim of developing options for reducing frequency of SpB estimates/reports thereafter, depending on the latest SpB estimate and risk).
6. If there is clear scientific evidence that the primary biological PI (estimate of SpB) used in the harvest decision rule (Section 9.9.1) is underestimated in any one year and is not accurate (due to logistical problems with the completion of the survey, the lack of sampled survey stations, problems with the analysis of survey samples or environmental anomalies), the minimum SpB for

55
each exploitation level (and TACC) provided by Table 8 may be up to 10 per cent lower. This rule may only be invoked when there is suitable scientific justification and there is support from industry, scientists and management to do so.
9.11 Decision-making process
One of the key roles of SASIA’s Research and Management Committee is to apply the Sardine Harvest Strategy with respect to the latest SpB estimate (and other biological information) provided by SARDI to develop TACC advice for PIRSA Fisheries and Aquaculture. The committee meet quarterly, with one of these meetings scheduled to occur around October for the purpose of providing advice on the TACC.
At the October Research and Management Committee meeting, SpB estimates and the mean size of sardines will be presented by SARDI for application of the decision rules, prior to recommendations being made by the Research and Management Committee.
Recommendations should fall within the decision rules outlined in this Harvest Strategy, or the Research and Management Committee should clearly justify the reasoning behind the recommendation.
Estimates of SpB are calculated from annual or biennial surveys and stock assessments, using the most up-to-date biological and catch and effort data. The allocation of the TACC to the two spatial management zones (GZ and OS) is determined by the mean size of sardines. This data will be collected from 1 January to 30 June (at a minimum) and will be presented by SARDI.
The industry based data collection and monitoring program will support the SARDI data collection program and will be used to undertake real-time monitoring of the mean size of sardines.
Upon receiving the Research and Management Committee’s recommendation and advice (through the PIRSA Fisheries Manager), the Minister or his/her delegate will consider this advice before making a formal TACC determination. Licence holders and the Executive Officer of SASIA will be notified of the TACC determination as soon as possible before the start of the next quota period commencing 1 January.
9.12 Examples
Example 1
If the sardine SpB was determined at 189,000 t, the fishery status would be ‘Sustainable’. Under these circumstances, the TACC would be calculated using a maximum exploitation rate of 22.5 per cent under Tier 2 and can be set at up to 38,250 t. At the Tier 2 level, DEPM surveys will be undertaken annually and stock assessments biennially (Table 8).
If the mean size of sardines was calculated at 146 mm, the maximum catch that could be taken from the GZ would be 30,000 t. Therefore, the TACC would be recommended at 38,250 t with an allocation of 30,000 t to the GZ and 8,250 t to the OZ.

56
Example 2
If the sardine SpB was determined at 96,000 t, the fishery status would be classified as transitional and is either in the recovering status (having been recruitment overfished and recovering) or depleting status (stock is heading towards being recruitment overfished, see Table 7). Under these circumstances, the TACC would be calculated using a maximum exploitation rate of 12.5 per cent under Tier 2 (12,000 t) with annual DEPM surveys and biennial stock assessments (Table 8) or, alternatively, the TACC could be calculated using a maximum exploitation rate of 10 per cent under Tier 3 (9600 t) with biennial surveys and stock assessments (Table 8).
If the mean size of sardines was calculated at 137 mm, the maximum catch that could be taken from the GZ would be 27,000 t, leaving the remainder of the TACC to be taken from the OZ. Due to the fishery being assessed as below the TRP, SASIA’s Research and Management Committee will be required to assess the most recent information in making this recommendation.
9.13 Review
Following implementation of this Harvest Strategy, PIRSA Fisheries and Aquaculture in partnership with SASIA’s Research and Management Committee will monitor its performance every 12 months. Should new information, or any other reason, suggest that modification(s) to the Sardine Harvest Strategy may be necessary, SASIA’s Research and Management Committee may recommend to PIRSA Fisheries and Aquaculture that a review of the Harvest Strategy be undertaken as soon as practicable.
A review of the catch allocation decision rule (Section 9.9.2) is planned to commence in 2016, after the completion of the Seafood CRC project titled ‘Optimising the size and quality of sardines through real-time harvest monitoring’, project number 2013/746. The review will analyse the most recent and available information to determine whether the rule can be amended to better address the issue of the depletion of target-sized sardines and/or reduce its economic and social impact on the fishing industry, while achieving the required objectives. The review will also consider whether an industry driven research project proposal to improve the real-time collection, analysis and monitoring of sardine sizes (proxy indicator for the depletion of adult-sized sardines) across the fishery can be used to improve the decision rule.

57
10 OTHER FISHING
10.1 Marine Scalefish Fishing
Sardine fishers are licenced to fish with a sardine net (the registered device) through a MSF licence, with an allocation of quota endorsed on the licence. Fishers can use this licence to fish in the MSF, under the Fisheries Management (MSF) Regulations. This includes arrangements about licence amalgamation and owner-operator conditions. For more information please refer to the MSF management plan (PIRSA 2013a).
10.2 Recreational fishing sector
Recreational fishing for Australian Sardines has historically been negligible, but as fishers are permitted to use hand nets, recreational catches will be monitored.
10.3 Aboriginal traditional fishing sector
There is no recorded Indigenous fishing for Australian Sardines in South Australia.
10.4 Exploratory and developmental fishing
Applications for exploratory and developmental fishing for species that are not part of this fishery will be dealt with under the Fisheries Management (Miscellaneous Developmental Fishery) Regulations 2013 and the associated regulatory framework.
Exploratory and developmental fishing for species that are part of this fishery are dealt with by issuing either a permit or an exemption under the Act, depending on the activity. Applications will be considered on a case-by-case basis and will be guided by the objectives and principles in this management plan.

58
11 STOCK ASSESSMENT AND RESEARCH
11.1 Research services
PIRSA Fisheries and Aquaculture contracts research services for each fishery. SARDI Aquatic Sciences is currently the primary research provider for core research for the sardine fishery. Costs of the annual research program for the fishery are recovered through licence fees.
External funding sources, such as the Fisheries Research and Development Corporation (FRDC), and universities also provide funding for specific research projects. The fishery contributes to the FRDC through an annual levy base, also collected through licence fees.
11.2 Data collection and analysis
To achieve the research and monitoring needs for the fishery, a variety of data is collected and analysed. These come from two main sources – fishery independent data and fishery dependent data.
11.2.1 Fishery independent data
Fishery independent data is collected through two processes – DEPM surveys and the Independent Observer Program.
The DEPM survey is the main data source for the stock assessment and has been used to estimate the SpB of sardines in South Australia since 1995. The central tenet of the DEPM is that SpB can be calculated by dividing the mean number of pelagic eggs produced per day throughout the spawning area (that is, total daily egg production) by the mean number of eggs produced per unit mass of adult fish (Ward et al. 2009). Currently the survey is conducted biennially but the Harvest Strategy allows for the survey to be conducted annually, which could increase the available TACC depending on stock assessment results.
The observer program was implemented in November 2004 to monitor TEPS interactions. Initially run by SARDI Aquatic Sciences, the program was taken over by Protec Marine Pty Ltd in 2006.
11.2.2 Fishery dependent data
Fishery dependent data consists of commercial catch and effort logbooks data, wildlife interaction logbook data, and industry biological sampling.
Fishers are required to complete fishery logbooks that document the date, location and timing of each net-set, the weight of each catch, and details of interactions with TEPS. Since 2007, fishers have also been required to complete wildlife interaction forms, which are validated, stored and collated by SARDI Aquatic Sciences (as seen in Tsolos and Boyle 2013).
In late October 2011, SASIA initiated a data collection and monitoring program to collect and collate real-time TEPS interaction information, and (in January 2012) to collect sardine size data in order to improve the transparency of industry reporting.This data is in addition to information collected through logbooks and the observer program. It is being used to reduce any

59
discrepancies between data sets by providing ongoing and timely feedback of the industry’s performance, while highlighting areas for improvement. SASIA is also looking to understand spatial and temporal sardine movements through the collation of size information.
11.2.3 Reporting
SARDI Aquatic Sciences has assessed the status of the stock of Australian Sardine off South Australia since 1998, and has provided scientific advice to PIRSA Fisheries and Aquaculture to assist with the management of the fishery. This involves biennial SpB and stock assessment reports in alternate years. These reports summarise information about the fishery, assess the status of the stock, and provide comments on future management and research needs (Ward et al. 2012). All SARDI reports are available on their publications webpage.
11.3 Strategic research plan
In addition to the core stock assessment work that informs periodic decision-making in the fishery, additional research projects are also undertaken to meet longer-term fishery objectives or to underpin the development of strategies under this plan.
This research plan is reviewed and updated annually by the SASIA Research and Management Committee.

60
12 COMPLIANCE AND MONITORING
12.1 Objectives
PIRSA Fisheries and Aquaculture runs a compliance program that has dual objectives: 1. To maximise voluntary compliance with fisheries rules.8
2. To create effective deterrence to breaching fisheries rules.
These objectives are consistent with the National Fisheries Compliance Policy.9
PIRSA maximises voluntary compliance by ensuring that fishers are aware of the rules that apply to their fishing activities, that they understand the rules and the purpose of those rules, and that they operate in a culture of compliance.
PIRSA creates effective deterrence through the presence of fisheries officers and the visibility of compliance operations, as well as through detection and prosecution of illegal activity10.
12.2 Planning
PIRSA Fisheries and Aquaculture compliance programs are developed through a three-year planning cycle, which is designed to ensure that compliance programs:
1. Support the fisheries management objectives for each fishery.
2. Identify compliance risks in each fishery.
3. Respond to key risks within each three-year period.
4. Have an appropriate mix of tools designed to maximise voluntary compliance and create effective deterrence.
5. Establish benchmarks against which to measure responses to risks.
Compliance plans are developed each year for the sardine fishery based on the results of a risk assessment. This includes forecasts for the following two years.
12.2.1 Risk assessment
A risk assessment is undertaken every year for each fishery. A major risk assessment is undertaken periodically (approximately every three years) or is triggered by a major change in management arrangements. In intervening years that risk assessment is updated.
8 Rules include regulations, licence conditions, closure notices or any other enforceable instrument under the Fisheries Management Act 2007. 9 The Australian Fisheries National Compliance Strategy 2010-15 was developed by the National Fisheries Compliance Committee and outlines the objectives that Australian fisheries agencies will pursue to achieve an optimal level of compliance and to create effective deterrence to illegal fishing activity. 10 Prosecution may include the issuing of a formal caution or an expiation notice, in addition to prosecution through the courts.

61
The risk assessment identifies and prioritises the compliance risks of the fishery according to the likelihood and consequence of the risk occurring. This risk assessment is used to inform annual compliance planning processes.
The first risk assessment for the sardine fishery under this management plan is scheduled for 2014, prior to the commencement of the cost-recovery cycle in October 2014.
The risk assessment process involves key stakeholders and is designed to identify the key potential risks to the fishery. The key risks identified in the sardine fishery at present are:
1. The entrapment of TEPS and the non-reporting of TEPS interactions.
2. Lack of quota integrity through unregulated catch weighing procedures.
3. Quota evasion through under-declaring weights, especially during at-sea unloads.
12.2.2 Responses and benchmarks
Compliance activities are planned to respond to the risks identified in the fishery, with an emphasis on the most serious risks. Responses must include measures aimed at both maximising voluntary compliance and creating effective deterrence.
PIRSA establishes benchmarks against which to measure compliance activities and to guide the allocation of resources in compliance planning.
12.3 Compliance status report
Each year a report is to be prepared assessing the compliance status of the sardine fishery during the previous year. This report will:
1. Describe the compliance risks (and their attributes) impacting the fishery during the previous year.
2. Describe the actions undertaken to address each risk and the outcomes achieved.
3. Describe the mitigation strategy in place to address each risk.
4. Identify risk reduction options for future consideration.
The report will be prepared and made available to the sardine fishery industry members following completion of each financial year. PIRSA will meet with key representatives of the sardine fishery and discuss the contents of the report prior to consulting with the fishery on the proposed compliance risk assessment and associated compliance program for the following year.

62
13 REGULATORY ARRANGEMENTS
This section outlines the licensing arrangements in place under the Act, the Fisheries Management (General) Regulations 2007 (hereafter referred to as the Fisheries Management (General) Regulations) and the Fisheries Management (MSF) Regulations.
A review of the rules across all fisheries was undertaken in 2011 and 2012. The project identified a number of rules that needed more comprehensive review during the life of this management plan. These included, but were not limited to:
• Allowing the permanent transfer of quota;
• The ministerial exemption for boats fishing in Port Lincoln and Coffin Bay be moved from ministerial exemption to regulation (see Section 13.2.2);
• The exemption for boats under 7.5 m not to have a vessel monitoring system unit onboard be moved from ministerial exemption to regulation;
• A standard number of registered masters be permitted, in relation to quota-managed fisheries;
• Changing the number of agents allowed;
• Allow for the move to electronic logbooks;
• Review the required information for prior reporting and simplify/amend where possible and/or necessary;
• Discussion about increasing over catch provisions; and
• Standardising the process for calculating unload weights.
In relation to licences, the Minister reserves the right to amend licence conditions and entitlements for the MSF if required to meet the ESD objects of the Act and/or in this plan through the term of the plan.
• In addition, PIRSA Fisheries and Aquaculture has undertaken a review of the rules and regulations under the Act (the Rules Review) in order to standardise and simplify rules imposed across all fisheries. The Minister reserves the right to amend licence conditions and entitlements as a result of the outcomes of the Rules Review.
13.1 Licensing
13.1.1 Issue of licences
Access to the sardine fishery is provided through a licence for the MSF with a sardine net endorsement. The fishery is a limited-entry fishery, which means that no new licences will be created and the number of licences with sardine net endorsements is capped at 14. MSF licences have been issued for a period of 10 years under the MSF management plan. For more information please refer to the MSF management plan (PIRSA 2013a).

63
13.1.2 Transferability
MSF licences may be transferred provided the transfer is a family transfer or is an authorised transfer under the Licence Amalgamation Scheme11. All licence transfers are governed by the Fisheries Management (MSF) Regulations. For more information please refer to the MSF management plan (PIRSA 2013a).
The sardine net endorsements are not transferable.
13.1.3 Registered masters
A registered vessel must be in the charge of a master who is registered on the licence. The master must meet ‘fit and proper person’ requirements in order to be registered.
13.1.4 Registered boats
A boat may only fish commercially if it is registered on a licence. A licence holder can apply to register a maximum of two boats on a single licence.
13.1.5 Registered devices
The sardine net is a registered device on the MSF licence that gives access to the fishery. These devices cannot be transferred between licences. The Fisheries Management (General) Regulations describe a sardine net (meaning a purse seine net) that meets all of the following requirements:
(a) is no more than 1,000 m in length
(b) is no more than 200 m in depth
(c) has a minimum mesh size of 14 mm
(d) has a maximum mesh size of 22 mm
At the time of writing, PIRSA has started a review of fishing gear types across all its fisheries. During this process, the regulated dimensions of a sardine net will be reviewed.
11 The licence amalgamation scheme for the Marine Scalefish Fishery is set out in the Fisheries Management (MSF) Regulations.

64
13.2 Current management arrangements
The commercial fishery is managed using a mix of input controls aimed at matching harvesting capacity with resource availability and promoting stock recovery (Table 10).
Table 10: Management arrangements for the sardine fishery for the 2012 fishing season.
Management tool Current restriction
Permitted species Sardinops sagax and Engraulis australis
Quota year 1 January to 31 December
Licensing year 1 July to 30 June
Limited entry 14 licences
Licence transferability Permitted
Corporate ownership Permitted
Closed areas Yes
Method of capture Purse seine
Quota scheme (ITQ) Yes
Total allowable commercial catch 32,000 t
Quota transferability (in quota year) Yes
Maximum number of boats 2
Total number of nets 2 per licence
Maximum vessel length None
Maximum vessel power None
Vessel monitoring system (VMS) Operational vessel monitoring system units required on all vessels while fishing with a sardine net.
Monitoring tool Requirement
Catch and effort data Daily logbook submitted monthly
Catch disposal records Daily records submitted upon landing
Prior landing reports 1 hour before unloading to registered premises
2 hours before unloading to a boat

65
13.2.1 Quota management system
The fishery is managed primarily by an ITQ management regime, with complementary input controls to restrict interactions with non-target species.
The annual TACC for the fishery is divided equally amongst the licence holders. The individual allocations of quota are endorsed on licences at the beginning of the calendar year and are valid for that year. In-season transferring of quota can occur but there is currently no provision to permanently transfer quota. This arrangement has recently been identified as needing review and has been identified in this plan’s goals and objectives (see Strategy 4a(v)).
PIRSA Fisheries and Aquaculture monitors the catch of quota in the fishery through CDR forms, which require recordings of all landings of sardines. These forms are used to verify the volumes of sardines landed, with licence holders required to complete and forward the CDR form to PIRSA Fisheries and Aquaculture.
In addition to completing the CDR form, each licence holder is required to complete a daily logbook (periodic return), with one record per net set. Information contained in the research logbook is used to enhance research assessments by SARDI.
Since 2010, the sardine fishery has used spatial management arrangements to control the maximum catch from traditional fishing areas and to try to develop grounds outside these traditional areas. In 2013 the spatial management arrangements were amended to better represent the sardine stock with changing environmental conditions.
13.2.2 Netting closures
Regulation 7(b) and Schedule 7 of the Fisheries Management (General) Regulations prohibit the use of fish nets in the waters of or near Coffin Bay and Port Lincoln. The term ‘fish net’ is defined as any net other than a hand net (including dab net, dip net or shrimp net), hoop net, drop net or a prawn net. These netting closures were introduced in May 1995 under the Fisheries (General) Regulations 1984 and included prohibiting fish nets (including sardine nets) in these areas to help protect and manage a variety of MSF species. In September and December 1995, PIRSA issued ministerial exemptions to the sardine fishers to enable them to fish in the Coffin Bay and Port Lincoln netting closures, in line with their previous access. Since 1995, ministerial exemptions have been issued from time to time to allow some operators to target sardines in these closure areas, inline with their access prior to 1995.
Under this management plan it is proposed that the Fisheries Management (General) Regulations will be reviewed to allow access to these areas for fishing with a sardine net instead of through the ministerial exemption process.
13.3 Fish processing
The Act and the Fisheries Management (Fish Processor) Regulations 2007 set out the requirements for registration as a fish processor. Fish processors that receive sardines or anchovies in South Australia are subject to those regulations, including the requirement to be registered as a fish processor.

66
Sardines can be unloaded at sea directly to tuna holding cages or to another boat under Fisheries Management (MSF) Regulations under certain circumstances and reporting arrangements, with the required registration.
Written records must be maintained for each consignment or batch of sardines received. All records must be maintained at the related premises for a period of at least 12 months after the product is received.
14 REVIEW OF PLAN
According to section 49 of the Act a review of this management plan may be conducted at any time. A full comprehensive review will be conducted as soon as practicable after the fifth anniversary of the commencement of the management plan, for the purpose of determining whether the plan should be amended, replaced or reinstated without amendment.

67
15 RESOURCES REQUIRED TO IMPLEMENT THE PLAN
15.1 Cost-recovery overview
South Australian commercial fisheries operate in accordance with the government’s cost-recovery policy (PIRSA 2013c) which provides that the costs attributed to the management of the commercial fishery are recovered from industry. Therefore, the costs of policy development, research and compliance programs are fully cost-recovered through legislated licence fees. The commercial fishing industry, through its representative bodies, has a high level of involvement in structuring the relevant policy, compliance and research programs in partnership with PIRSA Fisheries and Aquaculture and its service providers. This is an important facet of co-management in South Australia.
The annual schedule for cost-recovery in relation to commercial fisheries includes the key dates as described below.
Date Activity Parties
October Review long-term objectives for fishery and update if necessary. Identify priority outcomes for upcoming financial year.
PIRSA and industry association
November Develop policy, research and compliance work programs. PIRSA
December/ January
Consult relevant industry associations in relation to proposed programs. Industry associations to consult with wider industry.
PIRSA and industry association
February Formal meeting with industry associations to finalise work programs. PIRSA and industry association
March-May Finalise costs. Submit proposed licence fees to Cabinet. Amend regulations to prescribe new fees.
PIRSA and government agencies
June Invoices sent for licence fees. PIRSA
15.1.1 Cost-recovery – Sardine fishery
A simple formula applies for licence fees in the sardine fishery– a standard fee per licence is calculated each year by dividing the total management costs by the number of sardine nets registered on MSF licences (currently 14 registered sardine net devices in the fishery). If the fishery moves to the permanent transfer of quota units, this licence fee calculation will need to be reviewed and may be allocated on the number of units held by each licence holder.

68
16 REFERENCES
Australian Fisheries Management Authority 2009, Small Pelagic Fishery Harvest Strategy. Australian Fisheries Management Authority.
Dimmlich, WF, Breed, WG, Geddes, M and Ward, TM 2004,‘Relative importance of gulf and shelf waters for spawning and recruitment of Australian anchovy, Engraulis australis, in South Australia’, Fisheries Oceanography, 13 (5), pp.310-323.
Dimmlich, WF, Ward, TM and Breed, WG 2009,‘Spawning dynamics and biomass estimates of an anchovy Engraulis australis population in contrasting gulf and shelf environments’, Journal of Fish Biology, 75, pp.1560-1576.
Econsearch 2012, Economic Indicators for the South Australian Sardine Fishery 2010/11: report prepared for Primary Industries and Regions South Australia, Econsearch Pty. Ltd., June.
Fletcher, WJ, Lo, NCH, Hayes, EA, Tregonning, RJ and Blight, SJ 1996, ‘Use of the daily egg production method to estimate the stock size of Western Australian sardines (Sardinops sagax)’, Marine and Freshwater Research, 47, pp. 819-825.
Fletcher, WJ, Chesson, J, Fisher, M, Sainsbury, KJ, Hundloe, T, Smith, ADM and Whitworth, B 2002, National ESD reporting framework for Australian fisheries: the ‘how to’ guide for wild capture fisheries, FRDC Project 2000/145, Fisheries Research and Development Corporation, Canberra.
Gaughan, DJ, Leary, TI, Mitchell, RW and Wright, IW 2004,‘A sudden collapse in distribution of Pacific sardine (Sardinops sagax) off south-western Australia enables an objective re-assessment of biomass estimates’, Fishery Bulletin, 102, pp. 617-633.
Goldsworthy, SD, Page, B, Rogers, P and Ward, T 2011, Establishing ecosystem-based management for the South Australian Sardine Fishery: developing ecological performance indicators and reference points to assess the need for ecological allocations: final report to the Fisheries Research and Development Corporation, SARDI publication no. F2010/000863-1,SARDI Research Report Series no. 529, South Australian Research and Development Institution (Aquatic Sciences), Adelaide.
Goldsworthy, SD, Page, B, Rogers, PJ, Bulman, C, Wiebkin, A, McLeay, LJ, Einoder, L, Baylis, AMM, Braley, M, Caines, R, Daly, K, Huveneers, C, Peters, K, Lowther, AD and Ward, TM2013,‘Trophodynamics of the eastern Great Australian Bight ecosystem: ecological change associated with the growth of Australia’s largest fishery’, Ecological Modelling, 255, pp. 38-57.
Hamer, DJ, Ivey, A and Ward, TM 2009, Operational interactions of the South Australian Sardine Fishery with the Common Dolphin: November 2004 to March 2009, SARDI Aquatic Sciences publication no. F2007/001098-2, SARDI Report Series no. 354, South Australian Research and Development Institute (Aquatic Sciences), Adelaide.
Izzo, C, Gillanders, BM and Ward, TM 2012, Movement patterns and stock structure of Australian sardine (Sardinops sagax) off South Australia and the East Coast: implications for future stock assessment and management,SARDI publication no. F2011/000487-1, SARDI Research Report Series no. 611, FRDC Project no. 2009/021, final report to the Fisheries Research and

69
Development Corporation, South Australian Research and Development Institute (Aquatic Sciences), Adelaide.
Jones, K 2009, South Australian Recreational Fishing Survey,South Australian Fisheries Management Series paper no. 54, Primary Industries and Regions South Australia (Fisheries and Aquaculture), Adelaide.
Lasker, R (ed.) 1985, An egg production method for estimating spawning biomass of pelagic fish: application to northern anchovy, Engraulis mordax, NOAA Technical Report NMFS, 36, US Department of Commerce (National Oceanic and Atmospheric Administration), USA.
Lo, NCH, Hunter, JR and Charter, R 2001,‘Use of a continuous underway fish egg sampler for ichthyoplankton surveys: application to the estimation of daily egg production of Pacific sardine (Sardinops sagax) off California’,Fishery Bulletin, 99, pp. 554-571.
Mackie, DW 1995, A management plan for the experimental pilchard fishery,South Australian Fisheries Management Series paper no. 13.
McGarvey, Rand Kinloch, MA 2001,‘An analysis of the sensitivity of stock biomass estimates derived from the daily egg production method (DEPM) to uncertainty in egg mortality rates’, Fisheries Research, 49, pp. 303-307.
Neville, P 2008, Co-management: managing Australia’s fisheries through partnership and delegation: report of the Fisheries Research and Development Corporation‘s National Working Group on the Fisheries Co-management Initiative Project no. 2006/068.
PIRSA 2011, Allocation policy: allocation of access to fisheries resources between fishing sectors, Primary Industries and Regions South Australia (Fisheries and Aquaculture), Adelaide.
PIRSA 2013a, Management plan for the South Australian Commercial Marine Scalefish Fishery, South Australian Fisheries Management Series, Primary Industries and Regions South Australia (Fisheries and Aquaculture), Adelaide.
PIRSA 2013b, Policy for the co-management of fisheries in South Australia, Primary Industries and Regions South Australia (Fisheries and Aquaculture), Adelaide.
PIRSA 2013c, Primary Industries and Regions South Australia cost-recovery policy, Primary Industries and Regions South Australia (Fisheries and Aquaculture), Adelaide.
PIRSA in prep., ESD risk assessment of South Australia’s Sardine Fishery, Primary Industries and Regions South Australia (Fisheries and Aquaculture), Adelaide.
Shanks, S 2005, Management Plan for the South Australian Pilchard Fishery, South Australian Government paper no. 47, South Australian Fisheries Management Series, Primary Industries and Regions South Australia (Fisheries and Aquaculture), Adelaide.
Sloan, SR, Smith, ADM, Gardner, C, Crosthwaite, K, Triantafillos, L, Jeffries, B and Kimber, N 2014, National Guidelines to Develop Fishery Harvest Strategies,Fisheries Research and Development Corporation Report Project 2010/061.
Smith, AD, Brown, CJ, Bulman, CM, Fulton, EA, Johnson, P, Kaplan, IC, Lozano-Montes, H, Mackinson, S, Marzloff, M, Shannon, LJ, Shin, YJ and Tam, J 2011,‘Impacts of fishing low-trophic level species on marine ecosystems’, Science, 333, pp.1147-1150.

70
Stratoudakis, Y, Bernal, M, Ganias, K and Uriate, A 2006,‘The daily egg production method: recent advances, current applications and future challenges’, Fish and Fisheries, 7, pp. 35-57.
Tsolos, A and Boyle, M 2013, Interactions with threatened, endangered or protected species in South Australian managed fisheries – 2009/10, 2010/11, and 2011/12: report to PIRSA Fisheries and Aquaculture,SARDI publication no. F2009/000544-3, SARDI Research Report Series no. 682, South Australian Research and Development Institute (Aquatic Sciences), Adelaide.
Ward, TM, Hoedt, F, McLeay, LJ, Dimmlich, WF, Jackson, G, Rogers, PJ and Jones, K 2001a,‘Have recent mass mortalities of the sardine Sardinops sagax facilitated an expansion in the distribution and abundance of the anchovy Engraulis australis in South Australia?’, Marine Ecology Progress series 220, pp. 241-251.
Ward, TM, Hoedt, FE, McLeay, LJ, Dimmlich, WF, Kinloch, MW, Jackson, G, McGarvey, R, Rogers, PJ, and Jones, K 2001b,‘Effects of the 1995 and 1998 mass mortalities on the spawning biomass of Sardinops sagax in South Australia’, Journal of Marine Science, 58(4), pp. 830-841.
Ward, TM, Rogers, PA, Stephenson, P, Schmarr, DW, Strong, N and McLeay, LJ 2005,Implementation of an age structured stock assessment model for sardine (Sardinops sagax) in South Australia: report to the Fisheries Research and Development Corporation, Project 2000/125, South Australian Research and Development Institute (Aquatic Sciences), Adelaide.
Ward, TM, Rogers, PA, McLeay, LJ and McGarvey, R 2009,‘Evaluating the use of the daily egg production method for stock assessment of blue mackerel, Scomber australasicus’, Journal of Marine and Freshwater Research, 60, pp.112-128.
Ward, TM, Burch, P and Ivey, AR 2010a, South Australian Sardine (Sardinops sagax) Fishery: stock assessment report 2010, SARDI publication no. F2007/000765-3, SARDI Research Report Series no.496, South Australian Research and Development Institute (Aquatic Sciences), Adelaide.
Ward, TM, Ivey, AR, Hamer, DJ and Burch, P 2010b, Effectiveness of an industry code of practice in mitigating the operational interactions of the South Australian Sardine Fishery with the short-beaked common dolphin (Delphinus delphinus), SARDI publication no. F2010/000726-1, SARDI Research Report Series no. 493, South Australian Research and Development Institute (Aquatic Sciences), Adelaide.
Ward, TM, Burch, P, McLeay, LJ and Ivey, AR 2011a,‘Use of the daily egg production method for stock assessment of sardine, Sardinops sagax: lessons learnt over a decade of application off southern Australia’, Reviews in Fisheries Science, 19, pp. 1-20.
Ward, TM, Ivey, AR and Burch, P 2011b,Spawning biomass of sardine, Sardinops sagax, in waters off South Australia in 2011, SARDI Aquatic Sciences publication no. F2007/000566-4,SARDI Research Report Series no. 584, South Australian Research and Development Institute (Aquatic Sciences), Adelaide.
Ward, TM, Burch, P and Ivey, AR 2012, South Australian Sardine (Sardinops sagax) Fishery: stock assessment report 2012, SARDI publication no. F2007/000765-4,SARDI Research Report Series no.667, South Australian Research and Development Institute (Aquatic Sciences), Adelaide.

71
17 ACRONYMS
Acronyms are spelled out in the first instance and then the acronym is used thereafter. The exception is the Harvest Strategy (Section 9), in which all acronyms are spelled out in the first instance as they appear in that chapter, then the acronym is used thereafter.
ATBOA Australian Tuna Boat Owners Association (now known as the Australian Southern Bluefin Tuna Industry Association)
CDR catch disposal record
CoP Code of practice to mitigate against the interactions with common dolphins
DEPM daily egg production method
EBFM ecosystem based fisheries management
EPA Environment Protection Authority South Australia
ESD ecological sustainable development
FRDC Fisheries Research and Development Corporation
GZ Gulfs Zone (used in spatial management in the Harvest Strategy)
GVP gross value of production
ILUA Indigenous land use agreements
ITQ individual transferable quota
LRP limit reference point
MSF Marine Scalefish Fishery
MSS mean size of sardine (used as a decision rule in the Harvest Strategy)
OZ Outside Zone (used in spatial management in the Harvest Strategy)
PI performance indicator
PIRSA Department of Primary Industries and Regions of South Australia
SARDI South Australian Research and Development Institute
SASIA South Australian Sardine Industry Association Inc
SpB spawning biomass
TRP target reference point
TEPS threatened,endangered and protected species

72
18 GLOSSARY OF COMMON FISHERIES MANAGEMENT TERMS
These terms are intended to be used for the purposes of this management plan only.
Aboriginal traditional fishing Fishing engaged in by an Aboriginal person for the purposes of satisfying personal, domestic or non-commercial communal needs, including ceremonial, spiritual and educational needs, and using fish and other natural marine and freshwater products according to relevant Aboriginal custom.
Allocation Distribution of the opportunity to access fisheries resources, within and between fishing sectors.
Beach price Price received by commercial fishers at the ‘port level’ for their catch, generally expressed in terms of $/kg. Processing costs are not included in the beach price, as processing operations are assumed to occur further along the value chain. The use of beach prices also removes the effect of transfer pricing by the firm if it is vertically integrated into the value chain.
Benthic Describes animals that live on, in or near the substrate.
Biomass The total weight or volume of individuals in a fish stock.
Boat Business Profit Defined as gross operating surplus less depreciation less owner-operator and unpaid family labour. Boat business profit represents a more complete picture of the actual financial status of an individual firm; compared with GOS, which represents the cash in/cash out situation only.
By-catch At a broad level, fisheries by-catch includes all material, living and non-living, other than targeted species caught while fishing. It usually refers to discards (that part of the catch returned to the water), by-product, and the part of the catch that is not landed but is killed as a result of interaction with fishing gear.
By-product Non-targeted catch that is commercially valuable and retained by fishers.
Catch The total amount (weight or number) of a species captured from a specified area over a given period of time. The catch includes any animals that are released or returned to the water.
Co-management Arrangements between governments and stakeholder groups to allow joint responsibility for managing fisheries resources on a cooperative basis.
Commercial fishing Fishing undertaken for the purpose of trade or business.
Ecologically sustainable development Using, conserving and enhancing the community’s resources so that ecological processes, on which life depends, are maintained, and the total quality of life, now and in the future, can be increased.
Economic efficiency The maximisation of the value of the net benefits derived from fishery resources.

73
Ecosystem A dynamic complex of plant, animal, fungal and microorganism communities and the associated non-living environment interacting as an ecological unit.
Effort Amount of fishing taking place, usually described in terms of gear type and frequency or period during which the gear is in use; for example, ‘net-sets’ or ‘searching hours’.
Exploitation rate Ratio of catch (tonnes) divided by spawning biomass (tonnes).
Fishery A term used to group the collective enterprise of taking fish. A fishery is usually defined by a combination of the species caught (one or several), the gear and/or fishing methods used, and the area of operation.
Fishery dependent data Information collected about a fishery or fish stock by the participants of a fishery;for example, catch and effort information from fishery log sheets.
Fishery independent data Information collected about a fishery or fish stock by researchers, independent of the fishery; for example, scientific surveys and observer reports.
Gear restriction A type of input control used as a management tool to restrict the amount and/or type of fishing gear that can be used by fishers in a particular fishery.
Gross operating surplus (GOS) Defined as total boat income less total boat cash costs and is expressed in current dollar terms. GOS may be used interchangeably with the term ‘gross boat profit’. A GOS value of zero represents a breakeven position for the business, where total boat cash costs equals total boat income. If GOS is a negative value, the firm is operating at a cash loss; if positive, the firm is making a cash profit. GOS does not include a value for owner/operator wages, unpaid family work or depreciation.
Gross value of production (GVP) Value of the total annual catch for individual fisheries, fishing sectors or the fishing industry as a whole, measured in dollar terms. GVP, generally reported on an annual basis, is the quantity of catch for the year multiplied by the average monthly landed beach prices.
Habitat The place or type of site in which an organism naturally occurs.
Harvest The catch or take of fish from an area over a period of time.
Individually transferable quota A management tool by which portions of the total allowable commercial catches (TACCs) are allocated among licence holders (individual fishers or companies) as units of quota. Quota entitlements can be made temporarily or permanently transferable between these licence holders.
Input controls Limitations on the type or amount of fishing effort; restrictions on the number, type and size of fishing vessels or fishing gear or on the fishing areas or fishing times in a fishery.
Limited entry Where fishing effort is controlled by restricting the number of operators, usually by limiting the number of licences in a fishery.
Logbook An official record (statutory declaration) of catch and effort data made by commercial fishers.

74
Marine Protected Area An area of land and/or sea especially dedicated to the protection and maintenance of biological diversity and of natural and associated cultural resources, and managed through legal or other effective means.
Mesh size The size of mesh permitted in nets and traps.
Mortality The death of fish from any source.
Natural mortality Death of fish caused by predation, pollution, senility, etc., but not fishing.
Non-target species Any part of the catch except the target species, including by-catch and by-product.
Non-retained species Species that are taken as part of the catch but are subsequently discarded, usually because they have low market value or because regulations preclude them being retained.
Offshore Constitutional Settlement (OCS) An agreement between the state(s) and the Commonwealth whereby the State or the Commonwealth (or in some cases a Joint Authority) is given jurisdiction for a particular fishery occurring in both coastal waters and the Australian Fishing Zone. When no OCS agreement has been reached, the fishery remains under the jurisdiction of the State out to 3 nm, and the Commonwealth from 3 to 200 nm.
Output controls Limitations on the allowable catch (quota) by total weight, size, sex or reproductive condition of individuals in the catch.
Precautionary principle A concept asserting that where there are threats of serious or irreversible damage, lack of full scientific certainty shall not be used as a reason for postponing measures to prevent environmental degradation. In the application of the precautionary principle, public and private decision-making should be guided by: (i) careful evaluation to avoid, wherever practicable, serious or irreversible damage to the environment; and (ii) an assessment of the risk-weighted consequences of various options.
Profit at full equity Calculated as boat business profit plus rent, interest and lease payments. Profit at full equity represents the profitability of an individual licence holder, assuming the licence holder has full equity in the operation (i.e., there is no outstanding debt associated with the investment in boat capital). Profit at full equity is a useful absolute measure of the economic performance of fishing firms.
Quota A limit on the weight or number of fish that may be caught of a particular stock or from specified waters.
Quota entitlement The proportion of a quota that is allocated to a particular licence, which limits the total amount of a species permitted to be taken pursuant to that licence.
Recruitment overfishing Excessive fishing effort or catch which reduces recruitment to the extent that the stock biomass falls below the pre-defined limit reference point.
Reference point A reference against which the performance of the indicator can be assessed.

75
Retained species The species within the catch that are not discarded, including target species and by-product.
Sample A proportion or a segment of a fish stock that is removed for study and is assumed to be representative of the whole. The greater the numbers and magnitude of the samples, the greater the confidence that the information obtained is a true reflection of the status of a stock (level of abundance in terms of numbers or weight, age composition, and so on).
Spatial Of or relating to space or area.
Species A group of organisms capable of interbreeding freely with each other but not with members of other species.
Stakeholder An individual or a group with an interest in the conservation, management and use of a resource.
Stock A group of individuals of a species occupying a well-defined spatial range independent of other groups of the same species, which can be regarded as an entity for management or assessment purposes.
Stock assessment A detailed analysis of stock status (abundance, distribution, age structure, etc.) to support the management of the species/fishery.
Target species The species fishers aim to catch.
Traditional fishing Fishing for the purposes of satisfying personal, domestic or non-commercial communal needs, including ceremonial, spiritual and educational needs and utilising fish and other natural marine and freshwater products according to relevant Indigenous custom.
Temporal Of or relating to time.
Threatened A species or community that is vulnerable, endangered or presumed extinct.
Total allowable commercial catch (TACC) For a fishery, a catch limit set as an output control specifically on commercial fishing.The total amount of species that may be taken by commercial fishing during a specified time period.
Vulnerable species Under endangered species protection legislation, a species that within 25 years will become endangered unless mitigating action is taken.

76
19 APPENDICES
19.1 Risk assessment for the sardine fishery
Background
The Act has been in place since 1 December 2007. Since then, the Fisheries Council of South Australia (FCSA) has been established and is the peak advisory body to the Minister. The primary functions of the FCSA are to prepare fisheries management plans under the Act and to advise the Minister on key aspects of fisheries and aquatic resource management.
Under the Act, the preparation of fishery management plans on behalf of the Minister is a key responsibility of the FCSA. Management plans are a significant instrument, guiding decisions on annual catch or effort levels, the allocation of access rights, and establishing the tenure of valuable commercial licences.
The Act also describes the nature and content of fishery management plans, including mandatory requirements. Among other things, management plans must describe the biological, economic and social characteristics of a fishery. Management plans must also include a risk assessment of the impacts or potential impacts of the fishery on relevant ecosystems. This risk assessment will then be used to develop management strategies that will best pursue fishery specific ESD objectives. The broad process is outlined in Figure 15.
The Minister requested the FCSA to prepare a management plan for the sardine fishery by 31 December 2013. To facilitate this process for the fishery, PIRSA conducted an ESD risk assessment workshop with key fishery stakeholders, engaging Dr Rick Fletcher as the independent facilitator. This workshop built on earlier scoping work by fisheries managers and industry to identify the majority of management issues facing each fishery. The process for including the ESD risk assessment into the development of the management plan is depicted in Figure 15.

77
ESD RISK ASSESSMENT Preliminary assessment by PIRSA/SARDI
Stakeholder risk assessment workshop
PIRSA prepares risk assessment report
FORMULATE OBJECTIVES OF MANAGEMENT PLAN PIRSA and industry association
DEVELOP HARVEST STRATEGY PIRSA and industry association
DRAFT MANAGEMENT PLAN Further iterations developed by PIRSA in consultation with industry association
PUBLIC CONSULTATION ON DRAFT MANAGEMENT PLAN Approval for statutory consultation process
MANAGEMENT PLAN AND EXPLANATORY REPORT RELEASED
Figure 15: Flow diagram of the steps required to develop a management plan for South Australian fisheries.
Methodology of the risk assessment
The identification of issues, risk assessment and reporting process are summarised below. The process used was based on a refinement of the National ESD Framework, How To Guide (see www.fisheries-esd.com) as well as the Department of Fisheries, Western Australia ESD performance reports pioneered by Dr Rick Fletcher and other Western Australia Fisheries staff for Australian fisheries.

78
Further details on the process can be found at http://www.fao.org/fishery/eaf-net/eaftool/eaf_tool_4/en.
This qualitative assessment process examined an extensive range of issues, risks and opportunities identified by stakeholders during the workshop. The identification of issues was informed by the generic ESD component tree approach, with component trees refined specifically for this fishery.
Each major component tree reflects the primary components of ESD, and the ESD report assessed the performance of the fishery for each of the relevant ecological, economic, social and governance issues facing the fishery (see Table 11). The process also identified where additional (or reduced) management or research attention is needed, and identified strategies and performance criteria to achieve management objectives to the required standard.
Table 11:Primary ESD components examined in the risk assessment process.
The steps followed to complete the ESD Risk Assessment Report for the sardine fishery are detailed below:
1. A set of ‘generic ESD component trees’ were modified through an iterative process with stakeholders into a set of trees specific to the fishery. This process identified the issues relevant to ESD performance of the fishery under the categories described in Table 11.
2. This assessment requires determination of two factors for each issue within the fishery – the potential consequence arising from an issue (Table 15 to Table 20), then the likelihood that this consequence will occur (Table 14). The combination of consequence and likelihood produce an estimated level of risk associated with the issue that may undermine or alternatively contribute to ESD objectives (Table 12).
3. A risk category was determined for each issue relevant to the risk value assigned (Table 13), and reporting requirements dependent on the risk category followed. The outcomes of the risk assessment is summarised in Section 19.2.
Retained species
Non-retained species Ecological wellbeing
General ecosystem impacts
Community
Aboriginal community Human wellbeing
Governance
External factors fishery performance Ability to achieve

79
Consequence level
Minor Moderate Major Extreme
Likelihood levels 1 2 3 4
Remote 1 1 2 3 4
Unlikely 2 2 4 6 8
Possible 3 3 6 9 12
Likely 4 4 8 12 16
Table 12: Risk matrix to develop risk score.
Risk category Risk values Management response Reporting requirements
Negligible 0-2 None Brief justification
Low 3-4 No specific management Full justification report
Medium 6-8 Specific management/monitoring needed
Full performance report
High 9-16 Increased management activities needed
Full performance report
Table 13: Risk categories, management responses and reporting requirements.
Level Descriptor
Likely (4) A particular consequence level is expected to occur (Probability of 40 to 100%)
Possible (3) Evidence to suggest this consequence level is possible and may occur in some circumstances (Probability of 10 to 35%)
Unlikely (2) The consequence is not expected to occur but it has been known to occur elsewhere
(Probability of 2 to10%)
Remote (1) The consequence has never been heard of in these circumstances, but it is not impossible (Probability < 2%)
Table 14: Likelihood definitions – these are usually defined for the likelihood of a particular consequence level actually occurring within the assessment period.

80
Level Ecological (target/vulnerable species)
Negligible (0) No measureable decline
Exploited stock abundance range 100% to 90% unfished levels
Minor (1) Either not detectable against background variability for this population; or if detectable, minimal impact on population size and none on dynamics.
Exploited stock abundance range < 90% to 70% unfished levels
Moderate (2) Fishery operating at, or close to, the exploitation rate that will deliver maximum sustainable yield (msy).
Exploited stock abundance range < 70% to > Bmsy
Major (3) Stock has been reduced to levels below MSY and may also be getting into the range where recruitment overfishing may occur.
Exploited stock abundance range < Bmsy to> Brec
Extreme (4) Stock size or significant species range contraction > 50% have occurred and recruitment levels reduced affecting future recruitment and their capacity to increase from a depleted state (i.e. recruitment overfishing)
Exploited stock abundance range < Brec
Table 15: Consequence categories for the major target/vulnerable species. The default objective is to maintain the biomass above the target reference point.
Level Ecological (by-product/general by-catch)
Negligible (0) Very few individuals are captured in relation to likely population size (<1%).
Minor (1) Take in this fishery is small (< 10%), compared to total take by all fisheries and these species are covered explicitly elsewhere.
Take and area of capture by this fishery is small, compared to known area of distribution (< 20%).
Moderate (2) Relative area of, or susceptibility to capture is suspected to be less than 50% and species do not have vulnerable life history traits.
Major (3) No information is available on the relative area or susceptibility to capture or on the vulnerability of life history traits of this type of species AND
The relative levels of capture/susceptibility suspected/known to be greater than 50% and species should be examined explicitly.
Extreme (4) N/A Once a consequence reaches this point it should be examined using target species table.
Table 16: Consequence categories for the by-product species/minor by-catch species. The default objective is to maintain appropriate levels of biomass of by-catch species to minimize any significant impact on their dynamics and the broader ecosystem.

81
Level Protected species by-catch
Negligible (0) Some level of interaction may occur but either no mortalities generated or extremely few are recorded at the time scale of years.
Minor (1) Very few individuals of the protected species are directly impacted in most years, no general level of public concern.
Moderate (2) The fishery catches or impacts these species at the maximum level that is accepted.
Major (3) The catch or impact by the fishery on the protected species is above that accepted by broader community but there are few/no additional stock implications.
Extreme (4) The catch or impact is well above the acceptable level and this is may be having significant additional impacts on the already threatened status.
Table 17: Consequence categories for the by-catch of protected species. The default objective is to maintain levels of catch of these species at acceptable levels.
Level Ecological (ecosystem)
Negligible (0) No measurable change in community structure would be possible against background variations.
Minor (1) Some relatively minor shifts in relative abundance may be occurring but it may be hard to identify any measurable changes at whole of trophic levels outside of natural variation.
Moderate (2) Clear measurable changes to the ecosystem components without there being a major change in function (i.e. no loss of components or real biodiversity).These changes are acceptable. None of the main captured species play a ‘true’ keystone role.
Major (3) Ecosystem function altered significantly and some function or components are locally missing/declining/increasingand/or have allowed new species to appear. The level of change is not acceptable to enable one or more high level objective to be achieved.
Recovery measured in many years to decadal.
Extreme (4) An extreme change to ecosystem structure and function. Very different dynamics now occur with different species/groups now the major targets of capture and/or dominating the ecosystem. Could lead to a total collapse of ecosystem processes.
Long-term recovery period may be greater than decades.
Table 18: Consequence categories for the impacts on habitats. The default objective is to maintain the spatial extent of habitat impacts from the fishing activity to a comparatively small percentage of the habitat/ community.

82
Level Ecological (habitat)
Negligible (0) No measurable impact on the habitat would be possible.
Minor (1) Barely measurable impacts on habitat(s) which are very localised compared to total habitat area.
(Suggestion – these impacts could be < 5%; < 3%; <2%) of the original area of habitat).
Moderate (2) There are likely to be more widespread impacts on the habitat but the levels are still considered acceptable given the percentage of area affected, the types of impact occurring and the recovery capacity of the habitat.
(Suggestion – for impact on non-fragile habitats this may be up to 50% [similar to population dynamics theory] – but for more fragile habitats, to stay in this category the percentage area affected may need to be smaller; e.g., 20% and for critical habitats less than 5%).
Major (3) The level of impact on habitats may be larger than is sensible to ensure that the habitat will not be able to recover adequately, or it will cause strong downstream effects from loss of function.
(Suggestion - Where the activity makes a significant impact in the area affected and the area > 25 - 50% [based on recovery rates] of habitat is being removed; while for critical habitats this would be < 10%).
Extreme (4) Too much of the habitat is being affected, which may endanger its long-term survival and result in severe changes to ecosystem function and the entire habitat is in danger of being affected in a major way/removed.
(Suggestion this may equate to 70 - 90% of the habitat being affected or removed by the activity; for more fragile habitats this would be > 30% and for critical habitats 10-20%).
Table 19: Consequence categories for economic outcomes. The default objective is maintenance or enhancement of economic activity.
Level Social implications
Negligible (0) Not measurable or no direct involvement.
Minor (1) Direct impacts may be measurable but concerns are minimal.
Moderate (2) Some direct impacts on social structures but not to the point where local communities are threatened or social dislocations will occur.
Major (3) Severe impacts on social structures, at least at a local level.
Extreme (4) Changes will cause a complete alteration to some social structures that are present within a region of a country.
Table 20: Consequence categories for social disruptions. The default objective is maintenance or enhancement of appropriate social structures and outcomes.

83
Level Economic
Negligible (0) None or not detectable.
Minor (1) Possibly detectable, but no real impact on the economic pathways for the industry or the community.
Moderate (2) Some level of reduction for a major fishery or a large reduction in a small fishery that the community is not dependent upon.
Major (3) Fishery/industry has declined significantly in economic generation and this will have clear flow on effects to other parts of the community. May result in some level of political intervention.
Extreme (4) Total collapse of any economic activity coming from what was an industry that the community derived a significant level of their income or employment (resource dependency), including possible debts. High levels of political intervention likely.
Table 21: Suggested consequence levels for economic outcomes. The default objective is maintenance or enhancement of economic activity.

84
19.2
O
verv
iew
of t
he ri
sk a
sses
smen
t
Issu
e Ri
sk/
prio
rity
Obj
ectiv
e de
velo
ped
Indi
cato
r m
easu
red
Perf
orm
ance
m
easu
re
Curr
ent
perf
orm
ance
Ro
bust
ness
Ac
tions
Reta
ined
spec
ies
Aust
ralia
n Sa
rdin
es
M
Yes
Yes
Yes
Acce
ptab
le
High
*
Aust
ralia
n An
chov
y N
Ye
s Ye
s Ye
s Ac
cept
able
M
ediu
m
* Bl
ue M
acke
rel
N
Yes
Yes
No
Acce
ptab
le
Low
**
* Re
dbai
t N
Ye
s Ye
s N
o Ac
cept
able
Lo
w
***
Jack
Mac
kere
l N
Ye
s Ye
s N
o Ac
cept
able
Lo
w
***
Mar
ay
L Ye
s Ye
s N
o N
/A
Low
**
* Bl
ue S
prat
N
Ye
s Ye
s N
o N
/A
Low
**
* Sa
ndy
Spra
t N
Ye
s Ye
s N
o N
/A
Low
**
* N
on-r
etai
ned
spec
ies
TEPS
– C
omm
on d
olph
in (b
iolo
gica
l) N
Ye
s Ye
s Ye
s Ac
cept
able
Hi
gh
* TE
PS –
Com
mon
dol
phin
(soc
ial)
M
Yes
Yes
Yes
N/A
Lo
w
* TE
PS –
Aus
tral
ian
fur s
eal
N
Yes
Yes
Yes
Acce
ptab
le
High
*
TEPS
– N
ew Z
eala
nd fu
r sea
l N
Ye
s Ye
s Ye
s Ac
cept
able
Hi
gh
* TE
PS –
Aus
tral
ian
sea
lion
L Ye
s Ye
s Ye
s Ac
cept
able
Hi
gh
* TE
PS –
Whi
te S
hark
N
Ye
s Ye
s Ye
s Ac
cept
able
Hi
gh
* TE
PS –
Oth
er C
etac
eans
N
Ye
s Ye
s Ye
s Ac
cept
able
Hi
gh
* TE
PS –
Sea
bird
s N
Ye
s Ye
s Ye
s Ac
cept
able
Hi
gh
* TE
PS –
Syn
gnat
hids
N
Ye
s Ye
s Ye
s Ac
cept
able
Hi
gh
* TE
PS –
Mak
o Sh
ark
N
Yes
Yes
Yes
Acce
ptab
le
High
*
Blue
Sha
rk
L Ye
s Ye
s N
o N
/A
N/A
**
* Br
onze
Wha
ler
L Ye
s Ye
s N
o N
/A
N/A
**
* Sn
appe
r L
Yes
Yes
No
N/A
N
/A
***
Barr
acud
a L
Yes
Yes
No
N/A
N
/A
***
Toad
Fish
L
Yes
Yes
No
N/A
N
/A
***
Cutt
lefis
h L
Yes
Yes
No
N/A
N
/A
***

85
Gene
ral e
cosy
stem
impa
cts o
f fis
hing
Impa
cts o
n tr
ophi
c st
ruct
ure
from
com
mer
cial
fis
hing
– ta
rget
and
non
-tar
get s
pp.
L Ye
s Ye
s Ye
s Ac
cept
able
M
ediu
m
***
Habi
tat d
istur
banc
e –
shal
low
shot
s N
N
o N
o N
o N
/A
N/A
**
* Ha
bita
t dist
urba
nce
– lo
st g
ear
N
No
No
No
N/A
N
/A
***
Wat
er q
ualit
y –
rubb
ish/d
ebris
N
N
o N
o N
o N
/A
N/A
**
* W
ater
qua
lity
– oi
l disc
harg
e N
N
o N
o N
o N
/A
N/A
**
* W
ater
qua
lity
– br
ine
disc
harg
e H
Yes
No
No
N/A
N
/A
***
Gen
eral
com
mun
ity
Wor
k, h
ealth
and
safe
ty
M
No
No
No
Acce
ptab
le
N/A
**
**
Com
mun
ity re
latio
nshi
ps
N
Yes
Yes
Yes
Acce
ptab
le
Low
*
Life
styl
e N
N
o N
o N
o N
/A
N/A
**
* M
arke
t – p
rofit
, em
ploy
men
t and
ass
et v
alue
M
Ye
s Ye
s Ye
s Ac
cept
able
M
ediu
m
***
Econ
omic
val
ue –
em
ploy
men
t and
rein
vest
men
t (r
egio
nal)
N
Yes
Yes
Yes
Acce
ptab
le
Med
ium
**
*
Soci
al c
apita
l (re
gion
al)
N
Yes
No
No
N/A
N
/A
***
Infr
astr
uctu
re –
tran
spor
t and
unl
oad
faci
litie
s (P
ort L
inco
ln)
M
Yes
No
No
N/A
N
/A
***
Infr
astr
uctu
re –
tran
spor
t and
unl
oad
faci
litie
s (w
este
rn E
yre
Peni
nsul
a)
H Ye
s N
o N
o N
/A
N/A
**
*
Econ
omic
val
ue (c
ity)
N
Yes
Yes
Yes
Acce
ptab
le
Med
ium
**
* So
cial
val
ue –
hea
lth/f
ood
(city
) N
Ye
s N
o N
o N
/A
N/A
**
* So
cial
val
ue –
rese
arch
/kno
wle
dge
(city
) N
Ye
s N
o N
o N
/A
N/A
**
* So
cial
val
ue –
iden
tity
(city
) N
Ye
s N
o N
o N
/A
N/A
**
* So
cial
val
ue –
pub
lic a
ccep
tanc
e (c
ity)
H Ye
s Ye
s Ye
s Ac
cept
able
Lo
w
* In
fras
truc
ture
(city
) N
Ye
s N
o N
o N
/A
N/A
**
*

86
Gov
erna
nce
FCSA
N
N
o N
o N
o N
/A
N/A
**
* PI
RSA
– Po
licy
and
Man
agem
ent –
man
agem
ent
effe
ctiv
enes
s N
N
o N
o N
o N
/A
N/A
**
*
PIRS
A –
Polic
y an
d M
anag
emen
t – re
sour
ces
N
No
No
No
N/A
N
/A
***
PIRS
A –
Polic
y an
d M
anag
emen
t –st
rate
gic
polic
y N
N
o N
o N
o N
/A
N/A
**
* PI
RSA
– Po
licy
and
Man
agem
ent –
rese
arch
and
da
ta c
olle
ctio
nN
Ye
s Ye
s Ye
s Ac
cept
able
Hi
gh
*
PIRS
A –
Polic
y an
d M
anag
emen
t – c
ompl
ianc
e H
Yes
Yes
Yes
Acce
ptab
le
High
**
PI
RSA
– le
gal f
ram
ewor
k –
OCS
/allo
catio
n M
Ye
s Ye
s N
o Ac
cept
able
M
ediu
m
* PI
RSA
– le
gal f
ram
ewor
k –o
ther
law
s (PI
RSA)
N
N
o N
o N
o N
/A
N/A
**
* PI
RSA
– le
gal f
ram
ewor
k –a
cces
s rig
hts (
PIRS
A)
N
No
No
No
N/A
N
/A
***
PIRS
A –
lega
l fra
mew
ork
- com
pens
atio
n N
N
o N
o N
o N
/A
N/A
**
* PI
RSA
–con
sulta
tion
N
No
No
No
N/A
N
/A
***
PIRS
A –r
epor
ting
N
No
No
No
N/A
N
/A
***
Oth
er a
genc
ies –
DEW
NR
N
No
No
No
N/A
N
/A
***
Oth
er a
genc
ies –
DSEW
PaC
N
No
No
No
N/A
N
/A
***
Oth
er a
genc
ies –
DPT
I M
Ye
s N
o N
o N
/A
N/A
**
* O
ther
age
ncie
s – A
FMA/
DAFF
(cat
ch sh
arin
g)
M
Yes
Yes
No
Acce
ptab
le
Med
ium
*
Indu
stry
N
N
o N
o N
o N
/A
N/A
**
* O
ther
s –so
cial
lice
nce
to o
pera
te
M
Yes
Yes
Yes
Acce
ptab
le
Low
**
* O
ther
s –pa
rtic
ipat
ion
N
No
No
No
N/A
N
/A
***

87
Exte
rnal
fact
ors a
ffect
ing
the
perf
orm
ance
of t
hefis
hery
Phys
ical
– c
limat
e ch
ange
, tem
pera
ture
, wea
ther
an
d up
wel
ling
N
No
No
No
N/A
N
/A
***
Biol
ogic
al -
dise
ases
M
Ye
s N
o N
o N
/A
N/A
**
* W
ater
qua
lity
N
No
No
No
N/A
N
/A
***
Gear
/ inf
rast
ruct
ure
inte
rfer
ence
N
N
o N
o N
o N
/A
N/A
**
* Ec
onom
ic –
fuel
pric
e N
N
o N
o N
o N
/A
N/A
**
* Ec
onom
ic –
mar
ket f
orce
s M
Ye
s Ye
s Ye
s Ac
cept
able
M
ediu
m
***
Econ
omic
– la
bour
N
N
o N
o N
o N
/A
N/A
**
* Ec
onom
ic –
oth
er c
osts
N
N
o N
o N
o N
/A
N/A
**
* Ec
onom
ic –
inte
rest
rate
s N
N
o N
o N
o N
/A
N/A
**
* Ec
onom
ic –
insu
ranc
e N
N
o N
o N
o N
/A
N/A
**
* Ac
cess
– m
arin
e pa
rks
N
No
No
No
N/A
N
/A
***
Acce
ss –
oil
and
gas
N
No
No
No
N/A
N
/A
***
Acce
ss –
ship
ping
L
No
No
No
N/A
N
/A
***
Acce
ss –
unl
oad
faci
litie
s – w
est c
oast
H
Yes
No
No
N/A
N
/A
***

88