Management of Non-Performing Assets in Indian Public Sector ...
25
Management of Non-Performing Assets in Indian Public Sector Banks with special reference to Jharkhand Abstract I. Introduction The banking industry has undergone a sea change after the first phase of economic liberalization in 1991 and hence credit management. While the primary function of banks is to lend funds as loans to various sectors such as agriculture, industry, personal loans, housing loans etc., in recent times the banks have become very cautious in extending loans. The reason being mounting non-performing assets (NPAs). An NPA is defined as a loan asset, which has ceased to generate any income for a bank whether in the form of interest or principal repayment. As per the prudential norms suggested by the Reserve Bank of India (RBI), a bank cannot book interest on an NPA on accrual basis. In other words, such interests can be booked only when it has been actually received. Therefore, this has become what is called as a ‘critical performance area’ of the banking sector as the level of NPAs affects the profitability of a bank as shown in the figure below. Figure 1 here Therefore, an NPA account not only reduces profitability of banks by provisioning in the profit and loss account, but their carrying cost is also increased which results in excess & avoidable management attention. Apart from this, a high level of NPA also puts strain on a banks net worth because banks are under pressure to maintain a desired level of Capital Adequacy and in the absence of comfortable profit level, banks eventually look towards their internal financial strength to fulfill the norms thereby slowly eroding the net worth. Today the Net NPAs of Indian PSBs (which account for around three-fourths of the total assets of Indian banking industry) are as low as 0.72 percent and gross NPAs are at 2.5 percent. However, Nitsure (2007) contends that once there is a slowdown in private expenditure and corporate earnings growth, companies on these banks’ books will not be in a position to service their debts on time and there is a strong likelihood of generation of new NPAs. Moreover, he also suggests that with rising interest rates in the government bond market, the banks’ treasury incomes have declined considerably. So banks will not have enough profits to make provisions for NPAs.
Transcript of Management of Non-Performing Assets in Indian Public Sector ...

Management of Non-Performing Assets in Indian Public Sector Banks with special reference to Jharkhand
Abstract I. Introduction The banking industry has undergone a sea change after the first phase of economic liberalization in
1991 and hence credit management. While the primary function of banks is to lend funds as loans to
various sectors such as agriculture, industry, personal loans, housing loans etc., in recent times the
banks have become very cautious in extending loans. The reason being mounting non-performing
assets (NPAs). An NPA is defined as a loan asset, which has ceased to generate any income for a bank
whether in the form of interest or principal repayment. As per the prudential norms suggested by the
Reserve Bank of India (RBI), a bank cannot book interest on an NPA on accrual basis. In other words,
such interests can be booked only when it has been actually received. Therefore, this has become what
is called as a ‘critical performance area’ of the banking sector as the level of NPAs affects the
profitability of a bank as shown in the figure below.
Figure 1 here
Therefore, an NPA account not only reduces profitability of banks by provisioning in the profit and
loss account, but their carrying cost is also increased which results in excess & avoidable management
attention. Apart from this, a high level of NPA also puts strain on a banks net worth because banks are
under pressure to maintain a desired level of Capital Adequacy and in the absence of comfortable
profit level, banks eventually look towards their internal financial strength to fulfill the norms thereby
slowly eroding the net worth.
Today the Net NPAs of Indian PSBs (which account for around three-fourths of the total assets of
Indian banking industry) are as low as 0.72 percent and gross NPAs are at 2.5 percent. However,
Nitsure (2007) contends that once there is a slowdown in private expenditure and corporate earnings
growth, companies on these banks’ books will not be in a position to service their debts on time and
there is a strong likelihood of generation of new NPAs. Moreover, he also suggests that with rising
interest rates in the government bond market, the banks’ treasury incomes have declined considerably.
So banks will not have enough profits to make provisions for NPAs.

Under these circumstances, management of NPAs is a difficult task. Therefore, my study focused on
the problem of NPAs being faced by the public sector banks and it’s management with a reference to
the state of Jharkhand.
Jharkhand was incarnated in August 2000 by the bifurcation of Bihar. The geology of Jharkhand puts
it in the richest states category in terms of mineral and ore deposits. Though industry-wise it is not a
developed state yet, still it houses some of the best names in industry namely Tata Steel, HINDALCO
of the AV Birla Group, BOC Gases, Uranium Corporation, SAIL, Heavy Engineering Corporation,
Metallurgical Consultancy etc. Over a period of six years or so, there has been a spurt in credit
demand in all the sector like industry (mostly SMEs), personal, agriculture and other Small Scale
Industries. With an objective of overall development of the state, the government of Jharkhand
pursued the banks to increase their lending to various quarters. The banks therefore resorted to
indiscriminate lending and as a result the amount of bad loans in Jharkhand stood at around Rs 4500
Cr as on 30-09-2006. The study finds the reasons and solution to the problem of growing level of
NPAs.
II. Literature Review
Though many published articles are available in the area of credit management and non-performing
assets, which are either bank specific or banking sector specific, there are hardly any state specific
researches. As Jharkhand is a very young state, no published articles have been found except a AICTE
sponsored project undertaken by the author on the topic which focused only on the South
Chhotanagpur Region of Jharkhand. This work is therefore, an extension of the work done by the
author.
A synoptic review of the literature brings to the fore insights into the determinants of NPL across
countries. A considered view is that banks’ lending policy could have crucial influence on non-
performing loans (Reddy, 2004). He critically examined various issues pertaining to terms of credit of
Indian banks. In this context, it was viewed that ‘the element of power has no bearing on the illegal
activity. A default is not entirely an irrational decision. Rather a defaulter takes into account
probabilistic assessment of various costs and benefits of his decision’. Mohan (2003) conceptualized
‘lazy banking’ while critically reflecting on banks’ investment portfolio and lending policy. The

Indian viewpoint alluding to the concepts of ‘credit culture’ owing to Reddy (2004) and ‘lazy banking’
owing to Mohan (2003a) has an international perspective since several studies in the banking literature
agree that banks’ lending policy is a major driver of non-performing loans (McGoven, 1993,
Christine 1995, Sergio, 1996, Bloem and Gorters, 2001). Furthermore, in the context of NPAs on
account of priority sector lending, it was pointed out that the statistics may or may not confirm this.
There may be only a marginal difference in the NPAs of banks’ lending to priority sector and the
banks lending to private corporate sector. Against this background, the study suggests that given the
deficiencies in these areas, it is imperative that banks need to be guided by fairness based on economic
and financial decisions rather than system of conventions, if reform has to serve the meaningful
purpose. Experience shows that policies of liberalisation, deregulation and enabling environment of
comfortable liquidity at a reasonable price do not automatically translate themselves into enhanced
credit flow. Although public sector banks have recorded improvements in profitability, efficiency (in
terms of intermediation costs) and asset quality in the 1990s, they continue to have higher interest rate
spreads but at the same time earn lower rates of return, reflecting higher operating costs (Mohan,
2004). Bhattacharya (2001) rightly points to the fact that in an increasing rate regime, quality
borrowers would switch over to other avenues such as capital markets, internal accruals for their
requirement of funds. Under such circumstances, banks would have no option but to dilute the quality
of borrowers thereby increasing the probability of generation of NPAs. In another study, Mohan
(2003) observed that lending rates of banks have not come down as much as deposit rates and interest
rates on Government bonds. While banks have reduced their prime lending rates (PLRs) to some
extent and are also extending sub-PLR loans, effective lending rates continue to remain high. This
development has adverse systemic implications, especially in a country like India where interest cost
as a proportion of sales of corporates are much higher as compared to many emerging economies. The
problem of NPAs is related to several internal and external factors confronting the borrowers
(Muniappan, 2002). The internal factors are diversion of funds for expansion/ diversification/
modernisation, taking up new projects, helping/promoting associate concerns, time/cost overruns
during the project implementation stage, business (product, marketing, etc.) failure, inefficient
management, strained labour relations, inappropriate technology/technical problems, product
obsolescence, etc.,while external factors are recession, non-payment in other countries, inputs/power
shortage, price escalation, accidents and natural calamities.

In the Indian context, Rajaraman and Vasishtha (2002) in an empirical study provided an evidence of
significant bivariate relationship between an operating inefficiency indicator and the problem loans of
public sector banks. In a similar manner, largely from lenders’ perspective, Das and Ghosh (2003)
empirically examined non-performing loans of India’s public sector banks in terms of various
indicators such as asset size, credit growth and macroeconomic condition, and operating efficiency
indicators. Sergio (1996) in a study of non-performing loans in Italy found evidence that, an increase
in the riskiness of loan assets is rooted in a bank’s lending policy adducing to relatively unselective
and inadequate assessment of sectoral prospects. Interestingly, this study refuted that business cycle
could be a primary reason for banks’ NPLs. The study emphasised that increase in bad debts as a
consequence of recession alone is not empirically demonstrated. It was viewed that the bank-firm
relationship will thus, prove effective not so much because it overcomes informational asymmetry but
because it recoups certain canons of appraisal. In a study of loan losess of US banks, McGoven (1993)
argued that ‘character’ has historically been a paramount factor of credit and a major determinant in
the decision to lend money.
Banks have suffered loan losses through relaxed lending standards, unguaranteed credits, the
influence of the 1980s culture, and the borrowers’ perceptions. It was suggested that bankers should
make a fairly accurate personality-morale profile assessment of prospective and current borrowers and
guarantors. Besides considering personal interaction, the banker should:
(i) try to draw some conclusions about staff morale and loyalty,
(ii) study the person’s personal credit report,
(iii) do trade-credit reference checking,
(iv) check references from present and former bankers, and
(v) determine how the borrower handles stress. In addition, banks can minimise risks by
securing the borrower’s guarantee, using Government guaranteed loan programs, and
requiring conservative loan-to-value ratios.
Bloem and Gorter (2001) suggested that a more or less predictable level of non-performing loans,
though it may vary slightly from year to year, is caused by an inevitable number of ‘wrong economic
decisions by individuals and plain bad luck (inclement weather, unexpected price changes for certain
products, etc.). Under such circumstances, the holders of loans can make an allowance for a normal

share of non-performance in the form of bad loan provisions, or they may spread the risk by taking out
insurance. Enterprises may well be able to pass a large portion of these costs to customers in the form
of higher prices. For instance, the interest margin applied by financial institutions will include a
premium for the risk of nonperformance on granted loans.
At this time, banks’ non-performing loans increase, profits decline and substantial losses to capital
may become apparent. Eventually, the economy reaches a trough and turns towards a new
expansionary phase, as a result the risk of future losses reaches a low point, even though banks may
still appear relatively unhealthy at this stage in the cycle.
Gupta’s study (1983) on a sample of Indian companies financed by ICICI concludes that certain cash
flows coverage ratios are better indicators of corporate sickness. Bhatia (1988) and Sahoo, Mishra and
Soothpathy (1996) examine the predictive power of accounting ratios on a sample of sick and non-sick
companies by applying the multi discriminant analysis techniques. In both the studies, the selected
accounting ratios are effective in predicting industrial sickness with a high degree of precision.
III. Research Methodology
In this study a sample of six districts of Jharkhand have been taken out of a total of 18 districts and
they are:
1. Ranchi (the Capital)
2. East Singbhum (HQ: Jamshedpur)
3. Bokaro
4. Dhanbad
5. Hazaribagh
6. Gumla
The selection is based on the fact that the above districts represent about 80% of total industries in
Jharkhand and about 66% of total bank credit sanctioned to various quarters. The study has been
divided into two phases:

Phase I: Study of NPAs on All India basis
Phase II: Study of NPAs in Jharkhand
Sample Selection
The study focused on three groups of people: Bankers, Borrowers and Others (includes Chartered
Accountants, Lawyers & Academicians). While bankers and borrowers have been selected from all the
sample districts as shown above, academicians have been taken from BIT Mesra, Ranchi, Department
of Management, Indian School of Mines,Dhanbad, Xavier Institute of Social Service, Ranchi,
University of Allahabad (MONIRBA), and MNNIT, Allahabad.
Parameters which were selected for “Reasons of NPAs” are as follows:
i) Market Failure
ii) Wilful Defaults
iii) Poor follow-up and Supervision
iv) Non-cooperation from Banks
v) Poor Legal framework
vi) Lack of Entrepreneurial Skills
vii) Diversion of funds
Ranchi Singbhum
(E)
Dhanbad Bokaro Hazaribagh Gumla TOTAL
SBI 11 8 6 6 3 2 36
Allahabad Bank 9 5 5 4 2 1 26
United Bank 7 5 3 3 1 ---- 19
Bank of Baroda 5 3 2 2 1 1 14
Union Bank 7 7 5 4 2 2 27
TOTAL 39 28 21 19 9 6 122

IV OBSERVATIONS AND ANALYSIS Expansion of credit is a must for a country like India. But as mentioned above, high credit growth may
lead to high NPAs. Policymakers, therefore, face the dilemma as to how to minimize such risks that
arise from dilution in credit quality, while still allowing bank lending to contribute to higher growth
and efficiency.1
There is no gainsay in the fact that every commercial organization exist with a motive to earn profit
and banks are no exception. The objective function is therefore to maximize profit or the Net Interest
Margin . Commercial banks use the deposits to extend loans and advances. The figure below shows
that how a bank can maximize profit (assuming existence of Pure Competition Market):
Figure 2 here
In Figure 2, MC is the Marginal Cost to the banks, AC is the Average Cost, i is the interest rates on
loans.
Point B represents the cost of funds and the shaded portion is the profit. To maximize profits, a purely
competitive bank issues loans such that the marginal cost of an additional loan equals the marginal
revenue from such loans. The marginal revenue from an additional loan is simply the market
determined interest rate. Profits are maximized when MC equals interest rate. Therefore, it is evident
that profits can be maximized if more and more loans are extended at a given rate of interest. This may
result in poor assessment of the borrower leading to fresh generation of NPAs.
______________________
1 Report on Trend and Progress of Banking in India, 2004-05, p-68

Figure 3 below shows the frequency distribution of commercial banks according to NPA level. It is
found that over a period of five years the share of Public Sector Banks (PSBs) in the total NPA has
reduced though foreign banks are the best performers on this front.
Figure 3 here
In the year 2002, the PSBs had around 50% of their NPA profile in the 5 to 10 % category which has
been totally eliminated by 2006 wherein about 75% of their total NPA is below 2% mark. The
performance has steadily improved over the period after the enactment of the Securitisation Act, 2002.
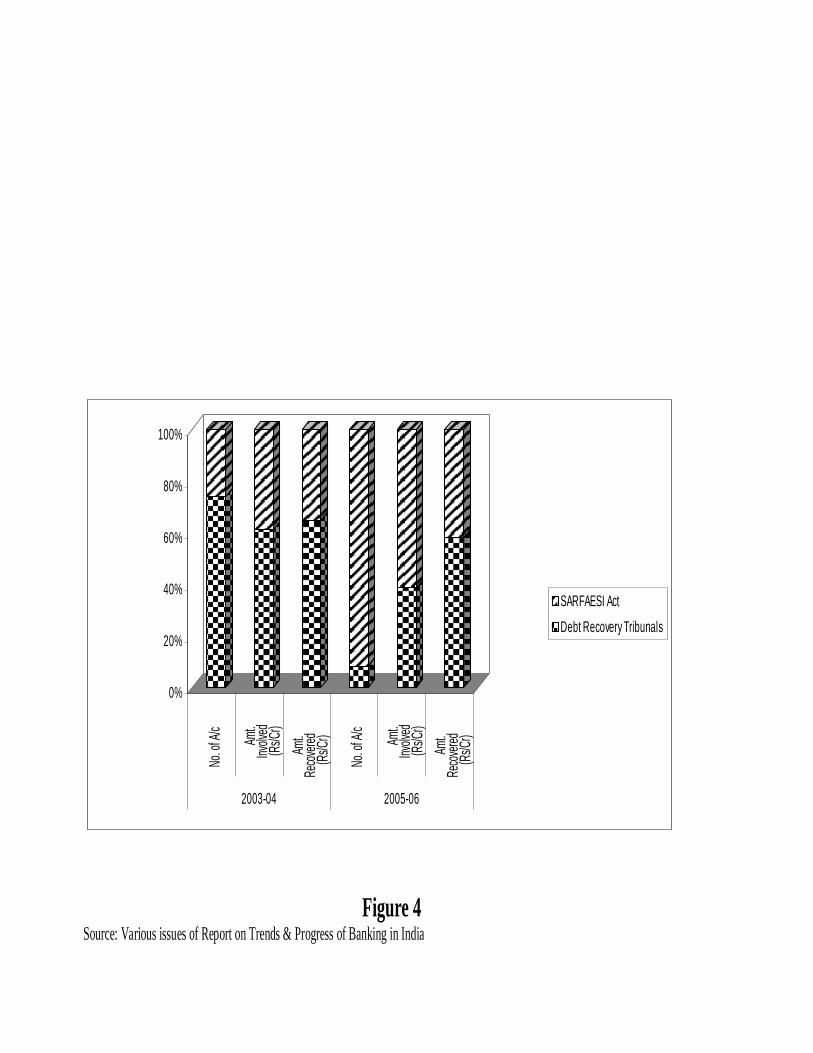
However, available data point to the fact that majority of the loans are recovered through the Debt
Recovery Tribunals [Please refer Figure 4].
Figure 4 here
The figure reveals that as far as recovery is concerned, Debt Recovery Tribunals are the most effective
means of loan recovery. From 2003-04 to 2005-06 though the number of cases referred to the DRTs
have reduced from 7544 to 3524 (as compared to that under the Securitisation Act wherein it increased
from 2661 to 38969), the percentage of recovery is almost double as compared to the Securitisation
Act. The percentage recovery through the DRTs has increased from 17.2% to about 77% as compared
to the recoveries through the Securitisation Act where it increased from 14.7% to about 35%. This can
be attributed to the absence of any structured market for selling the distressed assets which are
securitised under the SARFAESI Act. Moreover, selling sticky assets is a problem due to differences
between the seller and the buyer in the valuation of such loans. Apart from this any dissatisfied
borrower against whom the Securitisation Act has been initiated can take recourse to court of law and
file a suit against the lender thereby making the lender to fall in what is termed as ‘legal trap’. On the
other hand recovery through the DRTs is much speedier. Though there is a provision of filing a suit
against the lender as under the Securitisation Act, but here the borrower filing the suit has to deposit
25% of the amount involved for further processing and hearing of the case. This provision ensures that
only the genuine cases are taken up by the DRTs.

Non-Performing Assets in the Priority Sector
Priority sector was regarded as a “People Sector” by policymakers, regulators and banks till 1990. As
one of the prime objectives of nationalization of banks was radical development of the society in
general and ‘certain sectors’ in particular, credit flow to these sectors was ensured. This directed
lending did not come without a cost. While granting credit to these sectors, institutional viability was
neglected, low interest rates were charged. This resulted in huge overdues from priority sector. The
recommendations of the Narsimham Committee were not accepted in-toto especially to reduce the
mandatory 40% lending norm to the priority sector to 10% level. Figure 5 shows Sector wise NPAs in
the Public Sector Banks.
Figure 5 here
It is observed that there is a gradual increase in the NPA level in the Priority Sector. It increased from
44.5% in the year ending 2002 to 49% in 2005 as compared to the Private Sector Banks where these
figures are about 22% and 25% respectively. When the NPAs in the Non-priority sector are analysed
then it is observed that it decreased from 53.5% to 50% for Public Sector Banks over the same period
and it decreased from 78% to 75% for Private Sector Banks. It is therefore evident that though the Net
NPA figure increased in the priority sector for the commercial banks, it is the Non-priority sector
which has contributed more to the NPAs of these banks. It is considerable higher in the Private Sector
Banks. On the other hand, the NPAs of Public Sector Banks in the priority sector is almost double as
compared to that in Private Sector Banks. This skewness is attributed to the fact that though the
scheduled commercial banks are mandatorily required to lend atleast 40% of their advances to the
priority sector as per the RBI stipulations, it appears that it is the Public Sector Banks which has to
bear the brunt as far as lending is concerned owing to their ownership pattern. This trend is reflected in
Appendices 14(a) and 16(a), which shows the concentration of banks at various NPA levels. It is
observed that for the Public Sector Banks highest concentration is in the “40+ to 50%” category
whereas, the corresponding concentration of Private Sector Banks is maximum in “upto 30%”
category. In other words, a majority of the Public Sector Banks has an NPA in the range of 40 to 50%
while it is below 30% in the Private sector Banks.

NPA Management in Jharkhand The Credit-Deposit Ratio in Jharkhand is almost half that as compared to the ratio on All India basis
and there has been a stagnation in the figure. This is despite the fact that there has been a tremendous
appetite for bank credit from all sectors due to the formation of Jharkhand in 2000.
Figure 6 here
It is observed from figure 7 that maximum credit was sanctioned to the industrial sector.. In the year
2001, the total credit sanctioned to this sector was Rs 1000 Cr for SBI and Associates which increased
to Rs 1080 Cr in the year 2005, an increase of about 8%.
Figure 7 here
For the Nationalised Banks the corresponding figures are Rs 1440 Cr and Rs 1000 Cr, a decrease of
about 31%. As far as agriculture sector is concerned, it is observed that for SBI and Associates the
credit sanctioned increased from Rs 140 Cr to Rs 200 Cr, an increase of about 43%. For Nationalised
Banks the corresponding figures are Rs 160 Cr to Rs 360 Cr, registering an increase of about 125%.
This clearly shows that, though the industrial sector has been the major beneficiary of bank loans in
absolute terms, it’s growth rate is much less as compared to the agriculture sector. This is especially
significantly higher in Nationalised Banks.
Figure 8(a) and 8(b) shows districtwise bad loans and number of defaulting companies in the sample
districts of Ranchi, Bokaro, East Singbhum, Hazaribagh, Dhanbad and Gumla, it is observed that the
districts of East Singbhum and Dhanbad are the worst sufferers as far as quantum of bad loans is
concerned.
Figure 8(a) & 8(b) here
As on 30 September 2006, the total quantity of bad loans was Rs 1520 Cr in East Singbhum and Rs
930 Cr in the Dhanbad district. If all the districts are taken then this figure stood at Rs 4070 Cr as on
the same date. Therefore, the bad loans in East Singbhum was about 37.3% of total such loans in all
the sample districts and the same figure is about 23% in the Dhanbad district and together they
constitute about 60% of total bad loans. This figure may be taken as the representation of Jharkhand as
a whole as these districts combined have the highest concentration of industries. Moreover, these
figures reveal that about 94% of total such loans is concentrated in the districts of Ranchi, Bokaro,
East Singbhum and Dhanbad. It is observed that, as on 30 September 2006, the total number of
defaulting companies in East Singbhum is 13 followed by 10 in Ranchi, 7 in Bokaro and 6 in
Dhanbad. Interestingly, among all the Public Sector Banks, State Bank of India has the highest share
of bad loans and number of defaulting companies. As on 30 September 2006, the total bad loans of
State Bank of India was Rs 2660 Cr which is about 65% of total bad loans and the corresponding
figure of number of defaulting companies was about 72%.
Reasons of NPAs in Jharkhand Among the various parameters chosen for this purpose, it is observed from the figure in Figure 9, that
there are quite contradictory views among all the responders. This is not unusual because the bankers
and borrowers cannot have the same opinion about the reasons. What is true for the banker may not
hold true for the borrower. In all the districts except that of Hazaribagh and Gumla, bankers in the
remaining districts feel that ‘lack of entrepreneurship’ is the most important reason for the generation
of NPAs. This response is more prominent in Bokaro district. However, bankers in the districts of
Hazaribagh and Gumla hold ‘willful defaults’ as one of the important reasons. It is worthwhile to be
mentioned here that when that bankers were asked that what factors they look into for terming a
borrower as a willful defaulter, there was unanimity in their responses though a majority of them
consider the fact that despite their good financial health, a borrower still defaults or delay the payment
of loan installments. As expected, the borrowers hold ‘ market failure’ as the reason for the inability to
service their loans in time. It is further observed that a majority of the bankers (about 32%) consider
‘lack of entrepreneurship’ as the most important reason for NPAs closely followed by ‘willful
defaults’ (at about 29.5%) as the reason, while about 35% of the borrowers consider ‘market failure’
as the reason for their inability to service their loans. It is however interesting to note that either
bankers or others do not consider poor follow-up and supervision leads to higher level of NPAs. This
is against most theories suggested on this line where poor credit appraisal or follow-up leads to
generation of NPAs in banks.

Recommendations for reducing NPAs
1. Effective and regular follow-up of the end use of the funds sanctioned is required to ascertain any
embezzlement or diversion of funds. This process can be undertaken every quarter so that any account
converting to NPA can be properly accounted for.
2. Combining traditional wisdom with modern statistical tools like Value-at-risk analysis and Markov
Chain Analysis should be employed to assess the borrowers. This is to be supplemented by
information sharing among the bankers about the credit history of the borrower. In case of new
borrowers, especially corporate borrowers, proper analysis of the cash flow statement of last five years
is to be done carefully.
3. A healthy Banker-Borrower relationship should be developed. Many instances have been reported
about forceful recovery by the banks, which is against corporate ethics. Debt recovery will be much
easier in a congenial environment.
4. Assisting the borrowers in developing his entrepreneurial skills will not only establish a good
relation between the borrowers but also help the bankers to keep a track of their funds.
5. Countries such as Korea, China, Japan, Taiwan have a well functioning Asset Reconstruction/
Recovery mechanism wherein the bad assets are sold to an Asset Reconstruction Company (ARC) at
an agreed upon price. In India, there is an absence of such mechanism and whatever exists, it is still in
nascent stage. One problem that can be accorded is the pricing of such loans. Therefore, there is a need
to develop a common prescription for pricing of distressed assets so that they can be easily and quickly
disposed. The ARCs should have clear ‘financial acquisition policy’ and guidelines relating to proper
diligence and valuation of NPA portfolio.
6. Some tax incentives like capital gain tax exemption, carry forward the losses to set off the same
with other income of the Qualified Institutional Borrowers (QIBs) should be granted so as to ensure
their active participation by way of investing sizeable amount in distressed assets of banks and
financial institutions.

7. So far the Public Sector Banks have done well as far as lending to the priority sector is concerned.
However, it is not enough to make lending to this sector mandatory; it must be made profitable by
sharply reducing the transaction costs. This entails faster embracing of technology and minimizing
documentation.
8. Commercial Banks should be allowed to come up with their own measures to address the problem
of NPAs. This may include waiving and reducing the principal and interest on such loans, or extending
the loans, or settling the loan accounts. They should be fully authorized and they should be able to
apply all the preferential policies granted to the asset management companies.
9. Another way to manage the NPAs by the banks is Compromise Settlement Schemes or One Time
Settlement Schemes. However, under such schemes the banks keep the actual amount recovered
secret. Under these circumstances, it is necessary to bring more transparency in such deals so that any
flaw could be removed.
Markov Transition Matrix and Loan Tracking
Markov Transition theory deals with the probability of variable at a given state at any given time to
move to another state at a time t+1. We can, therefore, define a transition matrix, P = [pij], as a matrix
of probability showing the likelihood of credit quality staying unchanged or moving into R-1 category
over a given time horizon, where R is a set of discrete categories into which all observations can be
ordered.
Let me frame a matrix:
P = p11 p12 ……. p1R
p21 p22 ……. p2R
:
:
pR1 pR2 ……. pRR
where pij are the state at any given time.
The above matrix can be used by credit officers to monitor the loan assets and take preventive steps to
control the slippage of a loan assets to any lower category.

Based on the asset classification viz. Standard Assets (STD), Sub-standard Assets (SUB), Doubtful
Assets (DOUB) and Loss Assets (LOSS), a matrix can be formed with a given probability (Das &
Bose, 2005):
Time t+1
STD SUB DOUB LOSS
STD p11 p12 p13 p14
SUB p21 p22 p23 p24
Time t DOUB p31 p32 p33 p34
LOSS p41 (=0) p42 (=0) p43(=0) p44(=1)
Since the probability of a loss asset being converted to any higher asset category is zero,
p41 = p42 = p43 = 0 and thus p44 = 1.
This transition matrix can be used to assess the loan quality of a firm level borrower by evaluating the
financial position. However, this matrix will be difficult to apply to assess individual borrowers
because unlike a firm level borrower, financial data of an individual is not available. Therefore, this
matrix can be better applied for a firm level or corporate level borrower.

Ne t NPA s as a % o f T o tal Pr o fit & T o tal A s s e ts
0 0 .5
1
1.5
2
2 .5
t o T ot al
A sset s(% )
N et NPA s
t o T ot al
A sset s(% )
N et P rofit
t o T ot al
A sset s(% )
N et NPA s
t o T ot al
A sset s(% )
Ne t P rofit
t o T ot al
A sset s(% )
N et NPA s
t o T ot al
A sset s(% )
N et Profit
t o T ot al
A sset
N et NPA s
t o T ot al
A sset s(% )
2 0 0 2 -0 3 2 0 0 3 - 0 4 2 0 0 4 -0 5 2 0 0 5 -0 6
(%) P ublic Sec to r B ank s P riv a te Sec to r Bank s
F ore ign B ank s c
Figure 1 Source: Various issues of Report on Trends & Progress of Banking in India

Figure 2 Source: Jansen & Baye (1999)

Frequency Distribution of Banks according to level of NPAs
0%
10%
20%
30%
40%
50%
60%
70%
80%
90%
100%
PSBs
OPvtS
BNP
vtSB FO
RPS
BsOP
vtSB
NPvtS
B FOR
PSBs
OPvtS
BNP
vtSB FO
RPS
BsOP
vtSB
NPvtS
B FOR
PSBs
OPvtS
BNP
vtSB FO
R
2002 2003 2004 2005 2006
above 10 percent
above 5 & upto 10 percent
above 2 & upto 5 percent
upto 2 percent
Figure 3 Source: Various issues of Report on Trends & Progress of Banking in India
0%
20%
40%
60%
80%
100%
No. of
A/c
Amt.
Involv
ed(Rs
/Cr)
Amt.
Recov
ered
(Rs/Cr
)
No. of
A/c
Amt.
Involv
ed(Rs
/Cr)
Amt.
Recov
ered
(Rs/Cr
)
2003-04 2005-06
SARFAESI Act
Debt Recovery Tribunals
Figure 4 Source: Various issues of Report on Trends & Progress of Banking in India

0
10
20
30
40
50
60
(%)
Prior
ity Non-
Prior
Publi
c
Prior
ity Non-
Prior
Publi
c
Prior
ity Non-
Prior
Publi
c
Prior
ity Non-
Prior
Publi
c
2002 2003 2004 2005
SBI Group Nationalised Banks PSBs
Figure 5 Source: Various issues of Report on Trends & Progress of Banking in India

(Credit-Deposit Ratio)
0
10
20
30
40
50
60
70
80
2002 2003 2004 2005 2006
(%) All India Eastern Region Jharkhand
Figure 6 Source: Various issues of Report on Trends & Progress of Banking in India

0 200
400 600 800
1000 1200
1400 1600
SBI &
Associates
Nationalised
Banks
SBI &
Associates
Nationalised
Banks
SBI &
Associates
Nationalised
Banks
SBI &
Associates
Nationalised
Banks
SBI &
Associates
Nationalised
Banks
2001 2002 2003 2004 2005
(Rs/Cr)
Agriculture Industry Transport Operators Professional & Other Services Personal Loans Trade
Figure 7 Source: Primary Data

District-wise bad loans (from 31-03-2003 to 30-09-2006)
0
100 200 300
400 500 600 700 800 900
Amount (Rs/Lacs)
Amount (Rs/Lacs)
Amount (Rs/Lacs)
Amount (Rs/Lacs)
Amount (Rs/Lacs)
Amount (Rs/Lacs)
Ranchi Bokaro Jamshedpur Dhanbad Dumka Hazaribagh
(Rs/lacs)
State Bank of India Allahabad Bank United Bank of India Union Bank of India Bank of Baroda
Figure 8(a) Source: Primary Data

District-wise number of defaulting companies
8
4
11
3
1 1 2
3
1 2
1 1 1
0
2
4
6
8
10
12
Ranchi Bokaro Jamshedpur Dhanbad Dumka Hazaribagh
No. of Defaulting companies
State Bank of India Allahabad Bank United Bank of India Union Bank of India Bank of Baroda
(from 31-03-2003 to 30-09-2006)
Figure 8(b) Source: Primary Data

0
5
10
15
20
25
30
35
40
45
50Ba
nker
Borro
wer
Others
Banke
rBo
rrowe
rOth
ersBa
nker
Borro
wer
Others
Banke
rBo
rrowe
rOth
ersBa
nker
Borro
wer
Others
Banke
rBo
rrowe
rOth
ers
Ranchi Singbhum (E) Dhanbad Bokaro Hazaribagh Gumla
(%)
Market FailureWilful DefaultsPoor follow-upNon-cooperation from banksPoor Legal frameworkLack of EntrepreneurshipDiversion of funds
Figure 9 Source: Primary Data

References 1.Bhatia, U (1988), ‘ Predicting Corporate Sickness in India’, Studies in Banking & Finance, 7, 57-71. 2. Bhattacharya, H (2001), ‘Banking Strategy, Credit Appraisal & Lending Decisions’, Oxford University Press, New Delhi. 2. Bloem, A.M., & Goerter, C.N (2001), ‘The Macroeconomic Statistical Treatment of Non-Performing loans’, Discussion Paper, Statistics Department of the IMF, Decembere1, 2001. 3. Das, S & Bose, S.K (2005): ‘Risk Modelling – A Markovian Approach’, The Alternative, Vol.IV, No.1, March 2005, pp 22-27. 4. Das, A., & Ghosh, S (2003), ‘Determinants of Credit Risk’, Paper presented at the Conference on Money, Risk and Investment held at Nottingham Trent University, November 2003. 5. Gupta, L.C (1983): ‘Financial Ratios for Monitoring Corporate Sickness’, Oxford University Press, New Delhi. 6. Jansen, D & Baye, M (1999): ‘Money, Banking & Financial Markets –An Economics Approach’, AITBS Publishers and Distributors, New Delhi. 7. McGoven, J (1998): ‘Why Bad Loans happen to Good Banks’, The Journal Of Commercial Lending, Philadelphia, February 1998, Vol.78. 8. Mohan, R (2003): ‘Transforming Indian Banking – In search of a better tomorrow’, Reserve Bank of India Bulletin, January. 9. ______ (2004): ‘Finance for Industrial Growth’, Reserve Bank of India Bulletin,March. 10. Muniappan, G (2002): ‘The NPA Overhang Magnitude , Solution and Legal Reforms’, Reserve Bank of India Bulletin, May. 11. Nitsure, R.R (2007), ‘Corrective Steps towards Sound Banking’, Economic & Political Weekly, Vol.XLII, No.13, March. 12. Rajaraman, I & Vashistha, G (2002): ‘Non-Performing Loans of Indian Public Sector Banks – Some Panel Results’, Economic & Political Weekly, February. 13. Reddy, Y.V (2004): ‘Credit Policy, Systems and Culture’, RBI Bulletin, March. 14. Sahoo, P.K., Mishra, K.C & Soothpathy, M (1996): ‘Financial ratios as Forecasting Indicators of Corporate Health’, Finance India, 10(4), pp 955-965.