Management of Interest Rate Risk in Indian Banking · PDF fileManagement of Interest Rate Risk...
19
Munich Personal RePEc Archive Management of Interest Rate Risk in Indian Banking Vighneswara Swamy IBS Hyderabad 2013 Online at https://mpra.ub.uni-muenchen.de/58342/ MPRA Paper No. 58342, posted 5 September 2014 07:57 UTC
Transcript of Management of Interest Rate Risk in Indian Banking · PDF fileManagement of Interest Rate Risk...

MPRAMunich Personal RePEc Archive
Management of Interest Rate Risk inIndian Banking
Vighneswara Swamy
IBS Hyderabad
2013
Online at https://mpra.ub.uni-muenchen.de/58342/MPRA Paper No. 58342, posted 5 September 2014 07:57 UTC

Page 1 of 18
Management of Interest Rate Risk in Indian Banking
Dr. Vighneswara Swamy
Abstract
In a move towards effective management of interest rate risk in Indian banking, in
addition to the existing return on Interest Rate Sensitivity under Traditional Gap
Analysis, a new return is being introduced to monitor the interest rate risk using
Duration Gap Analysis (DGA), called Interest Rate Sensitivity under Duration Gap
Analysis (IRSD). The DGA involves bucketing of all Risk Sensitive Assets (RSA) and
Risk Sensitive Liabilities (RSL) as per residual maturity/re-pricing dates in various time
bands and computing the Modified Duration Gap (MDG). One of the important things
to note is that the RSA and RSL include the rate-sensitive off-balance sheet assets and
liabilities as well. MDG can be used to evaluate the impact on the Market Value of
Equity (MVE) of the bank under different interest rate scenarios. The past few years
have seen banks’ foray into financing long-term assets, such as home loans and
infrastructure projects. Banks have been allowed to raise funds through long-term
bonds with a minimum maturity of five years to the extent of their exposure of residual
maturity of more than five years to the infrastructural sector. This article attempts to
illustrate the significance of interest rate risk management and approaches towards its
management in the Indian context.
JEL classification: E40, E43, E44, G20,
Keywords: Interest Rate Risk Management, Duration Gap Analysis,
Maturity Gap Analysis, Risk Sensitivity, Modified
Duration Gap, Banking Risk
*Dr. Vighneswara Swamy is currently with IBS-Hyderabad as Associate Professor in the Finance
area. His research interests include; Financial Stability, Financial intermediation, Risk Management,
Financial Markets, Banking and Finance and Development Economics, etc. He has published several
papers in journals of International recognition as well as national level publications.
He is reachable at: *Dr. Vighneswara Swamy, Assistant Professor, Department of Finance,
IBS-Hyderabad, Dontanpally, Sankarapally Road, Hyderabad, India. Pin: 501504.
Email: [email protected], Mobile: +91-9705096919

Page 2 of 18
Introduction
Banks perform the essential function of channeling funds from the savers (surplus economic
units) to users (deficit economic units). In this though looking like a simple economic
activity, banks are exposed to very many risks; the prime being the liquidity risk. Banks can
broadly be said to perform some basic functions, viz.; (a) maturity transformation (b) risk
transformation and (c) convenience denomination. Under maturity transformation, the
financial institutions more often the banks convert the short-term liabilities into long-term
assets. By converting the risk investments into relatively less risky ones they perform the risk
transformation and by matching small deposits with the large loans and vice versa they
perform the function of convenience denomination. In addition, banks experience risk due to
macroeconomic outlook as slowdown in economic growth coupled with high inflation,
soaring interest rates and depreciating currency.
Presently, the Reserve Bank monitors the interest rate risk of banks through a monthly return
on interest rate sensitivity using the Traditional Gap Analysis (TGA). The focus of the TGA
is to measure the level of a bank’s exposure to interest rate risk in terms of sensitivity of its
NII to interest rate movements over usually a one-year time horizon. It involves bucketing of
all Rate-Sensitive Assets (RSA) and Rate-Sensitive Liabilities (RSL) and off-balance sheet
items as per residual maturity/re-pricing date in various time bands and computing Earnings
at Risk (EaR) or the loss of income under different interest rate scenarios over one year.
In addition to the existing return on Interest Rate Sensitivity under Traditional Gap Analysis,
a new return is being introduced to monitor the interest rate risk using Duration Gap Analysis
(DGA), called Interest Rate Sensitivity under Duration Gap Analysis (IRSD). The DGA
involves bucketing of all Risk Sensitive Assets (RSA) and Risk Sensitive Liabilities (RSL) as
per residual maturity/re-pricing dates in various time bands and computing the Modified
Duration Gap (MDG). One of the important things to note is that the RSA and RSL include
the rate-sensitive off-balance sheet assets and liabilities as well. MDG can be used to evaluate
the impact on the Market Value of Equity (MVE) of the bank under different interest rate
scenarios. The past few years have seen banks’ foray into financing long-term assets, such as
home loans and infrastructure projects. Banks have been allowed to raise funds through long-
term bonds with a minimum maturity of five years to the extent of their exposure of residual
maturity of more than five years to the infrastructural sector. Hence, the time buckets viz;

Page 3 of 18
‘over 5 years and up to 7 years’, ‘above 7 years and up to 10 years’ and ‘over 10 years and up
to 15 years’ and ‘over 15 years’, have been incorporated in the new return.
The step-by-step approach for computing modified duration gap has been detailed in the
Reserve Bank circular (DBOD.No.BP.BC.59/21.04.098/2010-11) dated November 4, 2010.
Banks will be required to compute their interest rate risk position, in each currency (including
Rupees) by applying DGA to RSA and RSL items in that currency, where either the
assets/liabilities are 5 per cent or more of the bank’s total global assets/liabilities. The interest
rate risk position in all other residual currencies has to be computed separately on an
aggregate basis. The framework prescribed is aimed at determining the impact on the MVE
arising from changes in the value of interest rate sensitive positions across the whole bank
i.e., both in the banking and trading books. Banks are required to submit the report on interest
rate sensitivity as per DGA in the stipulated format on a monthly basis with effect from April
30, 2012. Given this background, this article attempts to illustrate the significance of interest
rate risk management and approaches towards its management in the Indian context.
Interest Rate Risk
Owing to the very nature of business, banks are required to accept the interest rate risk not by
chance but by choice. When a bank’s assets and liabilities do not reprice at the same time, the
result is a change in net interest income. The change in the value of assets and the change in
the value of liabilities will also differ, causing a change in the value of stockholder’s equity.
Banks typically focus on either Net interest income or the market value of stockholders'
equity. Interest rate risk can be defined as the potential loss from unexpected changes in
interest rates, which can significantly alter a bank’s profitability and market value of equity.
IRR is the risk of a decline in earnings due to the movements of interest rates. It can also be
explained as risk arising from the mismatching of the maturity and the volume of banks’
assets and liabilities as part of their asset transformation function. The amount at risk is a
function of the magnitude and direction of interest rate changes and the size and maturity
structure of the mismatch position. If interest rates rise, the cost of funds increases more
rapidly than the yield on assets, thereby reducing net income. If the exposure is not managed
properly, it can erode both the profitability and shareholder value.
Interest rate risk is the risk where changes in market interest rates affect a bank’s financial
position. Changes in interest rates impact a bank’s earnings through changes in its Net

Page 4 of 18
Interest Income (NII). Changes in interest rates also impact a bank’s Market Value of Equity
(MVE) or Net Worth through changes in the economic value of its rate-sensitive assets,
liabilities and off-balance sheet positions.
Broadly, interest rate risk, according (BCBS) 2004) could be classified as (1) Repricing risk,
(2) Basis risk (3) Yield curve risk and (4) Embedded option risk.
Figure-1: Types of Interest Rate Risks
Repricing Risk
Repricing Risk arises on account of mismatches in rates and can be measured by the measure
of risk in different time buckets. If interest rates change, the bank will have to reinvest the
cash flows from assets or refinance rolled-over liabilities at a different interest rate in the
future. If interest rates change, the market values of assets and liabilities also change. The
longer is duration, the larger is the change in value for a given change in interest rates. An
increase in rates, ceteris paribus, increases a bank’s interest income but also increases the
bank’s interest expense. Illustration presented here below explains the occurrence of repricing
risk due to change in interest rates.

Page 5 of 18
Table-1: Interest rate risk due to mismatched repricing periods of assets/liabilities
Liabilities Assets Spread
Capital
(INR Crore)
@
ROI
Maturity Investment
(INR crore)
@ ROI Maturity (INR Crore)
Scenario-1
500
8% 91 days 500 Fixed Rate
10%
91 days Profit
2% (2.49)
Scenario-2
500
9% 91 days 500 Fixed Rate
8%
91 days Loss
1% (1.24)
Scenario-3
500
A case of
Asset
Sensitivity
8% 91 days 500 Float Rate
10%(1st
month)
60 days Profit
2% (1.64)
Float Rate
11%(2nd
month)
30 days Profit
3% (1.23)
Total: 2.87
Scenario-4
500
A case of
Liability
Sensitivity
9% 5 years 500 Fixed Rate
10%
5 years Profit
1% (25)
Basis Risk
When the costs of liabilities and the yields of assets are linked to different benchmarks
resulting in a floating rate and there is no simultaneous matching movement in the benchmark
rates leads to basis risk. Interest rates on assets and liabilities do not change in the same
proportion. Interest rates movement is based on market perception of risk and also market
imperfections. Therefore, basis risk arises when interest rates of different assets and liabilities
change in different magnitudes. The `basis’ form of Interest Rate Risk (IRR) results from the
imperfect correlation between interest adjustments when linked to different index rates
despite having the same re-pricing characteristics. Basis risk arises when the benchmark rates
like base rate, bank rate, repo rates, and deposit rates are altered.
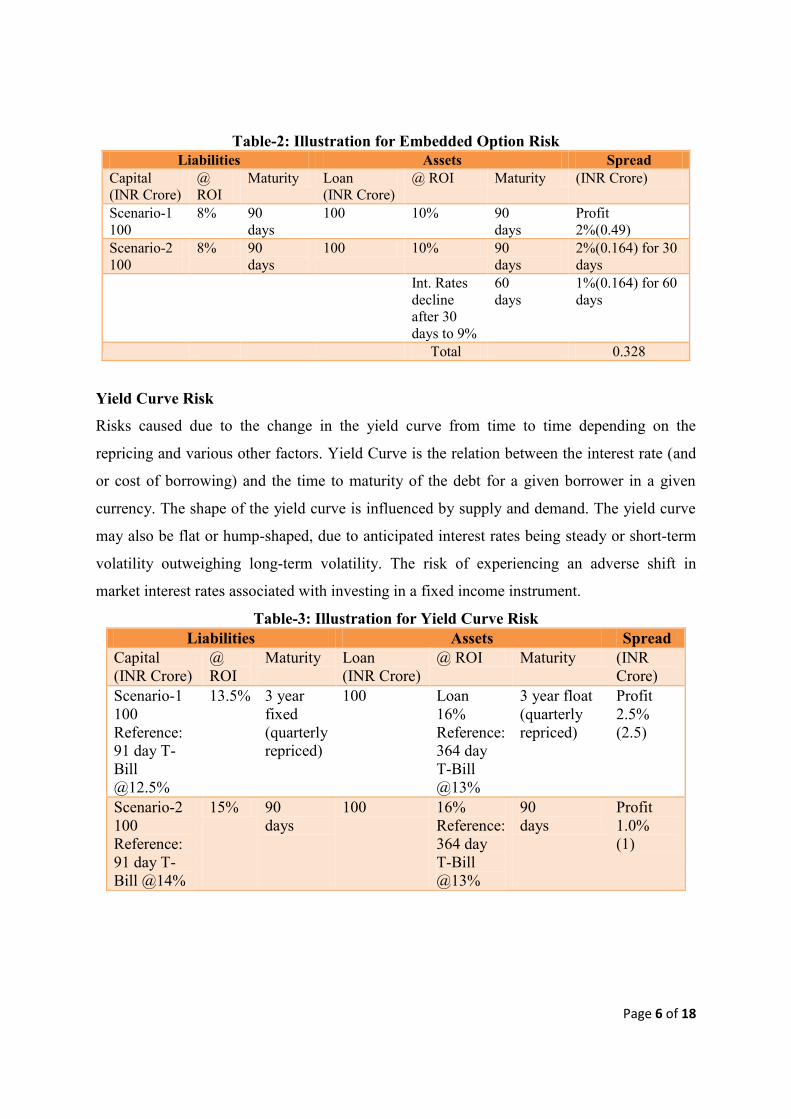
Embedded Option Risk
Embedded option risk arises due to the risks arising out of prepayment of loans and bonds
(with put or call options) and / or premature withdrawal of deposits before their stated
maturity dates. Presented here below is the illustration of the embedded option risk.
Page 6 of 18
Table-2: Illustration for Embedded Option Risk
Liabilities Assets Spread
Capital
(INR Crore)
@
ROI
Maturity Loan
(INR Crore)
@ ROI Maturity (INR Crore)
Scenario-1
100
8% 90
days
100 10% 90
days
Profit
2%(0.49)
Scenario-2
100
8% 90
days
100 10% 90
days
2%(0.164) for 30
days
Int. Rates
decline
after 30
days to 9%
60
days
1%(0.164) for 60
days
Total 0.328
Yield Curve Risk
Risks caused due to the change in the yield curve from time to time depending on the
repricing and various other factors. Yield Curve is the relation between the interest rate (and
or cost of borrowing) and the time to maturity of the debt for a given borrower in a given
currency. The shape of the yield curve is influenced by supply and demand. The yield curve
may also be flat or hump-shaped, due to anticipated interest rates being steady or short-term
volatility outweighing long-term volatility. The risk of experiencing an adverse shift in
market interest rates associated with investing in a fixed income instrument.
Table-3: Illustration for Yield Curve Risk
Liabilities Assets Spread
Capital
(INR Crore)
@
ROI
Maturity Loan
(INR Crore)
@ ROI Maturity (INR
Crore)
Scenario-1
100
Reference:
91 day T-
Bill
@12.5%
13.5% 3 year
fixed
(quarterly
repriced)
100 Loan
16%
Reference:
364 day
T-Bill
@13%
3 year float
(quarterly
repriced)
Profit
2.5%
(2.5)
Scenario-2
100
Reference:
91 day T-
Bill @14%
15% 90
days
100 16%
Reference:
364 day
T-Bill
@13%
90
days
Profit
1.0%
(1)

Page 7 of 18
Need for Effective Management of IRR
Several macroeconomic factors like; level of fiscal deficit, inflation level, capital flows,
exchange rates and balance of payments positions and other factors affect the interest rates to
fluctuate. India’s large fiscal deficit and signs of economic revival are factors that are
expected to contribute to a rise in rates. In addition, as the fiscal situation is not improving,
there is the possibility of higher monetization of public debt that could change inflationary
expectations and push up the long rate.
On the asset side of a bank balance sheet, the bulk of corporate credit in India tends to be in
the form of floating-rate loans. These are effectively of a low duration. On the liability side of
the balance sheet, for the commercial banking system as a whole in India, short-term time
deposits and demand deposits, constitute about 50 percent of total deposits. Duration
mismatches between loans and advances on the asset side and deposits on the liability side
are typically not very large. On the other hand, the bulk of government bonds are fixed-rate
products. They have a higher duration than the typical credit portfolio. Movement of interest
rates thus normally has a bigger impact on the investment portfolio of a bank. The relatively
flat yield curve in recent years has reduced interest margins from the traditional ‘maturity
transformation’ function of banking. This may have encouraged banks to look at their
investment portfolios as a source of profit. This tendency, as well as difficulties in creating
sound processes for handling credit portfolios, has led some banks to hold government
securities in excess of reserve requirements.
Approaches to Measure and Manage IRR
The interest rate risk can thus be viewed from two perspectives, viz., ‘earnings perspective’,
and ‘economic value perspective’. Generally, the former is measured using the Traditional
Gap Analysis (TGA) and the latter is measured using more sophisticated Duration Gap
Analysis (DGA). Some of the well-known approaches to quantify IRR are; (i) Maturity Gap
Analysis (ii) Rate Adjusted Gap (iii) Duration Gap Analysis (iv) Value-at-Risk (VaR) (v)
Hedging (vi) Sensitivity Analysis and (vii) Simulation and Game theory.

Page 8 of 18
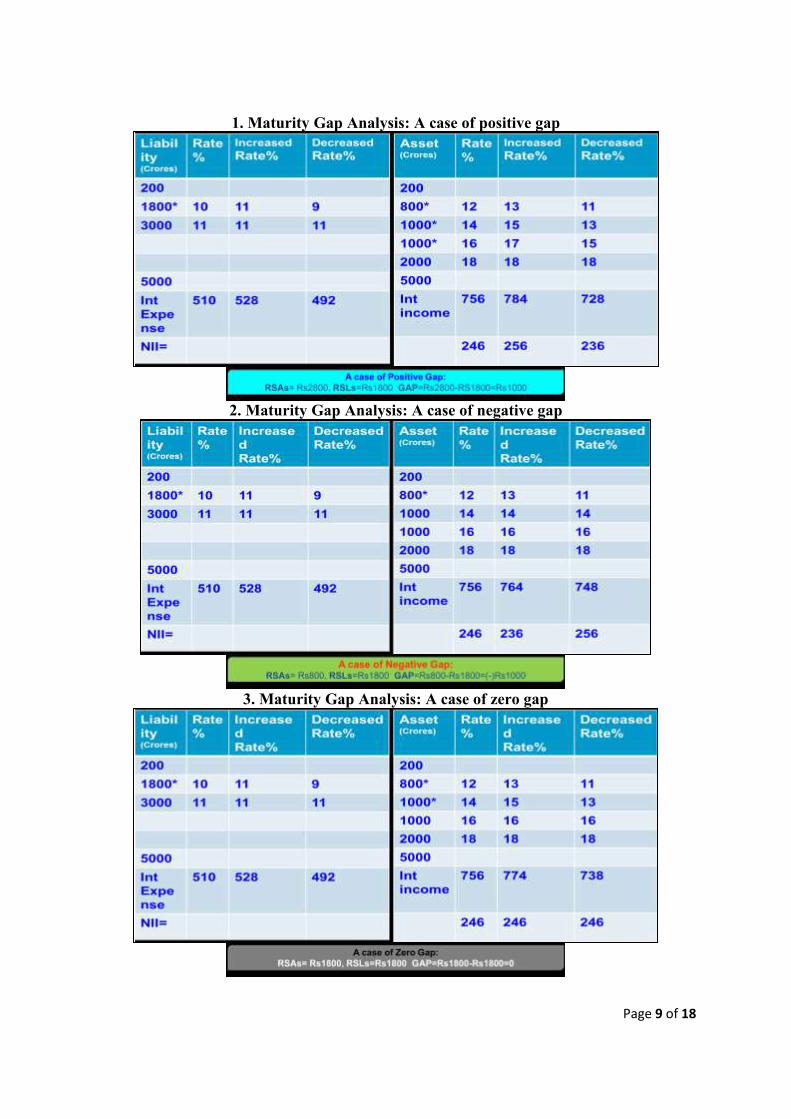
Maturity Gap Analysis
Maturity Gap Analysis (MGA) distributes interest rate sensitive assets, liabilities and OBS
positions into a certain number of predefined time bands according to their maturity(if fixed
rate) or time remaining to their next repricing(if floating rate). This asset-liability
management technique aims to tackle the interest rate risk and highlights the gap that is
between the RSAs and RSLs, the maturity periods of the same and the gap period. The
objective MGA is to improve the net interest income in the short run over discreet periods of
time called the gap periods. Under MGA, the risk sensitive assets and risk sensitive liabilities
are grouped into ‘maturity buckets’ based on maturity and the time until the first possible
repricing due to change in the interest rates. The gap is then calculated by considering the
difference between the absolute values of the RSAs and RSLs.
Rate Sensitive Gap (RSG) = RSAs-RSLs
Three Options under the gap analysis:
(1) RSA>RSL= Positive Gap; (2) RSL>RSA= Negative Gap; (3) RSL=RSA= Zero Gap
Page 9 of 18
1. Maturity Gap Analysis: A case of positive gap
2. Maturity Gap Analysis: A case of negative gap
3. Maturity Gap Analysis: A case of zero gap

Page 10 of 18
Impact of Interest Rate Volatility on the Net Interest Income [Illustration-1]
Impact of Interest Rate Volatility on the Net Interest Income [Illustration-2]
Maturity
pattern
RSL-
Outflows
RSA-
Inflows
GAP
(RSA-RSL
Change in NII
for 0.5% decrease
1-14 days 15145 12360 -2785 13.93
15-28 days 26555 22555 -4000 20.00
29 days-3 months 61250 52650 -8600 43.00
3-6 months 80000 78000 -2000 10.00
6-One year 95000 93500 -1500 7.50
1-upto 3 years 105000 102000 -3000 15.00
3-upto 5 years 111000 118000 7000 (-)35.00
Above 5 years 115000 125000 10000 (-)50.00
Based on the understanding of the nature of the risk sensitive gap during different scenarios,
the following abstract about the desirable mismatches to gain advantage during such
scenarios could be structured.
Scenario Rising interest
rate scenario
Stable interest rate
scenario
Falling interest
rate scenario
Positive mismatch in IRS Favourable No impact Adverse
Negative mismatch in IRS Adverse No impact Favourable
No mismatch in IRS No impact No impact No impact
Different strategies that are to be adopted for different interest rate scenarios is presented here
below.
IMPACT OF INCREASE / DECREASE IN RATE OF INTEREST ON NII
COL1 COL2 COL3 COL4 COL5
Maturity pattern RSL - OUTFLOWS RSA - INFLOWS GAP - RSA - RSL CHANGE IN NII FOR
0.25 % DECREASE
1- 14 DAYS 18785.27 15920.09 -2865.18 7.16
15 - 28 DAYS 31772.55 31161.34 -611.21 1.53
29 DAYS - 3 MTS 68403.39 77914.78 9511.39 (-23.78)
3-6 MONTHS 87629.72 90673.27 3043.55 (-7.61)
6-ONE YEAR 101260.22 98917.23 -2342.99 5.86
ONE - 3 YEARS 108310.71 106316.51 -1994.2 4.99
3-5 YEARS 114558.21 124538.91 9980.7 (-24.95)
ABOVE 5 YRS 134964.33 137905.36 2941.03 -7.35

Page 11 of 18
Interest Rate Scenarios and Appropriate Strategies
Factors Affecting Net Interest Income are (i) Changes in the level of interest rates (ii)
Changes in the composition of assets and liabilities and (iii) Changes in the volume of
earning assets and interest-bearing liabilities outstanding
Limitations of Maturity Gap Analysis
• To a larger extent depends on the accuracy level of the forecasts made regarding the
quantum and the direction of the interest rate changes
• While gap measurement is easy, gap management is quite difficult.
• It assumes that change in interest rates immediately affects all RSAs and RSLs
• Ignores Time Value of Money
Rate Adjusted Gap
Though MGA assumes a uniform change in the interest rates for all assets and liabilities, in
reality, however, it may not be the case, primarily due to two reasons. Firstly, the market
perception towards the change in interest rate may be different from the actual rise/fall in the
interest rates. Secondly, the reason for differential rise/fall in interest rates of assets/liabilities
can be the presence of certain regulation.
Rate Adjusted Gap = ( RSA1 * WA1 + RSA2 * WA2 + ……. )
- ( RSL1 * W1 + RSL2 * W2 + ……. )
Where, WA1 , WA2, …. are Weights of the corresponding RSAs
WL1 , WL2, …. are Weights of the corresponding RSLs
Thus, by assigning weights the gap could be altered from positive to negative vice versa.
Having done away with the assumption of a uniform change in interest rates of
Page 12 of 18
assets/liabilities, the Rate Adjusted Gap (RAG) methodology seems to be superior to the
MGA. In RAG, all the rate sensitive assets and liabilities are adjusted by assigning weights
based on the estimated change in the rate for different assets/liabilities for a given change in
interest rates.
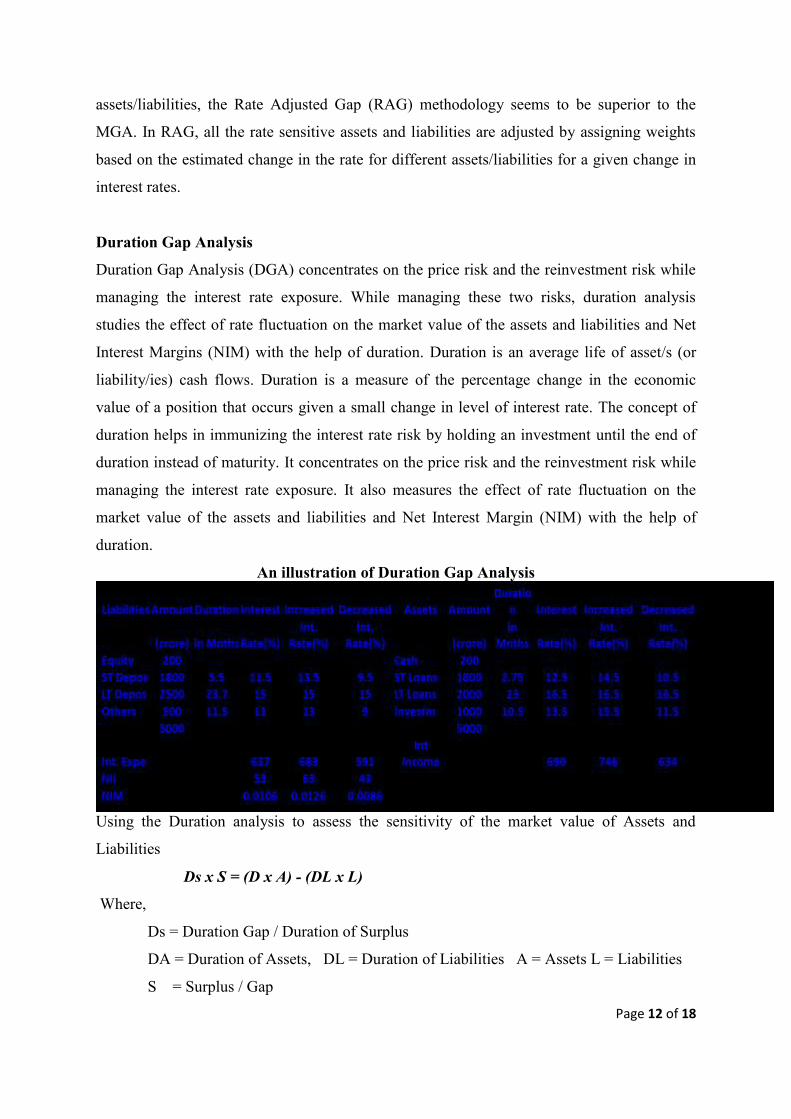
Duration Gap Analysis
Duration Gap Analysis (DGA) concentrates on the price risk and the reinvestment risk while
managing the interest rate exposure. While managing these two risks, duration analysis
studies the effect of rate fluctuation on the market value of the assets and liabilities and Net
Interest Margins (NIM) with the help of duration. Duration is an average life of asset/s (or
liability/ies) cash flows. Duration is a measure of the percentage change in the economic
value of a position that occurs given a small change in level of interest rate. The concept of
duration helps in immunizing the interest rate risk by holding an investment until the end of
duration instead of maturity. It concentrates on the price risk and the reinvestment risk while
managing the interest rate exposure. It also measures the effect of rate fluctuation on the
market value of the assets and liabilities and Net Interest Margin (NIM) with the help of
duration.
An illustration of Duration Gap Analysis
Using the Duration analysis to assess the sensitivity of the market value of Assets and
Liabilities
Ds x S = (D x A) - (DL x L)
Where,
Ds = Duration Gap / Duration of Surplus
DA = Duration of Assets, DL = Duration of Liabilities A = Assets L = Liabilities
S = Surplus / Gap
Page 13 of 18
Substituting L = A – S in the above eqn. We get
Ds = DL + (A / S) x (DA - DL)
When there is a market fluctuation,
-D (∆ r) x Current MV
MV = ------------------------------------------
(One + r)
Where, ∆MV = Change in the market value, D = Duration of assets or liabilities
∆ r = Change in the interest rate, r = Current interest rate, MV = Market Value
Then, New MV = Current MV + MV
The steps for an effective DGA are as below:
Forecast interest rates
Estimate the market values of bank assets, liabilities and stockholders’ equity
Estimate the weighted average duration of assets and the weighted average
duration of liabilities
Incorporate the effects of both on- and off-balance sheet items. These
estimates are used to calculate duration gap
Forecasts changes in the market value of stockholders’ equity across different
interest rate environments
Limitations of DGA
Managing interest rate risk by simply changing the composition of the assets and liabilities
though feasible involves considerable transaction costs, unwanted size of the balance sheet
and lack of flexibility. Further, forecast of future cash flows is a prerequisite for computation
of duration. The accuracy of these forecasts in case of loans is relatively low due to defaults
and prepayments unlike in bonds. Since the impact of rate fluctuations will be varying
depending on the nature of assets, it will be necessary to identify different cash flows. Once
the duration is fixed for a portfolio, the duration will not decline in tandem with the passage
of time. In other words, a passage of one year in time will not result in a decline of duration
by one year. Hence, it requires continues rebalancing of a portfolio. This increases the
transaction costs. Some of the weaknesses of DGA include (i) It is difficult to compute
duration accurately (ii) “Correct” duration analysis requires that each future cash flow be
discounted by a distinct discount rate (iii) A bank must continuously monitor and adjust the

Page 14 of 18
duration of its portfolio (iv) It is difficult to estimate the duration on assets and liabilities that
do not earn or pay interest and (v) Duration measures are highly subjective.
Value at Risk
Value at Risk (VaR) offers an alternative framework for risk measurement. To calculate the
VaR with respect to interest rate risk of a bank, at a 99 percent level of significance for a one-
year horizon, we are required to go through the following steps:
1. Model the data generating process for the spot yield curve,
2. Simulate N draws from the yield curve on a date one year away,
3. Reprice assets and liabilities at each of these draws,
4. Compute the 1st percentile of the distribution of profit/loss seen in these N
realizations.
This procedure is difficult to implement, primarily because the existing state of knowledge on
the data generating process for the yield curve is weak. The procedure that is adopted can be
interpreted as a limited and much simplified version of VaR. Firstly; the focus is on parallel
shifts of the yield curve as the prime source of risk. This is the assumption made in existing
BIS proposals. It is a simplification because it ignores risks that arise from other types of
fluctuations of the yield curve. Secondly, the BIS proposal suggests that the distribution of
one-year changes in the long rate should be utilized to read off the 1st percentile point. This is
yet again a simplification, given the fact that a daily time-series of overlapping one-year
changes in the long rate exhibits violations of independence. Thirdly, we need to compute the
profit/loss consequences of this interest rate shock. Further, we are aware that the profit/loss
associated with a 1st percentile event on the interest rate process is not the 1
st percentile of the
distribution of profit/loss, given the non-linearities of transformation in computing NPV. The
procedure normally adopted, that is widely used in industry, and consistent with existing BIS
proposals, may at best be interpreted as a poor approximation of VaR at a 99 percent level of
significance on a one-year horizon. If VaR is the correct tool for interest rate risk
measurement, this framework clearly entails substantial model risk.
Hedging
Hedging is another approach of managing interest rate risk with the use of derivative
securities like; swaps, futures and options. This approach has been found to a better approach
in situations especially where there is a maturity mismatch. For example, when liabilities are

Page 15 of 18
mostly short-term in nature and assets are long-term, the easier method of financing the
assets, rather than trying to match the maturing periods, is by the use of derivative securities.
Sensitivity Analysis
It allows management to incorporate the impact of different spreads between asset yields and
liability interest costs when rates change by different amounts. The sensitivity of an
asset/liability can be assessed by the quantum of increase/decrease in the value of the
assets/liabilities of varying maturities due to the interest rate fluctuations. Based on the
sensitivity, all the assets/liabilities are rearranged. The sensitivity model than suggests the
assessment of the gap between the assets and liabilities having a similar sensitivity index to
the interest rate fluctuations. Further action will be taken to manage help so as to restrict the
interest rate risk.
Some of the steps for an effective sensitivity analysis are as below:
Forecast future interest rates
Identify changes in the composition of assets and liabilities in different rate
environments
Forecast when embedded options will be exercised
Identify when specific assets and liabilities will reprice given the rate environment
Estimate net interest income and net income
Repeat the process to compare forecasts of net interest income and net income
across different interest rate environments
In the case of Earnings Sensitivity Analysis (ESA), Earnings-at-Risk is the potential variation
in net interest income across different interest rate environments, given different assumptions
about balance sheet composition, when embedded options will be exercised, and the timing
of repricing. It demonstrates the potential volatility in earnings across these environments.
The greater is the potential variation in earnings (earnings at risk), the greater is the amount
of risk assumed by a bank, or the greater is the maximum loss, the greater is risk.
Simulation and Game theory
Simulation is done by varying the interest rate structures to predict the short/medium/long
term implications of the same. A simulation of performance under alternative interest rate
scenarios is made and the resulting volatility in NII / NIM / ROA / ROE / MVE is assessed.
A financial model incorporating inter-relationship of assets, liabilities, prices, costs, volume,

Page 16 of 18
mix and other business related variables is made. Computer generated scenarios about future
and response to that in a dynamic way are made use of for the simulation analysis.
For simulation technique, data requirement is enormous in terms of (i) Maturity and repricing
(ii) Rate scenarios (iii) Alternative management response under different scenarios (iv) Yield
curves (v) Prepayment tables (vi) Behavioural pattern of assets and liabilities and (vii)
Consistency of assumptions. Some of the advantages of Simulation technique are (a) Forward
looking (b) Dynamic (c) Lessens the role of crisis management (d) Increases the value of
strategic planning (e) Enhances capability of analysis (f) Interpretation easy and (g) Timing
of cash flows captured accurately. At the same time, some of the disadvantages of Simulation
technique are (1) Accuracy depends on quality of data, strength of the model and validity of
assumptions (2) Time consuming (3) Huge investment in computer (4) Requires highly
skilled personnel and (5) Analysis paralysis
Benefits from IRR management
Effective IRR management offers several benefits namely; (1) Defined financial targets based
on corporate risk tolerances (2) Reduced earnings volatility (3) Improved cash flow
forecasting (4) Improved corporate credit ratings (5) Defined risk management and hedge
methodologies. Based on the quantity of interest rate risk and quality of interest rate risk
management, evaluate the adequacy of the bank’s capital. Determine the component rating
for sensitivity to market risk. Determine further the effect of interest rate and earnings on the
business in a macroscopic view.
Current Indian Scenario
Interest rate risk measurement can be done by inspecting assets and liabilities classified into
maturity buckets, and computing the ‘gap’ between assets and liabilities, in each time bucket.
A bank can compute the gap statement where each component is classified into a time bucket
based on time to repricing. In India, this ‘interest rate risk statement’ is computed by banks
and submitted to the regulator, the Reserve Bank of India. The statement is, however, not
required to be made public. Public disclosure consists of what is called ‘the liquidity
statement,’ which shows the maturity distribution where each component is classified based
on the time to maturity. If gap analysis had to be undertaken by independent analysts, then
this would require imputation of the interest rate risk statement using public disclosures.

Page 17 of 18
While gap analysis reveals mismatches at various maturities, it does not offer a mechanism
for reducing them into a single scalar measure of the vulnerability of the bank, and in judging
the economic significance of the vulnerability. Indian banks are required to disclose a
statement on the maturity pattern of their assets and liabilities classified in different time
buckets. The time bands used in the ‘statement of structural liquidity’ are 1–14 days, 15 to 28
days, 29 days to 3 months, 6 months to 1 year, 1 to 3 years, 3 to 5 years and greater than 5
years. Relative differences in each maturity bucket – represents the sensitivity in that band.
Globally, banks often use interest rate derivatives to hedge interest rate risk. In India, though
the Reserve Bank of India (RBI) guidelines advise banks to use forward rate agreements and
interest rate swaps to hedge interest rate risks, these markets are quite shallow. The
measurement and monitoring of interest rate risk in most banks, especially in public sector
banks, which constitute 75 percent of the banking system, remains largely, focused on the
earnings approach. While some banks show an awareness of modern notions of interest rate
risk, most banks appear to focus on the traditional ‘earnings perspective.’ The interest rate
risk statement is also based on the earnings approach. Banks are required to submit this
statement to the RBI.
Conclusion
With respect to IRR monitoring and control issues, it is requisite on the part of banks to
capture all material IRR exposures, whether in their trading or banking books, within their
management systems. Operating limits and related practices for keeping IRR exposures
within levels consistent with internal policies have to be clearly established and enforced.
Moreover, all IRR modeling assumptions and parameters must be well documented and
updated with reasonable frequency. Stress testing should be regularly used to assess the
bank’s interest rate sensitivity and examine the appropriateness of key modeling assumptions.
Stress test results must be contemplated when establishing and reviewing IRR policies and
procedures. A bank should have adequate information systems for reporting accurate IRR
exposure information on a timely basis to its board of directors and senior management.
Finally, effective IRR management systems require regular evaluations by independent
auditors, whether internal or external. The banks need to be aware that banks’ IRR
management techniques continue to evolve, so certain details of their guidelines will need to
be updated. However, the principle that banks’ own assessments of their IRR exposures
Page 18 of 18
should form the basis of supervisory oversight is a defining characteristic of future
supervisory efforts.
References
Basel Committee on Banking Supervision (BCBS) 2004. “Principles for the Management
and Supervision of Interest Rate Risk.”
Available at http://www.bis.org/publ/bcbs108.pdf
Lopez, J.A. 2004. Supervising Interest Rate Risk Management, FRBSF Economic Letter,
Number 2004-26, September 17, 2004, Economic Research, Federal Reserve Bank of
San Francisco, P.O. Box 7702, San Francisco, CA 94120
RBI Guidelines on Asset Liability Management Practices in Banks, http://www.rbi.org.
Vighneswara Swamy (2011). “Risk Management in Financial Institutions”. ISBN-13:978-1-
12-134521-8 ISBN-10 1-12-134521-2 Publisher: McGraw Hill Custom Publishing