Management Of Inorganic Sulfur containing Wastes - Final ... · MANAGEMENT OF INORGANIC SULFUR...
72
MANAGEMENT OF INORGANIC SULFUR CONTAINING WASTES Final Technical Report Grant No. 85-3526 Submitted By: Jy S. Wu, Ph.D, P.E. Department of Civil Engineering University of North Carolina at Charlotte Charlotte, NC 28223 Submitted To: North Carolina Board of Science and Technology Pollution Prevention Pays Program P.0.Box 27687 Raleigh, NC 27611-7687 July 1986
Transcript of Management Of Inorganic Sulfur containing Wastes - Final ... · MANAGEMENT OF INORGANIC SULFUR...

MANAGEMENT OF INORGANIC SULFUR CONTAINING WASTES
Final Technical Report
Grant No. 85-3526
Submitted By:
J y S. Wu, Ph.D, P.E. Department of Civil Engineering
University o f North Carolina at Charlotte Charlotte, NC 28223
Submitted To:
North Carolina Board o f Science and Technology Pollution Prevention Pays Program
P.0.Box 27687 Raleigh, NC 27611-7687
J u l y 1986 -
DISCLAIMER
Any o p i n i o n s , f i n d i n g s , and c o n c l u s i o n s expressed i n t h e
p u b l i c a t i o n a r e those o f t h e a u t h o r and do n o t n e c e s s a r i l y
r e f l e c t t h e v iews o f t h e f u n d i n g agencies.
f

i
SUMMARY
Thiosulfate is an inoraanic sulfur comPound of environmental significance. It originaies from sulfu; d textile finishing, flotation mill treating lea pulp mill , coal carbonizing, refinery and industries. B i odegradat i on of t h i osul fate depletion and acidification o f surface waters. also known as an antichlor which increases ch water treatment. It is desirable that thiosu from waste effluents.
The ooals of this Dro.iect were to examine
e manufacturing, -zinc ore, kraft certain chemical
causes oxygen Thiosulfate is
orine demands in fate be removed
the treatment and . " recovery options for managing thiosulfate waste stream. In general, these goals have been met.
A strategy involving the treatment of thiosulfate and an organic feed was developed. The treatment process was an extended aeraton activated sludge process containing a mixed population of heterotrophs and thiobacillus. At hydraulic detention times of 24 and 48 hours, the process was operative at thiosulfate loadings as high as 5.0 and 7.5 grams o f thiosulfate per reactor volume per day, respectively, and the settleability of the activated sludge was satisfactory.
An innovative approach was developed to totally solidify the thiosulfate waste stream, resulting in a "zero discharge" of the waste effluent. The approach involes (a) the removal of trace organic impurities from the waste stream using activated carbon column, and ( b ) crystallization of thiosulfate salt from the supersaturated solution. The entire crystallization process can be complete in less than two hours.
In addition, several articles have been published:
1. "Biodegradation of Sodium Thiosulfate Under Controlled pH Extended Aeration Conditions," M.S. Thesis, John Blevins, University of North Carolina at Charlotte, 1985.
2. "Biodegradation of Thiosulfate Waste," J.S. Wu and J. Blevins, presented at the 1985 Triangle Conference of Environmental Technology, Raleigh, N.C., 1985.
3. "Treatment of Thiosulfate Waste Using Extended aeration Activated Sludge Process," J.S. Wu, to be presented at the 1986 AIChE Summer National Meeting, Section of "High Strength Waste Treatment Options", Boston, August 1986.

i i
ACKNOWLEDGEMENTS
This project was funded in part by the North Carolina Board
of Science and Technology, under the "Pollution Prevention Pays"
program. Additional funding was provided by the College of
Engineering of the university of North Carolina at Charlotte and
the Sandoz Chemicals Corporation in Charlotte. John Blevins,
Weng Lin and Fred Wu, graduate students i n the Department of
Civil Engineering, served as research assistants.

iii
TABLE OF CONTENTS
S e c t i o n Page
INTROj-JUCTION ................................................ 1
RESEARCH OBJECTIVES ......................................... 1
BACKGROUND INFORMATION ...................................... 2
1 . P h y s i c a l and Chemical P r o p e r t i e s o f T h i o s u l f a t e ..... 2 2 . B i o l o g i c a l O x i d a t i o n o f T h i o s u l f a t e ................. 8 3 . O x i d a t i o n Pathways .................................. 8 4 . Batch A c t i v a t e d Sludge S t u d i e s ....................... 11 5 Cont inuous A c t i v a t e d Sludge S t u d i e s 12 6 . Recovery o f I n o r g a n i c S a l t s .......................... 12
EXPERIMENTAL INVESTIGATION .................................. 14
. ..................
1 . Ba tch A c t i v a t e d Sludge Exper iment ................... 14 2 . Cont inuous A c t i v a t e d S1 udge Exper iment .............. 16 3 . C r y s t a l l i z a t i o n ..................................... 16
ANALYTICAL PROCEDURES ........................................ 16
RESULTS AND D I S C U S S I O N ....................................... 18
1 . A c c l i m a t i o n t o T h i o s u l f a t e ........................... 18 2 . Batch B i o d e g r a d a t i o n R e s u l t s ......................... 20 3 . Cont inuous A c t i v a t e d Sludge Process .................. 20
Stage 1: Organ ic Feed and Pure T h i o s u l f a t e ......... 24 Stage 2: Organ ic Feed and T h i o s u l f a t e Waste Stream . 25
4 . C r y s t a l l i z a t i o n ..................................... 26
CONCLUSIONS AND RECOMMENDATIONS .............................. 35
LITERATURE CITED ............................................ 36
A P P E N D I X A : A n a l y t i c a l Procedures ......................... 38
APPENDIX B : Exper imenta l Data - Stage 1 41 ...................

i v
LIST O F FIGURES Figure Number Page
1. S t r u c t u r a l Formulas o f S u l f u r Compounds ..................... 3
2 . E f f e c t s o f Sodium S u l f a t e on the S o l u b i l i t y o f T h i o s u l f a t e .. 6
3. Cxidat ion Mechanism o f T h i o s u l f a t e .......................... 9
4 . Oxidat ion Mechanism o f T h i o s u l f a t e .......................... 1 0
5 . Screening o f Ion ic Compound Recovery Technologies ........... 13
6 . Continuous Act iva ted Sludge Reactor U n i t .................... 17
7 . NLSS i n Batch Act iva ted Sludge Reactor ...................... 19
8. Degradation o f T h i o s u l f a t e ................................. 22
9 . Var i a t ions i n pH D u r i n g T h i o s u l f a t e Degradation ............. 22
1 0 . Biodegradat ion o f T h i o s u l f a t e a t 1 .5 ppm Phosphate w i t h pH Control ................................................. 23
11. pl-l Control ............................................... 23
1 2 . Appearance of C r y s t a l l i z i n g T h i o s u l f a t e S l u r r y ............. 28
Biodegradat ion o f T h i o s u l f a t e a t 1 . 5 ppm Phosphate wi thout
13 , Schematic Representa t ion of T h i o s u l f a t e C r y s t a l l i z a t i o n Experiment ............................................... 29
14. Laboratory Act iva ted Carbon Column ........................ 31
1 5 , Appearance o f Recovered T h i o s u l f a t e S a l t ................... 34

V
LIST O F TABLES
Table Number
1 . 2 . 3 . 4 . 5 . 6 . 7 . 8 . 9 .
10 .
11 .
Oxidation S t a t e o f Inorganic S u l f u r Compounds ........... S o l u b i l i t y o f T h i o s u l f a t e So lu t ion ...................... S p e c i f i c Gravi ty of T h i o s u l f a t e So lu t ion ................ S y n t h e t i c Feed Composition ............................... Batch Act ivated Sludge Degradation o f T h i o s u l f a t e ....... Steady Performance o f the Act ivated Sludge Process ...... Steady Performance o f the Act ivated Sludge Process ...... Temperature o f C r y s t a l l i z i n g T h i o s u l f a t e S o l u t i o n ....... Adsorption Isotherm Data f o r T h i o s u l f a t e Waste Stream ... Recorded Temperature f o r T h i o s u l f a t e Waste Stream
Composition of Recovered T h i o s u l f a t e S a l t
C r y s t a l l i z a t i o n Experiments ........................... ...............
4
5
7
15
2 1
24
26
27
30
32
33
.
.
.
.

MANAGEMENT OF INORGANIC SULFUR CONTAINING WASTES
Jy S. Wu, Ph.D, P.E. Department of Civil Engineering
University of North Carolina at Charlotte
INTRODUCTION
antomycotic and anti sources of thiosu manufacturing, text zinc ore, kraft pulp chemical industries.
B iodearada t ion
Thiosulfate is an inorganic sulfur compound of environmental significance. It is used commercially as photographic fixer, dechlorinating agent in the bleaching industry, fertilizer in the form of ammonium salt, reducing agent for chemical analysis, and
arasitic agents in dermatology. Industrial fate wastes originate from sulfur dye le finishing, flotation mill treating lead- mill, coal carbonizing, refinery and certain
of thiosulafte causes oxygen depletion and acidification of surface waters. Thiosulfate is also known as an antichlor which increases chlorine demands in water treatment. Therefore, it is desirable that thiosulfate be removed from waste ef fl uents.
RESEARCH OBJECTIVES
The overall objective of research was to examine the treatment and recovery options for managing thiosulfate waste stream. The current statewide program of "pollution prevention pays" has encouraged industries t o implement a1 ternate waste management practices with an emphasis on waste reduction, recovery, and reuse as a viable economic solution. This research has responded to such a need and served as a pioneer project for recovery of inorganic salts.
An improved biological treatment scheme for thiosulfate waste stream was studied. The scheme employed an extended aeration activated sludge process for treating the combined stream of thiosulfate and organic wastes. The rate of biodegradation of the combined stream was studied, using batch activated sludge experiments.

2
The recovery of thiosulfate salt was based on a seeded crystallization process which provided a total solidification of the thiosulfate stream, resulting in "zero discharge" of the waste effluent. Some pretreatment of the thiosulfate stream was necessary to remove organic impurities, prior to crystallization.
This project also represents a cooperative industry- university venture for process research and development.
BACKGROUND INFORMATION
1. Physical and Chemical Properties of Thiosulfate
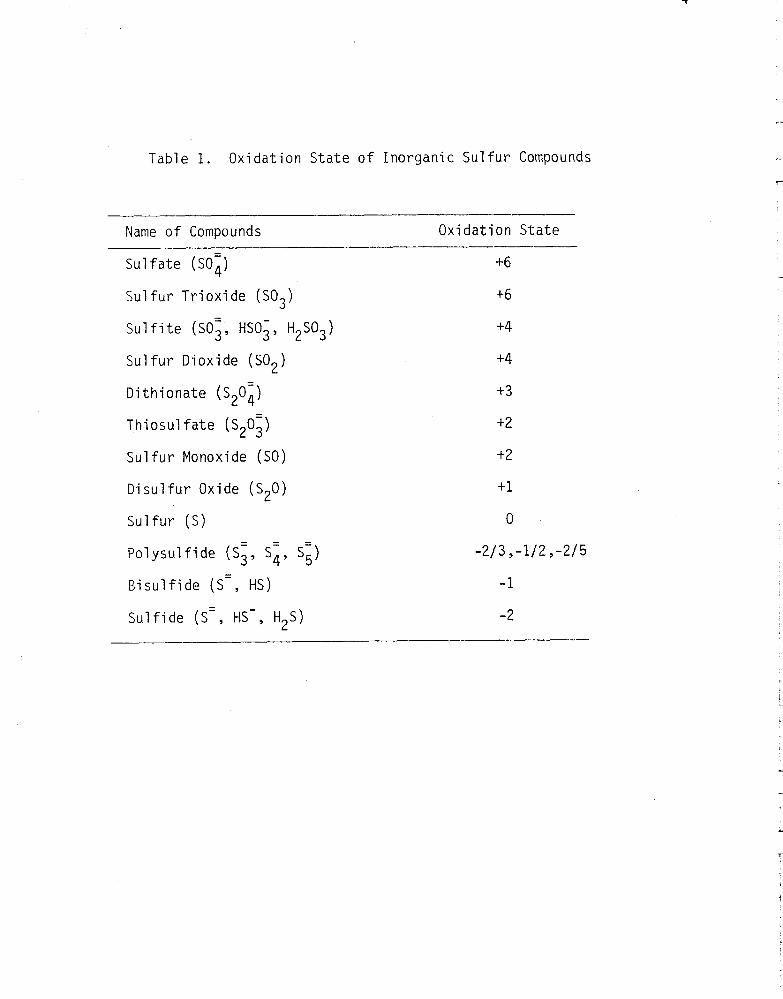
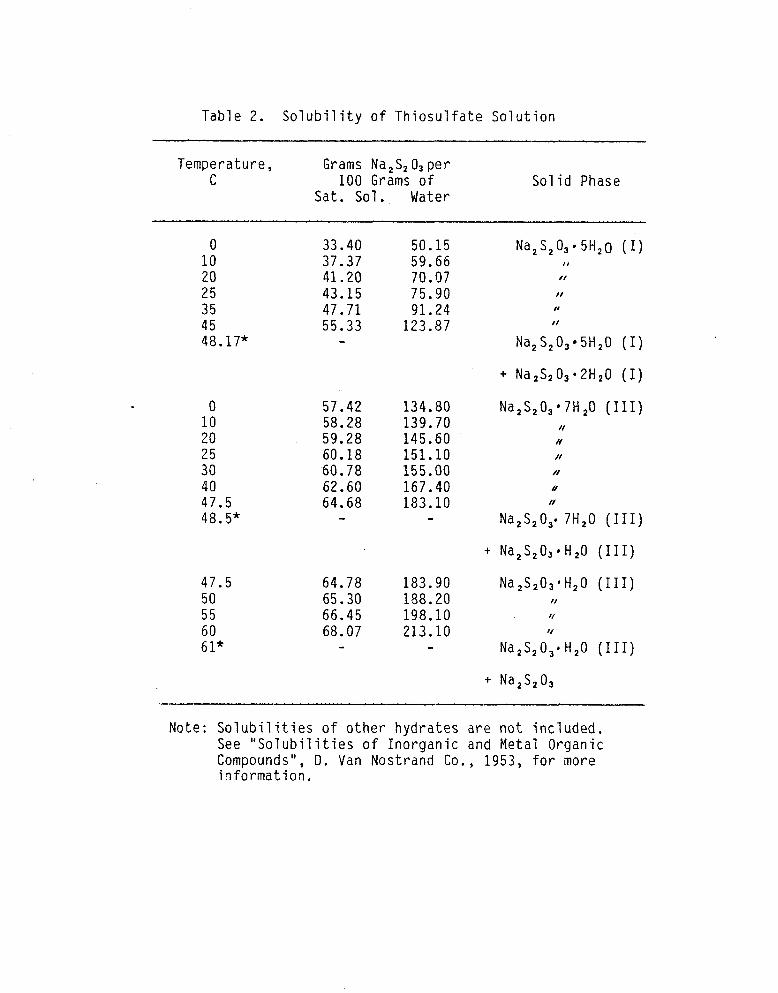
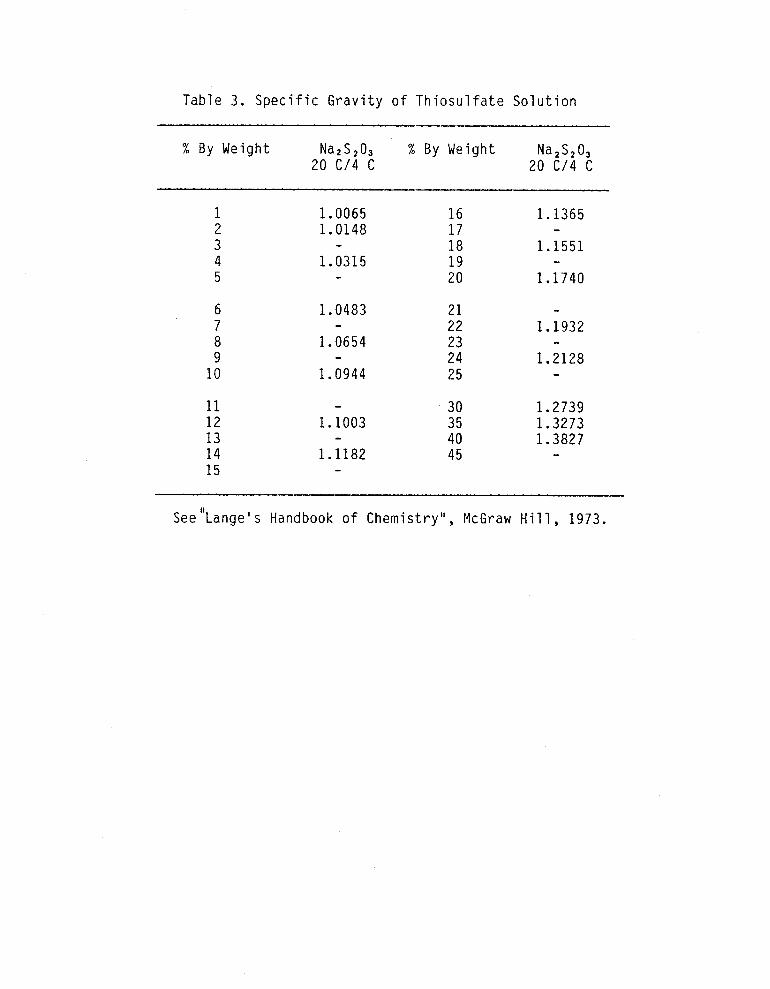
The structural formulas of sulfur compounds and the oxidation states o f various inorganic sulfur compounds are presented in Figure 1 and Table 1, respectively. Table 2 provides information on the solubility of thiosulfate in aqueous solutions, In the table, those hydrates belonging to group (I) are called primary hydrates, and those beloning to groups (11), (111) ( I V ) and ( V ) are called secondary, tertiary, quaternary and quintary hydrates, respectively. The transition of hydrates occurs in such a way that the members of one group undergo transition into members of the same group but not into members of another group. The solubility o f thiosulfate is affected by the presence of inorganic salts, e.g. sodium sulfate (see Figure 2 ) , and organic compounds such as ethyl alcohol. Specific gravity o f thiosulfate solution is given in Table 3 .
as related to the degree of hydration.
Thiosulfate can be oxidized to sulfate or reduced to sulfides, depending on the redox reactions involved. It is relatively stable at neutral pH and its aqueous solution can be autoclaved with little or no decomposition. The decomposition of thiosulfate can be enhanced by the catalytic action o f metal ions, e.g. silver ion. In alkaline solution, thiosulfate decomposes into sulfide and sulfate (or sulfite):
- OH- - S ~ O ~ c_____)) S- + SO, (or S O = )
3 At pH below 4 to 5, thiosulfate decomposes rapidly in a
complex manner:
Strongly acidic medium:
Medium Acidity:
S 2 0 i --* RS[12R (sulfones)

3
Inorganic Forms
S u l f u r i c Acid H SO 2- 4
S u l f i t e so, Sul f a t e so; Tri t h i o n a t e s 30; Di t h i o n a t e s20;
Hydrogen Sul f i d e H2S
Organic Forms
Mercaptans H - S - R
Methyl Benzyl
H - S - CH3
H - S - C6H5 Disu l f ides R - S - S - R
Methyl CH3 - S - S - CH3
S U I f i d e s R - S - R
Methyl CH3 - S - CH3
n-Butyl C4Hg - S - C4Hg Alkyl S u l f a t e s R - 0, // 0
S R - 0' * O
C - H H - C
H - C C - H
/ s, Thiophene
I I II
T h i o s u l f a t e s205 Sul f i de S =
T e t r a t h i o n a t e s40g
Pen ta th iona te s5Og Elemental Sul f u r S o
Sul foxides I? - S - R I I 0 0 I I
II 0
Sul fones R - S - R
0
0 ' / /
Sul fon ic R
H - 0 /
Acids
CH 2
( C H 2 I n
Cycl i c
' I Sul f i des \
s
Figure 1. S t r u c t u r a l Formulas of Sul f u r Cornpounds
4
Table 1. Oxidat ion S t a t e o f Inorganic S u l f u r Compounds
Name o f Compounds Oxidat ion S t a t e
s u l f a t e (SO;) +6
Sul fur Tri oxi de ( S O 3 ) +6
S u l f i t e ( S O ; , HSO;, H ~ S O ~ ) +4
S u l f u r Dioxide (SO2) +4
Di th iona te (S20i ) +3
T h i o s u l f a t e (S20i) +2
S u l f u r Monoxide (SO) +2
Di su l fur Oxide (S20)
S u l f u r ( S )
+1
0 -
P o l y s u l f i d e ( S i , S i , Sg ) - 2 / 3 ¶-1/2 ,-2/5
B i s u l f i d e (S=, HS) -1
S u l f i d e (S=, HS-, H,S) -2 L
5
Table 2. Solubility of Thiosulfate Solution
Temperature, Grams Na,S, O3 per
Sat. S o l . Water C 100 Grams o f Solid Phase
0 10 20 25 35 45 48.17*
0 10 20 25 30 40 47.5 48.5*
47.5 50 55 60 6 1*
33.40 37.37 41.20 43.15 47.71 55.33 -
57.42 58.28 59.28 60.18 60.78 62.60 64.68 -
64.78 65.30 66.45 68.07 -
50.15 59.66 70.07 I /
75.90 / I
91.24 123.87
#I
I /
Na,S,O,*SH,O (I)
+ Na,S203*2H20 (I)
134.80 139.70 145.60 151.10 155.00 167.40 183.10 -
Na,S,03*7H,0 (111) I1
N
N
//
U
N
Na,S,O,. 7H,O (111)
+ Na,S,03~H,0 (111)
183.90 Na,S,OJ~H,O (111) 188.20 / I
198.10 r/
213.10 I/
- Na,S,O,~ H,O (111)
-+ Na,S,O,
Note: Solubilities o f other hydrates are not included. See "Solubilities of Inorganic and Metal Organic Compounds", D. Van Nostrand Co., 1953, for more i n format i on.

6
60
50
40
30
20
10
0
10 20 30 40 0
S o l u b i l i t y , g/100 g o f s a t . s o l u t i o n
E f f e c t s o f Sodium S u l f a t e on t h e
Sodi um Sul f a t e
F i g u r e 2. S o l u b i l i t y o f Sodium T h i o s u l f a t e
7
Table 3. Specific Gravity of Thiosulfate Solution
% By Weight Na2S20, % By Weight Na2S203 20 CI4 c 20 c / 4 c
6 7 8 9
10
11 12 13 14 15
1.0065 1.0148
1.0315 - -
1.0483
1.0654
1.0944
- -
- 1.1003
1.1182 - -
16 17 18 19 20
21 22 23 24 25
30 35 40 45
1.1365
1.1551
1.1740
- -
- 1.1932
1.2128 -
1.2739 1.3273 1.3827 -
See'ILange's Handbook of Chemistry", McGraw Hill, 1973.

8
Weakly acidic medium:
s o=.-w + HSO; (bisulfite) 2 3
2. Biological Oxidation of Thiosulfate
Thiosulfate can be oxidized to polythionates and ultimately
chemoautotrophic sulfur bacteria, (b) photosynthetic sulfur bacteria, and (c) certain heterotrophic bacteria and some fungi. Members of the first group, e.g. Thiobacillus, oxidize sulfur compounds to sulfate as the principal source of energy for growth, and use carbon dioxide as the carbon source. The photosynthetic sulfur bacteria depend on sun light for growth and oxidize sulfur compounds as a source of biological reducing potential. The third group of heterotrophic bacteria utilizes organic substrates for energy and carbon sources,and carries out limited oxidation of sulfur sompounds (Kelly, 1968). In the activated sludge treatment environment, heterotrophs and, particularly, thiobacillus are the two predominant types of microorganisms responsible for thiosulfate degradation.
to sulfate by three groups o f microorganisms: (a)
The genus thiobacillus comprises a small number of closely related species, including mainly thiobacillus thioparus, deni trif icans , thSooxidans, ferrooxidans , thiocyanoxidans, novellus and others. They are gram negative, non-spore forming rods, measuring from 0.5 to 1.3 microns, which, except the nonmotile thiobacillus novellus, are polarly flagellated (Vishniac and Santer, 1975). These microorganisms are obligate autotrophic with the exception of thiobacillus novellus which grows on organic substrates. Thiobacillus thiooxidans can tolerate extremely acidic conditions. Other strains vary in their tolerence toward the acid environment.
3. Oxidation Pathways
Two distinctly different mechanisms, which may not be mutually exclusive, were described for the oxidation of thiosulfate by thiobacillus, see Figures 3 and 4 (silver, 1978). In the first mechanism, thiosulfate is cleaved by the enzyme rhodanese or thiosulfate reductase with the formation of bound or free sulfite. Sulfite is then oxidized to sulfate via the intermediate formation of adenosine phosphate ( A P S ) , or by a cytochrome c-mediated oxidation.
Alternatively, two molecules of thiosulfate may condense to form tetrathionate. Sulfite is then hydrolyzed in two yet

Bio-oxi d a t i o n Mechanism I
Rhodanese
Thiosul f a t e Reductase S ~ O ~ ( + a c c e p t o r ) w s03 + ( a c c e p t o r - ) S
APS Reductase A D P so; + AMP A P S A D P + SO,
Sul fury1 a se
Sul f i te-Cytochrome c SO, t Cytochrome-c ( o x i d a t i o n ) p SO; t Cytochrome-c
Oxidoreductase (Reduct ion)
Figure 3 . Oxidation Mechanism o f T h i o s u l f a t e
i l I 1 I

10
o x 0
S 0-0 W -r W c,
Id
I1 co 0 d
v)
II M 0 v, u H I
u .. aJ Id z: .- aJ
E h N S w 0 ET
N
-0
X 0
*r
*I-
.I-
t II co 0 d
v)
> S 0
ll d -I-
0 c,
S L L
% II c3 0 N
m -L c,
In .?-
I
1 -
i-
ll cr) 0 m
+ II M 0 v,
I
II M 0 N m
f
- t

11
unc ha r ac t e r i zed r e a c t i on s w i t h t h e i n t e rmed i a t e r egen e r a t i on o f t h i o s u l f a t e . The s u l f i t e t h u s formed can t h e n be o x i d i z e d t o s u l f a t e by one o r b o t h o f t h e mechanisms d e s c r i b e d p r e v i o u s l y .
The energy i n v o l v e d i n t h e d i r e c t and i n t e r m e d i a t e c o n v e r s i o n o f t h i o s u l f a t e t o s u l f a t e i s summariz?d as f o l l o w s :
( a ) Condensat ion t o f o r m t e t r a t h i o n a t e
2s20; r- ~ ~ 0 % + 2e- AF = - 18 k c a l
s 4 0 i + 502 + 6e- - - t 4 S O i
2 ~ ~ 0 % IC s50; + s30; AF = 4 k c a l
S , O i + 302 + 4e- -3SO;
AF = -100 k c a l
( b ) T e t r a t h i o n a t e t o f o rm p o l y t h i o n a t e s
- AF = -355 k c a l
( c ) D i r e c t c o n v e r s i o n t o s u l f a t e -
S203 + 202 + H20 -SO: + H2S04 AF = -211 k c a l
4. Ba tch A c t i v a t e d Sludge S t u d i e s
The use o f t h i o b a c i l l u s t h i o p a r u s f o r t h i o s u l f a t e d e g r a d a t i o n was conducted u s i n g Warburg r e s p i r o m e t e r exper imen ts (San te r e t a l . , 1960) . Th ioparus was found t o c o m p l e t e l y c o n v e r t t h i o s u l f a t e t o s u l f a t e i n t h e presence o f i n o r g a n i c phosphate which c o n t r o l s t h e r a t e s o f t h i o s u l f a t e o x i d a t i o n . The r e q u i r e m e n t o f phosphate appears t o be on a s u b s t r a t e l e v e l , s i n c e i n t h e absence o f phosphate a t l e a s t one i d e n t i f i a b l e s u l f u r compound o f t e t r a t h i o n a t e was shown t o accumulate. The accumulated t e t r a t h i o n a t e was subsequen t l y o x i d i z e d t o s u l f a t e upon t h e a d d i t i o n o f i n o r g a n i c phosphate.
The e f f e c t s o f temperature, pH, i n o r g a n i c n u t r i e n t s and heavy m e t a l s on t h i o s u l f a t e o x i d a t i o n were examined u s i n g b o t h pu re and m i x t u r e c u l t u r e s ( S i l v e r and Dinardo, 1981). The feed medium c o n t a i n e d thiosalt-phosphate-ammonimum i n a r a t i o o f 2000: 5:16. The optimum tempera tu re and i n i t i a l pH f o r g rowth were a t 30 degree c e n t i g r a d e s and 3.75, r e s p e c t i v e l y , f o r b o t h c u l t u r e s . T h i o s u l f a t e was n o t o x i d i z e d by t h i o o x i d a n s when t h e i n i t i a l pH va lues were below 3.0 o r above 5.5, n o r by t h e mixed c u l t u r e a t pH above 6.0. The mixed c u l t u r e c o u l d be a c c l i m a t i z e d t o degrade t h i o s u l f a t e 3 t o 4 weeks. maximal r a t e s o f d e s t r u c t i o n occu r red a t c o n c e n t r a t i o n s o f ammonium i o n
a t pH v a l u e s as h i g h as 8.0 a f t e r a l a g p e r i o d o f For a t h i o s a l t c o n c e n t r a t i o n o f 2,000 ppm,

12
above 2 ppm, and in the presence of 1 ppm of phosphate ion. Above 1 to 2 ppm of phosphate concentrations, phosphate ion appeared to have a slighly inhibitory effect.
The effects of nutrients and environmental conditions on thiosulfate degradation in batch activated sludge experiments were investigated by Jacquez (1976) . The synthetic feed was made of thiosulfate and other inorganic nutrients. Ammonium nitrogen in the concentration range o f 5 to 35 ppm was found to influence the overall oxidation only to a very limited extent. The oxidation of thiosulfate was followed by an accumulation of polythionates, a gradual production of sulfate, and a substantial decrease in pH. The cultures feeded by 1, 10 and 100 ppm phophorus completely exhausted the supply o f thiosulfate in 180, 135 and 140 hours, respectively. Polythionates decreased gradually in the absence of thiosulfate. At a phosphorus concentration o f 1000 ppm, the overall oxidation of thiosulfate was greatly suppressed although polythionates and sulfate were produced during the earlier stages.
5. Continuous Activated Sludge Studies
The use of continuous activated sludge process in treating thiosulfate was reported by Graham (1962). With influent thiosulfate concentrations ranged from 1,000 to 10,000 mg/l (equicalent to thiosulfate loadings of 0.8 to 9.0 g/day-liter of reactor volume), the treatment process was able to achieve 95 to almost 100% thiosulfate removal. Other studies of thiosulfate treatment have also been reported in the literature (Eccles, 1971; Dagon, 1973; Kreye et al., 1973; Garrison et al., 1973 and Watkins, 1977). In genernal, the most commonly encountered problems in treating thiosulfate by the continuous activated sludge process are: (a) poor sludge settleability, (b) foam formation, (c) low pH conditions that adversely affect the metabolism of the heterotrophs, and (d) deposition of elemental sulfur outside the bacterial cell.
6. Recovery of Inorganic Salts
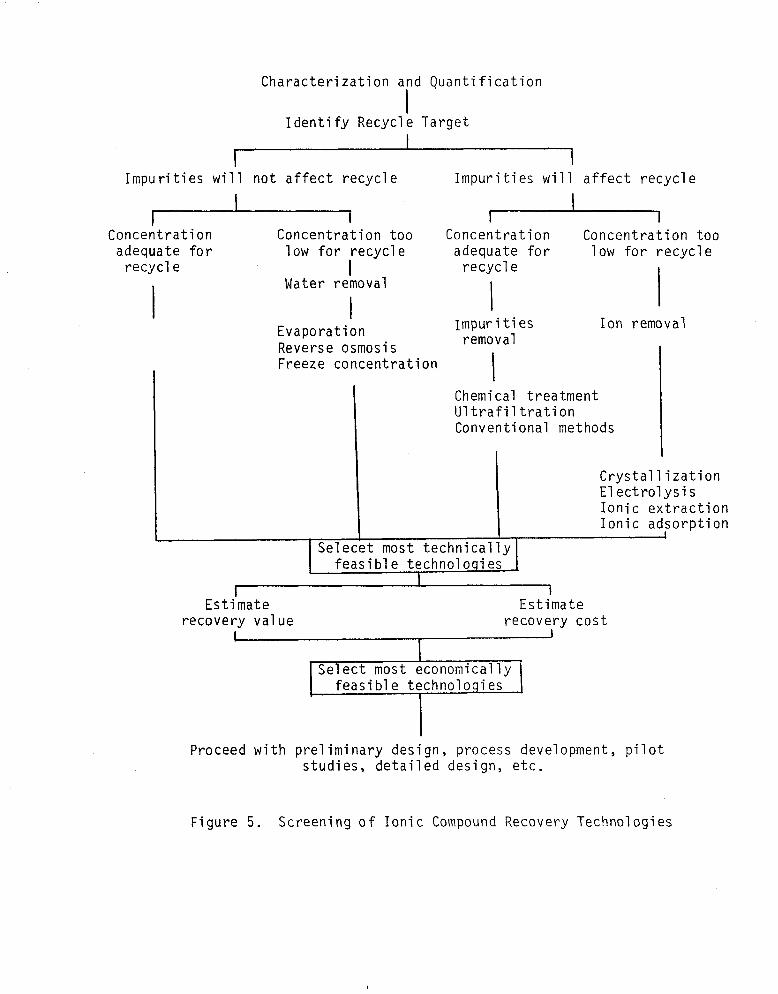
A screening methodology for the recovery of ionic compounds is presented in Figure 5. As seen from this figure, the available options for the recovery of thiosulfate salt include: crystallization, electrolysis, ionic extraction and ionic adsorption. In this research, the choice of crystallization was based on a local industry's need for one of its plant's operation.
As a waste stream is concentrated, the concentration of dissolved salt reaches its solubility limit and becomes super-
13
Charac te r i za t ion and Ouan t i f i ca t ion
Iden t i f y Recycle Target
Impur i t ies wi l l n o t a f f e c t r ecyc le Impur i t i e s wi l l a f f e c t r ecyc le
Concentrat ion Concentrat ion too Concentrat ion Concentrat ion too adequate for 1 ow for recycl e adequate f o r 1 ow f o r r e c y c l e
I recycl e I r ecyc le
Ion removal I I
Water r emov a1
Impur i t i e s r emo v a 1
I Evaporation Reverse osmosis Freeze concent ra t ion
I
Chemical t r ea tmen t U l t r a f i l t r a t i o n Conventional methods
Crystal 1 i z a t i o n E l e c t r o l y s i s Ion ic e x t r a c t i o n Ion ic adsorp t ion
S e l e c e t most t e c h n i c a l l y
1 f e a s i b l e techno1 o q i es
I I Est i mat e Est imate
recovery Val ue recovery c o s t 1 I
I S e l e c t most economical l y 1
f e a s i b l e technolo i e s I Proceed w i t h p re l iminary des ign , process development , p i l o t
s t u d i e s , d e t a i l e d des ign , e t c .
Figure 5. Screening o f Ioni c Compound Recovery Techno1 ogi e s

14
saturated. Upon cooling, crystallization occurs and the crystallized salt can be recovered. The application of crystallization in water treatment was reported by Nancollas and Michael (1974). The use of crystal-seeding method to accelerate the crystallization process was studied for lime-softening sludge (Judkins and Wynne, 1972), strontium sulfate (Campell and Nancollas, 1969), and di-calcium phosphate dihydrate (Marshall and Nancollas, 1969). Several excellent texts on crystallization are also avalable (Jancic and Grootscholten, 1984; Brice, 1973; Garside and Mullin, 1978) .
EXPERIMENTAL INVESTIGATION
1. Batch Activated Sludge Experiment
Batch activated sludge experiments were conducted to examine the effects of pH and phosphorus concentrations on the rates of degradation of thiosulfate.
Four bactch reactors, each with an effective volume of 2.0 liters, were used in this phase of study. The initial bacterial seed was obtained from two separate sources. The bacterial seed of thiobacillus was from a dye manufacturing company which operates an in-house activated sludge treatment plant for thiosulfate waste. The heterotrophic population was from a municipal wastewater treatment plant. These two bacterial sources were mixed and acclimated to a synthetic feed whose composition is shown in Table 4. Note, the synthetic feed was made of an organic feed and sodium thiosulfate. The organic feed was considered representative o f the composition of domestic sewage and sodium thiosulfate in the form of crystal salt was used.
During the acclimation period, three reactors were fed with the synthetic feed at a daily thiosulfate loaing of 1.0 grams of thiosulfate per reactor volume (1 g/d-1). The fourth reactor was used as a control and was fed with the organic feed only. Air was supplied to each reactor at approximately 2.0 liters per minute. After 23 hours of aeration, the air supply was discontinued and the sludge was allowed to settle for one hour. One liter of the supernatant was withdrawn from each reactor and replaced by an equivalent volume of the feed solution. Aeration was resumed after the replacement by fresh feed. Phosphorus levels were adjusted by the addition of an appropriate amount of a 1 mg/ml stock solution of potassium phosphate. Initial pH for each reactor was maintained at 7 to 7.8 using sodium bicarbonate.

15
Table 4. S y n t h e t i c Feed Composi t ion
C o n s t i t u e n t mg/ l
I
Organic Feed
COD (Bacto-Peptone)
Ammonium S u l f a t e , as N
Magnesium Su l fa te , as Mg
Manganese Su l fa te , as Mn
Calc ium Chor ide, as Ga
F e r r i c C h l o r i d e , as Fe
Sodium B ica rbona te , as CaC03
Potassium Phosphate, as PO,
T h i o s u l f a t e I n g r e d i e n t
Sodium T h i o s u l f a t e , as S,03
300
12
9
2
3
0.1
100
1.5
v a r i a b l e
1 6
2. Continuous Activated Sludge Experiment
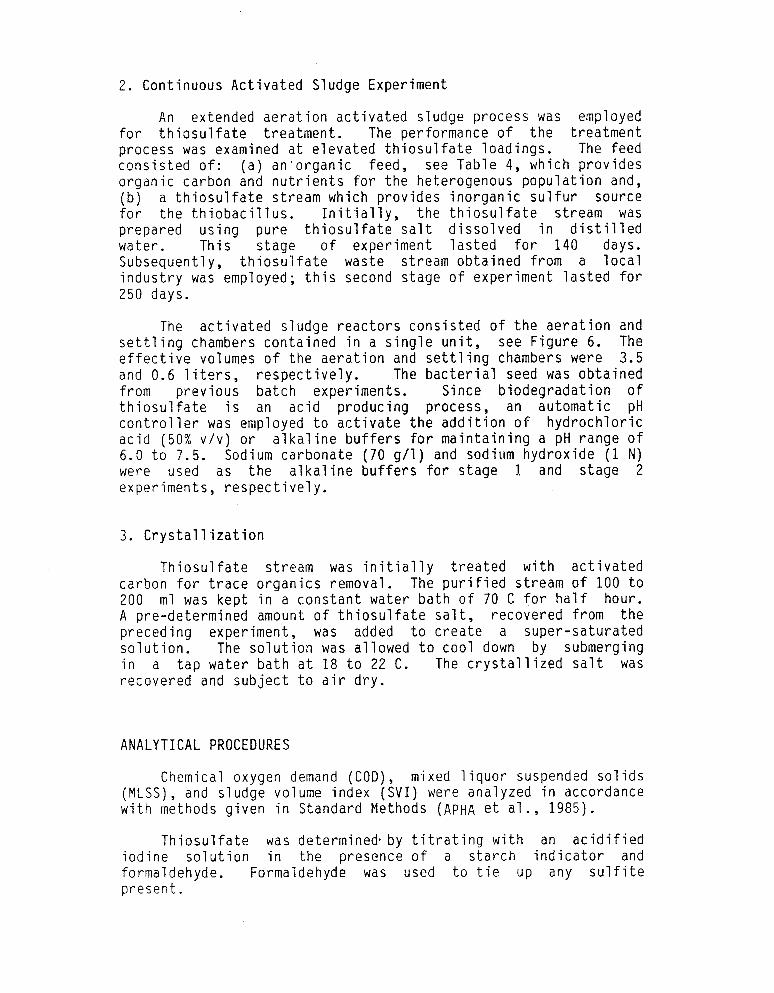
An extended aeration activated sludge process was employed for thiosulfate treatment. The performance of the treatment process was examined at elevated thiosulfate loadings. The feed consisted of: (a) an organic feed, see Table 4, which provides organic carbon and nutrients for the heterogenous population and, (b) a thiosulfate stream which provides inorganic sulfur source for the thiobacillus. Initially, the thiosulfate stream was prepared using pure thiosulfate salt dissolved in distilled water. This stage of experiment lasted for 140 days. Subsequently, thiosulfate waste stream obtained from a local industry was employed; this second stage of experiment lasted for 250 days.
The activated sludge reactors consisted of the aeration and settling chambers contained in a single unit, see Figure 6. The effective volumes of the aeration and settling chambers were 3.5 and 0.6 liters, respectively. The bacterial seed was obtained from previous batch experiments. Since biodegradation of thiosulfate is an acid producing process, an automatic pH controller was employed to activate the addition o f hydrochloric acid (50% v/v) or alkaline buffers for maintaining a pH range of 6.0 to 7.5. Sodium carbonate (70 g/1) and sodium hydroxide (1 N) were used as the alkaline buffers for stage I. and stage 2 experiments, respectively.
3. Crystal1 ization
Thiosulfate stream was initially treated with activated carbon for trace organics removal. The purified stream of 100 to 200 ml was kept in a constant water bath of 70 C for half hour. A pre-determined amount of thiosulfate salt, recovered from the preceding experiment, was added to create a super-saturated solution. The solution was allowed to cool down by submerging in a tap water bath at 18 to 22 C. The crystallized salt was recovered and subject to air dry.
ANALYTICAL PROCEDURES
Chemical oxygen demand (COD), mixed liquor suspended solids (MLSS), and sludge volume index (SVI) were analyzed in accordance with methods given in Standard Methods ( A P H A et al., 1985).
Thiosulfate was determined. by titrating with an acidified iodine solution in the presence of a starch indicator and formaldehyde. Formaldehyde was used to tie up any sulfite present.

17
Figure 6 . Continuous Ac t iva t ed S l u d g e Reactor U n i t

18
S u l f i t e was de termined by t h e same procedure b u t w i t h o u t t h e a d d i t i o n o f formaldehyde and i t s c o n c e n t r a t i o n was taken as t h e d i f f e r n e n c e between t h e two t i t r a t i o n s .
T e t r a t h i o n a t e was measured by a s u l f i t e r e d u c t i o n method. An excess amount o f sodium s u l f i t e was added t o t h e sample f o r r e d u c i n g t e t r a t h i o n a t e t o t h i o s u l f a t e under an a l k a l i n e c o n d i t i o n . Formaldehyde was then added t o t i e up any excess s u l f i t e . The sample was t i t r a t e d w i t h an a c i d i f i e d i o d i n e s o l u t i o n u s i n g a s t a r c h i n d i c a t o r . The d i f f e r e n c e between t h e l a t t e r t i t r a t i o n and t h e i n i t i a l t i t r a t i o n o f t h i o s u l f a t e gave t h e measurement o f t e t r a t h i o n a t e .
S u l f a t e was de termined by f i r s t removing any t h i o s u l f a t e and s u l f i t e p r e s e n t w i t h t h e a d d i t i o n o f i o d i n e . Anions were t h e n removed u s i n g a s t r o n g c a t i o n exchange r e s i n . An a l i q u o t o f t h e sample was t i t r a t e d w i t h bar ium c h l o r i d e i n an a c i d i f i e d a l c o h o l env i ronment w i t h t h e presence o f t h o r i n i n d i c a t o r .
Appendix A p resen ts a s tep -by -s tep procedure f o r t h e a n a l y s i s o f t hese i n o r g a n i c s u l f u r compounds.
RESULTS A N D DISCUSSION
1. A c c l i m a t i o n t o T h i o s u l f a t e
The mixed b a c t e r i a l seed had a p u r p l e t o dark c o l o r i n h e r e n t f rom t h e i n d u s t r a l source. A f t e r f e e d i n g w i t h t h e o r g a n i c feed f o r about 4 weeks, t h e s ludge e x h i b i t e d a dark brown c o l o r . Each o f t h e t h r e e b a t c h r e a c t o r s was f e d w i t h t h e o r g a n i c feed and a t h i o s u l f a t e l o a d i n g o f 1 g/1-d. The f o u r t h b a t c h r e a c t o r was a c o n t r o l and d i d n o t r e c e i v e any t h i o s u l f a t e l o a d i n g . A sharp decrease o f MLSS was exper ienced f o r a l l t h r e e r e a c t o r s r e c e i v i n g t h i o s u l a f t e l oad ings . However, one r e a c t o r was a b l e t o resume a s teady l e v e l o f MLSS a t app rox ima te l y 1,100 mg/ l , a f t e r an a c c l i m a t i o n p e r i o d o f t h r e e weeks. The biomass i n t h i s r e a c t o r c o m p l e t e l y conver ted t h i o s u l f a t e t o s u l f a t e , accompanied by a d r o p o f pH t o about 2.5 a t t h e end o f t h e a e r a t i o n p e r i o d . F i g u r e 7 e x h i b i t s t h e s o i l d s l e v e l f o r t h e c o n t r o l and t h e t e s t r e a c t o r s .
Dur ing t h e a c c l i m a t i o n p e r i o d , t h e r e was a l o s s o f so t h e r e a c t o r and foaming was a f r e q u e n t problem. When t h e above 8.0, t h e a c c l i m a t i z e d biomass e x h i b i t e d a de t h i o s u l f a t e d e g r a d a t i o n u n t i l t h e pH was a d j u s t e d t o be low
i d s i n pH was ay i n 8.0.

19
16OOi . - *
\ \ \
A I
- C o n t r o l R e a c t o r -. - Test R e a c t o r ( r e c e i v i n g t h i o s u l f a t e )
\ /
600 I I I I I I I I I I I I I I I 0 5 10 15 20 25 30 35 40 45 50 55 60 65 70
T i m e , days
F i g u r e 7. Nixed Liquor Suspended* S o l i d s i n Batch R e a c t o r s

20
2. Ba tch B iodegrada t ion R e s u l t s
F i g u r e 8 and Table 5 summarize t h e b a t c h d e g r a d a t i o n r e s u l t s a t phosphorus l e v e l s o f 0, 1.5, 6 and 24 mg/ l as PO4. A p e r i o d o f 2 t o 4 days was a l l owed f o r t h e system t o s t a b i l i z e a t each l e v e l o f phosphate a p p l i e d , p r i o r t o d a t a c o l l e c t i o n . The r a t e o f t h i o s u l f a t e d isappearance was s l i g h l y a f f e c t e d by t h e phosphate c o n c e n t r a t i n . A h i g h e r phosphate c o n c e n t r a t i o n would p r o l o n g t h e d e g r a d a t i o n t i m e . The degrada t ion o f t h i o s u l f a t e a l s o accompanied by a co r respond ing pH drop, as shown i n F i g u r e 9.
Depending on t h e l e v e l s o f phosphate a p p l i e d , t h i o s u l f a t e was q u i c k l y reduced t o l e s s than 10 mg/ l i n about 3 t o 6 hours, see F i g u r e 8. However, t h e convers ion o f t h i o s u l f a t e t o s u l f a t e ranged o n l y f rom 50 t o 80 pe rcen t d u r i n g these f i r s t few hours. A more complete convers ion , i . e . 90 t o 97 pe rcen t , was achieved i n l e s s t h a n 2 4 hours. T h i s f a c t suggests t h e p o s s i b i l i t y o f f o r m a t i o n o f i n t e r m e d i a t e s u l f u r spec ies , e.g. t r i t h i o n a t e o r d i t h i o n a t e , d u r i n g t h e course o f deg rada t ion . S u l f i t e was n o t found i n t h e f i l t r a t e b u t t h i s cou ld n o t e l i m i n a t e t h e p o s s i b i l i t y o f hav ing t h e bound s u l f i t e i n c o r p o r a t e d i n t h e s ludge m a t r i x . No e f f o r t was made t o de termine t h e presence o f t r i t h i o n a t e and d i t h i o n a t e i n t h e f i l t r a t e , and bound s u l f i t e and e lemen ta l s u l f u r i n t h e s ludge.
Dur ing t h e d e g r a d a t i o n p e r i o d , t e t r a t h i o n a t e was d e t e c t e d a t a l l l e v e l s o f phosphate; however, i t s c o n c e n t r a t i o n never exceeded 14% o f a l l s u l f u r compounds p resen t i n t h e r e a c t o r .
One exper iment was per formed a t a phosphate l e v e l o f 1.5 mg/ l and t h e pH was c o n t r o l l e d between 6 and 7. The r a t e o f d isapperance o f t h i o s u l f a t e was s l i g h t l y l o n g e r than t h a t w i t h o u t pH c o n t r o l , see F i g u r e s 10 and 11. It i s d o u b t l e s s t h a t phosphate i s needed a t t h e s u b s t r a t e l e v e l f o r any b i o d e g r a d a t i o n process ; i t a l s o serves as a c a t a l y s t f o r t h e convers ion o f t h i o s u l f a t e .
In b r i e f , t h e b a c t e r i a l p o p u l a t i o n o f 9 e t e r o t r o p h s and t h i o b a c i l l u s was a b l e t o a c c l i m a t i z e t o ach ieve complete convers ion o f t h i o s u l f a t e t o s u l f a t e i n l e s s than 24 hours. T h i s r e p r e s e n t s a s i g n i f i c a n t r e d u c t i o n o f t h e degrada t ion t i m e o f 120 t o 180 hours as r e p o r t e d by o t h e r r e s e a r c h e r s (see Jaquez, 1 9 7 6 ) .
3. Cont inuous A c t i v a t e d Sludge Process
I n t h i s phase o f exper iment , t h e con t inuous a c t i v a t e d s ludge u n i t s were i n i t i a l l y f e d w i t h o r g a n i c feed and pure t h i o s u l f a t e ( s t a g e 1) and, subsequent ly , fed w i t h o r g a n i c feed and

21
Tab le 5. Ba tch A c t i v a t e d Sludge Degradat ion o f T h i o s u l f a t e
I n i t i a l Phosphate Convers ion t o S u l f a t e s i n c e s t a r t o f l e v e l , ppm PO a e r a t i o n i n hours, %
3 4 5 6 23
- - - 0 62.1 95.8
1.5 48.1 56.5 62.7 - 95.6
1.5* 40.8 52.1 57.7 - 97.0
6.0 44.1 47.0 77.8 - 89.1
24.0 30.1 41.4 52.6 58.2 91.9
* w i t h pH c o n t r o l

22
B a a
" m L
C v1 N
900
600
300
0
8
7
6
5
4 z a
3
2
0
0
0 0
e
0
6 1.5 (with PH c o n t r o l 1.5 0
Time s i n c e s t a r t of A e r a t i o n , hrs F igure 8 . Biodegradat ion of T h i o s u l f a t e
Phosphate l e v e l s \ \ \
0 24 @ 6 0 1.5 ( w i t h p1I c o n t r o l )
1 .5 a 0
1 2 3 4 5 Tin ic s i n c e s t a r t of Aera t ion , h r s
F i g u r e 9. Chnnc;cs o f pi: dur ing T h i o s u l f a t e Biodegradat ion

23
900
" (? 0 cu cn GO0 m rd
E 0. a
300
0
900
11 m 0
v) N
600
E. a
300
0
t
I \ LTh i o su 1 f a t e
0 1 2 3 4 5 23 Time s i n c e s t a r t of a e r a t i o n , h r s
F igure 10. Biodegradat ion of T h i o s u l f a t e a t 1 .5 ppm PO; w i t h pH Control
Ttiiosulf a te
T e t r a t ti iona t e
Ttiiosulf a te A T e t r a t ti iona t e /-
I I
0 1 2 3 4 5 23
T i m e si1ic.e s t a r t of a e r a t i o n , l i rs
F i g u r e 11. Biodegradation of T h i o s u l f a t e a t 1 . 5 ppm P O 1 without plI C o n t r o l 4
8 6
2 4 PI1
8
4 2
PH

24
t h i o s u l f a t e waste stream (s tage 2 ) . R e s u l t s o f each s tage o f exper iment a re presented below.
Stage 1: Organic feed and pu re t h i o s u l f a t e
Two con t inuous a c t i v a t e d s ludge r e a c t o r u n i t s were employed. Each r e a c t o r u n i t was equipped w i t h an au tomat i c pH c o n t r o l l e r t o m a i n t a i n a pH range o f 6 t o 7.5. The h y d r a u l i c d e t e n t i o n t i m e was 24 hours and t h e sludge age ranged f rom 20 t o 30 days. When t h e MLSS r o s e q u i c k l y i n response t o e l e v a t e d t h i o s u l f a t e l o a d i n g s , an a t tempt was made t o h o l d t h e MLSS under 6000 mg / l .
Appendix B presen ts t h i o s u l f a t e l o a d i n g s a p p l i e d t o each r e a c t o r , MLSS i n r e a c t o r s , and e f f l u e n t c o n c e n t r a t i n s o f t h i o s u l f a t e , s u l f a t e and t e t r a t h i o n a t e . The s teady performance o f t h e t r e a t m e n t process i s summarized i n Table 6.
Table 6. Steady Performance o f t h e A c t i v a t e d Sludge Process (24-hour d e t e n t i o n t i m e )
I n f l u e n t E f f 1 uent T h i o s u l f a t e Reactor sz 0; S,Oi* Sc* % COD
Loading*, g / l - d MLSS, mg/ l g / l g / l g / l removal
0.5 1 . 0 2.0 5 .0 6.0** 8.0**
2800 10 40< 0.4 92 2500 10 404 0.8 95 3000 10 40c 1.5 96 5500 10 4 0 < 3.7 98
10 4.0 98 - -
* as S,O; ** Reactor f a i l u r e due t o foaming and l o s s o f s o l i d s
The appearance o f s ludge i n r e a c t o r s was da rk brown and had e x c e l l e n t s e t t l e a b i l i t y w i t h S V I ' s never exceeding 200. When a mechanical f a i l u r e was encountered w i t h t h e a c i d o r base pump, a b lue-green hue was observed i n t h e e f f l u e n t w i t h t e t r a t h i o n a t e c o n c e n t r a t i o n s o f 200 mg/ l o r h i g h e r . T e t r a t h i o n a t e l e v e l was below 40 mg/ l when t h e t r e a t m e n t system was o p e r a t i n g p r o p e r l y . When a t h i o s u l f a t e l o a d i n g o f 6 g / l - d or h i g h e r was a p p l i e d ; i n t e n s i v e foaming, c a r r y - o v e r o f s o l i d s by t h e e f f l u e n t and t h e presence o f a m i l k y brown s ludge were encountered.
The i n c r e a s i n g c o n c e n t r a t i o n s of MLSS a t e l e v a t e d t h i o s u l f a t e l o a d i n g s were m a i n l y due t o b a c t e r i a l growth. The ratio o f MLVSS t o MLSS were found between 0.8 t o 0.9, i n d i c a t i n g
2 5
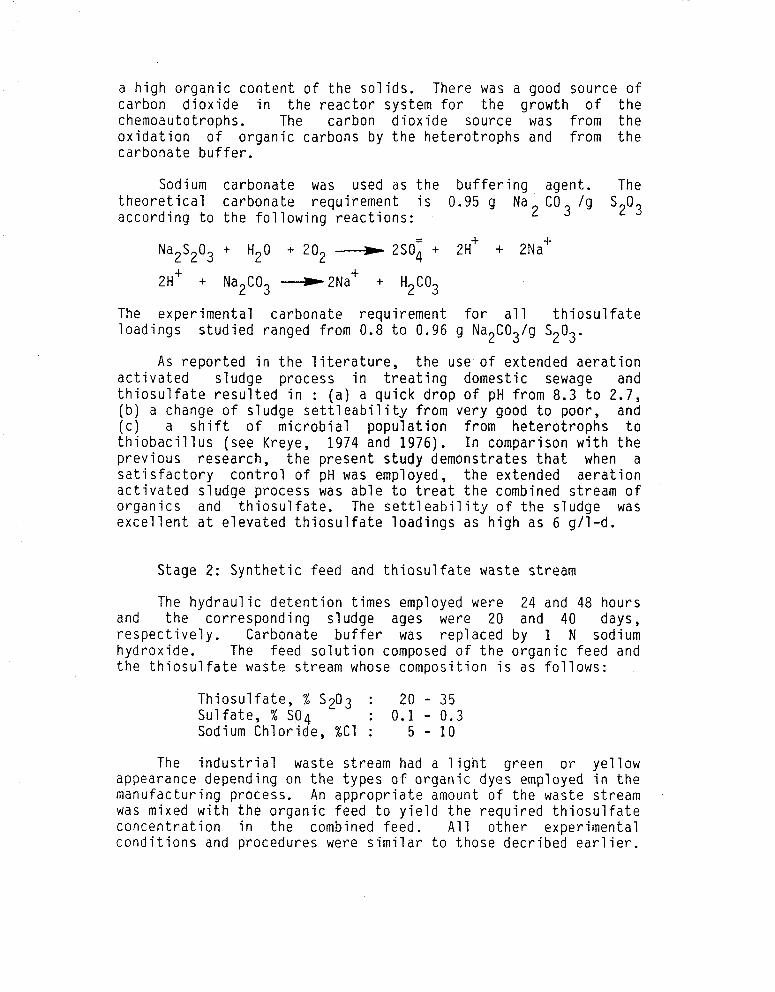
a h i g h o r g a n i c c o n t e n t o f t h e s o l i d s . There was a good source o f carbon d i o x i d e i n t h e r e a c t o r system f o r t h e g rowth o f t h e chemoautotrophs. The carbon d i o x i d e source was f rom t h e o x i d a t i o n o f o r g a n i c carbons by t h e h e t e r o t r o p h s and f rom t h e carbonate b u f f e r .
Sodium carbonate was used as t h e b u f f e r i n g agent. The t h e o r e t i c a l carbonate requ i remen t i s 0.95 g Na2 C03 / g S203 a c c o r d i n g t o t h e f o l l o w i n g r e a c t i o n s :
+ H20 + 202 L_.) 2SO; + 2H+ + 2Na' Na2S203 +
2H+ + Na2C03 -2Na + H2C03
The exper imen ta l carbonate requ i remen t f o r a l l t h i o s u l f a t e l o a d i n g s s t u d i e d ranged f rom 0.8 t o 0.96 g Na2C03/g S 2 0 3 .
As r e p o r t e d i n t h e l i t e r a t u r e , t h e use o f extended a e r a t i o n a c t i v a t e d s ludge process i n t r e a t i n g domest ic sewage and t h i o s u l f a t e r e s u l t e d i n : ( a ) a q u i c k d r o p of pH f r o m 8.3 t o 2.7, ( b ) a change o f s ludge s e t t l e a b i l i t y f rom ve ry good t o poor, and ( c ) a s h i f t o f m i c r o b i a l p o p u l a t i o n from h e t e r o t r o p h s t o t h i o b a c i l l u s (see Kreye, 1974 and 1976). I n comparison w i t h t h e p r e v i o u s research, t h e p resen t s tudy demonstrates t h a when a
a e r a t i o n s t ream o f udge was g / l -d.
s a t i s f a c t o r y c o n t r o l o f pH was employed, a c t i v a t e d s ludge process was a b l e t o t r e a t o r g a n i c s and t h i o s u l f a t e . The s e t t l e a b i e x c e l l e n t a t e l e v a t e d t h i o s u l f a t e l o a d i n g s
t h e extended t h e combined i t y o f t h e s as h i g h as 6
Stage 2: S y n t h e t i c f eed and t h i o s u l f a t e waste stream
The h y d r a u l i c d e t e n t i o n t imes employed were 24 and 48 hours and t h e co r respond ing s ludge ages w e r e 20 and 40 days, r e s p e c t i v e l y . Carbonate b u f f e r was rep laced by 1 N sodium hydrox ide. The feed s o l u t i o n composed of t h e o r g a n i c feed and t h e t h i o s u l f a t e waste stream whose compos i t i on i s as f o l l o w s :
T h i o s u l f a t e , % S 2 O 3 : 20 - 35 S u l f a t e , % S O 4 : 0.1 - 0.3 Sodium C h l o r i d e , %C1 : 5 - 10
The i n d u s t r i a l waste stream had a l i g h t green o r y e l l o w appearance depending on t h e t y p e s o f o r g a n i c dyes employed i n t h e manufactur ing process. An a p p r o p r i a t e amount o f t h e waste stream was mixed w i t h t h e o r g a n i c feed t o y i e l d t h e r e q u i r e d t h i o s u l f a t e c o n c e n t r a t i o n i n t h e combined feed. A l l o t h e r exper imenta l c o n d i t i o n s and procedures were s i m i l a r t o those d e c r i b e d e a r l i e r .

26
Appendix C summarizes thiosulfate loadings applied, MLSS in reactors, and effluent concentrations of thiosulfate, sulfate and tetrathionate. The steady performance of the treatment process is summarized in Table 7.
Table 7. Steady Performance of the Activated Sludeg Process
Inf 1 uent Effluent Thiosulfate Detention Reactor s20; s,o;* so;*
Loading*, g/ld time, hrs NLSS, mg/l g/l g/l g/l
5.0 24 2900 10 40 4 4.9 7.5** 24 - - - 5.0 48 4800 10 40 < 4.9 7.5 48 4500 10 40 7.4
* as s,o,' ** Reactor failure due to foaming and loss of solids
It is interested to note that the replacement o f the carbonate buffer by sodium hydroxide had resulted in a lower MLSS level at the same thiosulfate loading, i.e. 2900 mg/l of MLSS with NaOH versus 5500 mg/l of MLSS with carbonate at a thiosulfate loading of 5 gll-d. The use of lime is an alternative but the production of gypsum from lime neutralization can be a considerable problem in sludge management.
By extending the detention time from 24 hours to 48 hours, the biological treatment process was able to perform satisfactory at thiosulfate loadings as high as 7.5 g/1-d. The conversion of thiosulfate to sulfate was 95% or higher.
4. Crystallization
Preliminary crystallization experiments were conducted using pure thiosulfate. Thiosulfate solutions of 55.15% (w/w), initially at 50 C, were brought to cooling (a) by submerging the reaction vessel into a water bath with temperature control at 1 O C drop per hour, (b) by submerging the reaction vessel into a tap water bath having a constant supply of fresh tap water, and (c) under ambient air temperature. The recorded temperature of the crystallizing thiosulfate solutions is given in Table 8.

27
Table 8. Temperature of crystallizing thiosulfate solution
Cooling at Cooling in Cooling Under 10 C/hr Tap Water Bath Ambient Temperature
Time, Temp. Time, Temp. Time, Temp. min. C min. C min. C
0 50 0 30 45 1 60 41 2 90 39 5
9 1 3 1 5 1 8
50 46 43 4 6* 42 40 39 38
0 27 30 34 35 40 60
120 240
1020
50 42 42 45 4 6* 46 45 43 32 22
* Commencement of crystallization accompanied by an increase of temperature
The supernatant of the crystallizing solution contained very fine crystals; it was not able to withdraw the aqueous portion of the supernatant for thiosulfate analysis. When crystallization commenced, an increase in temperature was observed due to the 1 iberation of the heat o f crystal1 ization. A total solidification was observed for the thiosulfate solution subject to a quick cooling, i.e. cooling at 1 0 C/hr and by direct contact with tap water. The appearance of the thiosulfate slurry is presented in Figure 12. The solidified slurry contained some entrapped moisture. However, the slurry was easily removed from the reaction vessel and spreaded on an aluminum foil for further drying.
Since there was a total solidification, an innovative idea was sought to develop a crystallization process in which a complete solidification could be achieved, resulting in "zero discharge" of the thiosulfate waste stream. The idea was based on a mass seeding concept to create a supersaturated solution for crystallization.
The laboratory procedure for total crystallization of the thiosulfate waste stream was developed and described as follows (see Figure 13) :

28
Figure 1 2 . Appearance o f Crystal l iz ing Thiosulfate Slurry

29
A c t i v a t e d Carbon Col umn
T h i o s u l f a t e Nas te Stream 1
T h i o s u l f a t e S a l t a s Seeds C r y s t a l 1 i zed
- 70 C
22 c
Figure 13. Schematic R e p r e s e n t a t i o n o f T h i o s u l f a t e C r y s t a l l i z a t i o n Experiment

30
(a) Thiosulfate waste stream first passes through an activated carbon column for the removal of color and trace organics. Laboratory carbon column employed is shown in Figure 14.
(b) 100 ml of the pre-purified thiosulfate solution is heated to 70 C for 30 minutes.
(c) An appropriate amount of air dried thiosulfate salt recovered from preceding experiments is added to the thiosulfate solution to make up a concentration of 60% (w/w).
(d) The reaction vessel (glass beaker) is submerged into a tap water bath in which a fresh supply of tap water is maintained for cooling at 1 8 to 22 C. A gentle mixing is provided.
(e) Temperature of the crystallizing solution is measured to indicate the rate of crystallization.
(f) The crystallized thiosulfate slurry is spreaded on an aluminum foil for air drying.
(9) A portion of the recovered thiosulfate salt, after air dried, is employed as seedings for subsequent experiments.
A total of 5 consecutive crystallization experiments was conducted. The thiosulfate waste stream was obtained from a local industry, After activated carbon pre-treatment, almost over 95% of the apparent color was removed. The adsorption iostherm data is presented in Table 9.
Table 9. Adsorption isotherm Data for Thiosulfate Waste Stream
ml Thiosulfate waste % Transmittance at Indicated
of activated carbon 0 0.5 1 2 3 4 6 1 8 68 stream per gram Time in hours
Control 80 79 79 80 8 1 82 83 80 79 25 80 82 83 87 90 92 93 93 93 50 80 8 1 8 1 85 89 91. 92 91 93 75 80 80 81 82 86 89 90 89 93
100 80 80 80 80 8 1 E 6 88 88 92
For each experiment, the thiosulfate seed was obtained from preceding experiments. Table 10 presents the recorded temperatures during the crystallization process. It can be seen


32
Table 10 . Recorded Temperature for Thiosulfate Waste Stream Crystallization Experiments
Recorded Temperature in C for consecutive
minutes 1 2 3 4 5 Time, Experiment no.
0 1 2 3 4 5 6 7 8 9
10 11 1 2 13 1 4 1 5 16 1 7 18 1 9 20 25 30 35 40 50 60 70
70.0 64.0 57.0 51.0 47.0 43.0 40 .0 38 .0 36 .0 34 .0 40.0* 46 .2 46.5 46.2 46 .0 45 .8 45 .8
45 .0 - - - -
45.0**
70.0 61.0 55.0 48.5 44.0 40.0 37.0 42. O x 44.0 43.0 42 .5 41 .O 4 1 .O 40.5 39 .0 38.0 38 .0 36 .0 -
- - -
34 .0 -
**
70.0 62.0 56 .0 50.0 46.0 42.0 39 .0 37.0 34 .5 33 .0 31 .5 30 .0 20.0 42.0* 41.0 40 .5 39 .5 38 .0 38.0 37 .0 36 .5 3 6 . 0
34 .0
31 .0 29 .0
- -
**
70.0 62 .0 54 .0
44 .0 40 .5 3 7 . 5 3 5 . 0 34 .0 32.0* 41 .6 40 .5 3 9 . 5 39 .0 38 .5 38.0 38 .0 38 .0
48. o
- - -
3 6 . 0 35 .0 3 2 . 0 3 1 . 0 28 .0 27.0 **
70.0 60 .0 53 .0 47.0 42.0 39 .0 3 6 . 0 3 4 . 0 32 .0 30 .0 30 .0 29.0* 43.0 42 .5 41 .5 41.0 -
- - -
3 8 . 0 37 .0 36 .0
32 .0 28 .0 27.0
-
** -~ - -
* Commencement o f crystallizatin ** Unable to stir the thiosulfate solution due to total
Note: Initial concentration o f thiosulfate waste stream, solidification
after adding additional thiosulfate sal t,was 57.8 %.

3 3
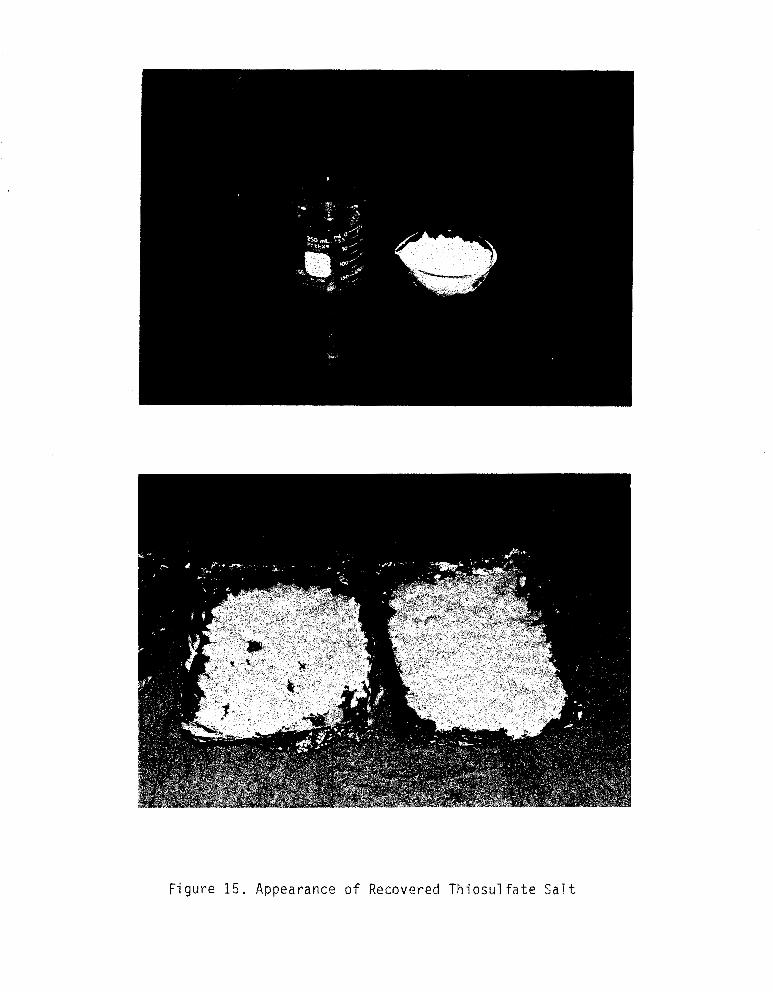
from the table that crystallization normally commenced in 5 to 1 5 minutes when the solution temperature was brought to 29 to 3 5 C. The entire crystallization process was complete in less than 2 hours. Figure 1 5 is a pictorial presentation of the recovered thiosulfate salt. The purity of the recovered thiosulfate salt from each consecutive experiment was analyzed for its COD, chloride, sulfate and thiosulfate contents, and the degree o f hydration, see Table 11. The following summarizes the experimental findings.
(a) Under the experimental conditions employed, crystallization commenced in 5 to 1 5 minutes when the super-saturated solution was cooled to 2 9 to 35 C. Variations in the commencement time of crystallization were attributed to the changes of tap water temperature and the degree of agitation provided.
(b) The resulting thiosulfate slurry contained some entrapped moisture which could be air dried in a few days.
( c ) There was no degradation of the quality of the thiosulfate salt recovered from each consecutive experiment.
(d) The entire crystallization process was complete in less than 2 hours.
Table 11. Composition of Recovered Thiosulfate Salt
Composition from Consecutive Experiment no. Item 1 2 3 4 5
COD, mg COD/g salt* 240 249 237 2 2 8 267
SO; , mg so i /g salt* 2 8 2 8 56 56 56
CI; mg C17g salt* 1 2 0 1 1 5 1 1 2 1 1 5 113 -
~ ~ 0 5 , mg s,o,/g salt* 459 448 448 459 459
Degree of hydration** 4.97 4.90 4 . 7 8 4.75 4.85
* recovered thiosulfate salt ** number of hydrated water molecules
34
Figure 15 . Appearance of Recovered Thiosulfate S a l t

35
CONCLUSIONS AND RECOMMENDATIONS
A combined waste stream obtained by incorporating thiosulfate into an organic feed was treated by a mixed population of heterotrophs and thiobacillus. The organic feed, e.g. a domestic sewage, would provide the necessary carbon and nutrient sources for the heterotrophs; while the thiosulfate stream would provide the sulfur compounds for thiobacillus.
The result of batch biodegradation experiments indicates that the mixed population of heterotrophs and thiobacillus was able to achieve a complete conversion of thiosulfate to sulfate in a much shorter period of time than that reported in the literature.
The complete-mixed, extended aeration activated sludge process employed was effective in removing the organics as well as thiosulfate. The settleability of the activated sludge was satisfactory with SVl's never exceeding 200. At hydraulic detention times of 24 and 48 hours, the process was operative at thiosulfate loadings as high as 5.0 and 7.5 g/l-d, respectively. Process failure occurred at higher thiosulfate loadings was due to foam formation and loss of solids from the reactors. The use of sodium hydroxide, instead of sodium carbonate, as an alkaline buffer yielded a lower MLSS. This was due to the additional carbon dioxide source generated by the carbonate buffer, which promoted the growth of thiobacillus.
For practical operation of a full-scale activated sludge process for treating thiosulfate waste, it is important that proper control of pH at 6 to 7.5 is required. The use o f lime for neutralization is an alternattive, but the production o f gypsum can be a considerable problem in sludge management.
The total crystal1 ization or solidification process developed in this research has resulted in a "zero discharge" of the thiosulfate waste stream. The process provides some economic benefits as a result of the reduction in waste treatment cost and the re-sale value of the recovered thiosulfate salt. Further pilot scale operation is recommended prior to a full-scale process development. It is also felt that the process can be applied to other types of inorganic salts.

36
LITERATURE CITED
American Public Health Association et al., Standard Methods for the Examination of Water and Wastewater, 1985.
Blackburn, J.W., "Removal of Salts from Process Wastewaters," Chemical Engineering, October, 1977.
Brice, J.C., The Growth of Crystals from Liquids, American Elsever Publishing Co., 1973.
Campbell, J.R. and G.H. Nancollas, "The Crystallization and Dissolution of Strontium Sulfate in Aqueous Solution," The Journal of Physical Chemistry, V . 73, n. 6, June 1969.
Dagon, T.J., "Biological Treatment of Photo Processing Effluents," Journal Water Pullution Control Federation, v. 45, 1973.
Eccles, E.W., "Method for Oxidizing The Thiosulfate Ions in a Thiosulfate Waste," United States Patent, (3.627.676) , 1971.
Garrison, W.E. et a1 . , "Improved Hypochlorination Techniques and Problems in Disinfection of Municipal Wastewaters Containing Refinery Thiosulfate," Proceedings of the 28 th Purdue Industrial Waste Conference, May 1973.
Garside, J. and J.W. Mullin, SPS State-of-Art Report Crystallization, Department of Chemical Engineering, University College London, 1978.
Graham, P.W., "Practical Aspects of the Biological Oxidation of Thiosulfate Solution by Mixed Cultures," Inst. Journal Air and Water Pollution, v. 6, 1962.
Jacquez, R.B., Thiosulfate Oxidation in a Fluidized Bed, Doctoral Dissertation, Virginia Polytechnic Institute and State University, 1976.
Jancic, S.J. and P.A.M. Grootscholten, Industrial Crystallization,Kluwer Academic Publishers, 1984.
Judkins, J.F. and R.H. Wynne, Jr., "Crystal-Seed Conditioning of Lime Softening Sludge," Journal American Water Works Associattion, May 1972.
Kelly, D.P., "Biochemistry of Oxidation of inorganic Sulfur Compounds by Microorganisms," Aust. Journal of Science, v. 31, n. 5, 1968.
Kreye, W.C., P.H. King and C.W. Randall, "Biological Treatment of High Thiosulfate Industrial Wastewater," Proceedings of the 28th Purdeu Industrial Waste Conference, May 1973.
Marshall, R.W. and G.H. Nancollas, "The Kinetics of Crystal Growth of Dicalcium Phosphate Dihydrate," The Journal of Physical Chemistry, v. 73, n. 11, 1969.
Nancollas, G.H. and R.M. Michael, "Crystal Growth Kinetics of Minerals Encountered in Water Treatment Processes," In: Aqueous Environmental Chemistry of Metals, A.J. Rubin (ed.), Ann Arbor Science, 1974.

37
Santer, M. et al., "Role of Inorganic Phosphate in Thiosulfate Metabolism by Thiobacillus Thioparus," Journal o f Bacteriology, v. 79, pp. 313-320, 1960.
Silver, M. "Metabol ic Mechanisms of Iron-Oxidizing Thiobacillus," In: Metallurgical Applications of Bacterial Leaching and Related 'Microbiological Phenomena, L.E. Murr et al. (ed.), Academic Press, 1978.
Silver, M. and 0. Dinardo, "Factors Affecting Oxidation o f Thiosalts by Thiobacillus," Applied and Environmental Microbiology, June 1981,
Vishniac, W. and M. San t er , I' The Th i o bac i 1 1 us , 'I Bacteriological Reviews, v. 21, pp. 195-213, 1975.
Watkins, J.P., "Controlling Sulfur Compounds in Wastewaters," Chemical Engineering, 19771.

38
APPENDIX A: Analytical Procedures f o r Inorganic Sulfur Species
i
L
c

39
Analytical Procedures for
Thiosulfate, Sulfite, Tetrathionate and sulfate
A . Thiosulfate :
1) Pipette 10 ml of sample into a 250 ml beaker. 2) Add 0.25 ml of 37% formaldehyde (for sulfite interference). 3) Add 100 ml of deinoized water. 4 ) Acidify with 1 to 2 ml of glacial acetic acid. 5) Add 5 ml of starch indicator. 6) Titrate with 0.1 N iodine solution.
% Na, S, O 3 = ( ml iodine solution * N Iodine solution * 15.8 )/ml sample
B. Sulfite :
1) Use steps 1,3,4,and 5 for thiosulfate analysis. 2) Titrate with 0.1 N iodine solution.
% Sulfite as Na,S,O,= ( ml iodine solution * N iodine solution * 15.8 )/ml sample - (% Na, Si 0 3 as determined for thiosulfate, step A.6 )
C. Tetrathionate
1) Pipette 100 ml sample into a 250 ml beaker. 2) Neutralize with dilute NaOH to phenolthalein indicator. 3) Add 1 gram sodium sulfite. Swirl to dissolve and let stand
4) Add 5 ml 37% formaldehyde. Mix and let stand for 5 minutes. 5 ) Acidify with 2 to 4 ml o f glacial acetic acid. 6) Add 5 ml starch indicator. 7) Titrate with 0.1 N iodine solution. 8) Calculate total sodium thiosulfate equivalence usiing step A.6. 9) Determine tetrathionate as Na,S,O, by the difference of
for 5 minutes.
step 8 and step A.6.
D. Sulfate
1) Pipette 25 ml sample into a 250 ml beaker. 2) While stirring, add 1.0 N iodine dropwise until a faint yellow
color appears.

40
3) Add 2 grams of a s t r o n g a c i d c a t i o n t y p e i o n exchange r e s i n
4 ) P i p e t t e 20 m l a l i q u o t i n t o 150 beaker. 5 ) Add 80 m l methanol . 6 ) A d j u s t pH t o 3.5 u s i n g 5% ammonium h y d r o x i d e o r 5%
h y d r o c h l o r i c a c i d . 7) Add 3 drops of t h o r i n i n d i c a t o r . 8) t i t r a t e w i t h 0 . 1 M ba r ium c h l o r i d e t o f i r s t permanent p i n k
c o l o r .
(e.9. F i s h e r R-231 Rexyn 1 0 1 H ) . M i x f o r 5 minutes. A l l o w r e s i n t o s e t t l e .
mg/ l S0,as S,O, = ( 96,056 * V * M ) / ( 1 . 7 1 * Va )
V = volume o f bar ium c h l o r i d e M = m o l a r i t y of bar ium c h l o r i d e
Va = volume o f a l i q u o t used ( i . e . 20 m l )

41
APPENDIX B : Stage 1 Experimental Data
(Hydraulic Detention Time Equals 24 hours f o r Both Reactors A and B )
e
f
i

42
10
9
8
7
6
5
4
3
0
1
LOADING FACTOR GRAMS MIOSULFATE/LITER EACTOR-DAY
w l l
i I
0 1 I I I 1 I 1 I 1 I
0 m 40 60 80 100 120 140
DAYS 0 REACTOR A f M T O R B

43
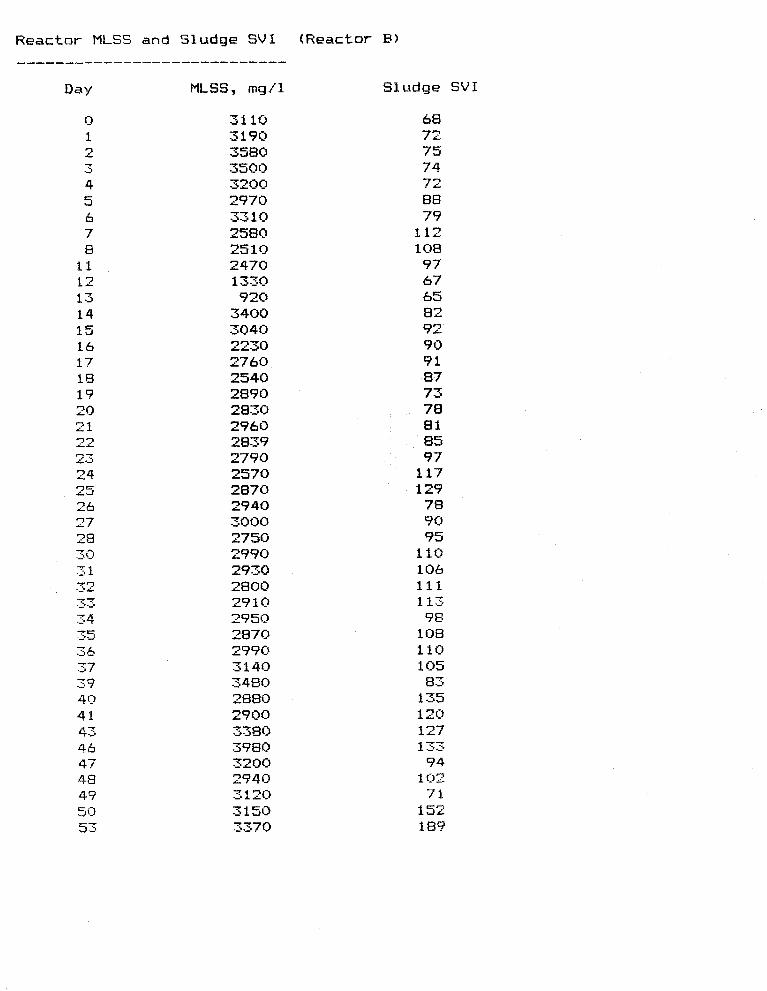
Reactor MLSS a n d SVI ( reac tor A )
Day PlLSS, mg/l
0 1 2
4 5 6 7 8
11 12 13 14 15 16 17 18 19 20 21 22 23 24 LS 26 27 28 29 31
7 .-'
,-?
-T .:* .> 77 .-. .-. 34 .La 5 3.5 37 39 4 Q
41 43
-
3400 3020 2820 2520 2300 2410 3160 2380 2250 2330 2530 2560 2340 1860 1550 1590 1370 3010 3000 2650 2520 2490 2310 2430
2560 2500 253(3 2550 2530 2560 2590 2480 2&00 2640 2830 2460 2 120 2540
2480
Sludge SUI
67 7 ij 67 79 78 83 63 92 q7 86 86 78 85 70 65
101 73
202 110
.-'
79 83 72 9 1 95 81 86 88 91 90 99
102 93 97 S8 ? I 71 77 77 78

46 47
49 50 53 54 57 59 60 6.1 62 63 54 57
69 71 74 75 76 77
131 32 133 85 57 s9 90 91 ?2 95 96 47 ?€I 49
1 c52 1 105 1 Ob
4a
5a
78
2480 2720 2700 2680 2790 2960 3100 3030 3070
2410 2620 2580 2370 2420 2430 2520 2380 2520 2700 2560 2540 2920 3004 3040 3060 3650 4740
5820 6150 6200 6670 6900 7030 7380 8130 7640 73 1Q 6420 6030
2ab0
soao
93 74 104 98
i oa 192 1 tQ3
99 105 115
122 97 135 99 115 175 la1 123 137 137 118 I16 93 99 108 89 89 104 119 110 100 94 86 98 83 62 54 58 93 23
1 oa
44

45
109 1 1 1 112 113 116 1 1 7 118 123 124 '1 25 126 127 13tL) 131 133 134 135 137 139
6910 5620 5730 3280
6020 5710 5600 5270 4210 4520 4050 4433 4360 3700 2800 2750 2520 3010
57ao
59 62 59 88 551 56 60 64 66 71 66 54 63 64 65 71 64 70 56

46
Effluent Th iosu l fa te , Tetrathionate and Sulfate (Reactor CS) __----_-____________-------------------------
Day
12 1.i 15 16 113 sf; 36 39 4@ 41 43 4 b 47 4% 4? 50
56 57 60 61 62 63 64 67 69 71 74 75 76 77 7 8
82 83 08 €39 ? 0 31 92 45 96
r- -I.>
a i
s2 0 3 m g / l
560 180 34 22 210
0 0 0 0 0 0 0 0 0 0 0 0 0 0, 0 0 0 0 0 0 0 0 0 0 0 (3
0 (3
0 0 0 0 0 0 0 51
0
Ef f l c i e n t
m g / l as S,O, S,%
178
268
156 236
112 45 45 45 67 22 67 112 44 44 67
33 425 470 559 22 44 44 66 1 1 22 22 22 22 44 bk? 44 44 44 66 22 66 44 45
so4 m q / l as S203
477 169 140 140 140 225 449 449 758 815 101 1 927 843 843 843 758 1685 1544 843 112
168 169 112 871 786
786 926 870 843 87 1 871 87 1 843 843 815 4 1 it0 3888 3202 3483 3000
28 1
786

47
97 98 99 102 103 104 105 106 110 1 1 1 112 113 1.16 117 118 123 124 125 126 127 I30 131 133 134 135 I37 139
0 0 0 0 0 0 0 0 0 0 0 0 0 0 0 0 Q 0 0 0 0 67 45 22 0 0 0
44 44 44 44 44 66 44 66 66 44 67 66 44 44 44 44 44 67 90
1387 1633 1387 i633 448 313
67 45
3370 3932 3258 3707 365 1 3707 3707 3595 3595 3932 3932 3427 3707 4100 4100 4100 4100 4382 4213 3732 3595 2247 2303 4100
3932 3932
3988
~
-
0 1 2
4 5 6 7 8
11 12 1’3 14 15 16 17 10 19 20 21 22 23 24 25 26 27 28 30 .J 1
.-.. .:\
5
3-7 .J L 77 --. -3
34
36 .;7 .LE? 4 !? 41 43 46 47 48 49 fj i] 53
-c --. il - --.
31 I0 3190 3580 SJ00 3200 2970 3310 2580 2510 2470 1330 920
3400 3040 2230 2760 2540 2890
2960 2839 2790 2570 2070 2940 3000 2750 2990 2930 2800 2910 2950 2070 2990 3140 3480 2080 2900 .>-A30 3980 3200 2940 3 120 3150 d.370
--c
2830
-7
7-
68 72 75 74 72 00 79
112 100 97 67 65 82 92 90 91 07 73
81 85 97
117 129 70 90 95
110 106 111 113 ?e
100 110 105 03
135 120 127 133 94
102 71
152 1 B?
7a
1
7

!XI T so T Sb 06 so T Tb
L6 00 T TGT 6T T ZT'C 88 trb 08 8T T s9 9s 29 sG s!z z9 f8 06 26 E8 08 LL -29 90 OS T9 ss Z8 OL Z0 T LOT GL 96 TCZT 65 T. 9s T S5 08 Qt? 'I 6% T T OZ 09 T 00 T S6
6t7

50
134 135 137 130 139 140
2000 2009 1700 1640 1850 1610
100 90 117 110 97 112
f

51
Effluent Thiosulfate, Tetrathionate and Sulfate (Reactor PI
Day
12 14 15 16
19 20 21 25 2b 27 28 29
ia
-3 --. i -7- .;* .J
34
36 39 4 u 41 43 46 47
49 5 C! 54 5s 5? L (3 61 62 6 3 64 67 B e 69 71 74 75 76 77
-I= .I; &
48
s 2 0 3 mg/l
246 78 22 22 22 0 fl 0 (3
0 0 0 0 0 0 0 0 0 0 a 0 0 0
179 44 44 67 0 0 0 0 (3
0 ci
(3 0 0 0 0 0 0 0 0
s4 0 6 so 4 mg/l as S,03 mg/l as
i 78 134 214 179 47 22 67 22 67 45 45 34 22 22 45 45 45 45 22 (57 45 67 380 76 1 895 962 44 44 44 134 44 44 22 44 22 44 22 44 66 44 66 44 44
310 112 140 84 196 393 42i 477 449 449 449 449 449 447 449 449 449 449 1489 1826 1685 2020 1994 674 337 225 169 1685 1544 1460 1741 1461 1573 1545 1561 1546 1489 1442 2022 2696 3736 3797, 4016

52
73 8 1 82 83 94 95 96 97 98 99
102 105 106 109 111 1 1 2 1 1 3 1 1 6 1 1 7 1 le 12s 126 127 1 3 0 1'31 1 3 2 133 1 3 4 135 1.37 13 8 1 Z9
0 0 0 0
112 0 0 0 0 0 0
255 1 3065 2416 1186 873 694 984 984 1090 156 403 649 380 380 335 425 515 537 760 7if0 1007
44 44 44 22 403 22 45 44 89 44 44 450 313 604 403
627 112 313 246 447 55? 649 738 872 917
1252
716 582 &37 447
a28
a05
f=-
4494 5196 4578 424 1 169
1 6 0 5 3370 2528 3932 3876 3932 25.3 393
84 112 113 220 140 112 84
36 112 112 84
112
112 84 04 56
a4
168
a4

53
APPENDIX C : Stage 2 Experimental Data
Reactor C : Hydraulic detention time equals 48 hours
Reactor D : Hydraulic detention time equals 24 hours
-

cs
w . N
N
N
P . C
L
CL
Lr
l
t-J
OC
PN
Q0
0Q
CL
CL
0
ha4 i.4 0
I P
P 9
CL
-4
0. . C.4
C.4
0 . P
P 9
N N
N
N N
bJ
N t
.3 N
Lrl N P
J bJ
.
8.
.m
m.
0 0 0 P
i3 0 0
cn
P

55
56 57 58 557 60 61 62 63 44 65 66 67 6€l 69 70 71 72 73 74 75 76 77 78 79 80 81
83
85 86 87
89 90 91 ?2 93 94 95 576 97 98
a2
a4
a8
.z 7 4 0
3440 36213 3750 3800 3860 37413 3920 3790 3820 3835 3690 3890 3840 3940 41 113 4000 4220 4540 4220 4240 4210 3910 4440 4240 4400 4000 4210 463(] 4470 4730 4990 4600
4770 5240 5060 527(1 5170 5G70 5230 ?-I (-1 L1-j
3630
4830
c - 9.-
1720 1720 2128 2100 2005 2603 2600 2599 2576
1957 2845 3450 3472 3524 3610 3936 3839 374 1 4189 4189 4256 430 1 4144 4133 4166 45512 4413 4547 4446 5018 45184 4973 5488 5500 5219 5163 4957 4988 4928 51137 5130 5342
2856
11.0
11.0 22.4 11.2
11.2 11.2 11.2 11.2 11.2 11.2 11.2 11.2 11.2 11.2 11.2 11.2 11.2 11.2 11.2 11.2 11.2 11.2 11.2
11.2 11.2 11.2 11.2 11.2 11.2 11.2 11.2 11.2 11.2 11.2 11.2 11.2 11.2 11.2 11.2
11.0
22.4
11.2
11.2
11.2
11.2
11.2
11.2
11.2
11.2
11.2
11.2
11.2
1708
1960
2436
2884
3360
3892
4258
4144
4256
4368
4984
4904
5012
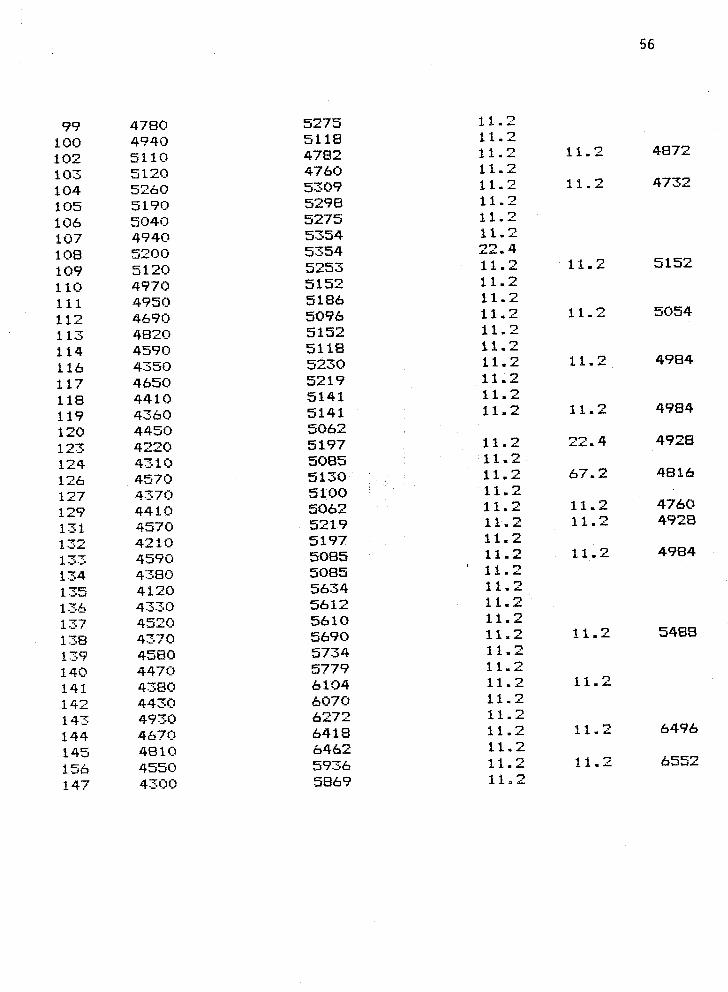
56
99 100 102 103 104 105 106 107 i oa 109 110 111 112 113 114 116 117
119 120 123 124 126 127 129 131 132 133 134 135 136 137 138 139 140 141 142 143 144 145 156 I47
1 ia
4730 4940 5110 5 120 4 ~ 6 0 5190 5040 4940 dL00 5120 4970 4950 4690 402Q 4590 4550 4650 4410 4360 4450 4220 4310 4570 4370 4410 4570 4210 4590 4390 4120 4.330 4520 4370 4580 4470 4380 4430 4930 46?0 4810 4550 4300
c-
CPI
5275 51 18 4782 4760 5309 5290 5275 5354 5354 5253 5152 5186 5096 5152
5230 521? 5141 5141 55062 5197 5085 5130 5100 5062 5219 5197 5085 55085 5634 5612 5610 5690 5734 5779 6104 6070 6272 6418 6462 5936 5069
5118
11.2 11.2 11.2 11.2 11.2 11.2 11.2 11.2 22.4 11.2 11.2 11.2 11.2 11.2 11.2 11.2 11.2 11.2 11.2
11.2 11.2 11.2 11.2 11.2 11.2 11.2 11.2 11.2 11.2 11.2 11.2 11.2 11.2 11.2 11.2 11.2 11.2 11.2 11.2 11.2 11.2
11.2
11.2
11.2
11.2
11.2
11.2
22.4
67.2
11.2 11.2
11.2
11.2
11.2
11.2
11.2
4872
4732
5152
5054
4984
4984
4928
4816
4760 4928
4984
5408
6496
6552

57
148 149 150 151 152 153 154 155 156 157 1.33 159 160 161 162 163 164 165 166 167
169 170 171 172 173 174 175 176 177 178 179 180 181 182 183 184 185 186 187 188 189 1 90
1 &a
4290 4240 4080 3480 SdS0 3510 4300 4530 4520 4810 4390 4600 4500 4870 4220 4 1 OC) 4060 4810 4220 5170 4480 4860 4490 4750 4360 4260 4210 4910 4'310 4890 5270 5000 4710 5060 4450 4520 4680 4460 5040 4650 4660 4390 5090
-I=
7605 7549 7529 7246 7246 7526 7526
757 1 7577 7694 7762 7605 7549 7549 7594 7594 7594 7594 7694 7762 7717 7370 7482 7482 7482 7482 7460 7907 7951 7929 8176 7918 8165 7885 7974 8109 8075 8200 8265 8333 8232 8210
7638
11.2 11.2
1120.0 136.5.0 11.2 784.0
11.2 11.2 22.4 22.4 11.2 11.2 11.2
11.2 11.2 11.2 11.2 11.2 11.2 11.2
11.2 11.2 11.2 22.4 11.2 11.2 11.2 11.2 11.2 11.2 11.2 11*,2 11.2 11.2 11.1 11.2 11.2 11.2 11.2 11.2 11.2 11.2 11.2 11.2 11.2 11.2
11.2
11.2
101.0
11.2
11.2
11.1
11.2
11.2
11.2
3528
7336 7644
7392
7840
7700
7560
7448
7504
7952
7504
7653
7399

ti
ti
D I
8 I
13
0
0
FJ
13.
Ul
0.
m
0.
0
0
m
P
0.
P
al 4
0
P
P
*c
L
tz
tz
I
. N
N
mm
0.0
mo
.
OP
CL
F
I N
C1
W
tz
w
tz
tz
I .
e
EJ PJ
N
‘4
‘4
-4
‘4
‘4
5.1
N
m
PJ
m
P
m
P
-P
00
M ‘4 cr cr +
iI
I

59
235 236 237
239 240 24 1 242 243 245 246 247 240 249 250 25 1 252 255 254 257
238
3720 3990 3400 3950 4200 3640 .:*e50 3670 4000 31770 3950 3640 s.280 3.360 .2.;?(3 3270 3480 357r3 3850 340Q
T I
TT
--
8915 9000 9094 9296 9298 949B 9498 91 17 91 17 9229 9251 9352 9128 9128 9072 9072 9296 9296 9296 9856
11.2 11.2 11.2 11.2 717.0 11.2 -
22.4 112.0 448.0 1278.0 5544 1053.0 1680.0 1277.0 2576.0 3752 1792.0 1 198.0 1008.0 2060.0 2462 381.0 11.2 11.3,
___
6608
-
11.2

Il
l
I I I I I I I I I I I I I I I I I I I I I I I I I I I I I I I I I I I I I I I I I I I I I I I I I I I 1 I 1 I I 1 I I I I t
IJ3 0 0
Q 0 a 0
0 0
0 Q
0 d d
..
..
a.
I

61
57 513 59 60 61 6 -3 64 65 66 67 68 69 70 71 72 73 74 75 76 77 78 79 80 81 82 83 84 85 €36 87 80
9 Q 91 92 93 94 95 9b 97 98 99
1 Qg 102
a9
5270 5170 5110 4950 4950 5020 5270 52-30 5110 4890 5050 4900 4730 4490 4230 4 133 4650 4570 4530 4300 3930 3880 4490 4440 4320 4430 4170 4310 3590 3450 3600 3730 3650 3740 3725 3630 3750 4230 59 1 Q
3900 3750 3710 3720 3790
1658.0 21 12.0
1915.0 2565 . 0
2455.0 2536. 0 2890 0 2867 0 2823.0 3203 0 3315.0 3338.0 3320.0 3875 . 0 3775.0 3670.0 4245.0 4144.0 4155.0 4122.0 4435.0 4189.0 4077 I 0 4547.0 4346.0 4563 . 0 4592 . 0 4950.0 4950.0 4816.0 5466 . 0 5345.0 5354.0 5062.0 4928.0 4872.0 4794. 0 5029.0 5074 I 0 5209.0 5376.0
11.0
1l.U 11.2 11.2
11.2 11.2 11-2 11.2 11.2 11.2 11.2 11.2 11.2 11.2 11.2 11.2 11.2 11.2 11.2 11.2 11.2 11.2 11.2
11.2 11.2 11.2 11.2 11.2 11.2 11.2 11.2 11.2 11.2 11.2 11.2 11.2 11.2 11.2 11.2 11.2
11.0 1736.0
11.2 1932.0
11.2 2436.0
11.2 2688.0
33.6 2996.0
11.2 3864.0
11.2 4200.0
4368.0 11.2
11.2 4200.0
11.2 4536.0
11.2 4’984.0
11.2 4856.0
11.2 4872.0

1 I!
0
0
0 . N
rd
E
. 4
4
4
4
OQ
4N
b
t9
t23
4-
mL
n
. *
rd N
.
. 4
4
44

63
151 152 153 154 155 156 157 158 159 160 161 162 163 164 165 166 167 168 169 170 171 172 173 174 175 176 177 178 179 180 181
183 184 185 186 187 188 189 1 9 0 191 192 193 194
i a2
3 100 3030 3170 3090 2060 2.310 2520 2770 2880 3220 2610 2900 2910 2760 2480 2480 3180 3170 3240 2650 2960 2680 3290 2460 2130 1840 2340 1810 1470 2090 2880 1760 1450 2040 2280 239fS 2220 2130 2180 2230 2 160 22so 2280 2300
5242.0 5242.0
4950.0 4950.0 4838.0
41328.0 4928.0 4928.0
5040.0 4928.0 4816.0 4895.0
4895.0 5107.0 5107.0 5029. 0 5130.0 5376 . 0 5309. 0 5488.0 5376.0 5242.0 5018.0 4827.0 4906.0 4917.0 4887.0 5242.0 5205.0 5237 m 0 4771.0 5096.0 5096.0 5242.0 5390.0 5443.0 5387 . 0 a.176.0 d-rL75,U 5331.0
4938. 0
5uia.o
4995. 0
l=T
r-l
11.2 11.2
2016.0 11-2
11.2 11.2 11.2 11.2
11.2 11.2 11.2 11.2 11.2
11.2 11.2 11.2
392.0 11.2 11.2 11.2 11.2 11.2 11.2 11.2 11.2 11.2 11.2 11.2 11.2 11.2 11.2 11.2 11.2 11.2 11.2 11.2 11.2 11.2 11.2 11.2
246.0 4480.0 11.2 5264.0
22.4 11.2 5432.0 11.2 5096.0
22.4 4816.0
11.2 4984.0
11.2 4872.0
414.0 4089.0
11.2 5152.0
11.2 5152.0
11.2 4872.0
11.2 5292.0
11.2 5121.0
11.2 5096.0

64
5296.0 5408.0 5600.0 5230.0 5186.0 4995.0 5062.0 4950.0 5197.0 5286 . 0 4.244.0 5242. 0 5242.0 5312.0 5074.0 5600.0 5656.0 5634 . 0 5700 I 0 5711.0 5734.0 5824.0 6406 I 0 6496.0 5980 . 0 5914.0 6563.0 6765.0 6518.0 6462 I 0 6451.0 6518.0 6474.0 6731. 0 M28.0 3360.0 4670.0 4659.0 4659.0
r-Tc
4614.0 4458 I 0 4570 = 0
11.2 11.2 11.2 11.2 11.2 11.2 11.2 11.2 11-2 11.2 11.2 11.2 11.2 11.2 11.2 11.2 11.2 11.2 11.2 11.2 11.2 11.2 11.2 11.2 li.2 11.2 11.2 11.2 11.2 11.2 11.2 11.2 11.2 134.0 1971 - 0 4480.0 3640.0 3427.0 2575 I 0
11.2 5208.0
11.2 5152.0
224.0 4872.0
11.2 5096.0
11.2 4872.0
11.2 4984.0
11.2 4704.0
672.0 4760.0
1389.0 4312.0
11-2 6132.0
3965 .i 0 560.0

65
234 2 4 <:I 24 1 242 243 244 245 246 247 248 249 250 25 1 252 253 254 255 256 Sd-7 -G
4526.0 4659.0 4637.0 4637.0 4637.0 46337. U 4592.0 4592.0 4592.0 4749.0 4592. Q 4592.0 4592.0 5062.0 5062.0 5 O 6 2 0 5062.0 5062.0 41W.O
11.2 11.2 11.2 11.2 11.2 11-2 11.2 11.2 11.2 11.2 11.2 11.2 11.2 11.2 11.2 11.2
5'30.0
11.2
11.2
11.2
11.2
4592.0
4480.0
4480. 0
4424.0