Mammoth Lakes Real Estate Market Report
10
Matthew T. Lehman Matthew Lehman Real Estate Market Trends Report 2014 – 3rd Quarter
-
Upload
mammothlakesrealestate -
Category
Real Estate
-
view
45 -
download
1
Transcript of Mammoth Lakes Real Estate Market Report

Matthew T. Lehman
Matthew Lehman Real Estate
MarketTrendsReport2014–3rdQuarter

.
I hope you are enjoying the fall season and like myself looking forward to a winter filled with ample snow and
animation. I would like to personally thank you for taking the time to read my Market Trend Report for the third
quarter of 2014. It’s full of fun and easy to follow trends from the Mammoth Lakes market. If there are items
you would like to see in future reports, please let me know and I will do my best to incorporate them.
Matthew Lehman Real Estate is a full service brokerage and consulting firm seasoned in many aspects of real
estate. As you find a need for professional real estate services, I hope you consider my brokerage as your next
real estate representative.
Sincerely,
Matthew T. Lehman

The information contained in this document is not guaranteed and should be verified by the reader.
Overview
This report is a brief summary comparing the first half of 2014 to performances observed in previous years.
Subsequent 2014 reports will build on this initial analysis affording a good view of the ever changing real estate
market in Mammoth Lakes.
** Median Price = middle value for a range of values. This is a good indicator to use when there is a lot
of data. It helps prevent unusually high or low values from skewing a data set.
Single Family Homes
Statistics for the third quarter of 2014 are remaining consistent with the 2nd quarter; median sale prices are trending
10.17% higher than 2013 as of September 30th, 2014. Mobile homes and Forest Service leases have been excluded
from these data sets as they do not include land in their valuations and they are not fee simple ownership.
Single-Family Residential History
Avg. % change
Year #Sales Average Price Median Price DOM Median Price
2003 117 $688,858 $580,500 146
2004 107 $923,040 $745,000 140 28.34%
2005 129 $1,055,961 $825,000 127 10.74%
2006 55 $1,091,874 $895,000 165 8.48%
2007 41 $1,078,709 $900,000 159 0.56%
2008 44 $1,093,502 $829,500 167 -7.83%
2009 60 $827,788 $667,250 180 -19.56%
2010 70 $885,442 $641,190 164 -3.91%
2011 72 $671,627 $560,000 169 -12.66%
2012 87 $677,612 $598,611 215 6.89%
2013 83 $816,326 $600,000 172 .23%
2014 YTD 69 $812,835 $661,000 168 10.17%
The bar chart on the following page provides a visual representation of median sales prices for the table above.
Increases are gradual with current median prices remaining between 2003 and 2004 levels.

.
The table below offers a breakdown of Year to Date 2014 pricing by home size.
Single Family Home Stats for YTD 2014 Square Footage #
Sales Avg. Price Median Price Average Days on Market Median $/Sq. Ft.
Less than 1000 2 $361,250 $261,250 119 $377
1000-2000 27 $482,009 $467,000 167 $328
2000-3000 27 $815,818 $765,000 137 $311
3000-4000 10 $1,461,722 $1,482,500 178 $403
4000+ 7 $1,809,333 $1,727,500 319 $360
Highest Sale $3,250,000 $812
Lowest Sale $300,000 $271
Single family home sales picked up significantly over the previous first half of 2014, in fact home sales for the
third quarter nearly matched the first two quarters of 2014.
Condominium Market
The condominium pricing for YTD-2014 is revealing increases of 15.5% over 2013. When double digit increases
were observed during the first quarter, it was thought perhaps the limited data or seasonal gains may have been
indicating unusually high results. As of September 30th, 2014 there were 193 condominium sales, averaging about
20 per month.
$0
$100,000
$200,000
$300,000
$400,000
$500,000
$600,000
$700,000
$800,000
$900,000
$1,000,000
2003 2004 2005 2006 2007 2008 2009 2010 2011 2012 2013 2014YTD
Single Family Homes Median Price

The information contained in this document is not guaranteed and should be verified by the reader.
Condominium Sales History
Year # Sales Avg. Price Median Price Avg. DOM % Chg. in Median Price
2003 609 $406,058 $351,000 127
2004 491 $514,427 $449,900 96 28.18%
2005 619 $600,693 $530,000 166 17.80%
2006 374 $661,703 $560,000 97 5.66%
2007 278 $651,157 $540,700 100 -3.45%
2008 206 $555,530 $475,000 148 -12.15%
2009 295 $387,292 $325,000 162 -31.58%
2010 375 $350,657 $280,000 155 -13.85%
2011 306 $300,799 $242,000 98 -13.57%
2012 298 $294,415 $244,500 180 1.03%
2013 342 $318,703 $264,000 156 7.98%
2014 YTD 193 $354,440 $305,000 155 15.53%
The following chart provides an interpretation of the table above. This graph reflects the entire condominium
market in Mammoth Lakes. It’s important to understand sub-markets within the condominium market perform
differently. As of September 30th, 2014, median condominium pricing is trending 15.53% over 2013; this is the
same as the previous quarter.
$0
$100,000
$200,000
$300,000
$400,000
$500,000
$600,000
2003 2004 2005 2006 2007 2008 2009 2010 2011 2012 2013 2014YTD
Condo Median Price

.
In this issue I have broken the condominium market down by bedroom and loft utility. From this chart we can
view the performance of specific bedroom types.
Bedroom Configuration # Sales Avg. Price Median Price Days on Market Median Price/ft.
1 Bedroom 38 $201,283 $190,000 93 $258
1 Bedroom + Loft 18 $229,166 $219,000 101 $271
2 Bedroom 56 $375,787 $373,500 129 $307
2 Bedroom + Loft 25 $287,863 $275,000 92 $233
3 Bedroom 27 $551,929 $512,500 213 $328
3 Bedroom + Loft 9 $683,500 $530,000 398 $272
4 Bedroom 7 $727,333 $639,500 182 $289
4 Bedroom + Loft 1 $1,085,900 $1,085,900 10 $310
5 Bedroom+ 1 $1,090,000 $1,090,000 158 $339
Two and three bedroom sales remain strong with three bedroom sales having made big strides with regard to
value in the past 3 months.
Vacant Land Sales (All use types)
Total single family land sales over the past quarter more than doubled from the first half of 2014 with median
prices trending up vs. the first two quarters.
Med. % Change in
Year # Sales Avg. Price Median Price DOM Median Price Avg. $/Sq. Ft.
2003 63 $453,327 $412,500 196 #REF! N/A
2004 69 $1,006,919 $560,000 228 35.76% N/A
2005 62 $649,338 $480,500 202 -14.20% N/A
2006 34 $978,977 $737,500 251 53.49% $68.37
2007 21 $643,250 $513,000 260 -30.44% $47.32
2008 6 $396,417 $423,750 403 -17.40% $28.31
2009 11 $370,864 $355,000 439 -16.22% $24.06
2010 4 $349,625 $352,500 257 -0.70% $20.31
2011 9 $202,277 $170,000 399 -51.77% $16.24
2012 23 $381,718 $250,000 168 47.06% $31.06
2013 30 $450,783 $352,000 258 40.80% $28.22
2014 YTD 17 $256,433 $190,000 200 -46.02% $21.87

The information contained in this document is not guaranteed and should be verified by the reader.
Land Sales History
Land trends are not considered to be as indicative of the market as condominiums or single family home trends
simply due to the fact there are few data points and the land uses are comingled in this analysis.
Town Economy
When looking at a real estate market as a whole it is useful to look at the trends in other revenue sources as well
as the health of the governmental agency in which the real estate resides. Looking at these facts and figures also
allows us somewhat of a holistic view of the general economy in the area.
Major Category Revenue
Transient Occupancy Tax $11,600,000
Property Tax $2,996,984
Sales Tax $1,833,000
Franchise Fees $760,000
Fees, Charges, Misc. $1,177,599
Transfer-In $32,778
Total $18,400,321
The General Fund revenue projections have been established at $18,400,321. Assumptions for sales tax
revenue are assumed to be $1,833,000. According to the Town of Mammoth Lakes, revenues are broken down
as follows:
$0
$100,000
$200,000
$300,000
$400,000
$500,000
$600,000
$700,000
$800,000
Median Land Prices

.
Other
Search Tools!
Our website is unique and easy to use. We have easy to use search tools you won’t find on other sites. Try a few
of these:
Find homes that have just come on the market with one click: Recently Listed Homes
Search for homes by simply zooming in and out on a local map: Map Search
See what is available in a given neighborhood, for example: Mammoth Slopes
Do you want to know what’s for sale in a particular condominium complex or area? Condo Development Search
There are many more search tools, and if there is something you can’t find, we are just an email or phone call
away. [email protected] or 760-934-1110.
The information contained in this document is not guaranteed and should be verified by the reader.
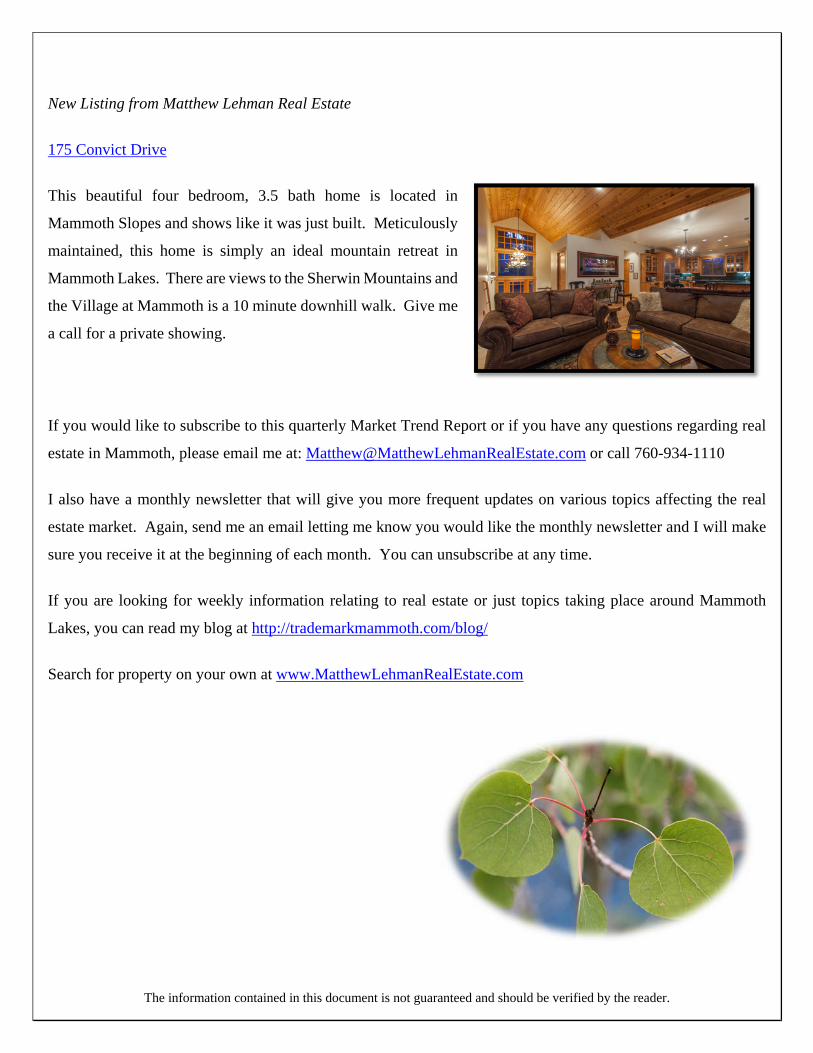
New Listing from Matthew Lehman Real Estate
175 Convict Drive
This beautiful four bedroom, 3.5 bath home is located in
Mammoth Slopes and shows like it was just built. Meticulously
maintained, this home is simply an ideal mountain retreat in
Mammoth Lakes. There are views to the Sherwin Mountains and
the Village at Mammoth is a 10 minute downhill walk. Give me
a call for a private showing.
If you would like to subscribe to this quarterly Market Trend Report or if you have any questions regarding real
estate in Mammoth, please email me at: [email protected] or call 760-934-1110
I also have a monthly newsletter that will give you more frequent updates on various topics affecting the real
estate market. Again, send me an email letting me know you would like the monthly newsletter and I will make
sure you receive it at the beginning of each month. You can unsubscribe at any time.
If you are looking for weekly information relating to real estate or just topics taking place around Mammoth
Lakes, you can read my blog at http://trademarkmammoth.com/blog/
Search for property on your own at www.MatthewLehmanRealEstate.com

.


![WATER-QUALITY APPRAISAL MAMMOTH CREEK AND HOT … · Mammoth Creek originates from a series of small lakes near the Mammoth crest area of Inyo National Forest (fig. 1 [in pocket]](https://static.fdocuments.net/doc/165x107/5f0dac2f7e708231d43b83c2/water-quality-appraisal-mammoth-creek-and-hot-mammoth-creek-originates-from-a-series.jpg)
