

Malaysia Property Market Outlook Mid Year Review and · PDF fileMalaysia Property Market...
61
Malaysia Property Market Outlook Mid Year Review and The Southern Shift of The Property Centre of Gravity Connecting the …… dots between economy, demographic trends and new housing concepts REI Group of Companies Presentation by Dr. Daniele Gambero
Transcript of Malaysia Property Market Outlook Mid Year Review and · PDF fileMalaysia Property Market...
Malaysia Property Market Outlook Mid Year Review and The Southern Shift of The
Property Centre of Gravity
Connecting the …… dots between economy, demographic trends and new housing concepts
REI Group of Companies Presentation by Dr. Daniele Gambero
DISCLAIMER AND COPYWRITE To the best of our knowledge, all information included here falls under the fair use or public domain guidelines of copyright laws. We strive for accuracy but cannot be held responsible for any errors in information featured in the slides or incorrect attributions. REI Group of Companies uses reasonable efforts to include accurate and up to date information however REI Group of Companies makes no warranties or representations as to its accuracy. REI Group of Companies assumes no liability or responsibility for any errors or omissions in the content. The quotes, articles, news and views are not necessarily representative of the views of REI Group of Companies and its directors and Management. This Presentation has been shared for personal use and knowledge ONLY. Any inappropriate use will be prosecuted according to the law and any total or partial use of this presentation for public viewing or publishing must be pre-authorized in writing by REI Group of Companies.
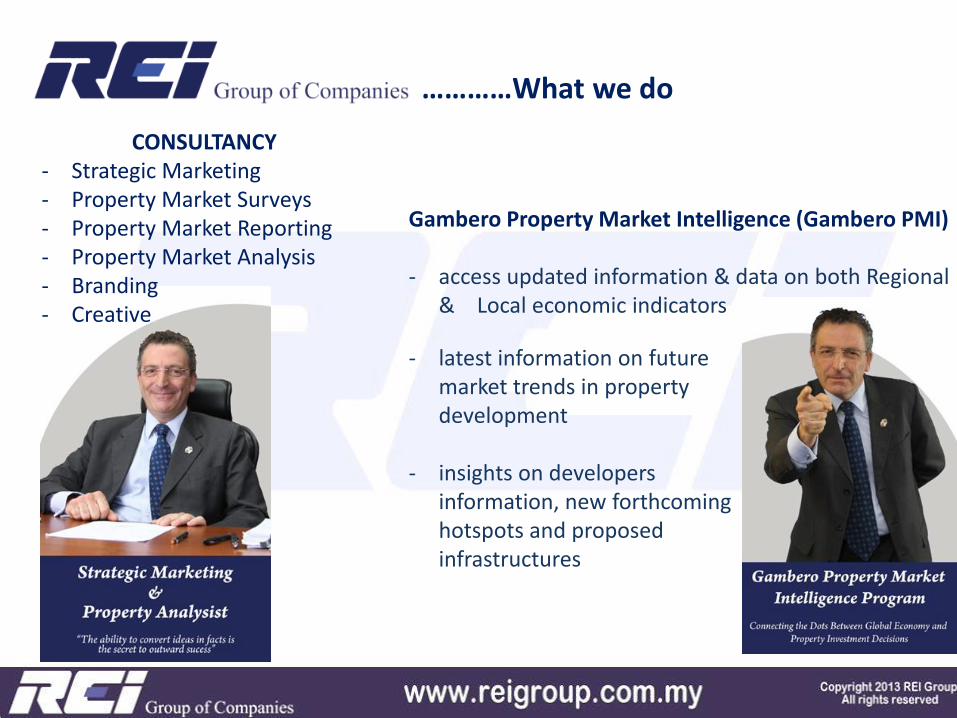
CONSULTANCY - Strategic Marketing - Property Market Surveys - Property Market Reporting - Property Market Analysis - Branding - Creative
- latest information on future
market trends in property development
- insights on developers information, new forthcoming hotspots and proposed infrastructures
Gambero Property Market Intelligence (Gambero PMI) - access updated information & data on both Regional
& Local economic indicators
…………What we do
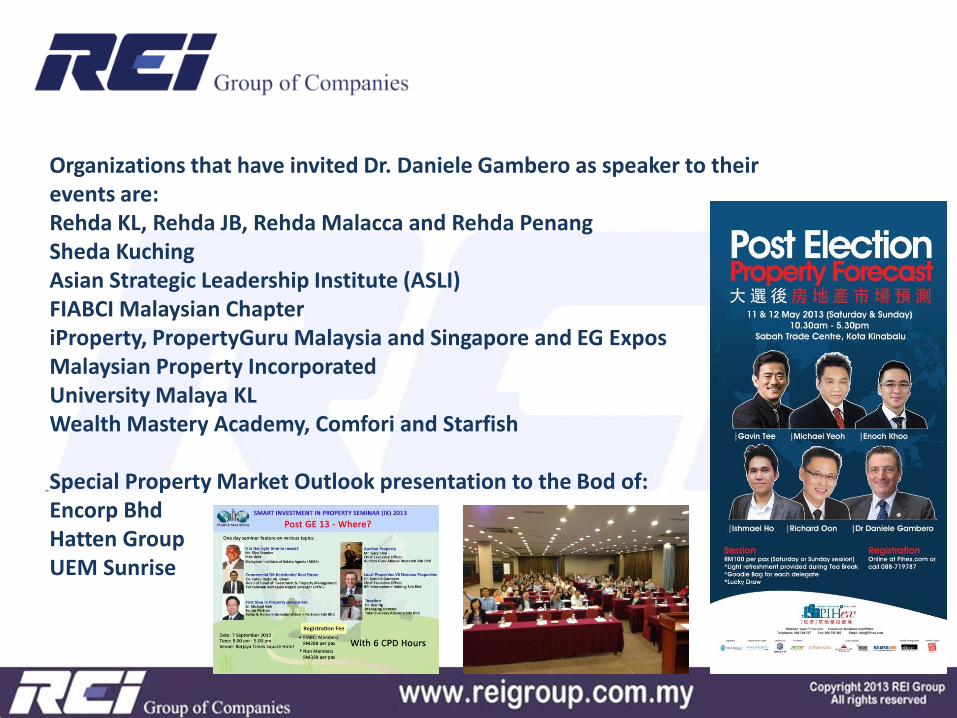
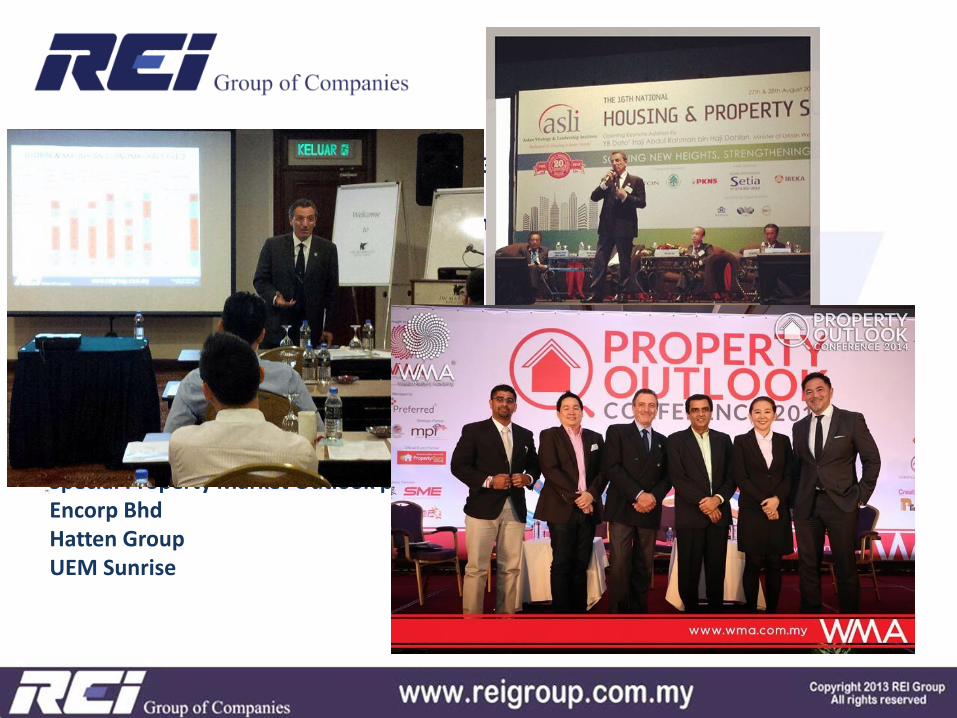
Organizations that have invited Dr. Daniele Gambero as speaker to their events are: Rehda KL, Rehda JB, Rehda Malacca and Rehda Penang Sheda Kuching Asian Strategic Leadership Institute (ASLI) FIABCI Malaysian Chapter iProperty, PropertyGuru Malaysia and Singapore and EG Expos Malaysian Property Incorporated University Malaya KL Wealth Mastery Academy, Comfori and Starfish Special Property Market Outlook presentation to the Bod of: Encorp Bhd Hatten Group UEM Sunrise
Organizations that have invited Dr. Daniele Gambero as speaker to their events are: Rehda KL, Rehda JB, Rehda Malacca and Rehda Penang Sheda Kuching Asian Strategic Leadership Institute (ASLI) FIABCI Malaysian Chapter iProperty, PropertyGuru Malaysia and Singapore and EG Expos Malaysian Property Incorporated University Malaya KL Wealth Mastery Academy, Comfori and Starfish Special Property Market Outlook presentation to the Bod of: Encorp Bhd Hatten Group UEM Sunrise

Organizations that have invited Dr. Daniele Gambero as speaker to their events are: Rehda KL, Rehda JB, Rehda Malacca and Rehda Penang Sheda Kuching Asian Strategic Leadership Institute (ASLI) FIABCI Malaysian Chapter iProperty, PropertyGuru Malaysia and Singapore and EG Expos Malaysian Property Incorporated University Malaya KL Wealth Mastery Academy, Comfori and Starfish Special Property Market Outlook presentation to the Bod of: Encorp Bhd Hatten Group UEM Sunrise
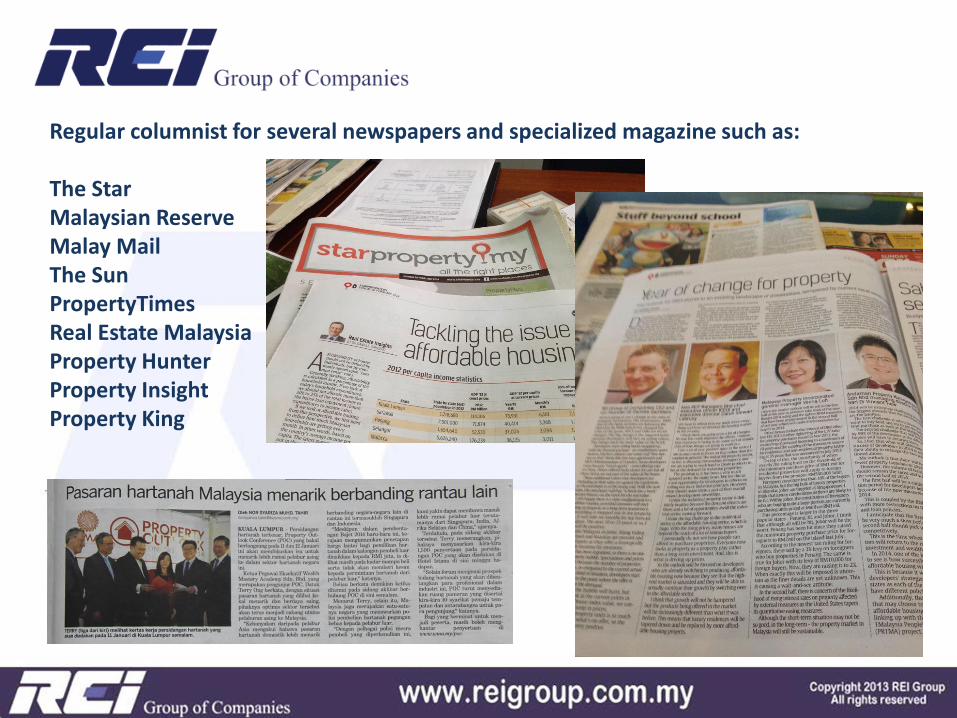
Regular columnist for several newspapers and specialized magazine such as: The Star Malaysian Reserve Malay Mail The Sun PropertyTimes Real Estate Malaysia Property Hunter Property Insight Property King

Regular columnist for several newspapers and specialized magazine such as: The Star Malaysian Reserve Malay Mail The Sun PropertyTimes Real Estate Malaysia Property Hunter Property Insight Property King
Agenda
Malaysian Economic Performance: room for improvement
Malaysian Economy: Fact File
Malaysian Demographic and Wealth: the way forward
Malaysian Real Estate: Strategically Sustainable
Malaysian Real Estate: what and where
Malaysian Real Estate: when and why
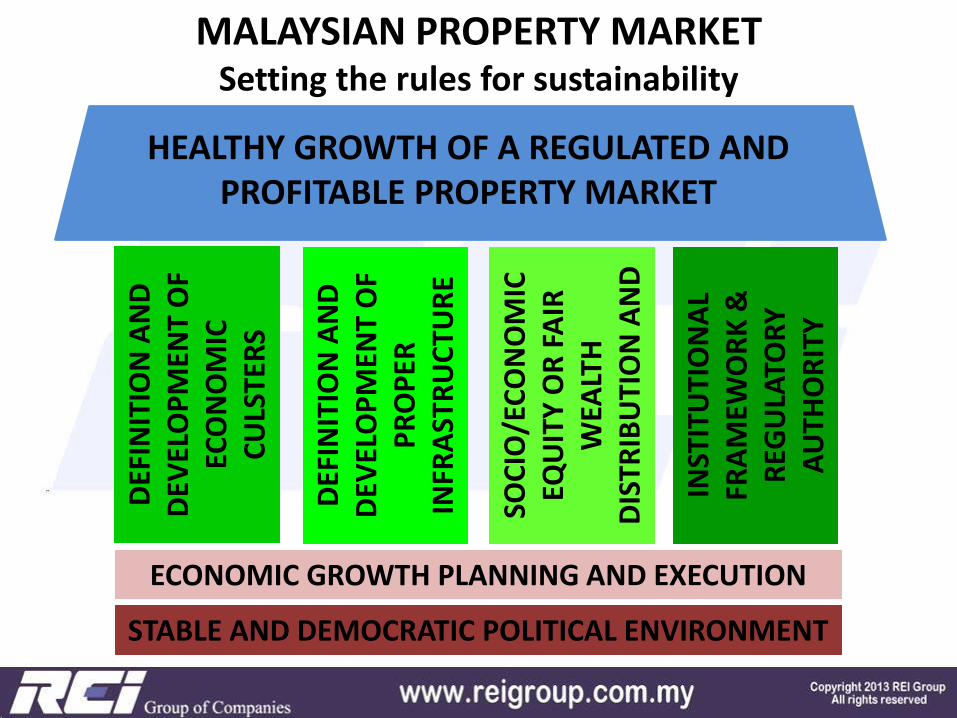
MALAYSIAN PROPERTY MARKET Setting the rules for sustainability
STABLE AND DEMOCRATIC POLITICAL ENVIRONMENT
ECONOMIC GROWTH PLANNING AND EXECUTION
DEF
INIT
ION
AN
D
DEV
ELO
PM
ENT
OF
ECO
NO
MIC
C
ULS
TER
S
DEF
INIT
ION
AN
D
DEV
ELO
PM
ENT
OF
PR
OP
ER
INFR
AST
RU
CTU
RE
SOC
IO/E
CO
NO
MIC
EQ
UIT
Y O
R F
AIR
W
EALT
H
DIS
TRIB
UTI
ON
AN
D
INST
ITU
TIO
NA
L FR
AM
EWO
RK
&
REG
ULA
TOR
Y
AU
THO
RIT
Y
HEALTHY GROWTH OF A REGULATED AND PROFITABLE PROPERTY MARKET
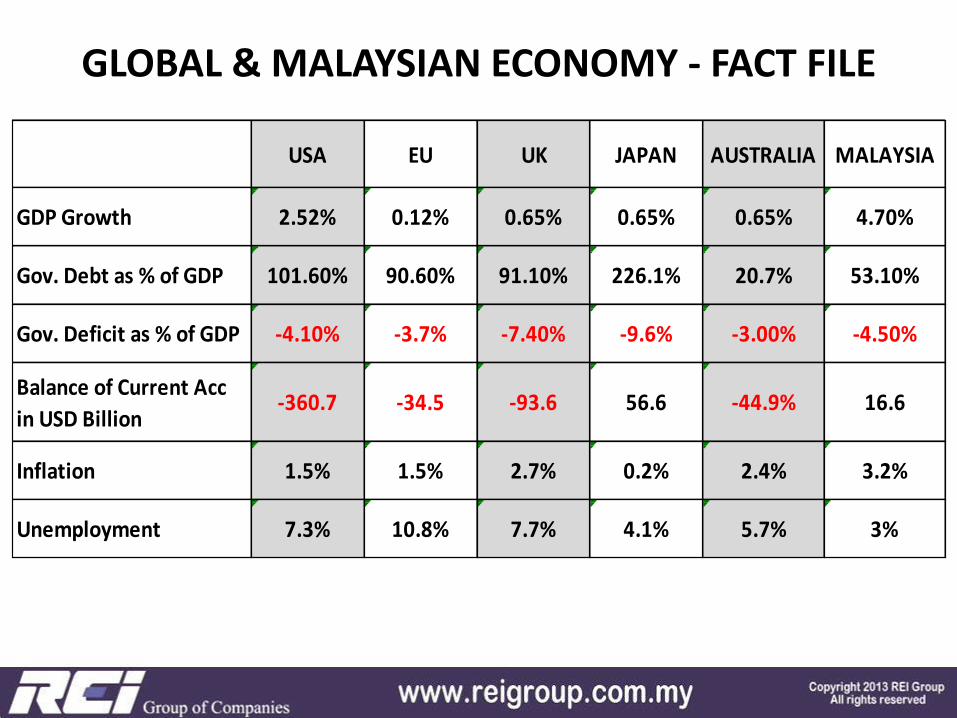
USA EU UK JAPAN AUSTRALIA MALAYSIA
GDP Growth 2.52% 0.12% 0.65% 0.65% 0.65% 4.70%
Gov. Debt as % of GDP 101.60% 90.60% 91.10% 226.1% 20.7% 53.10%
Gov. Deficit as % of GDP -4.10% -3.7% -7.40% -9.6% -3.00% -4.50%
Balance of Current Acc
in USD Billion-360.7 -34.5 -93.6 56.6 -44.9% 16.6
Inflation 1.5% 1.5% 2.7% 0.2% 2.4% 3.2%
Unemployment 7.3% 10.8% 7.7% 4.1% 5.7% 3%
GLOBAL & MALAYSIAN ECONOMY - FACT FILE
USA EU UK JAPAN AUSTRALIA MALAYSIA
GDP Growth 2.52% 0.12% 0.65% 0.65% 0.65% 4.70%
Gov. Debt as % of GDP 101.60% 90.60% 91.10% 226.1% 20.7% 53.10%
Gov. Deficit as % of GDP -4.10% -3.7% -7.40% -9.6% -3.00% -4.50%
Balance of Current Acc
in USD Billion-360.7 -34.5 -93.6 56.6 -44.9% 16.6
Inflation 1.5% 1.5% 2.7% 0.2% 2.4% 3.2%
Unemployment 7.3% 10.8% 7.7% 4.1% 5.7% 3%
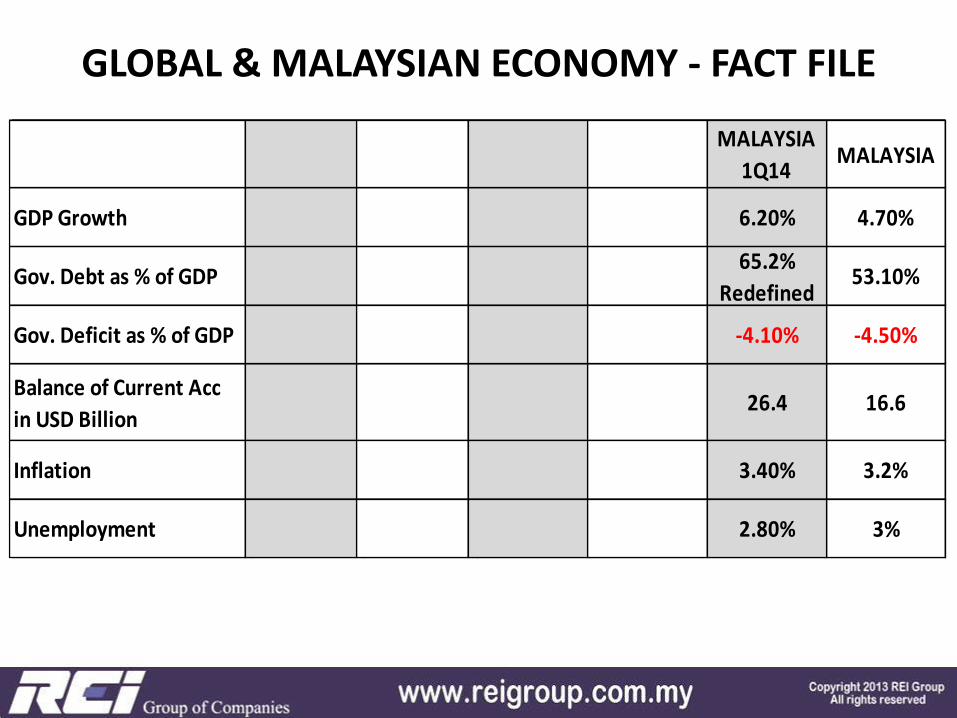
GLOBAL & MALAYSIAN ECONOMY - FACT FILE
MALAYSIA
1Q14MALAYSIA
GDP Growth 6.20% 4.70%
Gov. Debt as % of GDP65.2%
Redefined53.10%
Gov. Deficit as % of GDP -4.10% -4.50%
Balance of Current Acc
in USD Billion26.4 16.6
Inflation 3.40% 3.2%
Unemployment 2.80% 3%
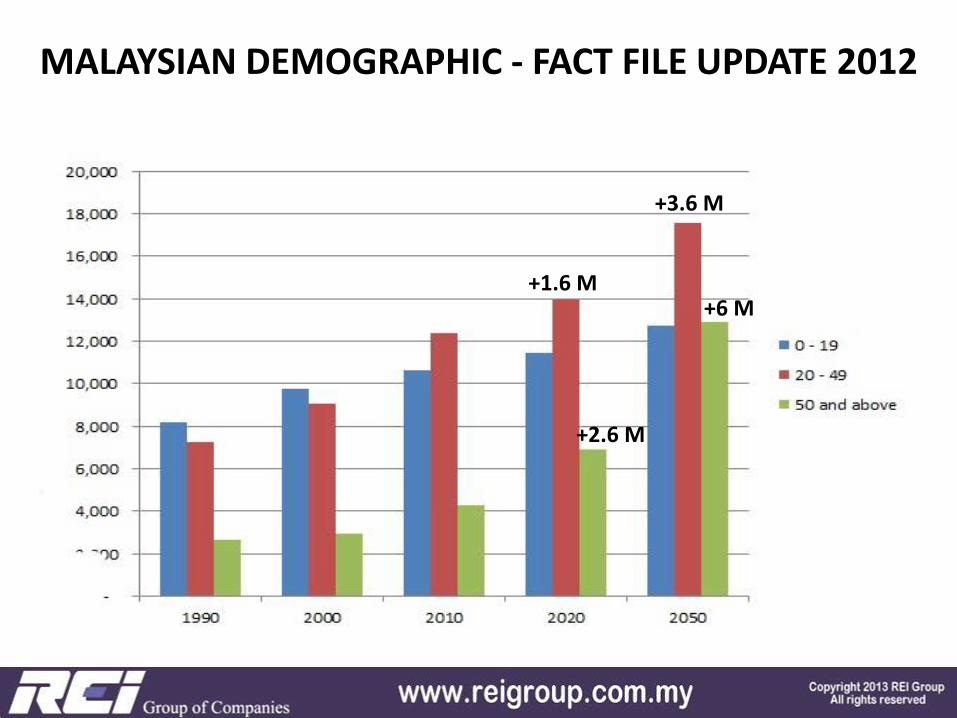
MALAYSIAN DEMOGRAPHIC - FACT FILE UPDATE 2012
+1.6 M
+3.6 M
+2.6 M
+6 M
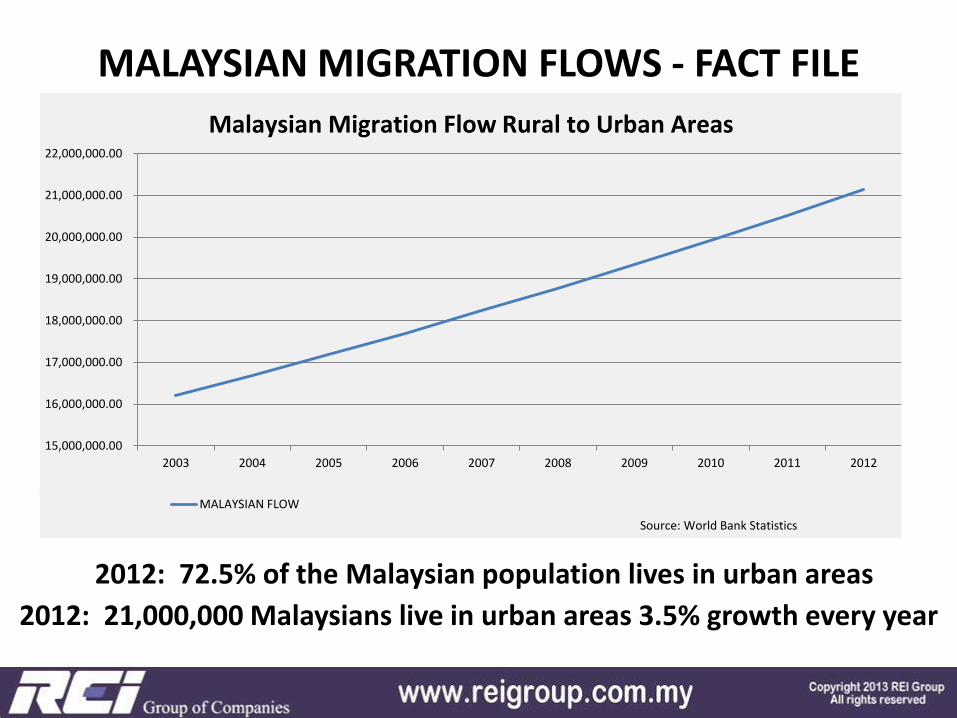
MALAYSIAN MIGRATION FLOWS - FACT FILE
2012: 21,000,000 Malaysians live in urban areas 3.5% growth every year
2012: 72.5% of the Malaysian population lives in urban areas
15,000,000.00
16,000,000.00
17,000,000.00
18,000,000.00
19,000,000.00
20,000,000.00
21,000,000.00
22,000,000.00
2003 2004 2005 2006 2007 2008 2009 2010 2011 2012
MALAYSIAN FLOW
Malaysian Migration Flow Rural to Urban Areas
Source: World Bank Statistics
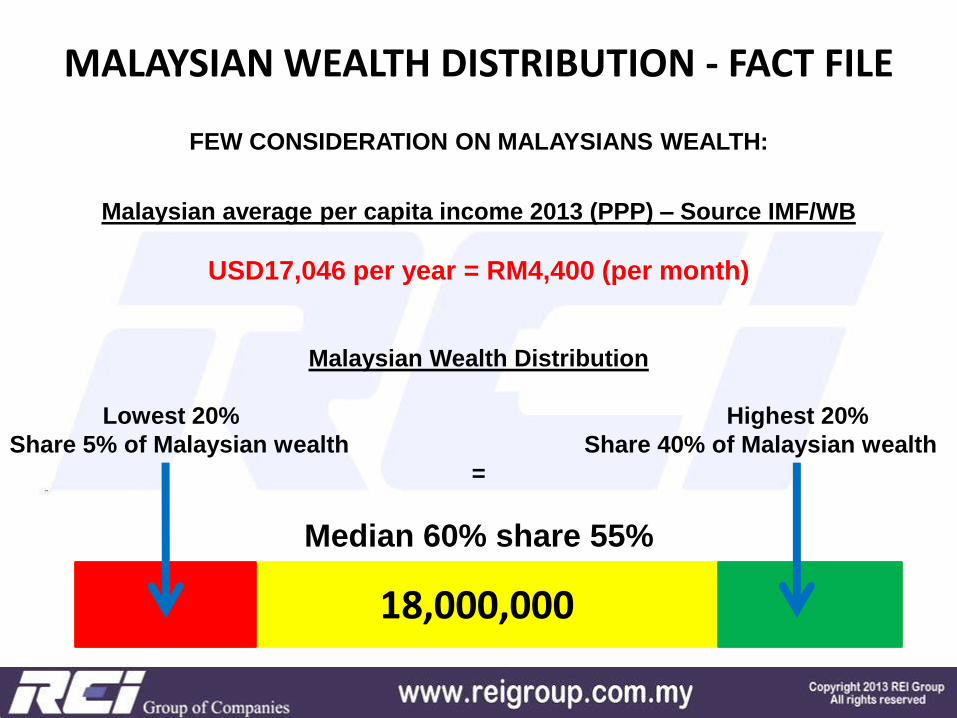
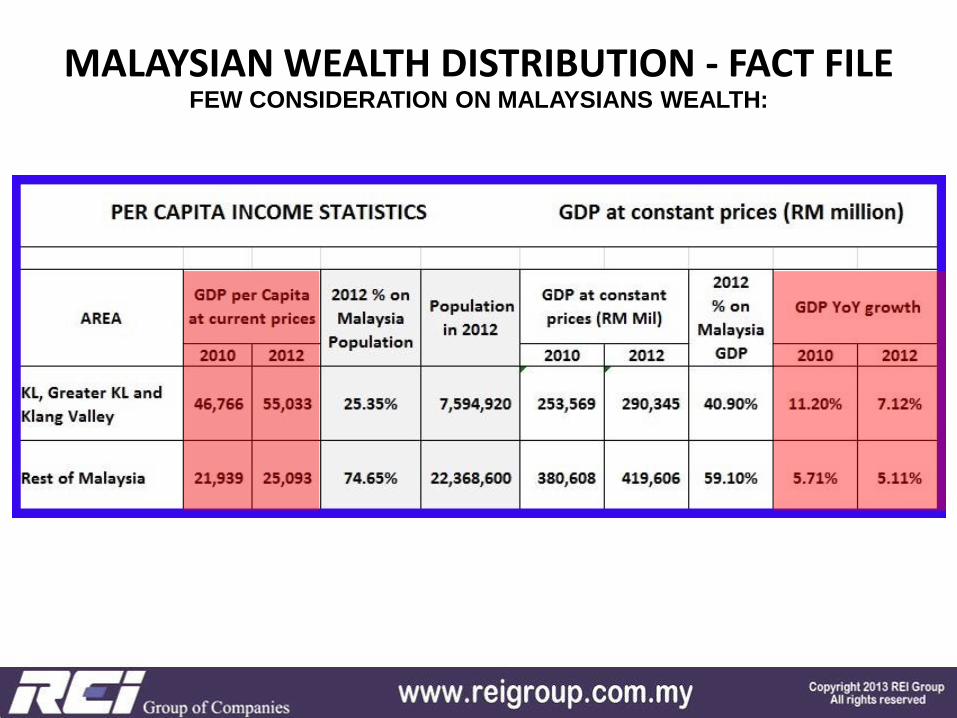
FEW CONSIDERATION ON MALAYSIANS WEALTH:
Malaysian average per capita income 2013 (PPP) – Source IMF/WB
USD17,046 per year = RM4,400 (per month)
Malaysian Wealth Distribution
Lowest 20% Highest 20%
Share 5% of Malaysian wealth Share 40% of Malaysian wealth
=
Median 60% share 55%
MALAYSIAN WEALTH DISTRIBUTION - FACT FILE
18,000,000
FEW CONSIDERATION ON MALAYSIANS WEALTH:
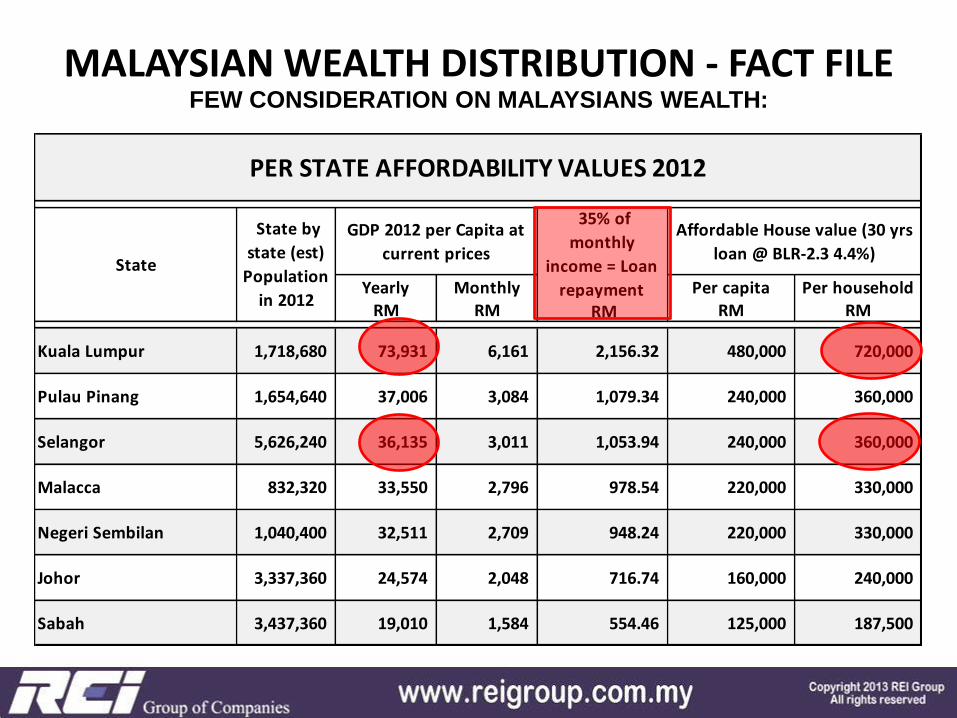
MALAYSIAN WEALTH DISTRIBUTION - FACT FILE
Yearly Monthly Per capita Per household
RM RM RM RM RM
Kuala Lumpur 1,718,680 73,931 6,161 2,156.32 480,000 720,000
Pulau Pinang 1,654,640 37,006 3,084 1,079.34 240,000 360,000
Selangor 5,626,240 36,135 3,011 1,053.94 240,000 360,000
Malacca 832,320 33,550 2,796 978.54 220,000 330,000
Negeri Sembilan 1,040,400 32,511 2,709 948.24 220,000 330,000
Johor 3,337,360 24,574 2,048 716.74 160,000 240,000
Sabah 3,437,360 19,010 1,584 554.46 125,000 187,500
PER STATE AFFORDABILITY VALUES 2012
State
State by
state (est)
Population
in 2012
GDP 2012 per Capita at
current prices
35% of
monthly
income = Loan
repayment
Affordable House value (30 yrs
loan @ BLR-2.3 4.4%)
FEW CONSIDERATION ON MALAYSIANS WEALTH:
MALAYSIAN WEALTH DISTRIBUTION - FACT FILE
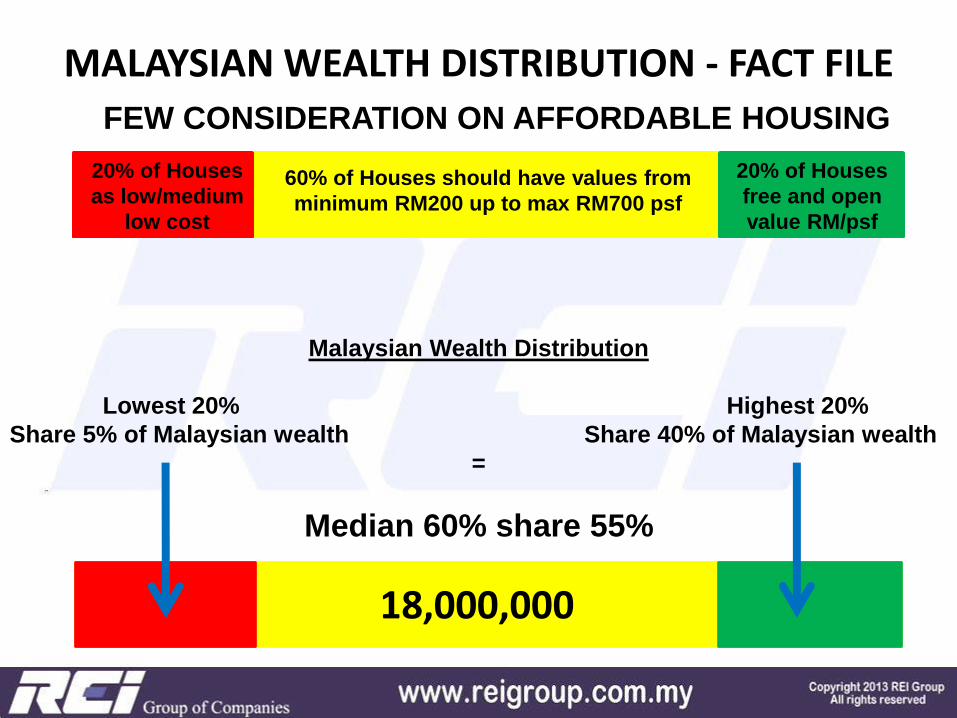
20% of Houses
as low/medium
low cost
Malaysian Wealth Distribution
Lowest 20% Highest 20%
Share 5% of Malaysian wealth Share 40% of Malaysian wealth
=
Median 60% share 55%
MALAYSIAN WEALTH DISTRIBUTION - FACT FILE
18,000,000
20% of Houses
free and open
value RM/psf
60% of Houses should have values from
minimum RM200 up to max RM700 psf
FEW CONSIDERATION ON AFFORDABLE HOUSING
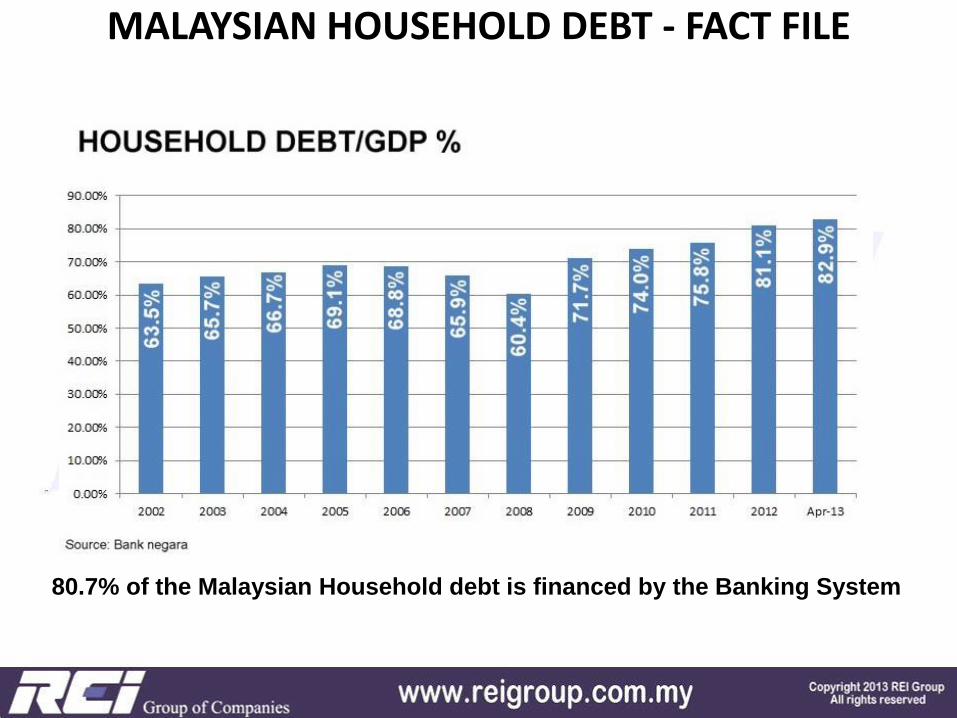
MALAYSIAN HOUSEHOLD DEBT - FACT FILE
80.7% of the Malaysian Household debt is financed by the Banking System
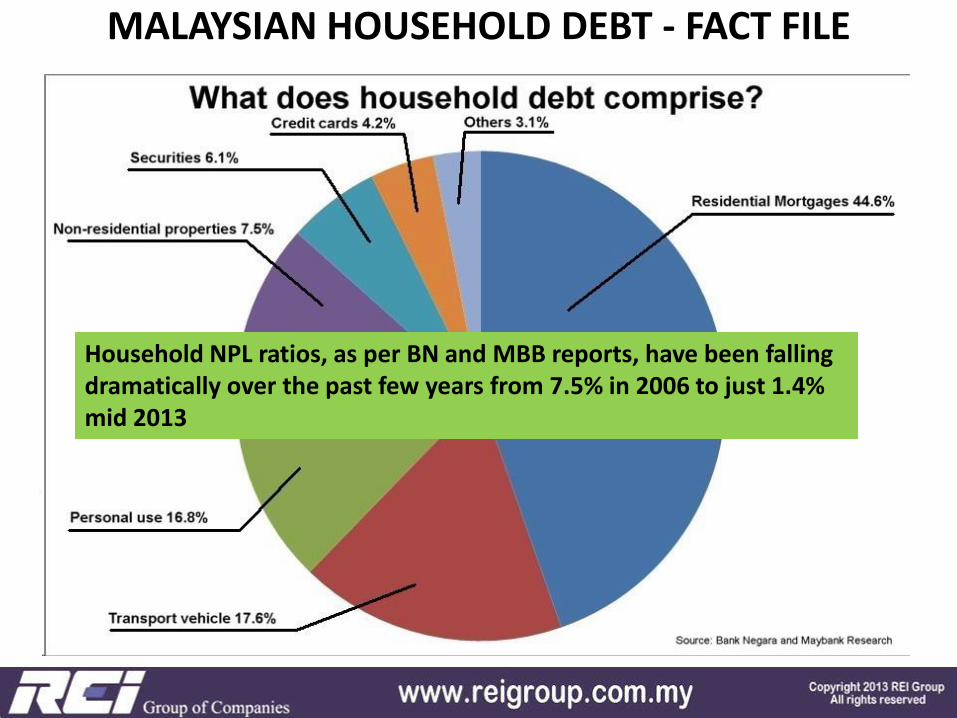
MALAYSIAN HOUSEHOLD DEBT - FACT FILE
80.7% of the Malaysian Household debt is financed by the Banking System
Household NPL ratios, as per BN and MBB reports, have been falling dramatically over the past few years from 7.5% in 2006 to just 1.4% mid 2013
MALAYSIAN PROPERTY MARKET SUSTAINABILITY
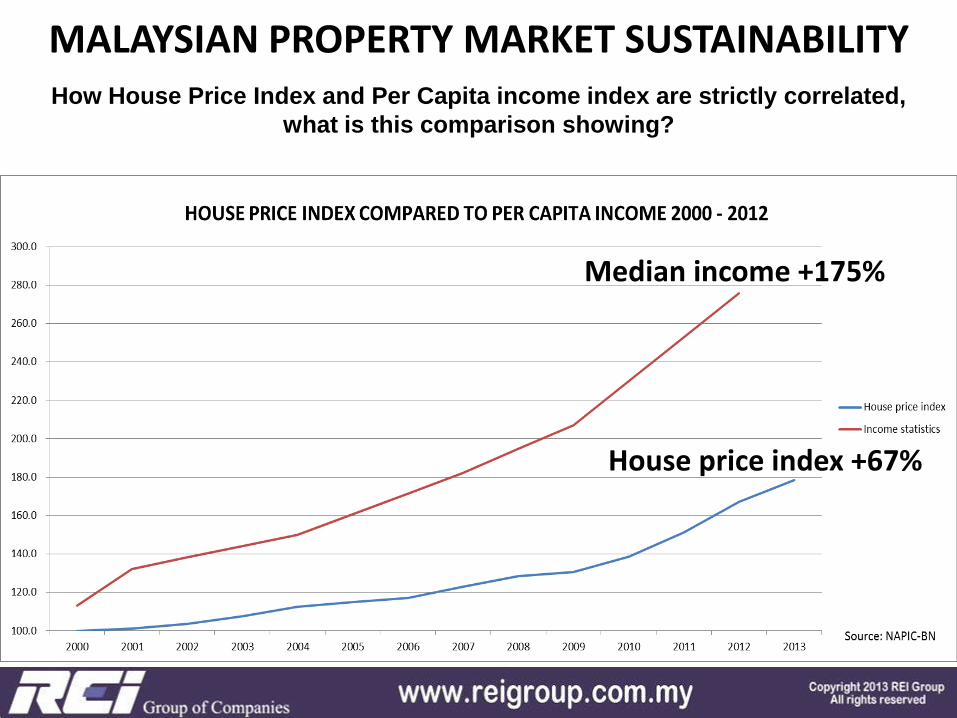
House - Income trend 2000 2001 2002 2003 2004 2005 2006 2007 2008 2009 2010 2011 2012 2013
House price index 100.0 101.1 103.5 107.5 112.4 115.0 117.2 123.1 128.6 130.5 138.8 151.2 167.2 178.4
Income statistics 213.0 232.1 238.2 244.2 250.0 260.8 271.5 282.2 294.6 307.0 330.0 352.9 375.8
How House Price Index and Per Capita income index are strictly correlated,
what is this comparison showing?
House price index +67%
Median income +175%
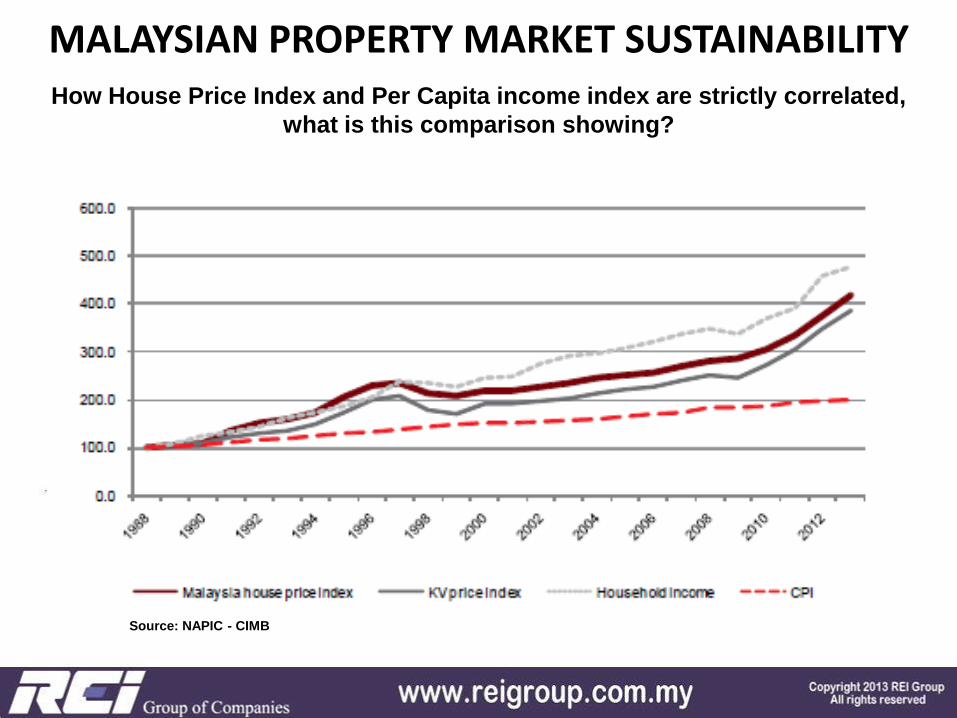
MALAYSIAN PROPERTY MARKET SUSTAINABILITY How House Price Index and Per Capita income index are strictly correlated,
what is this comparison showing?
Source: NAPIC - CIMB
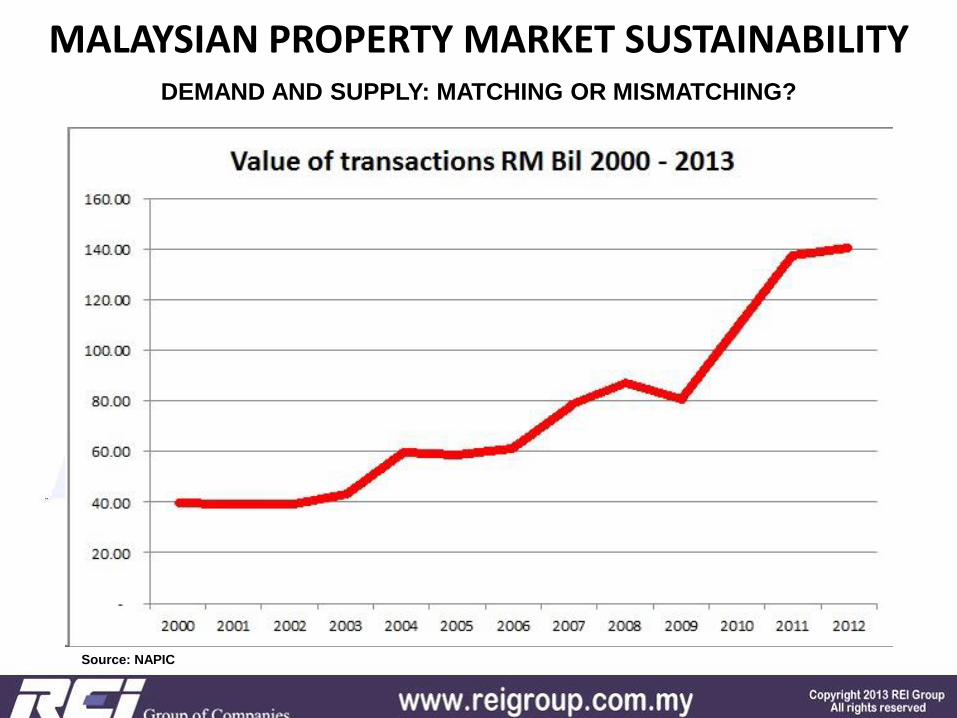
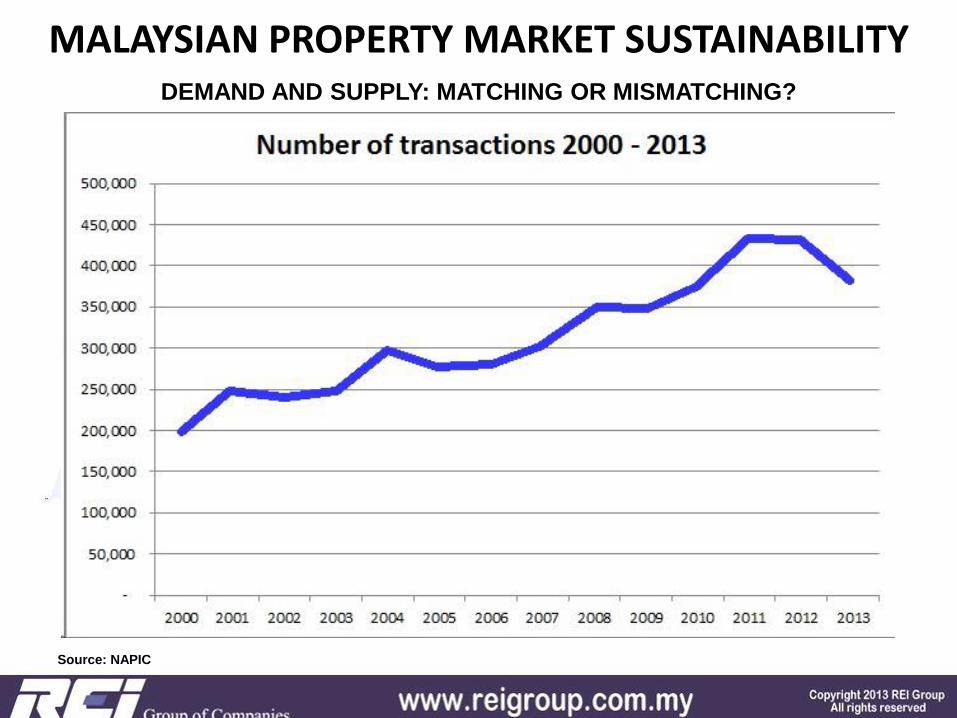
MALAYSIAN PROPERTY MARKET SUSTAINABILITY DEMAND AND SUPPLY: MATCHING OR MISMATCHING?
Source: NAPIC
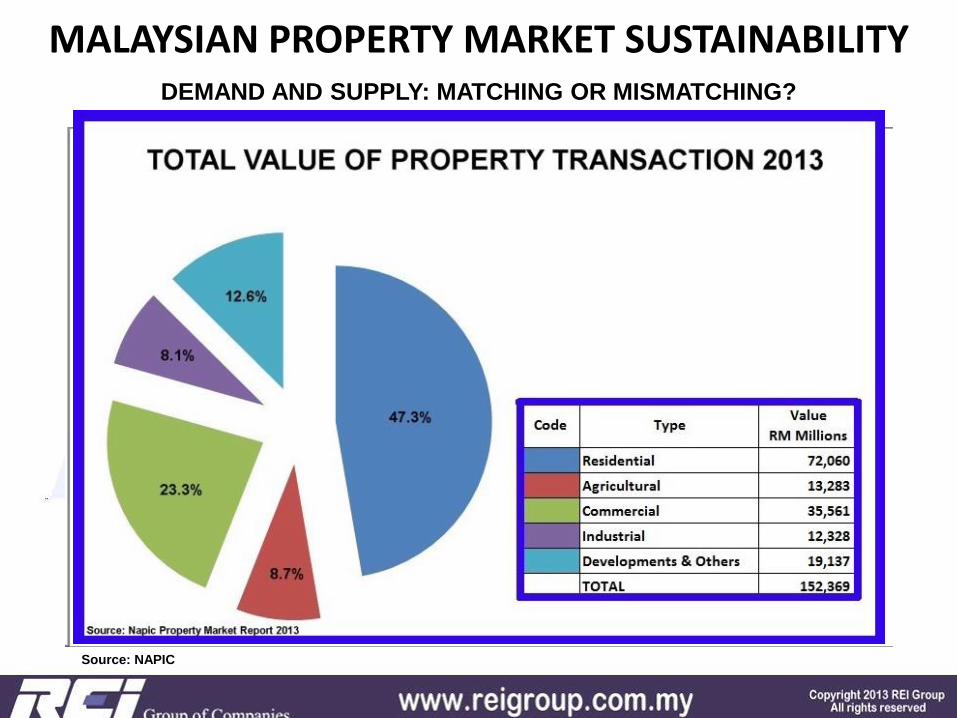
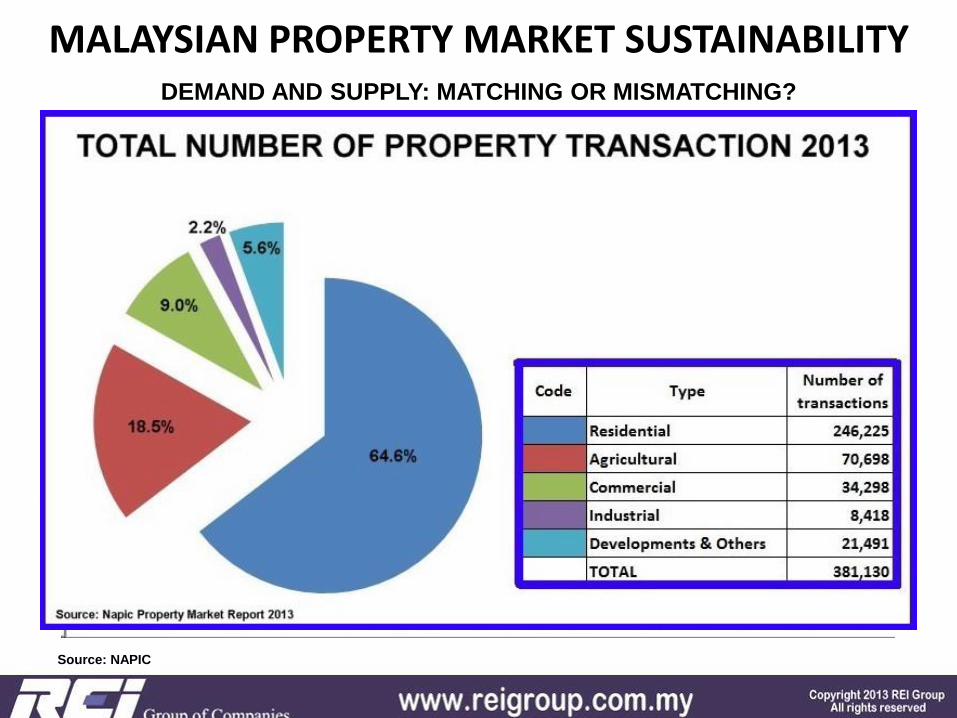
MALAYSIAN PROPERTY MARKET SUSTAINABILITY DEMAND AND SUPPLY: MATCHING OR MISMATCHING?
Source: NAPIC
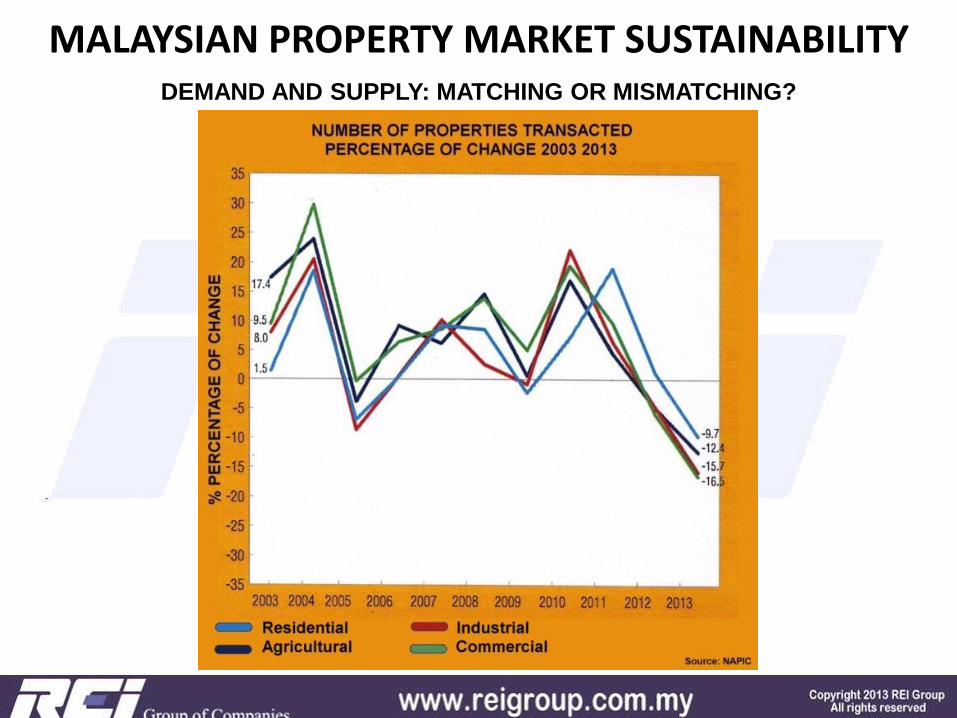
MALAYSIAN PROPERTY MARKET SUSTAINABILITY DEMAND AND SUPPLY: MATCHING OR MISMATCHING?
Source: NAPIC
MALAYSIAN PROPERTY MARKET SUSTAINABILITY DEMAND AND SUPPLY: MATCHING OR MISMATCHING?
Source: NAPIC
MALAYSIAN PROPERTY MARKET SUSTAINABILITY DEMAND AND SUPPLY: MATCHING OR MISMATCHING?
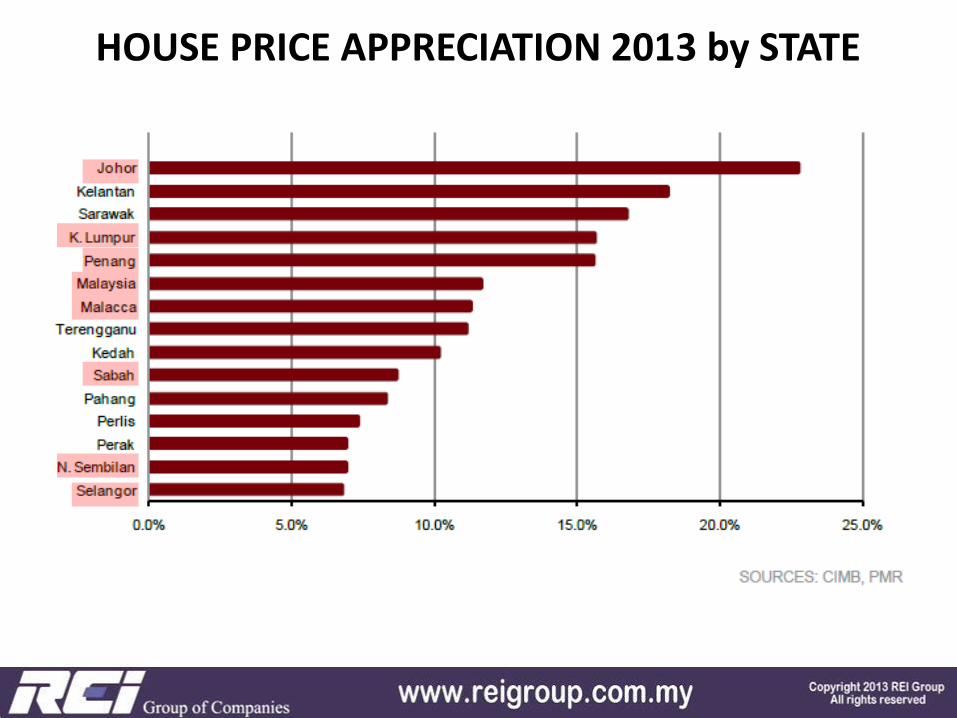
HOUSE PRICE APPRECIATION 2013 by STATE
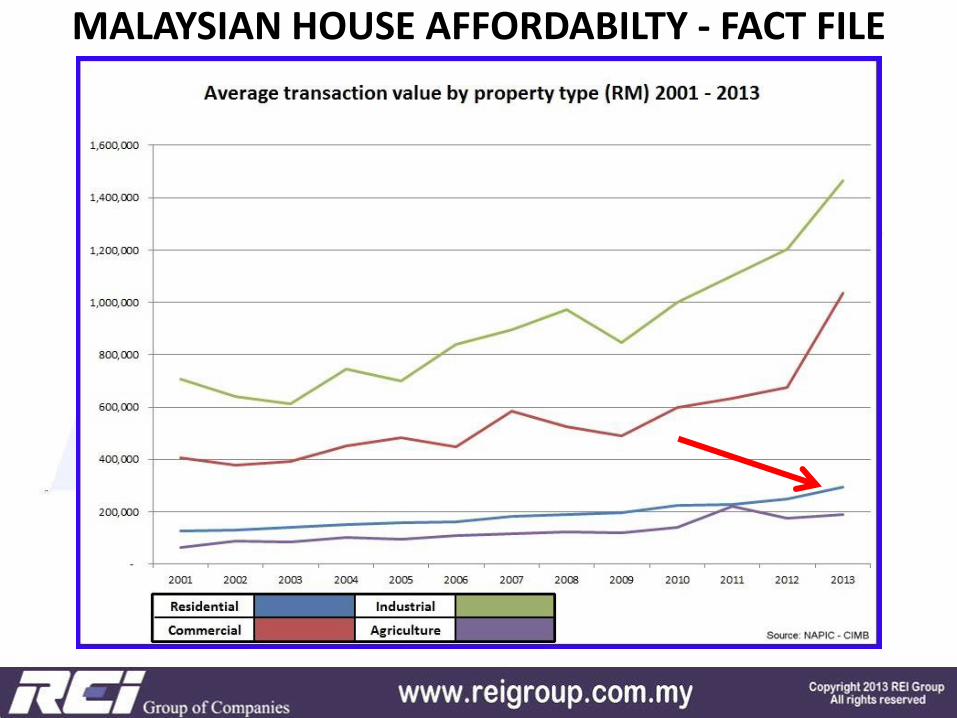
MALAYSIAN HOUSE AFFORDABILTY - FACT FILE
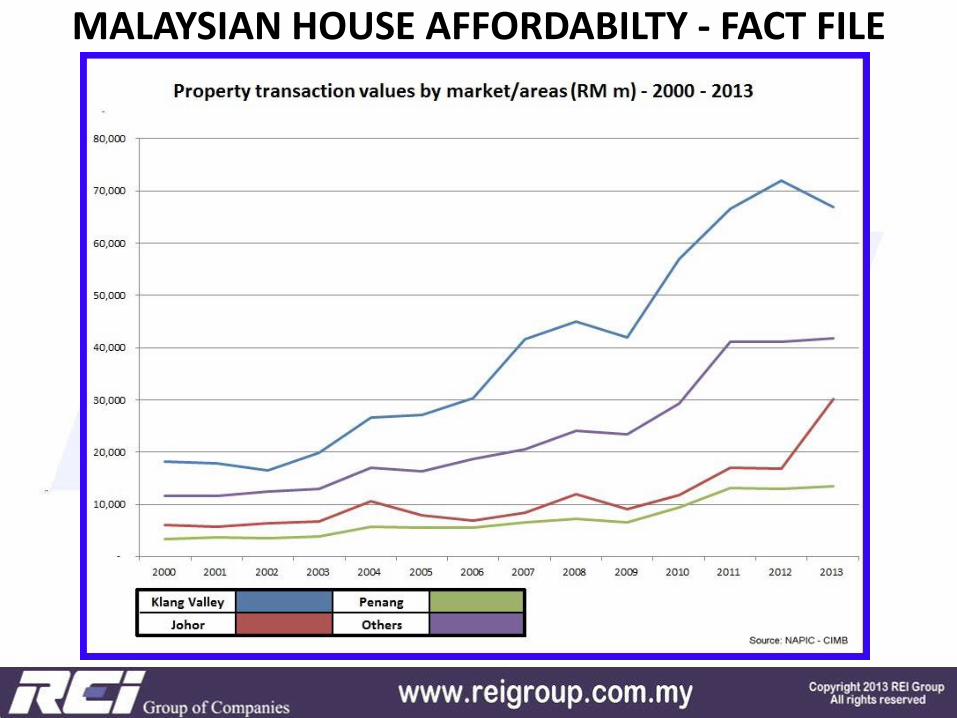
MALAYSIAN HOUSE AFFORDABILTY - FACT FILE
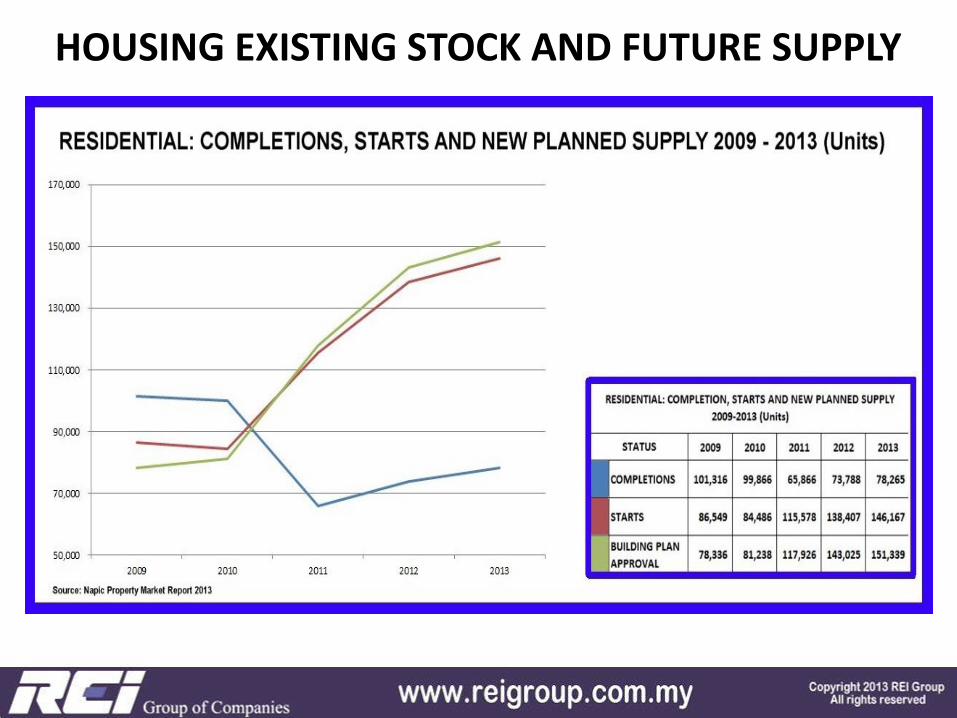
HOUSING EXISTING STOCK AND FUTURE SUPPLY
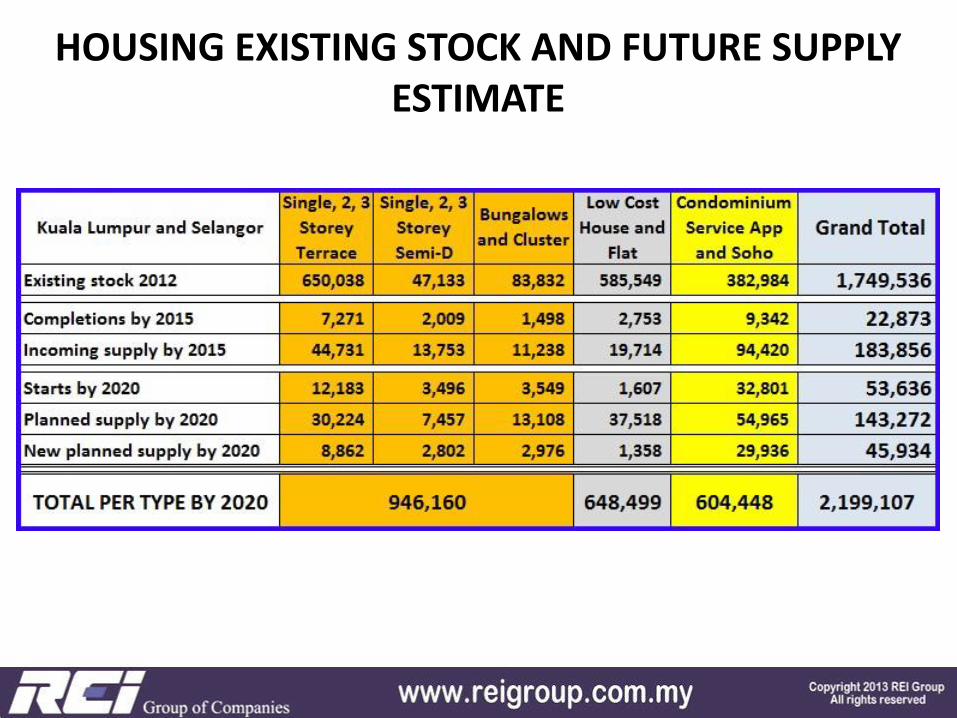
HOUSING EXISTING STOCK AND FUTURE SUPPLY ESTIMATE
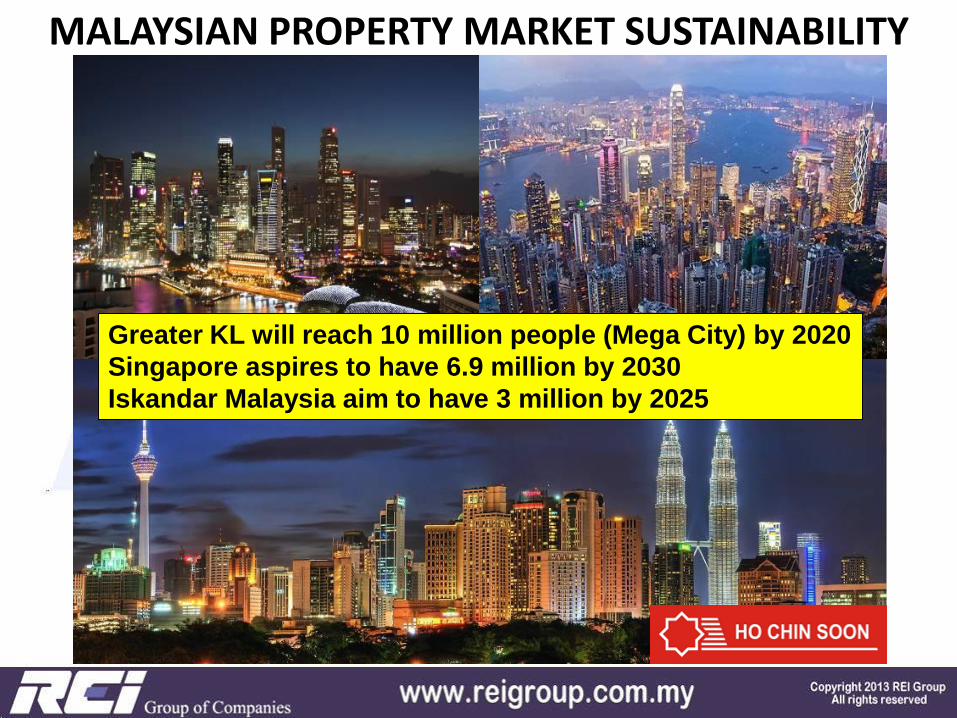
Greater KL will reach 10 million people (Mega City) by 2020
Singapore aspires to have 6.9 million by 2030
Iskandar Malaysia aim to have 3 million by 2025
MALAYSIAN PROPERTY MARKET SUSTAINABILITY
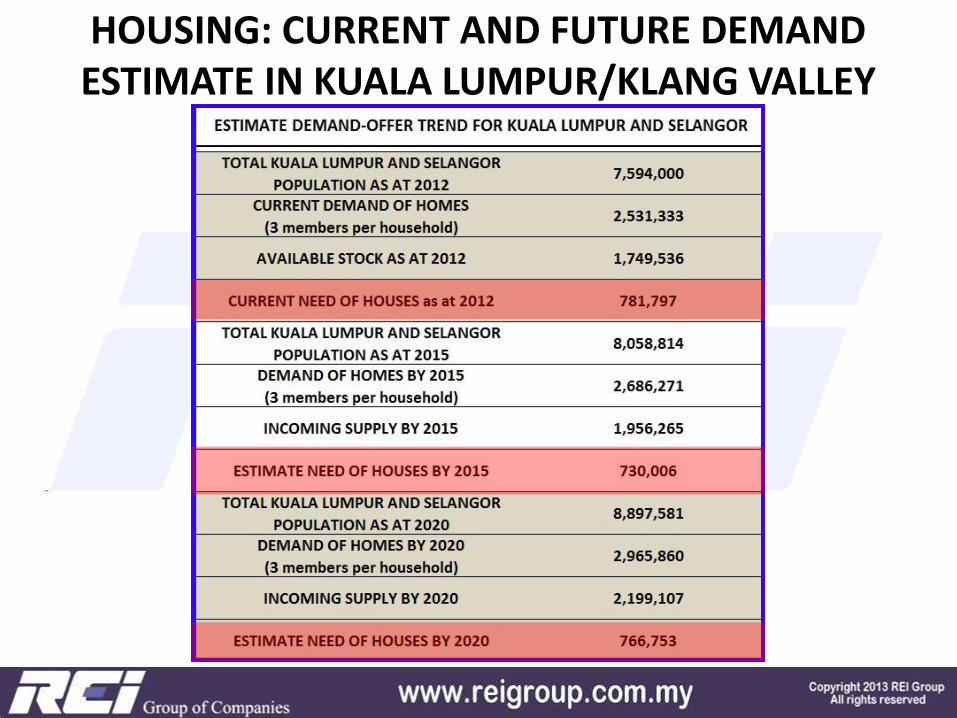
HOUSING: CURRENT AND FUTURE DEMAND ESTIMATE IN KUALA LUMPUR/KLANG VALLEY
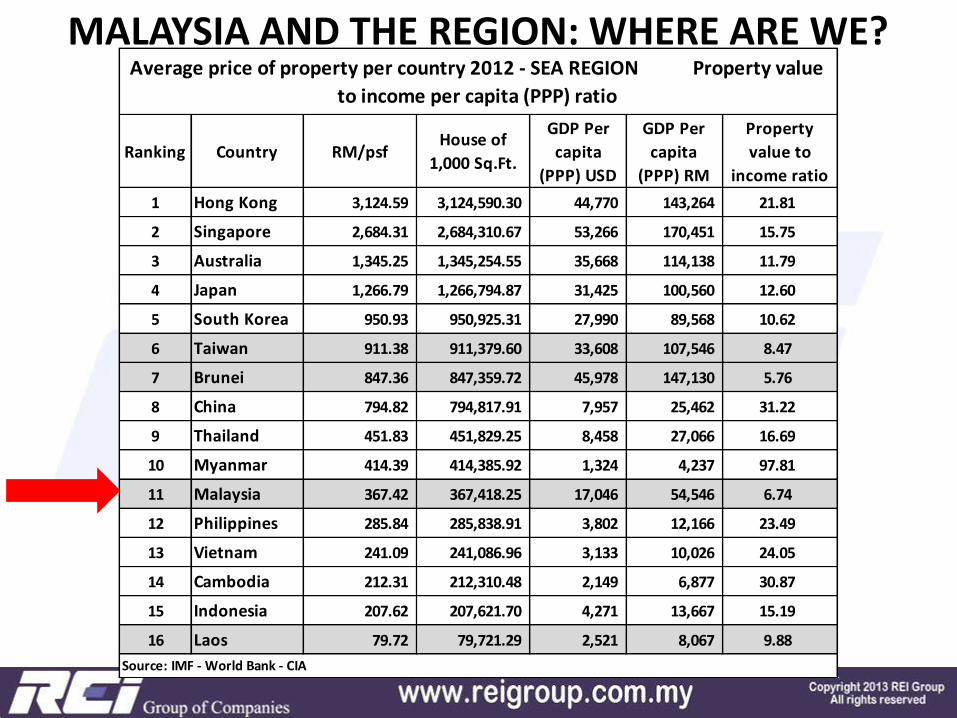
MALAYSIA AND THE REGION: WHERE ARE WE?
Ranking Country RM/psfHouse of
1,000 Sq.Ft.
GDP Per
capita
(PPP) USD
GDP Per
capita
(PPP) RM
Property
value to
income ratio
1 Hong Kong 3,124.59 3,124,590.30 44,770 143,264 21.81
2 Singapore 2,684.31 2,684,310.67 53,266 170,451 15.75
3 Australia 1,345.25 1,345,254.55 35,668 114,138 11.79
4 Japan 1,266.79 1,266,794.87 31,425 100,560 12.60
5 South Korea 950.93 950,925.31 27,990 89,568 10.62
6 Taiwan 911.38 911,379.60 33,608 107,546 8.47
7 Brunei 847.36 847,359.72 45,978 147,130 5.76
8 China 794.82 794,817.91 7,957 25,462 31.22
9 Thailand 451.83 451,829.25 8,458 27,066 16.69
10 Myanmar 414.39 414,385.92 1,324 4,237 97.81
11 Malaysia 367.42 367,418.25 17,046 54,546 6.74
12 Philippines 285.84 285,838.91 3,802 12,166 23.49
13 Vietnam 241.09 241,086.96 3,133 10,026 24.05
14 Cambodia 212.31 212,310.48 2,149 6,877 30.87
15 Indonesia 207.62 207,621.70 4,271 13,667 15.19
16 Laos 79.72 79,721.29 2,521 8,067 9.88
Source: IMF - World Bank - CIA
Average price of property per country 2012 - SEA REGION Property value
to income per capita (PPP) ratio
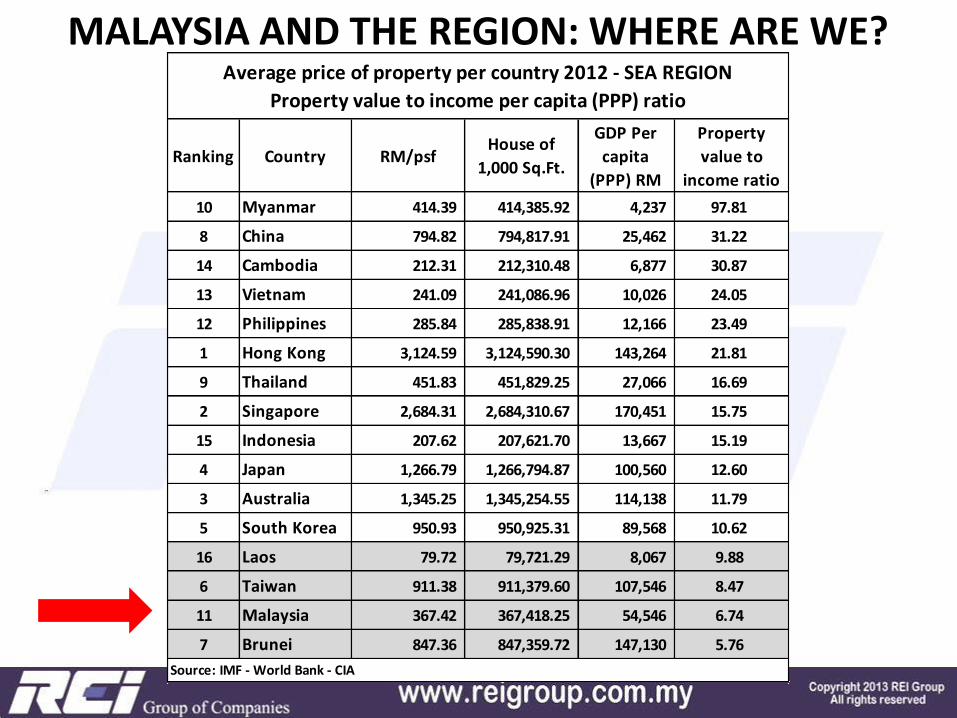
MALAYSIA AND THE REGION: WHERE ARE WE?
Ranking Country RM/psfHouse of
1,000 Sq.Ft.
GDP Per
capita
(PPP) RM
Property
value to
income ratio
10 Myanmar 414.39 414,385.92 4,237 97.81
8 China 794.82 794,817.91 25,462 31.22
14 Cambodia 212.31 212,310.48 6,877 30.87
13 Vietnam 241.09 241,086.96 10,026 24.05
12 Philippines 285.84 285,838.91 12,166 23.49
1 Hong Kong 3,124.59 3,124,590.30 143,264 21.81
9 Thailand 451.83 451,829.25 27,066 16.69
2 Singapore 2,684.31 2,684,310.67 170,451 15.75
15 Indonesia 207.62 207,621.70 13,667 15.19
4 Japan 1,266.79 1,266,794.87 100,560 12.60
3 Australia 1,345.25 1,345,254.55 114,138 11.79
5 South Korea 950.93 950,925.31 89,568 10.62
16 Laos 79.72 79,721.29 8,067 9.88
6 Taiwan 911.38 911,379.60 107,546 8.47
11 Malaysia 367.42 367,418.25 54,546 6.74
7 Brunei 847.36 847,359.72 147,130 5.76
Average price of property per country 2012 - SEA REGION
Property value to income per capita (PPP) ratio
Source: IMF - World Bank - CIA
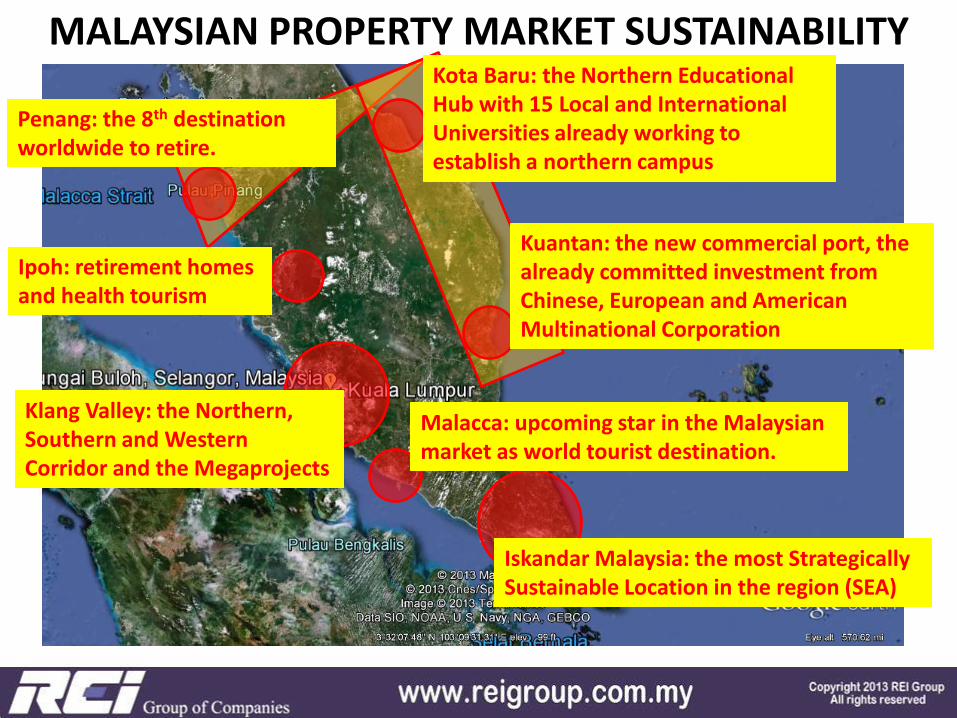
MALAYSIAN PROPERTY MARKET SUSTAINABILITY
Kuantan: the new commercial port, the already committed investment from Chinese, European and American Multinational Corporation
Kota Baru: the Northern Educational Hub with 15 Local and International Universities already working to establish a northern campus
Penang: the 8th destination worldwide to retire.
Ipoh: retirement homes and health tourism
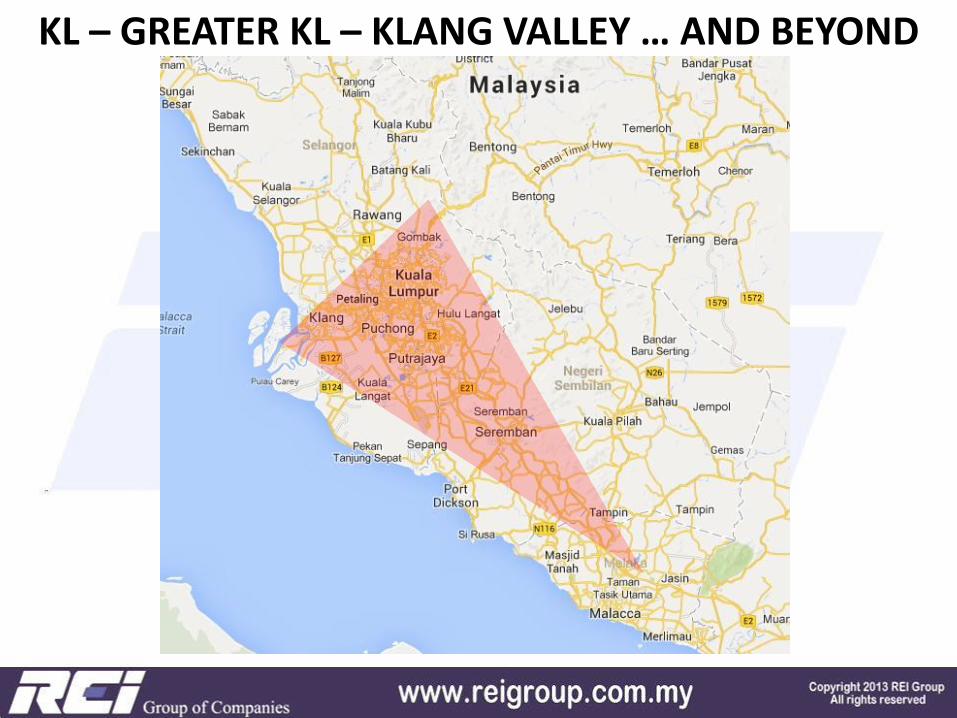
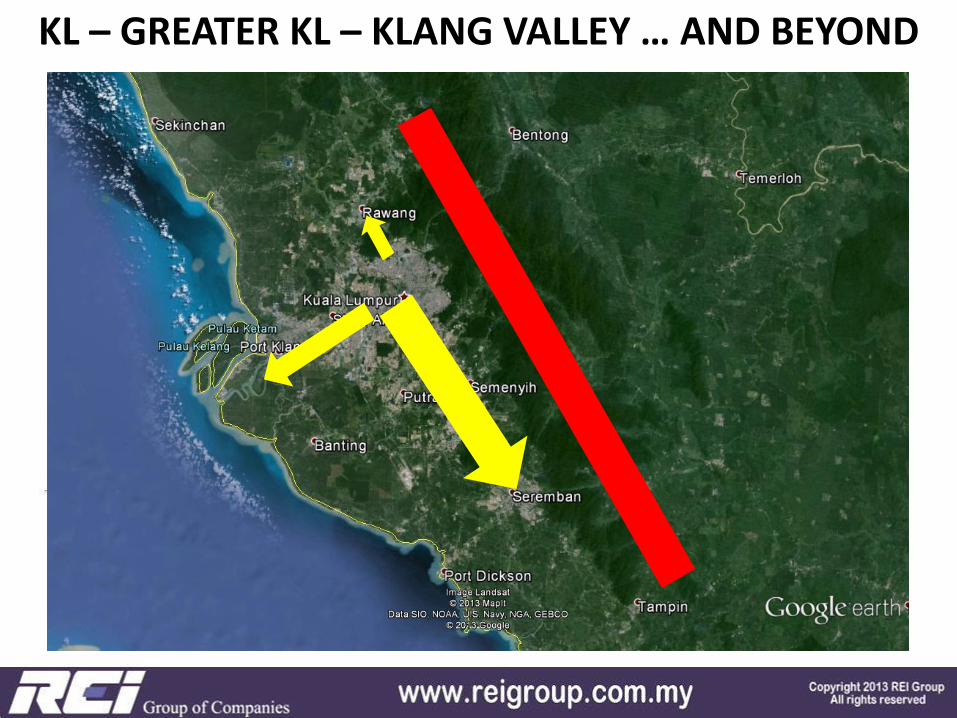
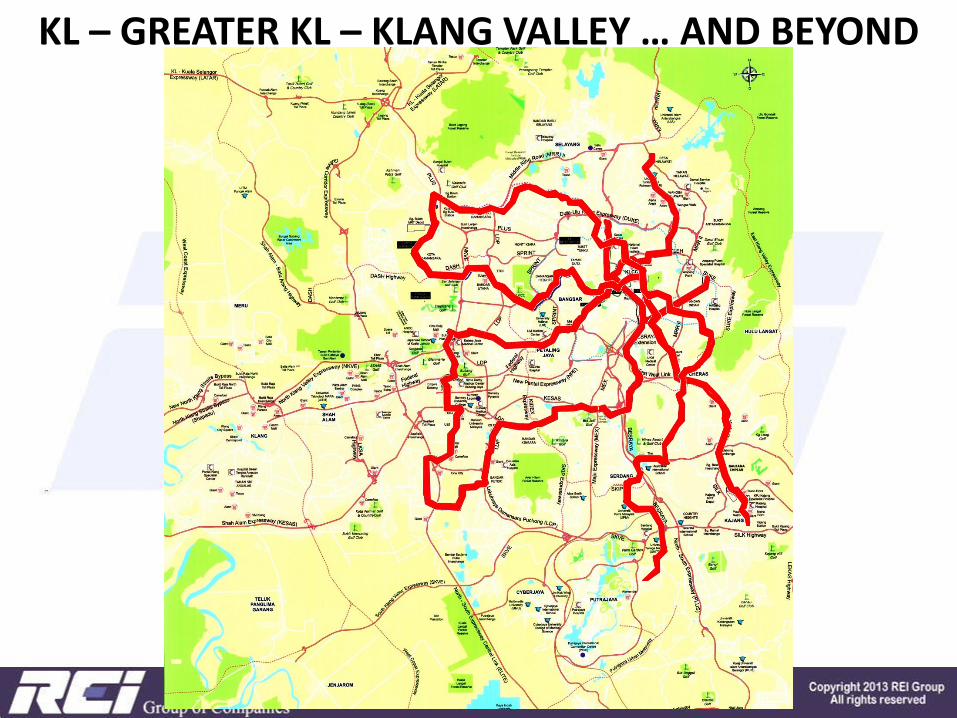
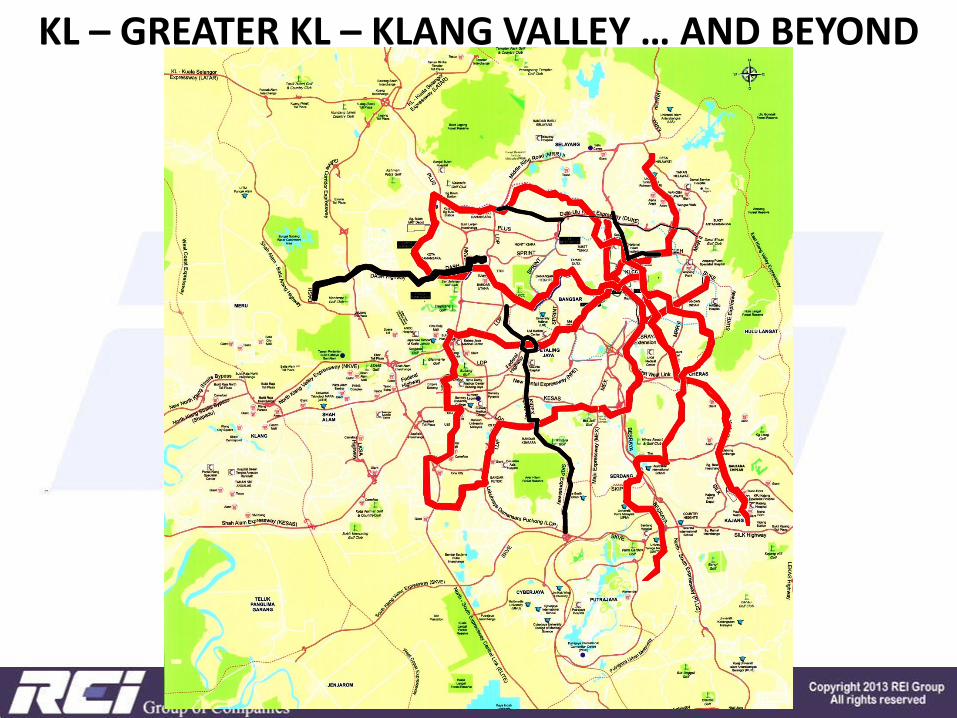
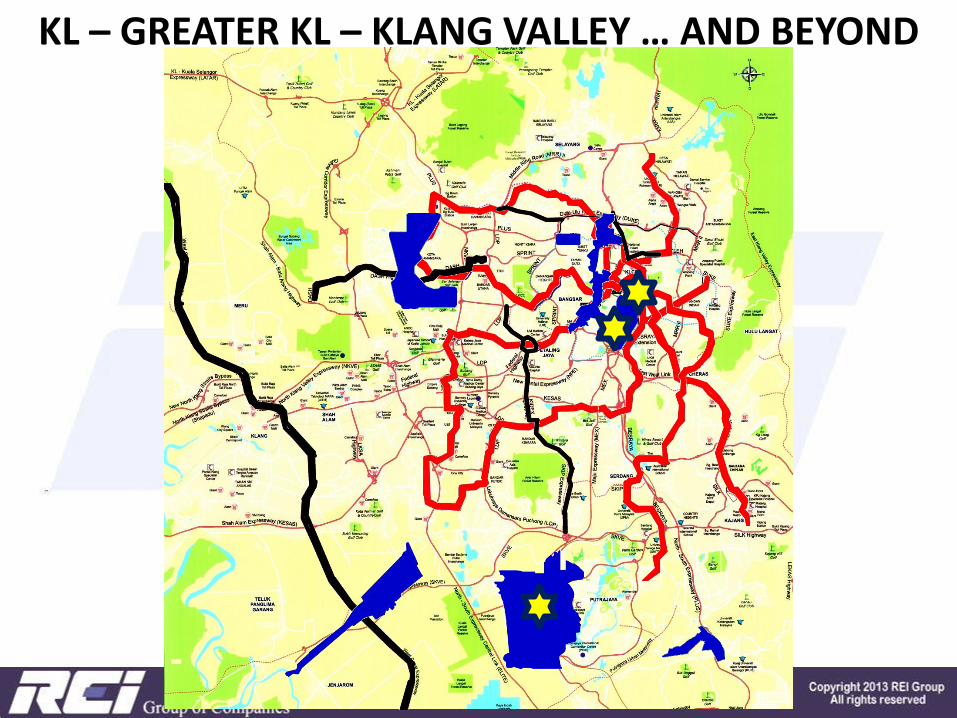
Klang Valley: the Northern, Southern and Western Corridor and the Megaprojects
Iskandar Malaysia: the most Strategically Sustainable Location in the region (SEA)
Malacca: upcoming star in the Malaysian market as world tourist destination.
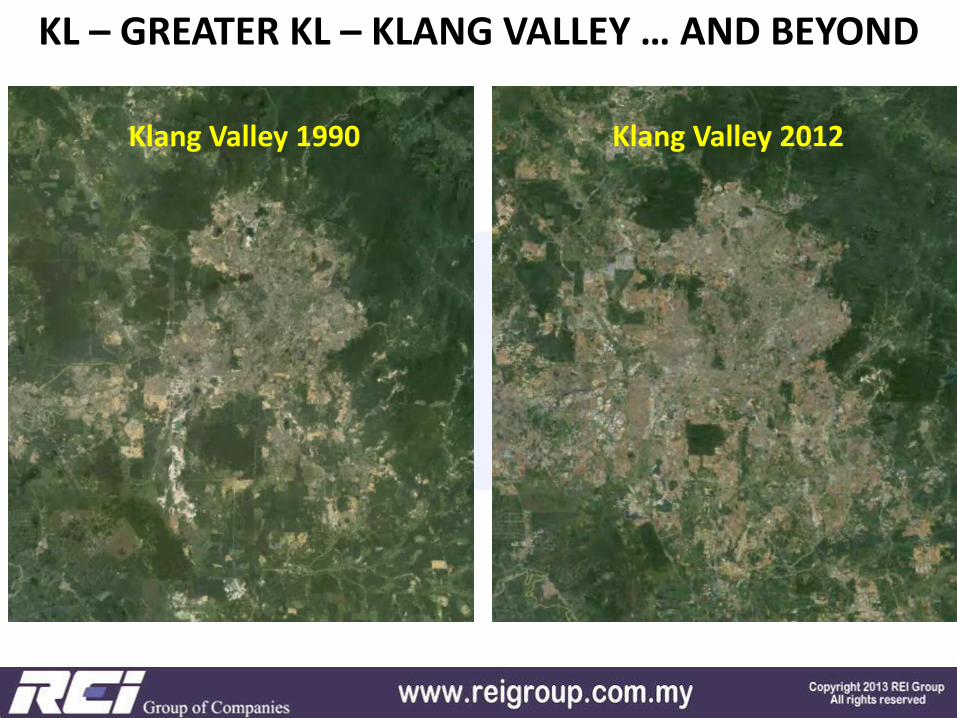
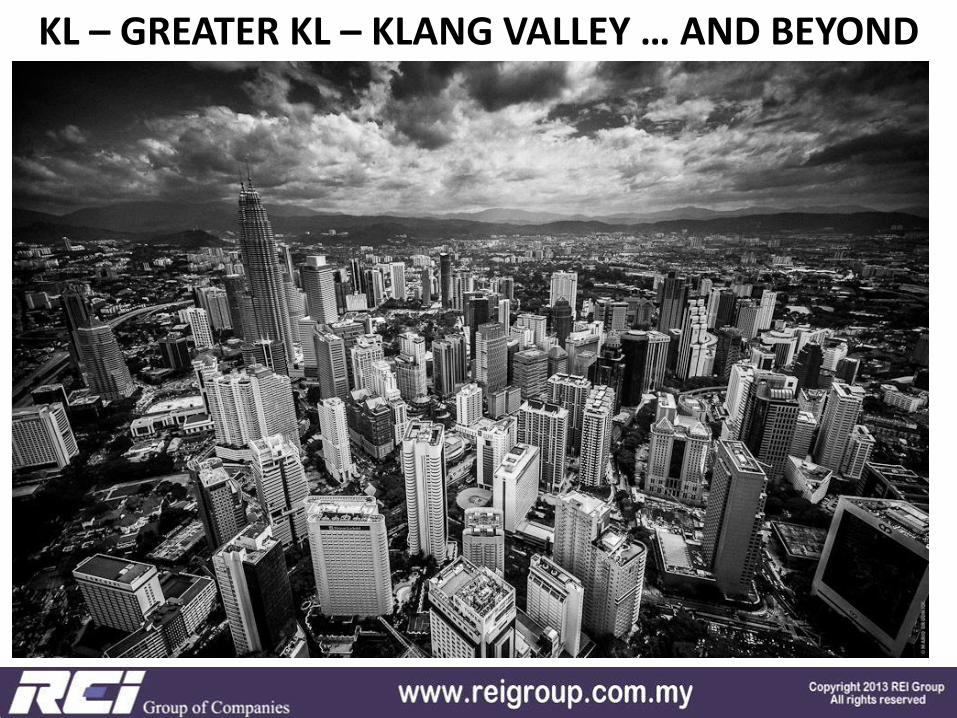
KL – GREATER KL – KLANG VALLEY … AND BEYOND
Klang Valley 1990 Klang Valley 2012
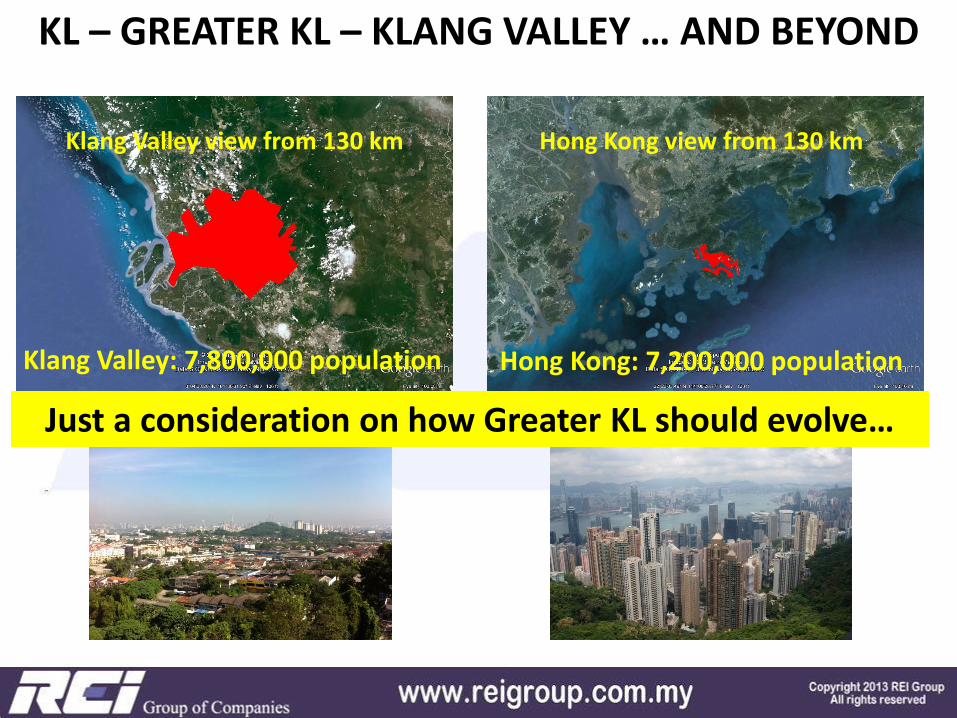
Klang Valley: 7,800,000 population Hong Kong: 7,200,000 population
Just a consideration on how Greater KL should evolve…
Klang Valley view from 130 km Hong Kong view from 130 km
KL – GREATER KL – KLANG VALLEY … AND BEYOND
Klang Valley: 7,800,000 population Hong Kong: 7,200,000 population
Just a consideration on how Greater KL should evolve…
Klang Valley view from 130 km Hong Kong view from 130 km
KL – GREATER KL – KLANG VALLEY … AND BEYOND
KL – GREATER KL – KLANG VALLEY … AND BEYOND
KL – GREATER KL – KLANG VALLEY … AND BEYOND
KL – GREATER KL – KLANG VALLEY … AND BEYOND
KL – GREATER KL – KLANG VALLEY … AND BEYOND
KL – GREATER KL – KLANG VALLEY … AND BEYOND
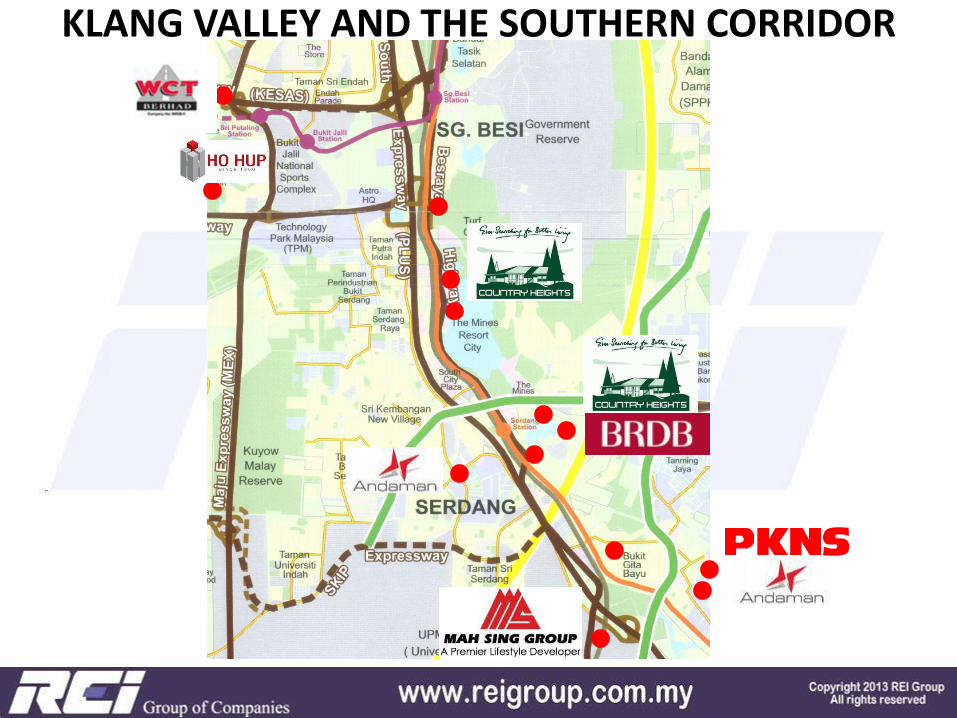
KLANG VALLEY AND THE SOUTHERN CORRIDOR
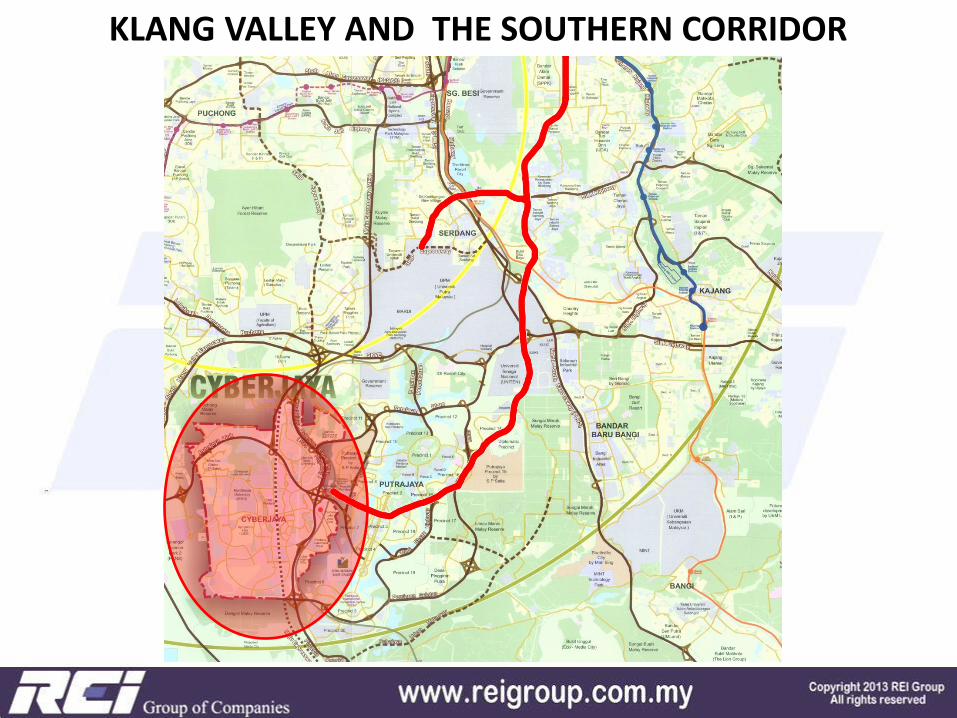
KLANG VALLEY AND THE SOUTHERN CORRIDOR
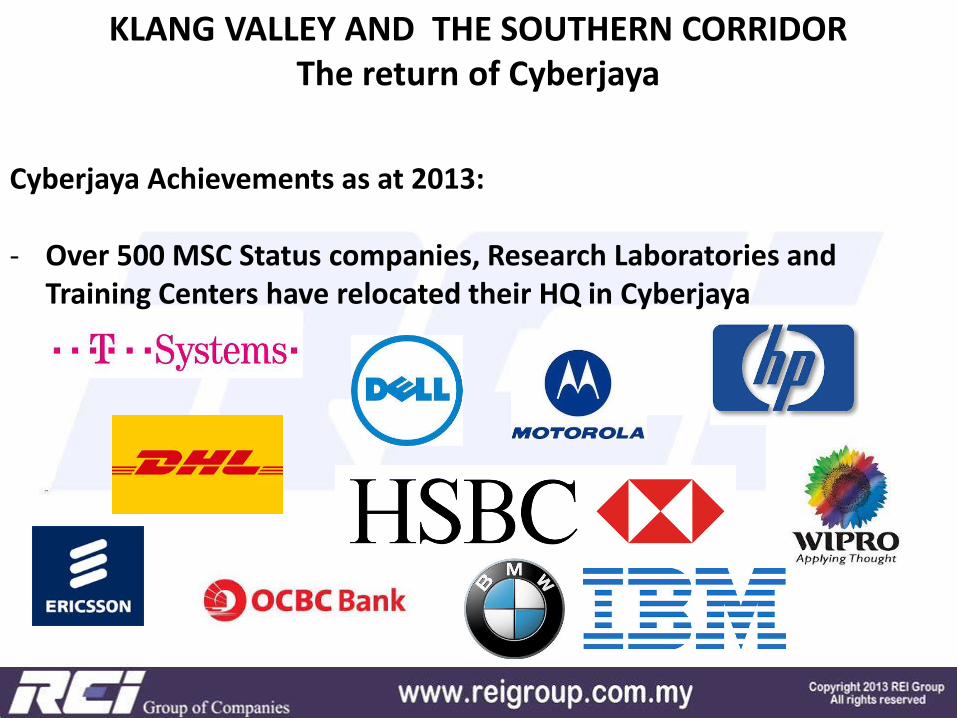
KLANG VALLEY AND THE SOUTHERN CORRIDOR The return of Cyberjaya
Cyberjaya Achievements as at 2013: - Over 500 MSC Status companies, Research Laboratories and
Training Centers have relocated their HQ in Cyberjaya
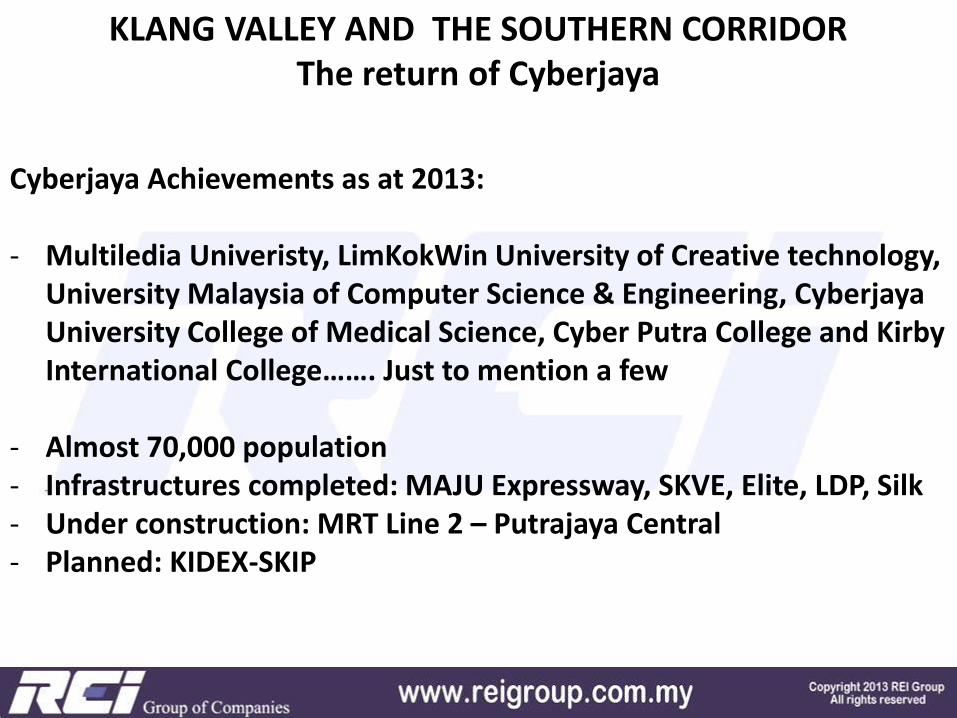
KLANG VALLEY AND THE SOUTHERN CORRIDOR The return of Cyberjaya
Cyberjaya Achievements as at 2013: - Multiledia Univeristy, LimKokWin University of Creative technology,
University Malaysia of Computer Science & Engineering, Cyberjaya University College of Medical Science, Cyber Putra College and Kirby International College……. Just to mention a few
- Almost 70,000 population - Infrastructures completed: MAJU Expressway, SKVE, Elite, LDP, Silk - Under construction: MRT Line 2 – Putrajaya Central - Planned: KIDEX-SKIP
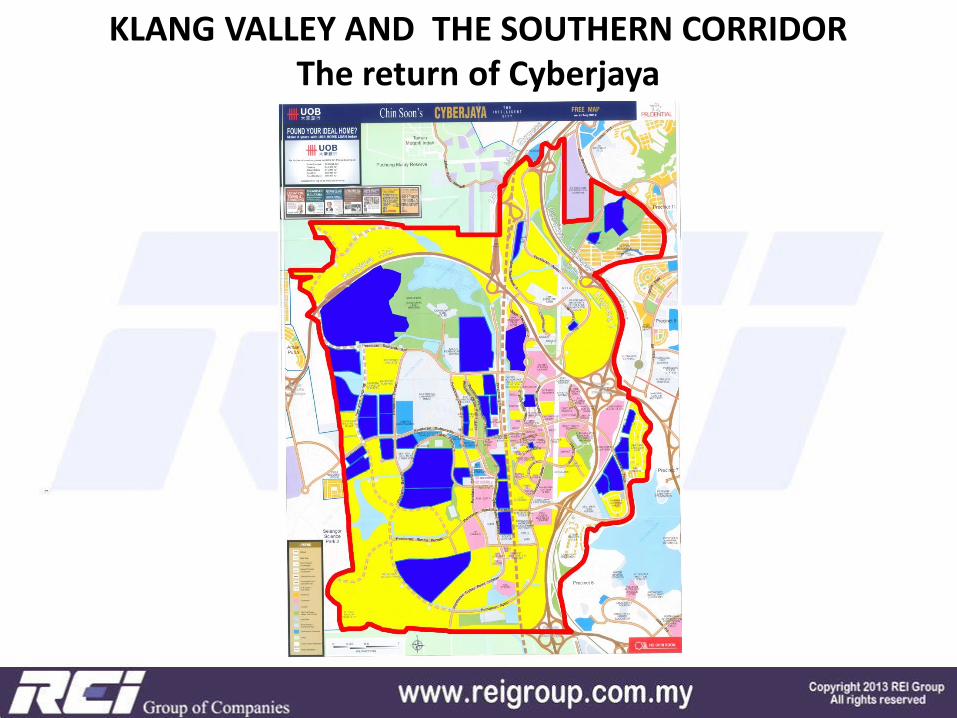
KLANG VALLEY AND THE SOUTHERN CORRIDOR The return of Cyberjaya
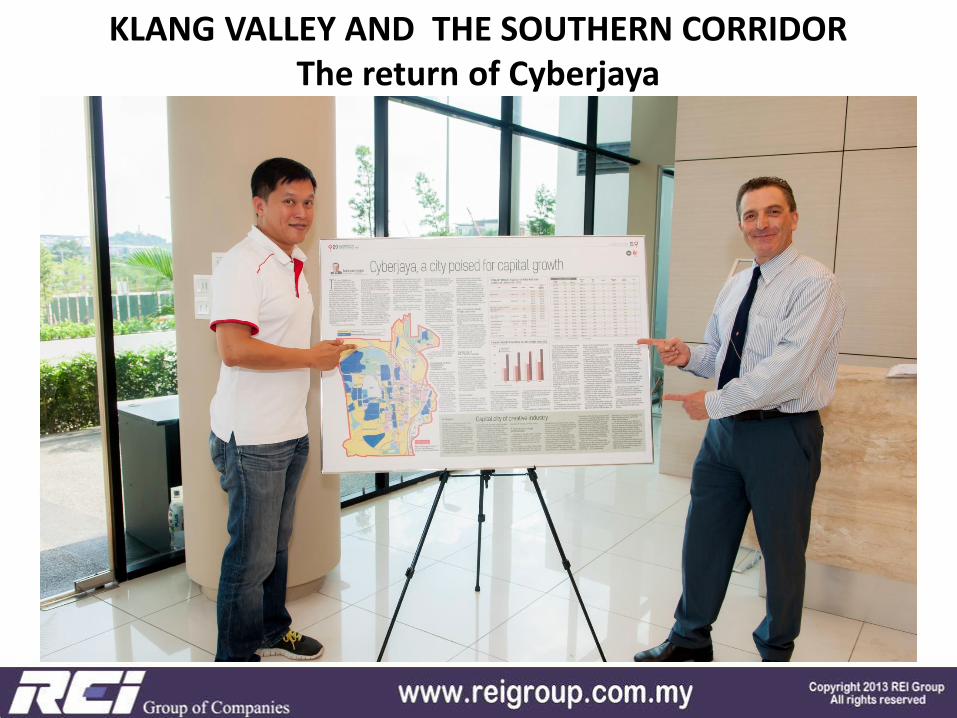
KLANG VALLEY AND THE SOUTHERN CORRIDOR The return of Cyberjaya
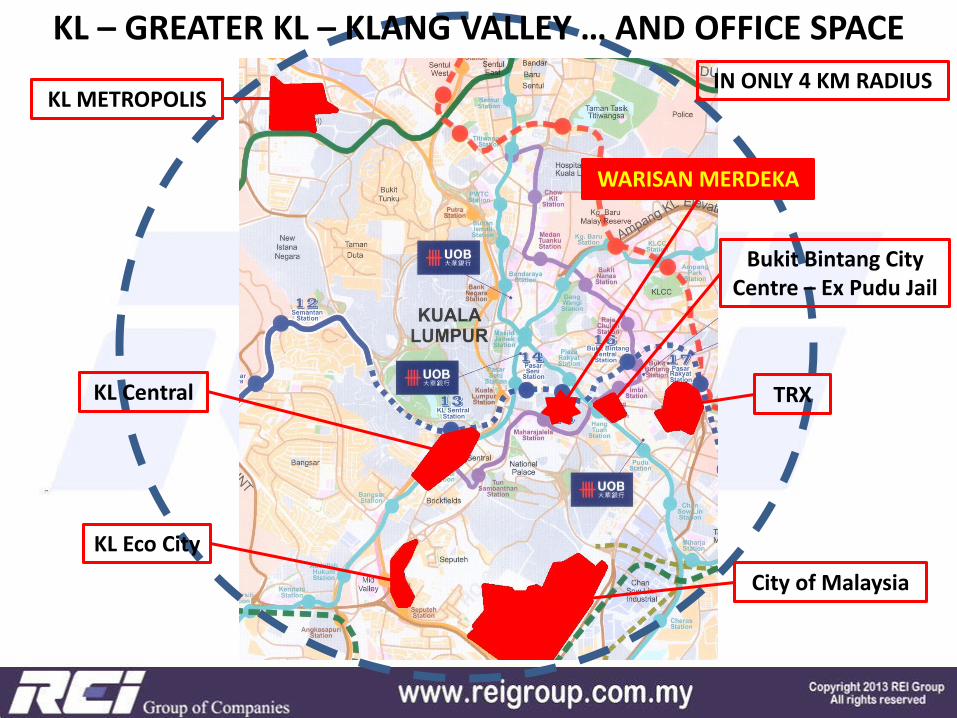
TRX
KL METROPOLIS
Bukit Bintang City Centre – Ex Pudu Jail
City of Malaysia
KL Central
KL Eco City
WARISAN MERDEKA
KL – GREATER KL – KLANG VALLEY … AND OFFICE SPACE
IN ONLY 4 KM RADIUS
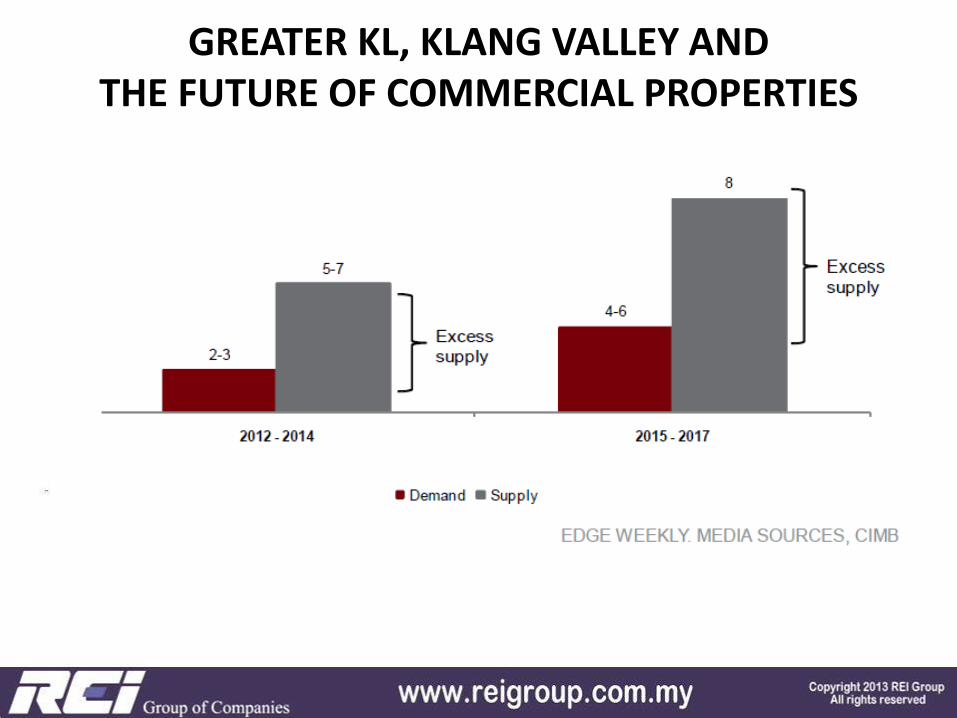
GREATER KL, KLANG VALLEY AND THE FUTURE OF COMMERCIAL PROPERTIES
GREATER KL, KLANG VALLEY AND THE FUTURE OF COMMERCIAL PROPERTIES
HOW?
GREATER KL, KLANG VALLEY AND THE FUTURE OF COMMERCIAL PROPERTIES
HOW?

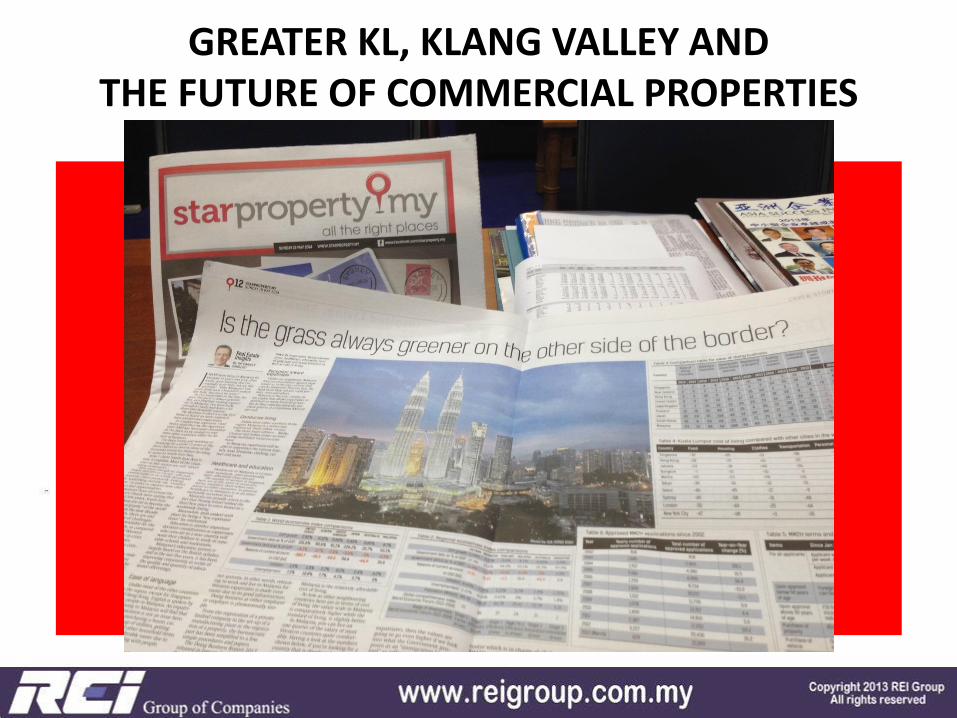
GREATER KL, KLANG VALLEY AND THE FUTURE OF COMMERCIAL PROPERTIES
HOW?
Make sure you will not miss
the next issue!
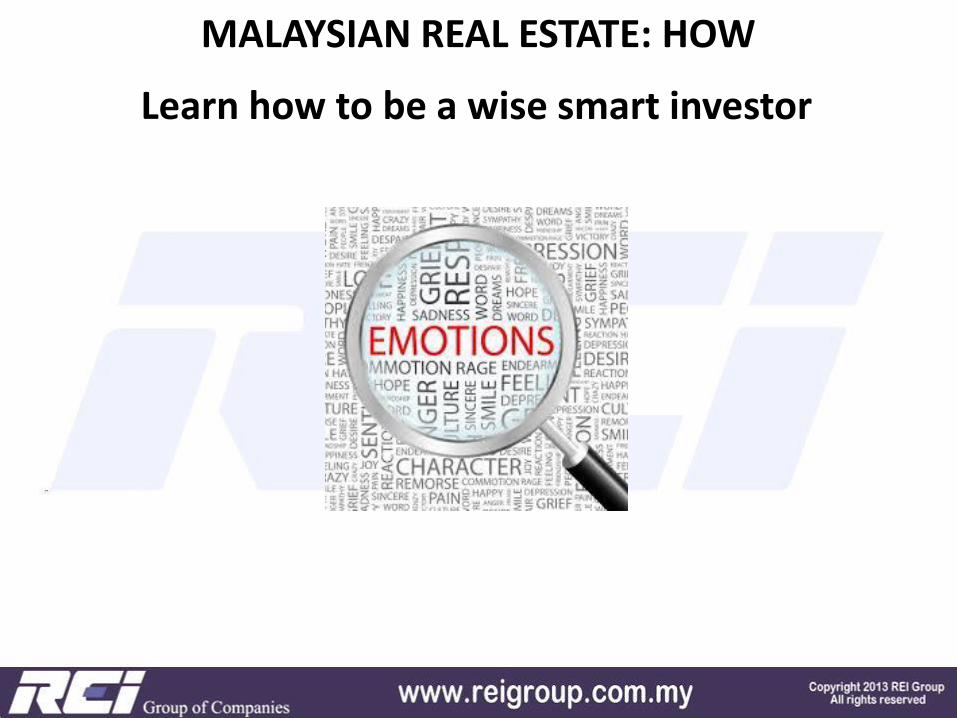
MALAYSIAN REAL ESTATE: HOW
Learn how to be a wise smart investor

MALAYSIAN REAL ESTATE: HOW
Learn how to be a wise smart investor