Malaysia Education Blueprint 2015-2025 (Higher...
41
Malaysia Education Blueprint 2015-2025 (Higher Education) Presented by: MOHD SALEH JAAFAR Consultant & Special Advisor to MEB (HE) Director, University Transformation Program Ministry of Higher Education Dato’ Prof. Dr. Asma Ismail Director General of Malaysia Higher Education Good Governance International Conference 2015 Radisson Blu Hotel, Istanbul Turkey 10-12 September 2015 Good Governance & Transformation
-
Upload
truongthuan -
Category
Documents
-
view
247 -
download
0
Transcript of Malaysia Education Blueprint 2015-2025 (Higher...

Malaysia Education
Blueprint 2015-2025
(Higher Education)
Presented by:
MOHD SALEH JAAFAR
Consultant & Special Advisor to MEB (HE)
Director, University Transformation Program
Ministry of Higher Education
Dato’ Prof. Dr. Asma Ismail
Director General of Malaysia Higher Education
Good Governance International Conference 2015
Radisson Blu Hotel, Istanbul Turkey
10-12 September 2015
Good Governance & Transformation

1
Content
Higher Education
Blueprint: Development
as Aspirations
University
Transformation
Program: Key Initiative
Enhancing University
Governance
Some Way Forward:
Productivity
2
3
4
1

2
Accelerating PACE of
CHANGE due to DIGITAL age
GLOBAL Competition due to
GLOBALIZATION
GLOBAL
Economic crisis
Addressing current and future Challenges:
Graduates for economic
vs society needs
Challenges facing
higher education
Equitable Access
industry-academia
collaboration
financial sustainability
return on investment
Institutional Autonomy vs
Accountability
R&D input vs outputs
Responsible citizen viz
Global citizen
Graduates 21st Century
Skills
Information overloads
Institutional Reputation

3
Challenges in Transformation for HE
Mediating
competing
goals
Diverse
purposes of
HE
Social and
political value
Adequacy of
state funding
Intellectual
spaces
NEW
academia
Access: Social
equity vs Quality
Incorporation of
wider social
purpose : economic
and well being
democratic
citizenship and
cultivation of
humanity
new generation
of academics”
commitment “to
the spirit of truth”
Institutional
Autonomy and
Accountability

4
ONE of MANY reasons for Transformation
4
NOT to be published without permission of MoE
SCREENSHOT

5
University Transformation is a critical initiative of MEB(HE)
Ministry
1
Public universities
20
Academic staff 31k
Students
500k
The ministry leverages UniTP as the conduit to drive transformation through public
universities to implement all dimensions of MEB (HE) to impact 500K students

6
The MEB (HE) sets out clear System and Student Aspirations
System aspirations
Student aspirations
Access Quality Equity Unity Efficiency
SCREENSHOT

7
Why it matters
Where we are
Objectives
Principles
Strategies and initiatives
Initiatives implementation roadmap
10 Shifts to support the attainment of System
and Student Aspiration
KEMENTERIAN
PENDIDIKAN
TINGGI
SCREENSHOT

8
Higher education transformation Journey CONFIDENTIAL - NOT FOR DISTRIBUTION
Review of PSPTN
Conceptual-isation
of 10 Shifts
Finalisation of the
Blueprint
Consultation on
University
Transformation
Blueprint Launch April 2015
PSPTN Review
Team with Experts
and Senior Advisors
Consultation with
LPU members,
Chairmen, VCs and
university leaders
Input on ongoing
implementation
PHASE 1 PHASE 3 PHASE 2 ONGOING
Feb 2013 to Feb 2014 Mar 2014 to Sep 2014 Oct 2014 to Mar 2015 TODAY
8

9
10 SHIFTS
Financial
Sustainability
Income Contingent Loan from PTPTN
1
Endowment and Waqf funds with matching grants
2
New Funding Formulae based on performance
3
1 2 3 4 6 7 8 9 10
90%
Government
support OE in
public HLIs
Increased student
enrolment
Increase cost in
Higher Education
6% Per year
7% Per year
5
9
10
Increased Autonomy and Accountability based on state of readiness
5
University Board Members wider representations
Women
International Experts
Regulator and Policy-Maker
Performance Contract 5 years (3+2)
Based on skill-sets
10 SHIFTS
Empowered
Governance
1 2 3 4 7 8 9 10
6
Tight Controller
1 3
2

11
The approach to developing the playbooks and university
transformation plans will be implemented across three stages
CONFIDENTIAL - NOT FOR DISTRIBUTION
Five
Transformation
Playbooks on
critical topics
University
Transformation
Plans by each
public university
C
Pilot Universities to
“lead the way” on
play-book
implementation
▪ Input of senior advisor
team
▪ Three official rounds of
detailed data
verification between
universities and PMO
to ensure data
accuracy
▪ Formal syndication
with key stakeholders
including VCs, DVCs,
Chairmen, Registrars,
PUUs and Bursars
▪ Each public university
will be required to draft
an end-to-end
transformation plan
across all dimensions
of the UniTP and
submit to the Ministry
by Dec 2016
▪ Select HLIs will serve
as test-beds for
implementation
▪ Thereafter, pilot HLIs
will chair “initiative
circles” or “support
groups” to transfer
knowledge to other
HLIs
B A
11
12
SCREENSHOT

13
Board composition reflects gaps in diversity of experiences,
gender and international representation
Source: Board composition of Malaysia’s 20 public universities – membership rosters provided via MOHE governance unit
Boards with >50%
Directors from the
public sector
International non-
Malaysian Board
Directors
Industry or private
sector Board Directors
Total Board
Directors from the
public sector
Women Board
Directors
Women Board
Chairpersons
85% 65% 0%
13% 13% 0%
CONFIDENTIAL - NOT FOR DISTRIBUTION

14
Gaps in skills and expectations
Source: Survey conducted by MOHE in June 2015 of all 20 LPUs, and 20 VCs of Malaysian public universities, Respondents N=40
“Current board composition
is not optimal”
“Absenteeism is a
significant problem”
Strategy expertise
“Not all board members
are clear on roles”
Fundraising expertise Connections to
industry
76% 46% 18%
70% 76% 52%
Percentage of respondents agreeing with statement
Current gaps in knowledge and skills of University Boards
CONFIDENTIAL - NOT FOR DISTRIBUTION

15
Administration
and
governance
Governance Transformation: Transfer of Decision Rights
Ministry
University leadership
College/department
Evaluate performance of leaders (e.g., VC)
Change organisation (e.g., establish, merge depts)
Approve university constitutions, statutes, and rules
Set tuition fees
Set student admissions criteria
Approve university strategy (vision, mission, focus)
Monitoring of university quality and reports
Decide allocation of funds and research grants
Management of allocated grants
Set pay schemes (salary designation)
Appoint leaders and set terms of office (VC, DVC)
Manage endowment and income-generating assets
Make admission decision
Approve academic programme and curriculum
Approve university budget
Approve procurement decisions (facilities, services)
Infrastructure development and management
Evaluation/promotion of staff; set pay scales/incentive
Appointment and dismissal of staff
Design staff development policies/programmes
Determine number and profile of students
Student discipline and suspension
Key decisions at Malaysian public universities Today End state
Funding and
financial
management
Admission,
intake plans,
curriculum
Human
Resource
management
15

16
Table of Contents
01 02 03 04 Setting Guidelines for University Boards
Raising University Board Effectiveness
Assessing University Boards
Introduction Appendices
Page 12-20 Page 22-46 Page 48-76 Page 78-86 Page 88-127
▪ Conducting the
Board
Effectiveness
Assessment
▪ The four steps
of raising Board
effectiveness
▪ How should the
Board define its
role?
▪ How should the
Board set its
structure?
▪ How should the
Board ensure
effective
operations and
interactions?
▪ Fulfilling
fundamental
Board roles and
responsibilities
▪ Structuring a
high-performing
Board
▪ Ensuring
effective Board
operations and
interactions
▪ Executive
Summary
▪ Introduction to
the University
Transformation
Programme
▪ Approach to
developing the
Green Book

17
Impact of High Performing Boards
Represent
university’s overall
interests
Comprehensive
external view
Strong fundraising
network
Greater
accountability
▪ All stakeholders represented
▪ Board decisions favour the
interests of the collective whole
▪ Board provides strategic view from
outside the university
▪ Academic and non-academic views
are balanced
▪ Major policies, initiatives and
programs justified to the Board
▪ University management directly
accountable to the Board
▪ Board members connect donors
to university
▪ Board members may donate
themselves

18
Fulfilling fundamental Board fiduciary roles and responsibilities
It is the duty of university Boards to act as a mechanism for change, quality
assurance, efficiency, and effectiveness at their universities
From
Role
1
Role
2
To
Safeguard the university’s mission
Steer and approve strategy, approve Senate decisions with financial or talent development impact, set operational policies, communicate with university stakeholders, oversee talent development, and ensure a culture of performance management
Nominate, oversee, and support the Vice-Chancellor
Review the Vice-Chancellor’s performance, support their work towards institutional goals, and make recommendations to the Ministry regarding extensions or terminations of their tenure
Support the Vice-Chancellor
Support their work towards institutional goals
Oversee university finances, including income generation
Define limits of authority, oversee properties and investment decisions, oversee the endowment and its spending, drive fundraising, and set salaries
Approve university spending
Sign-off on annual financial reports of university
Ensure compliance with Ministry requirements
Ensure university is aligned with circulars and directives
Role
3
19
Role
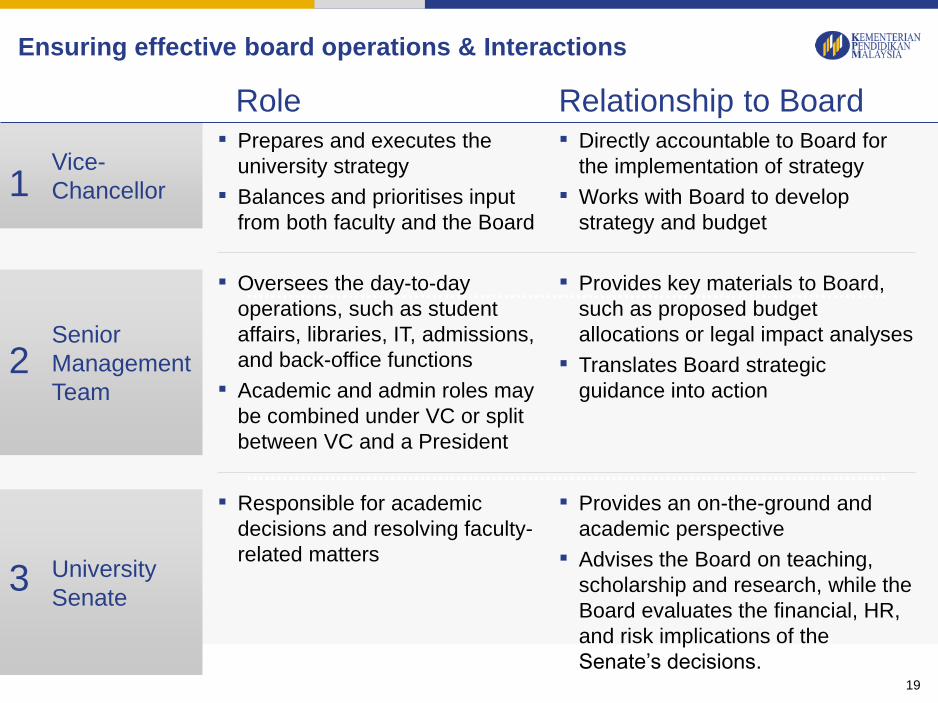
Ensuring effective board operations & Interactions
Relationship to Board ▪ Prepares and executes the
university strategy
▪ Balances and prioritises input
from both faculty and the Board
▪ Directly accountable to Board for
the implementation of strategy
▪ Works with Board to develop
strategy and budget
Vice-
Chancellor
▪ Oversees the day-to-day
operations, such as student
affairs, libraries, IT, admissions,
and back-office functions
▪ Academic and admin roles may
be combined under VC or split
between VC and a President
▪ Provides key materials to Board,
such as proposed budget
allocations or legal impact analyses
▪ Translates Board strategic
guidance into action
Senior
Management
Team
▪ Provides an on-the-ground and
academic perspective
▪ Advises the Board on teaching,
scholarship and research, while the
Board evaluates the financial, HR,
and risk implications of the
Senate’s decisions.
▪ Responsible for academic
decisions and resolving faculty-
related matters University
Senate
1
3
2
20
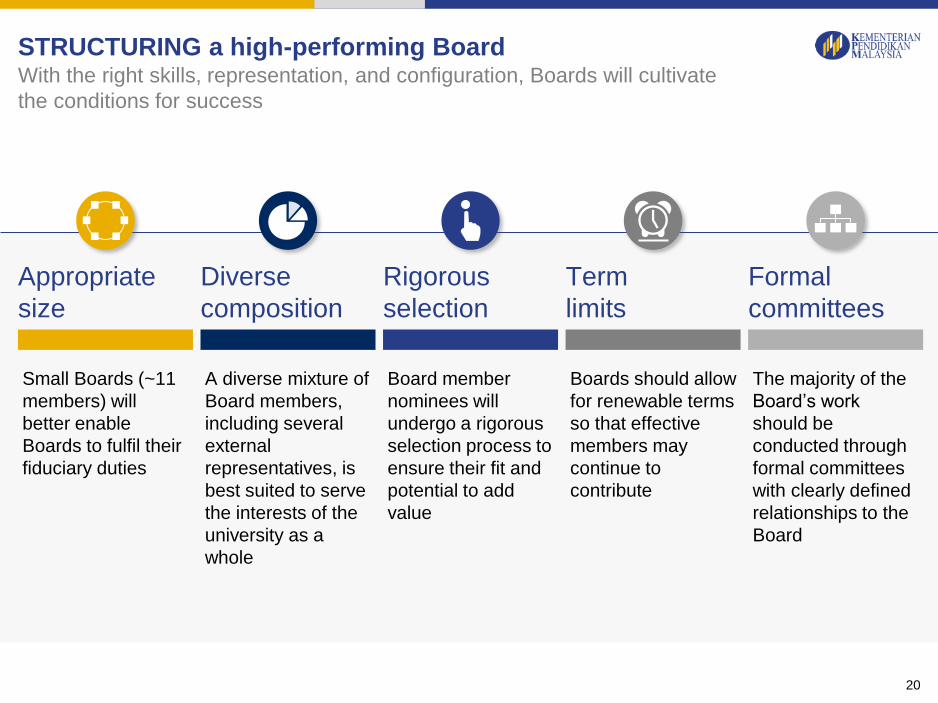
Small Boards (~11
members) will
better enable
Boards to fulfil their
fiduciary duties
Boards should allow
for renewable terms
so that effective
members may
continue to
contribute
Board member
nominees will
undergo a rigorous
selection process to
ensure their fit and
potential to add
value
A diverse mixture of
Board members,
including several
external
representatives, is
best suited to serve
the interests of the
university as a
whole
The majority of the
Board’s work
should be
conducted through
formal committees
with clearly defined
relationships to the
Board
STRUCTURING a high-performing Board With the right skills, representation, and configuration, Boards will cultivate
the conditions for success
Diverse
composition
Rigorous
selection
Term
limits
Formal
committees
Appropriate
size

21
Ensuring effective Board operations and interactions
Effective and efficient operations allow the Board to focus on issues that matter
most for the university
Enforced structures will
enable Boards to be
efficient during their
limited meetings.
Meetings should be held,
at minimum, four times
per year
Ensuring Board members
receive quality content
with sufficient time for
prior review will increase
meeting productivity
While structure and
composition are critical,
effective Boards must
also have trust between
Board members, the
Vice-Chancellor, and the
university management
committee
Make every Board
meeting productive
Optimise quality and
timing of Board content
Build trust between
management and
the Board

22
Raising university Board effectiveness CHAPTER TWO
Chapter Two addresses issues and challenges common to many university Boards.
It is structured as a series of questions to provide guidance in implementing best practices:
What is the university
management committee’s
relationship to the Board?
What is the Senate’s relationship
to the Board?
How can the Board define its
mandate and boundaries with the
university management
committee?
How can the Board separate and
balance the roles of the
Chairperson and the Vice-
Chancellor?
How should the governance of the
university investment funds be
structured?
What should be the governance
structure and accountability of the
university holding company?
Fulfilling fundamental
Board fiduciary roles and
responsibilities
Structuring a high-
performing university Board
Ensuring effective Board
operations and interactions
What is the Vice-Chancellor’s
relationship to the Board?
How can the Board nominate
Board members who have the
right skills and experience?
How can the Board ensure that it
focuses on strategic matters?
How can the Board ensure that
Board papers are consistently of
high quality?
How can the Board work more
effectively with management in
setting strategy?
How can the Board help foster a
strong culture focused on
performance management?
How can the Board best oversee
the development of talent and
future leaders of the university?
How should complaints be
handled by the Board?
1
2
3
4
5
1
2
3
1
2
3
4
5
6

23
The BEA evaluates the three main components of an effective Board:
Conducting a Board Effectiveness Assessment Improving Board effectiveness begins with a Board Effectiveness Assessment (BEA),
which measures the health and performance of the Board. Understanding its strengths and
weaknesses will empower the Board with the clarity required to know what gaps need closing
and where to build on existing strengths.
Structuring a high-performing
Board
Ensuring effective Board
operations and interactions
Fulfilling fundamental Board
roles and responsibilities
▪ Does the Board contribute to the
development of the university’s
strategy?
▪ Do Board members uphold a
strong performance
management culture?
▪ Does the Board adhere to the
principles of risk management
and financial discipline?
▪ Are Board members actively
focused on talent development
for future university leaders?
▪ Does the Board oversee
succession planning and
development of the university’s
leaders?
▪ Is the composition of the Board
aligned to the unique needs of
the university?
▪ Are committees structured to
meet the needs of the Board and
university?
▪ Are Board members nominated
and appointed using a
disciplined, transparent process?
▪ Is the Board evaluated as a
whole and as individuals on a
regular basis?
▪ Are Board meetings conducted in
a productive manner?
▪ Are all Board materials timely
and of high quality?
▪ Is the Board trust-building in the
interactions and communications
within itself, and with
management?

24
Board Evaluation Criteria
Board roles and responsibilities 5 4 3 2 1 Comments
1. University strategy
1a. Does the Board guide the university’s strategic direction?
1b. Does the Board ‘co-own’ the strategy with the university management committee?
1c. Does the Board balance stakeholder interests?
2. Performance management
2a. Does the Board set targets for the university management committee?
2b. Do KPIs and KIPs reflect strategy and are linked to performance contracts?
2c. Does the Board review progress against KPIs/KIPs and follow up as necessary?
3. Risk management and financial discipline
3a. Does the Board practice risk management and request risk analyses when appropriate?
3b. Does the Board adhere to a culture of financial discipline?
4. Talent development
4a. Does the Board nominate the VC and proactively plan VC succession?
4b. Does the Board review the performance management philosophy?
4c. Does the Board evaluate VC performance?
4d. Does the Board endorse development plans of those in pivotal positions?
4e. Does the Board understand the pool of future leaders?
5 = Best practice 4 = Above requirements but not best practice 3 = Meets requirements 2 = Below requirements but has no significant gaps 1 =
Significant gaps
Board evaluation form: example template Boards will use these questions to gauge their performance against BEA criteria

25 SOURCE: Source
Text
ENHANCING
SCREENSHOT

26
Universities are facing a unique challenge to deliver
more with the same resources, in a growing
economy with rising costs
Current situation in Malaysia
has been positive …
… however, challenges are
emerging
CONFIDENTIAL - NOT FOR DISTRIBUTION
Source: Malaysia Education Blueprint (Higher Education), 11th Malaysia Plan
▪ Malaysia’s higher education (HE) system is
soaring upwards –e.g.,
– Currently 27th out of 50, up from 28th in
2014, overall in the Universitas21 2015
rankings
– 6th out of 50, up from 12th in 2014, for
knowledge transfer with business in the
same U21 rankings
▪ This growth has been enabled by strong
financial support from the government
▪ Within Malaysia, some of the private
universities have set themselves high
efficiency standards and are innovating on
ideas to improve academic productivity*
▪ Existing productivity levels signal room for
improvement:
– Malaysia ranks 12th out 50 in terms of
resources invested
– However, Malaysia also ranks 44th out of 50
in terms of outputs in U21 rankings
▪ Expansion of access: Universities need to meet
increasing demand – target 3.3m new jobs by
2020
▪ Rising costs per student: Increase in
government funding by 7% per annum from 2004
to 2013
▪ Universities expected to be more pro-active:
Universities expected to take more active income
generation role as they move towards autonomy
and accountability

27
Malaysia is one of the highest spenders on Higher
Education, in terms of percentage of annual
national budget …
Source: UNESCO
1 Peers based on the following categorization: Developed Asian economics (Hong Kong, Singapore, South Korea, Japan), SEA neighbors (Indonesia,
Thailand, Singapore) and comparable GDP per capita (Chile, Mexico)
2 Latest data available: Singapore (2013), Chile, Hong Kong, Indonesia, Japan, Thailand (2012), Malaysia, Mexico, Korea (2011)
7.7
1.9
3.03.13.6
3.94.1
6.06.4
5.5
Japan Thailand Indonesia Mexico Korea Chile Hong Kong Malaysia Singapore
Higher education expenditure as a percentage annual
national budget1
7.7% of Malaysia's annual budget is
spent on higher education, the highest
among peers (UNESCO
benchmarking)
All government spending on higher
education and training
Higher education spending by Ministry of
Education
Extracted from Exhibit 5-2 of the Malaysia Education Blueprint (Higher Education)
CONFIDENTIAL - NOT FOR DISTRIBUTION
Percent2
28
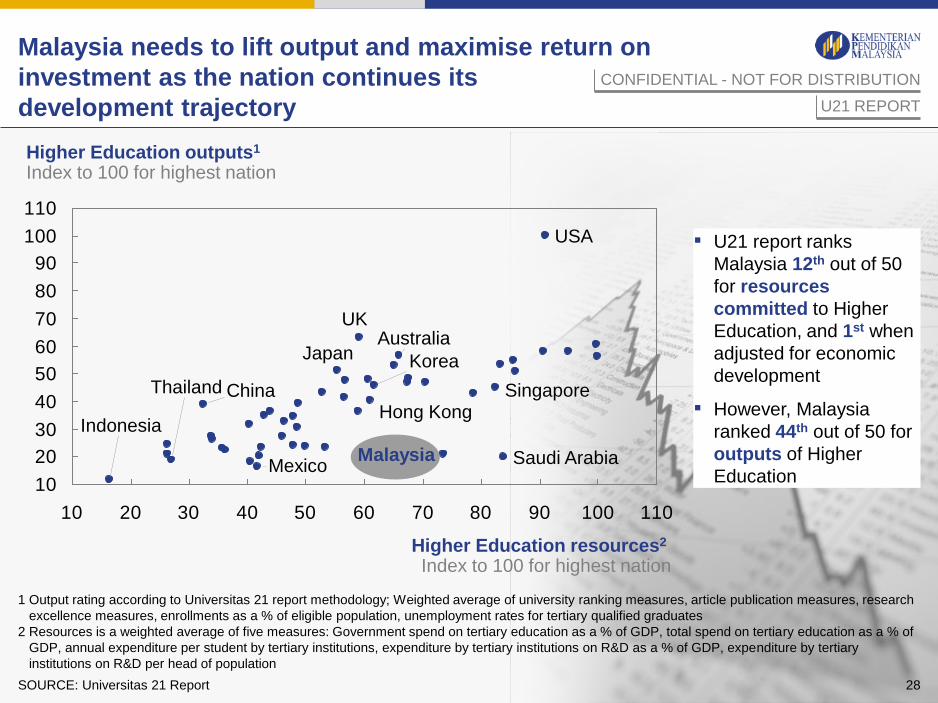
Malaysia needs to lift output and maximise return on
investment as the nation continues its
development trajectory
SOURCE: Universitas 21 Report
U21 REPORT
1 Output rating according to Universitas 21 report methodology; Weighted average of university ranking measures, article publication measures, research
excellence measures, enrollments as a % of eligible population, unemployment rates for tertiary qualified graduates
2 Resources is a weighted average of five measures: Government spend on tertiary education as a % of GDP, total spend on tertiary education as a % of
GDP, annual expenditure per student by tertiary institutions, expenditure by tertiary institutions on R&D as a % of GDP, expenditure by tertiary
institutions on R&D per head of population
▪ U21 report ranks
Malaysia 12th out of 50
for resources
committed to Higher
Education, and 1st when
adjusted for economic
development
▪ However, Malaysia
ranked 44th out of 50 for
outputs of Higher
Education 10
20
30
40
50
60
70
80
90
100
110
10 20 30 40 50 60 70 80 90 100 110
Saudi Arabia
USA
Indonesia
Australia
Malaysia
Singapore
Japan
UK
Hong Kong
Korea
Mexico
Higher Education resources2 Index to 100 for highest nation
Thailand China
Higher Education outputs1 Index to 100 for highest nation
CONFIDENTIAL - NOT FOR DISTRIBUTION
28

29
The Productivity Playbook has been prioritised to
help support universities in enhancing their
academic productivity to address these challenges
Improving productivity is critical to continued success for
our public universities
CONFIDENTIAL - NOT FOR DISTRIBUTION
Improving productivity will help universities redirect
inefficient resources to improving student and
institutional outcomes
The path to producing more with the same is by
increasing productivity, without reducing quality
It is critical for universities to focus on improving their
academic productivity, as performance against this
key metric will be critical to determining funding in
the future world of performance-based contracts
29

30
Our playbook addresses several of these productivity metrics,
but we start with a focus on improving
“Cost per graduate”
The playbook covers a diagnostic of several productivity metrics, but dives deep on Cost
per graduate because it:
CONFIDENTIAL - NOT FOR DISTRIBUTION
Example metrics addressed in playbook
Allows for a targeted focus on initiatives in the 1st wave of productivity optimization
Is internationally recognized
Is common across MRU/MTUN/TLUs
1
3
2
SCREENSHOT
31
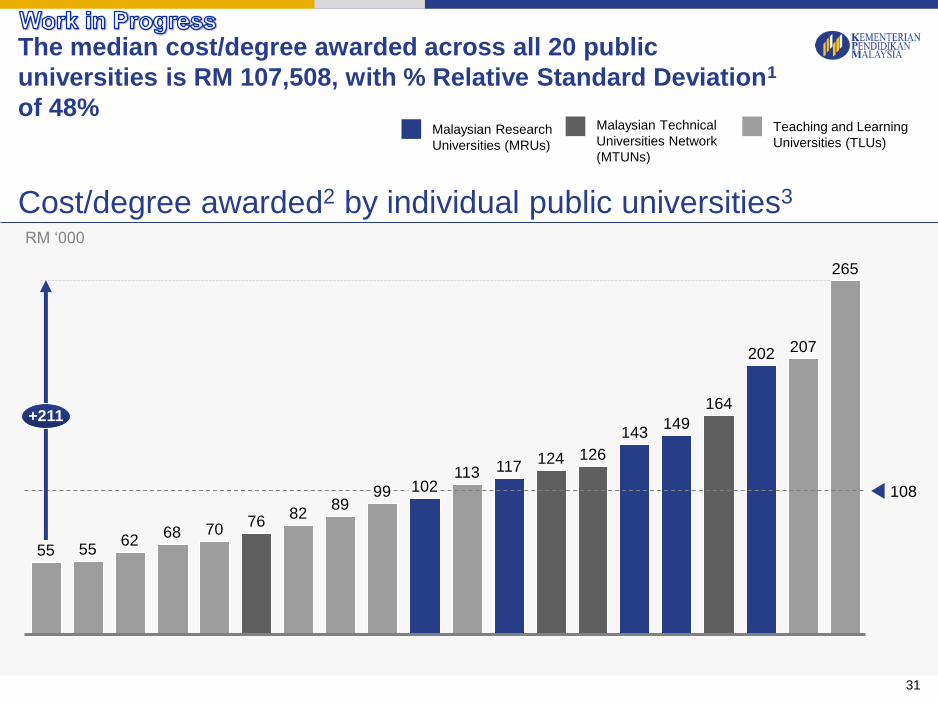
The median cost/degree awarded across all 20 public
universities is RM 107,508, with % Relative Standard Deviation1
of 48%
70 68 62
55
202
164
149 143
126 124 117 113
102 99 89
82 76
265
+211
108
55
207
Cost/degree awarded2 by individual public universities3 RM ‘000
Malaysian Technical
Universities Network
(MTUNs)
Malaysian Research
Universities (MRUs)
Teaching and Learning
Universities (TLUs)

32
Instructional costs make up a larger proportion of costs in MRUs
as compared to the two other peer groups
Instructional1 vs non-instructional costs2 by peer group
77 73
53 47
23 27
47 53
68 64 6355 55 53 51 50 48 47 46
32 36 3745 45 47 49 50 52 53 54
7158
45 40 37
4255 60 63
29
No
n-in
str
uctio
nal In
str
uctio
na
l
UN
I
20
MRUs MTUNs Others Median
instruc-
tional % 55% 37% 47%
Median
non-
instruc-
tional %
45% 63% 53%

33
3
3
1
1
-1
-3
-3
-6
-7
Arts and Humanities
Medical, Dentistry, Vet
Engineering Manufacturing Construction
Engineering, manufacturing
and construction
Education
Science, Math, Computing
Health Sciences 10
Hospitality
Architecture
Agriculture Sciences
0
8
5
-1
0
-18
-13
-23
25
22
-1
6
-4
1
-6
4
-4
4
-2
10
Graduation rate by degree type and course
Bachelors Masters PHD
Median: 72% Median: 34% Median: 19%
Percent (%)
GOT is very low, and
Variance between course GoT rates is high SAMPLE DATA

34
MRUs,
‘000
TLUs, ‘000
MTUNs,
‘000
Pushing universities operating below median
productivity levels to the median givesRM 775
million in savings annually
Source: Analysis from data collected and verified by universities
143
U2
202
U5
149
U1
143
U4
117
U3
102
76 125
U7
164
U6
126
U8
124
U9
U14 U19
84
265
207
62
U11
55
U18
55
U17
113
U12
99
U10
89
U15
82
U20
70
U16
68
U13
Cost per graduate
Universities operating at
productivity levels below
peer group medians
350
75
350
775
Cost savings/
annum, mil
CONFIDENTIAL - NOT FOR DISTRIBUTION
Cost savings can
be used towards
improving
outcomes like
access (producing
more graduates,
research
outcomes
(repurposing as
research grants)
etc.
We can achieve an additional ~750 mn if unis at or above median productivity
improve
Cost/Graduate by 10% each

35
Barrier
Our experience tells us that 70% of transformations
across sectors fail due to six key internal
delivery challenges
CONFIDENTIAL - NOT FOR DISTRIBUTION
Lack of
Conviction 1
Silos between
divisions 2
Internal
resistance/inertia 3
Lack of data 4
Lack of
capabilities 5
Funding
constraints
Description
▪ Leaders without bold aspirations and/or willingness to engage in fast
decision-making and real time following-through on delivery
▪ Lack of clarity around split of responsibilities across divisions in the
Ministry and/or overlapping responsibilities hinders execution of priorities that
are cross-divisional or cross-Ministry
▪ Civil service lacks delivery skills and methodologies (vs. policy making) and
motivation (vs. inertia) to deliver big results fast
▪ Lack of baseline data and transparency and/or major data quality issues with
data that hinder proper monitoring
▪ Limited knowledge, managerial skills and/or soft skills that enable staff to
understand root causes, unlock challenges and follow through with delivery
▪ Lack of funding for highest priorities, especially in environments of growing
fiscal constraints, due to inability to cut established spending programs 6

36
Barrier Solution
Poor Leadership Performance
pressure
Silos between
agencies
Governance
taskforce
Internal
resistance/
inertia
Challenge civil
service
Lack of data
Standardize and
find short term
solutions
Lack of
capabilities
Invest in the right
talent
Funding
constraints
Link plans and
budgets
We propose a range of systemic interventions to address
these challenges CONFIDENTIAL - NOT FOR DISTRIBUTION
Potential intervention ▪ Public commitments to establish accountability
▪ Reports on progress against Ministerial KPIs
▪ Minister to spend ~2 every month to give directional steer as needed
▪ MEB(HE) steerco to resolve inter-division issues in MOHE
▪ HETF to resolve cross-Ministry issues
▪ Initiatives like Funding Formula to have cross-Ministry
(MOHE/MOF/EPU) working team
▪ KPIs and performance management for civil service
▪ Change management / comms
▪ Create STO-HE (Strategic Transformation Office) with dedicated staff
▪ Standardize data collection and reporting across universities
▪ Assign a dedicated CIO to this effort
▪ Use multiple sources to verify
▪ Invest in staffing STO-HE with the relevant experience and capabilities
(incl. private sector talent where needed)
▪ Leverage industry leaders in HETF for best practice learnings
▪ Establish link between spending program and achievement of planned
outcome KPIs
▪ Use savings from one program to fund another
1
2
3
4
5
6

37
Top Barriers to change for Universities
In addition, we must help universities
overcome the classic change barriers CONFIDENTIAL - NOT FOR DISTRIBUTION
▪ Why should I change?
▪ What’s in it for me?
▪ Is the Ministry really going to put
their money where their mouth is?
▪ Is there any upside to embrace this?
(or downside to not)
1 “Lack of
leadership
commitment”
2
“No case for
change” 3
“Skills gap” 4
“Resistance/
Inertia”
▪ I want to do this but I am not sure on
what exactly to do or how to do it
▪ Do other universities face similar
issues? How do they handle them?
▪ Is the Ministry really committed to this
transformation?
▪ Is this really “new” and “different”? Or is
it a minor tweak?

38
We recommend a holistic and proactive approach
to influence universities to embrace change CONFIDENTIAL - NOT FOR DISTRIBUTION
▪ Pro-active communications
– Internal – e.g., Minister-led change story
roadshows with university leaders, staff,
students
– External – e.g., Quarterly launch events,
social media strategy
▪ Rigorous University transformation plan
for all universities
▪ Headline KPIs to be announced
and performance against these
made public
▪ Government funding linked to
performance contracts
▪ Annual performance
dialogues between
VC/Chairman of every university
and Ministry
“A compelling story” – Tell them “Role-modeling” – Show them
“Skill-building” – Teach them “Reinforcements” – Reward them
▪ Symbolic actions/quick-wins to signal
commitment – e.g., Injection of “WOW”
factor leaders as VCs/Chairmen
▪ Quick execution on big policy
changes – e.g.,
– DVC nomination by board, not Minister
– Boards to complete annual self-
assessment and report results to
Ministry
▪ Playbooks on 5 critical topics
▪ Peer learning circles for key change
leaders – e.g., VCs, Chairmen, Bursars,
Lecturers by uni type
▪ Training for iPMOs

39
Concluding Remark: Good governance & transformation
Worldwide diffusion of codes of good
governance
Best practice’ recommendations
To compensate for deficiencies regarding
the protection of shareholders’ rights
Increase legitimacy
Enhance the efficiency
40
Mohd Saleh Jaafar
http://hes.moe.gov.my/event/
For FULL version of the Blueprint:
Thank you
40
Alternative
option for
ending