Malabar Biomethane Project – Options Analysis - Attachment 4.8b... · The Sydney Water Malabar...
21
INTERNAL © Jemena Limited. All rights reserved. Copyright in the whole or every part of this document belongs to Jemena Limited, and cannot be used, transferred, copied or reproduced in whole or in part in any manner or form or in any media to any person other than with the prior written consent of Jemena. Printed or downloaded copies of this document are deemed uncontrolled REPORT Malabar Biomethane Project – Options Analysis Revision Number: A Revision Date: 20/12/2019 AUTHORISATION Approved by Name Job Title Signature Date Mike Davis Network Innovation Manager 20/12/19 Endorsed by Name Job Title Signature Date Gabrielle Sycamore General Manager – Strategy & Commercial 20/12/2019
Transcript of Malabar Biomethane Project – Options Analysis - Attachment 4.8b... · The Sydney Water Malabar...

INTERNAL
© Jemena Limited. All rights reserved. Copyright in the whole or every part of this document belongs to Jemena Limited, and cannot be used, transferred, copied or
reproduced in whole or in part in any manner or form or in any media to any person other than with the prior written consent of Jemena.
Printed or downloaded copies of this document are deemed uncontrolled
REPORT
Malabar Biomethane Project – Options Analysis
Revision Number: A
Revision Date: 20/12/2019
AUTHORISATION
Approved by
Name Job Title Signature Date
Mike Davis Network Innovation Manager
20/12/19
Endorsed by
Name Job Title Signature Date
Gabrielle Sycamore General Manager – Strategy & Commercial
20/12/2019

MALABAR BIOMETHANE PROJECT – OPTIONS ANALYSIS Revision: 0
© Jemena Limited Page 2 of 21
DOCUMENT HISTORY
Revision Date Author Description of Changes
0 20/12/2019 Joshua Moran Final

MALABAR BIOMETHANE PROJECT – OPTIONS ANALYSIS Revision: 0
© Jemena Limited Page 3 of 21
TABLE OF CONTENTS
1 EXECUTIVE SUMMARY ........................................................................................................... 5
1.1 KEY DRIVERS ........................................................................................................................ 5
1.2 CREDIBLE OPTIONS ............................................................................................................... 6
1.3 RECOMMENDATION ................................................................................................................ 6
1.4 CONSUMER ENGAGEMENT ...................................................................................................... 6
1.5 NATIONAL GAS RULES............................................................................................................ 7
2 PROJECT KEY DRIVERS ......................................................................................................... 7
2.1 BACKGROUND ....................................................................................................................... 7
2.2 RENEWABLE GAS................................................................................................................... 8
2.3 IDENTIFIED NEED.................................................................................................................... 8
2.3.1 INTERFACE CARPETS .................................................................................................................. 9
2.3.2 CITY OF SYDNEY ........................................................................................................................ 9
2.3.3 DEXUS ...................................................................................................................................... 9
2.3.4 GREEN BUILDING COUNCIL OF AUSTRALIA ...................................................................................... 9
2.4 STAKEHOLDERS DRIVING RENEWABLE GAS .............................................................................. 9
2.5 DECARBONISATION PATHWAY ................................................................................................ 10
2.5.1 CERTIFICATION OF RENEWABLE GAS ........................................................................................... 10
2.5.2 ESTABLISH INCENTIVES.............................................................................................................. 10
2.5.3 TECHNICAL STANDARDS AND PROCESSES ..................................................................................... 10
2.5.4 ENCOURAGE INVESTMENT .......................................................................................................... 11
2.5.5 REDUCTION IN COST TO SUPPLY RENEWABLE GAS.......................................................................... 11
2.5.6 AWARENESS ............................................................................................................................ 11
2.6 IDENTIFICATION OF SPECIFIC PROJECT ................................................................................... 11
2.6.1 PROJECT OUTLINE.................................................................................................................... 11
2.7 CURRENT STATUS OF ASSET ................................................................................................ 11
3 DEMAND DESTRUCTION MITIGATION OPTIONS ................................................................. 12
3.1 OPTION 1 – MAINTAIN STATUS QUO - LOOSE GAS SUPPLY TO CUSTOMER ELECTRIFICATION OF LOAD
12
3.1.1 COST ..................................................................................................................................... 12
3.1.2 BENEFITS & DRAWBACKS .......................................................................................................... 13
3.2 OPTION 2 – CONNECT PROJECT TO SECONDARY NETWORK ...................................................... 13
3.2.1 COST ..................................................................................................................................... 13
3.2.2 BENEFITS & DRAWBACKS .......................................................................................................... 13
3.3 OPTION 3 – CONNECT PROJECT TO THE LOCAL DISTRIBUTION NETWORK ................................... 14
3.3.1 COST ..................................................................................................................................... 14
3.3.2 BENEFITS & DRAWBACKS .......................................................................................................... 14
4 RECOMMENDATION .............................................................................................................. 14 5 REFERENCES ........................................................................................................................ 15

MALABAR BIOMETHANE PROJECT – OPTIONS ANALYSIS Revision: 0
© Jemena Limited Page 4 of 21
6 APPENDICES ......................................................................................................................... 15
Appendix A Options analysis Calculations ................................................................................. 16
Appendix B Option 2 Drawing ................................................................................................... 17
Appendix C Option 2 Costing .................................................................................................... 18
Appendix D Interface Carpets – Letter of support ....................................................................... 19
Appendix E CIty of Sydney – Letter of support ........................................................................... 20
Appendix F Dexus – Letter of Support ....................................................................................... 21

MALABAR BIOMETHANE PROJECT – OPTIONS ANALYSIS Revision: 0
© Jemena Limited Page 5 of 21
1 EXECUTIVE SUMMARY
Jemena Gas Distribution Network’s (JGN) has recently undertaken extensive engagement with
customers as part of JGN’s Access Arrangement for 2020-25. Many of JGN’s customers have
advised they are seeking to decarbonise their existing energy supply to meet their sustainability
targets or to meet future sustainability accreditation requirements. Specifically, Interface Carpets, City
of Sydney and Dexus have advised they are seeking access renewable gas or will discontinue their
gas use and invest in alternatives (such as electrification or offshoring). In additional the next version
of the Green Star energy rating tool to be released in 2020 incentivises the removal of Natural Gas
Appliances (Green Building Council of Australia, 2018). Hence, significant demand destruction is
forecast if these customers are not provided with a decarbonised gas option.
Losing these customers identified above will result in an existing revenue loss of $2.1 million pa of by
2050, not including the potential future connections and increase in throughput from these customers.
Unless averted, this reduction in network utilisation and the resultant revenue loss will result in higher
network charges for remaining customers.
The Sydney Water Malabar Sewage Treatment plant currently produces approximately 1500 Nm3/h
of Biogas that is burnt in generators to create electricity and flared. Sydney Water intends to upgrade
its facility so that it can convert this Biogas to Renewable Gas. This facility would have the capacity to
inject up to 268 TJ/yr of methane into our network.
Augmenting our network by building a secondary main to the Malabar Sewage Treatment plant will
allow Renewable Gas to be injected into our network. The customers that want to decarbonise would
be able to procure this Renewable Gas from Sydney Water through an accreditation and certification
scheme instead of electrifying or relocating their operations.
In addition to avoiding revenue loss, this investment would provide a pathway for additional
Renewable Gas to be injected into our network by providing a proof of concept (lowering technical risk
for future projects), enabling development of certification and creating a market for Renewable Gas.
JGN have considered three options:
1. Maintain the status quo and do not augment the network to connect the Malabar Sewage
Treatment plant to our network. This option avoids any network augmentation costs but
results in revenue loss, and higher bills for our customers.
2. Providing a connection direct to our secondary network. This option would provide enough
capacity for the Malabar Sewage Treatment plan to inject all the Renewable Gas it can
produce at a cost of $2.5M.
3. Providing a connection to our local distribution network. This option provides a lower capital
cost connection option ($2.0M) however it will limit how much Renewable Gas can be
supplied into our network and so the number of customers that can be retained on the
network.
Evaluation of these options indicates that the secondary main provides the most benefits to our
customers with an NPV of $20.2M relative to the status quo.
1.1 KEY DRIVERS
Several key customers are exploring decarbonisation options, including disconnection from the gas
network and electrification of their gas load. The key driver of this project is to retain these customers
on the network for the benefit of all customers. Furthermore, this project will provide additional
benefits to further Renewable Gas projects that could provide value to any other customers that want
to decarbonise:

MALABAR BIOMETHANE PROJECT – OPTIONS ANALYSIS Revision: 0
© Jemena Limited Page 6 of 21
1. Develops Renewable Gas certification system to allow customers to be credited with
Renewable Gas injected.
2. Establishes a decarbonisation pathway for the gas network.
3. Establish technical processes for Renewable Gas injection.
4. Derisk and encourage investment in Renewable Gas facilities to enable more Renewable Gas
to be supplied to customers.
5. Ensure the Federal Government BioEnergy roadmap can be fulfilled.
6. Ensure Federal and NSW government targets for Renewable Gas can be fulfilled.
These items contribute to the reduction in the risk of demand destruction discussed in Attachment
7.10 - Proposed changes to asset lives for new investments.
1.2 CREDIBLE OPTIONS
Several options were considered based on the customer demand:
1. Maintain Status Quo - Do not connect Renewable Gas project. Loose customers from the
network.
2. Connection to Secondary Main - Connect injection project to the secondary main that will
enable all named customers to remain on the network.
3. Connection to local distribution network - Connect to the local distribution network,
however this will not enable sufficient flow to retain all customers on the network.
Option Annual revenue lost by 2050
Capex NPV Incremental NPV
1 $2.1 M $0.0 M -$22.7 M $0.0 M
2 $0.0 M $2.5 M -$2.5 M $20.2 M
3 $1.9 M $2.0 M -$21.3 M $1.4 M
1.3 RECOMMENDATION
Option 2: A connection to the secondary main is the recommended solution. This solution provides
the highest NPV as the additional capex costs are more than offset by the benefit of avoiding the lost
revenue. This option will result in the lowest customer bills.
This option also provides a pathway to further Renewable Gas injection into our network.
1.4 CONSUMER ENGAGEMENT
Our engagement for the 2020-25 Access Arrangement review included comprehensive engagement
on our customers current and future preferences. In this engagement, our customers told us that they
expect us, and other parts of the energy industry, to innovate and plan for the future so that they can
continue to use gas in the longer term as we move to a zero‑carbon future

MALABAR BIOMETHANE PROJECT – OPTIONS ANALYSIS Revision: 0
© Jemena Limited Page 7 of 21
1.5 NATIONAL GAS RULES
Under Rule 79 of the National Gas Rules, capital expenditure can be rolled into JGN’s capital base if
it is conforming capital expenditure.
Conforming capital expenditure must be such as would be incurred by a prudent service provider
acting efficiently, in accordance with accept good industry practice, to achieve the lowest sustainable
cost of providing services.
Facilitating access to Renewable Gas is consistent with good industry practice. This is demonstrated
by gas networks around the world who are actively working to facilitate and encourage the injection of
Renewable Gas into the networks to ensure that the network has a role in a decarbonised future.
Facilitating the injection of Renewable Gas will also help lower bills, than they otherwise have been,
helping achieve the lowest sustainable cost to consumers.
Conforming capital expenditure must also be justified under Rule 79(2).
Augmenting our network to facilitate the injection of Renewable Gas will lead revenue which exceeds
the cost of the capital expenditure and as a result this expenditure is justified under Rule 79(2)(b).
The expenditure is also justified under Rule 79(2)(a) as the overall economic value is positive – as the
value to our customers (which must exceed our network charges and revenue we will collect) exceeds
the cost of the augmentation.
2 PROJECT KEY DRIVERS
The key driver to the project is to provide Renewable Gas to key customers to prevent the loss in
revenue being spread across remaining customers, increasing their bills. Additionally, further drivers
include:
1. Ready network to meet NSW and Federal government drive for Renewable Gas
2. Develop a decarbonisation pathway for the gas network to prevent further demand
destruction beyond these initial key customers
2.1 BACKGROUND
In December 2015, 195 countries, including Australia, agreed on the United Nations’ Paris Agreement
on climate change. This agreement commits countries to reducing the amount of carbon dioxide they
emit into the atmosphere. In line with the Paris Agreement, Australia has committed to a low carbon
future, and the Federal Government has set a target to reduce carbon emissions to 26-28% below
2005 levels by 2030. The NSW Government has endorsed the Paris Agreement and stated it will take
action consistent with the level of effort required to achieve Australia’s commitments to the Paris
Agreement. It has also made a commitment to a net zero carbon future by 2050.
While natural gas has historically been promoted as the low-carbon energy option, the change in the
energy market means that the future of natural gas beyond 2050 is no longer assured, because it
contains carbon.
Internationally, a number of cities and countries have already committed to banning natural gas by
2050. While no such ban exists in Australia at this time, there have been efforts to ban natural gas
infrastructure from some new developments. While the industry is currently putting significant effort
into identifying a credible pathway to a net-zero carbon future, success is not assured either
technically or from a cost competitiveness perspective. Although we have recently seen significant
growth in customers connecting to our network—driven by the NSW housing boom—it is possible that

MALABAR BIOMETHANE PROJECT – OPTIONS ANALYSIS Revision: 0
© Jemena Limited Page 8 of 21
Government policy changes to meet the net-zero carbon target could make the gas network too
expensive to be competitive in the long-term, or make continued operation of the network infeasible.
Independently other customers (as outlined in Section 2.3) and stakeholders are encouraging the
move away from gas. Recent examples include:
- Article in Domain on 17 December 2019 – Discussed the move away from gas by Moreland
Council whose “design excellence scorecard encourages gas-free electrified homes” and a
developer who “where possible it would no longer be including gas in residential projects” and
that they are “sure [electrification] will become more common.” (Malo, 2019)
- Inner West Climate Strategy – in which key area 2 is to “phase out natural gas” (Inner West
Council, 2019) and this was enhanced in the council meeting on 10 December 2019 carried a
modification to include that “natural gas is not renewable and should be phased out” (Inner
West Council, 2019)
- Mirvac plans to be net positive carbon by 2030 – this includes that “eliminating natural gas
from.. new developments” and are planning to ”investigate electrification options when
replacing natural gas plant equipment” from 2020 ” and eliminating all gas from existing
developments by 2030 (Mirvac, 2019)
- AGL are encouraging their customers to switch from gas to electricity – as “choosing to go all-
electric can not only be cheaper but can also help reduce your CO2 emissions” (AGL, 2019)
and are based on a study that states “emissions from the electricity generation network in the
NEM will decrease in the coming years, while emissions from the natural gas industry are
unlikely to do so” (Anderson, 2019)
Any reduction in average loads (demand destruction) will continue to put upward pressure on the
network costs borne by each of our current and future customers. Should demand destruction occur,
we are likely to see customers disconnect from our network in greater numbers, meaning that there
will be fewer customers over which to spread our largely fixed costs. The customers remaining on the
network at that future time are likely to be those who are constrained in their ability to switch
technologies. This may be due to cost constraints or for practical reasons. This raises an issue of
fairness, as those customers who are less able to afford price increases would have price increases
imposed on them with little capacity to respond.
2.2 RENEWABLE GAS
Renewable Gas is a general term for low carbon Natural Gas and currently includes Hydrogen
produced by Renewable energy and Biogas produced from organic material. Currently the lowest cost
option to produce Renewable Gas is through Biogas as it is already being produced from waste and
sewage for electricity and flaring.
Biogas is produced through Anaerobic (without oxygen) Digestion of organic material. It is mostly a
mix of methane and carbon dioxide. This mixture can be ‘upgraded’ to produce a high purity stream of
methane and another of carbon dioxide. The methane can be injected into the gas network and the
carbon dioxide stream can potentially be utilised for other purposes.
This process is well established in Europe with other 1000 sites upgrading and injecting Renewable
Gas from Biogas. However, no such projects exist in Australia.
2.3 IDENTIFIED NEED
Jemena has been approached and made aware of a number of customers they were looking to
decarbonise their gas supply through electrification or similar, resulting in gas demand destruction.
These customers are outlined below.

MALABAR BIOMETHANE PROJECT – OPTIONS ANALYSIS Revision: 0
© Jemena Limited Page 9 of 21
2.3.1 INTERFACE CARPETS
Interface carpets are a leader in sustainability and have a decarbonisation target by 2020. At the point
they made contact with Jemena these were evaluating the potential of electric boilers for their
manufacturing to electrify their gas load. They have provided a letter of support for this project which
can be found in Appendix D.
2.3.2 CITY OF SYDNEY
The City of Sydney have a decarbonisation target for their own energy by 2030 (City of Sydney, 2019)
and the City of Sydney itself by 2050, this would result in the early reduction in their reliance on
natural gas for their buildings in the short term and reducing the use of gas across their region
following this. They have provided a letter of support for this project which can be found in Appendix
E.
2.3.3 DEXUS
Dexus has a net zero emissions target by 2030 and such “proposes to steadily phase out onsite
natural gas and diesel and replacing gas appliances with electric equivalents” (Dexus, 2018). They
made contact with Jemena after they were made aware of the potential of Renewable Gas after
discussing electrification options with an energy consultant Jemena had previously engaged with.
They have provided a letter of support (see Appendix F) for the potential to utilise Renewable Gas as
an alternative to replacing gas appliances if it is made available, otherwise they will proceed with their
public commitment.
2.3.4 GREEN BUILDING COUNCIL OF AUSTRALIA
The Green Building Council of Australia managed the Green Star Certification scheme that assesses
the sustainable design, construction and operation of buildings, fit outs and communities. They issue
tools that are utilised to determine the calculation of a star rating. Previously their tools encourage the
use of gas as a low carbon fuel, however their new tool (to be released in 2020) disincentivises the
installation of gas appliances and actively encourages the removal of gas appliances from existing
buildings, as outlined in their Carbon Positive Roadmap (Green Building Council of Australia, 2018).
While their roadmap relates to new registrations, if a new fit out occurs in the building it will need to
comply with this new roadmap. Therefore, it has been assumed that a new building fit out is required
every 15 years and so at 15 years passed the buildings initial registration date it will need to meet the
new standard. It has been assumed that the buildings will maintain their current rating level and so
transition as per the roadmap with 4, 5 and 6 star rated buildings transitioning after 2028, 2026 and
2023 respectively.
2.4 STAKEHOLDERS DRIVING RENEWABLE GAS
In addition to stakeholders that are currently moving against Natural Gas there are a number of
stakeholders that are pushing for Gas Networks to allow for the injection of Renewable Gas as part of
decarbonation policy objectives.
Minister for Energy and Emission Reduction Angus Taylor has requested ARENA to invest in the
development of a roadmap for the bioenergy sector in Australia (ARENA, 2019). One of the key
issues the roadmap will include is to look at opportunities to decarbonise the gas network. The
development of this project will help meet federal government policy.
The National Hydrogen Strategy sets out a vision for a the development of the Renewable Gas
industry in Australia (COAG Energy Council, 2019). One of the key measures of success is the

MALABAR BIOMETHANE PROJECT – OPTIONS ANALYSIS Revision: 0
© Jemena Limited Page 10 of 21
development of a certification scheme and also outlines the technical developments required. This
project assists in the development of a certification scheme at a lower cost than current hydrogen
production and so will enable the policy to be achieved at lowest cost.
2.5 DECARBONISATION PATHWAY
Currently, there is no Renewable Gas injection into Gas Networks in Australia. The injection and
crediting of Renewable Gas in the proposed project will be undertaken in a bespoke manner, the
pathway to enabling Renewable Gas to be made widely available to customers will require the
following, which will be enabled by this project:
- Established Certification system for Renewable Gas
- Encourage investment in Renewable Gas projects
- Establish incentives
- Technical standards and processes
How these aspects are being addressed and how this project will assist and the long term aim is
addressed below. The development of this pathway will ultimately reduce the cost to supply
Renewable Gas to customers and so ensure that more customers select Renewable Gas as a
decarbonisation option rather than electrification thus reducing bills for all remaining customers.
2.5.1 CERTIFICATION OF RENEWABLE GAS
Certification of Renewable Gas works similar to the GreenPower scheme for electricity. When gas is
injected Jemena measures the amount and a certificate is issued, this certificate can be then claimed
by any customer on the network to decarbonise their gas supply which is also measured by Jemena.
For this project this will be a manual process of crediting the certificates to customers and working
with their reporting requirements which will test the system and establish principles.
The manual process will be in the interim until the system is owned by an recognised body that will
manage the crediting and ‘retirement’ of certificates. This will enable Renewable Gas to be injected,
withdrawn and credited at any point on a connected network. It will be widely recognised as a zero
emission fuel and have an established ecosystem of traders and Renewable Gas purchase
agreements. This will provide customers with an alternative to Renewable Power Purchase
Agreements (PPAs) utilising existing infrastructure.
2.5.2 ESTABLISH INCENTIVES
The injection of Renewable Gas into the gas network is not recognised as a destruction mechanism
under the Energy Reduction Fund (ERF), in comparison to flaring onsite which is, therefore cannot be
credited for its carbon reduction value through the issuance of Australian Carbon Credit Units
(ACCUs). Therefore, this project does not benefit from any external incentives, this project will enable
the development of existing incentives to include Renewable Gas and potentially establish additional
incentives based on the value to the energy system.
2.5.3 TECHNICAL STANDARDS AND PROCESSES
Jemena has specifically technically evaluated this project for its ability to inject into the gas network as
this is the first injection project in Australia. Through this project it is intended that technical standards
will be developed that can be applied to all future projects. Furthermore, through testing and
evaluation of this project the technical standards should be able to be optimised such that the cost to
process and inject Renewable Gas is reduced to enable more customers to access it.

MALABAR BIOMETHANE PROJECT – OPTIONS ANALYSIS Revision: 0
© Jemena Limited Page 11 of 21
2.5.4 ENCOURAGE INVESTMENT
Biogas upgrading to decarbonise the gas network has been identified as a key issue as part of
ARENA’s $100m Bioenergy Roadmap. Whilst biogas upgrading for grid injection is a proven
technology and an established industry across Europe and North America, the Australian industry is
still emerging. The proposed Malabar Biomethane Project has received ARENA panel approval as
part of their Bioenergy Road Map investment.
The initial investment and support and demonstration of the grid injection is seen as a critical enabler
to supply the market with renewable gas and to encourage future larger scale investment to further
meet customer demand for renewable gases.
2.5.5 REDUCTION IN COST TO SUPPLY RENEWABLE GAS
Without the pathway described above Renewable Gas is only available to customers that have an
immediate need to decarbonise, but the cost to decarbonise through electricity is also high, so they
have a high willingness to pay. As the push to decarbonise increases, as discussed in Section 2.4,
customers with lower cost alternatives (such as residential customers) will start to decarbonise, this
will increase the bills of all remaining customers. Therefore, it is imperative that the cost to
decarbonise through Renewable gas is driven down to prevent the loss of these customers. These
knock on benefits of this project are not included in the justification, but would be many multiples of
the current customer benefit.
2.5.6 AWARENESS
The current Gas Network customers who were going to disconnect from the gas network and
increase costs for remaining customers because there was no access to Renewable Gas were
identified through direct engagement. However, it is probable that there are currently a large amount
of customers that are looking to decarbonise and disconnect that have not been identified. This
project will enable these customers to be identified and potentially served.
2.6 IDENTIFICATION OF SPECIFIC PROJECT
Jemena has been exploring potential projects to meet the immediate customer demand. This project
could be delivered in the timeframe required to retain the customers on the network and had sufficient
supply to meet their demand.
2.6.1 PROJECT OUTLINE
The Sydney Water Malabar Sewage Treatment plant currently produces approximately 1500 Nm3/h
of Biogas that is burnt in generators to create electricity and flared. A project is in advanced planning
to upgrade all of this Biogas to Renewable Gas which could produce up to 268 TJ/yr of methane into
the network.
There are further plans to upgrade the plant to process other organic material that could expand the
capacity of the plant significantly. This would allow other customers to be supplied and prevent them
disconnecting from the gas network to the benefit of all customers.
2.7 CURRENT STATUS OF ASSET
There is currently no Renewable Gas injection in Australia, including the Jemena Gas Network.

MALABAR BIOMETHANE PROJECT – OPTIONS ANALYSIS Revision: 0
© Jemena Limited Page 12 of 21
There is no existing connection to the site. The nearby assets were analysed for injection potential
and capacity. The 7kPa local distribution network was excluded as it did not meet the technical
requirements for injection. The remaining two assets as shown in Figure 1 can be seen below.
Figure 1 - Nearby assets
3 DEMAND DESTRUCTION MITIGATION OPTIONS
The following options were identified:
1. Option 1 – Maintain status quo – Loose customer revenue to electrification
2. Option 2 – Connect project to the secondary network
3. Option 3 – Connect project to the local distribution network
Further detail of the NPV calculations can be found in Appendix A.
3.1 OPTION 1 – MAINTAIN STATUS QUO - LOOSE GAS SUPPLY TO
CUSTOMER ELECTRIFICATION OF LOAD
This option involves not connecting the project and thus not providing Renewable Gas to customers.
3.1.1 COST
The cost of this option is determined by the rate of customer demand destruction. Table 1 below
summaries the calculation of the NPV of lost revenue. The demand destruction is estimated based on
their decarbonisation policies and letters of support. It is estimated to reduce in line with the customer
decarbonisation goals without Renewable Gas available, but as the demand destruction will not occur
instantaneously it is gradually increased from the start ramp year to the end ramp year when all gas
demand has been destroyed. The ramping rates are conservative compared to the targets and drivers
discussed in Section 2.3, as outlined below:
1. Interface Carpets – have a decarbonisation target by 2020 but they are modelled to eliminate
gas demand by 2028.
4in 210kPa Nylon
(Option 3)
6in 1000kPa
Steel (Option 2)
Project
4in 7kPa PE
(Not viable)

MALABAR BIOMETHANE PROJECT – OPTIONS ANALYSIS Revision: 0
© Jemena Limited Page 13 of 21
2. City of Sydney – have a city wide decarbonisation target by 2050 and so are expected to
eliminate their internal gas demand much earlier, however the demand destruction is
modelled to occur by 2050.
3. Dexus – have a decarbonisation target by 2030, but their complete demand destruction is
projected to occur in 2035.
4. GreenStar – is modelled based only on demand destruction from currently certified buildings,
however the number of GreenStar certified buildings is growing by 17% per annum and so the
number of buildings that are incentivised to remove gas is expected to increase significantly in
the future.
Table 1 – Electrification of customers
Loss of Customer
Start
ramp year
Start revenue Lost ($000)
End
Ramp year
End ramp
amount revenue Lost ($000)
Lost Gas demand
Avg Rev / GJ
NPV of
Revenue Lost ($000)
Interface
Carpets 2023 55 2028 61 13,372 4.56 1,079
City of Sydney
2025 52 2035 217 47,862 4.53 2,808
Dexus 2025 2035 282 45,447 6.21 3,362
GreenStar
Buildings See Appendix C 161,844
15,428
560 268,525 22,677
The NPV of this option is -$22.7M.
3.1.2 BENEFITS & DRAWBACKS
The benefit of this option are that no capital investment is required.
The drawback is that not only will we lose revenue that will ultimately need to be recovered from other
customers – increasing their bills.
Further, no Renewable Gas pathway will be created which will increase the risk that we lose
additional customers (and result in higher bills).
Lastly, this approach does not align with the customer feedback who told us to do more to work
towards a renewable future.
3.2 OPTION 2 – CONNECT PROJECT TO SECONDARY NETWORK
This option involves the connection of the Renewable Gas injection project to the secondary network.
This allows for the full Renewable Gas potential of the project to be injected into the Jemena Gas
Network (See Figure 1). A drawing of the connection can be found in Appendix B.
3.2.1 COST
The connection of the project to the Secondary network has been subject to a detailed FEED cost
forecast. See Appendix C.
The NPV of this option is -$2.5M.
3.2.2 BENEFITS & DRAWBACKS
The benefits of this option is that all key customers identified can be supplied with Renewable Gas.
MALABAR BIOMETHANE PROJECT – OPTIONS ANALYSIS Revision: 0
© Jemena Limited Page 14 of 21
This option enables potential expansion of the project capacity in the future to enable more customers
to be supplied with Renewable Gas to prevent them leaving the network and enable the additional
benefits as described in Section 2.5.
The drawback of this option is that it requires the higher capital cost.
3.3 OPTION 3 – CONNECT PROJECT TO THE LOCAL DISTRIBUTION
NETWORK
This option aims to reduce the connection cost, however it only allows for a limited amount of
Renewable Gas to be injected into the gas network and so will not maintain the revenue of all
customers.
3.3.1 COST
This option requires the same length of main to be constructed as Option 2 but as it is at a lower
pressure it can be constructed out of PE reducing the capital cost to 80% of Option 1. Furthermore, it
will only be able to supply 47 TJ/a of Renewable Gas (see below), therefore there is no lost gas
demand for Interface Carpets and only partial demand destruction for City of Sydney.
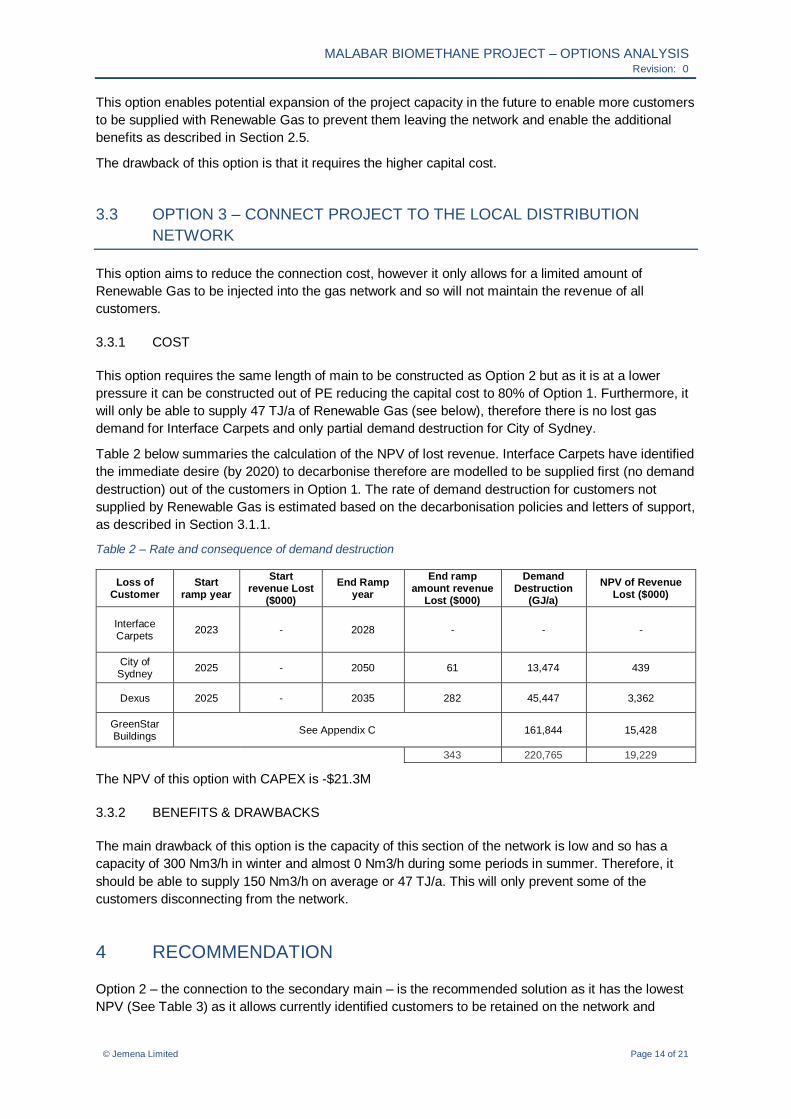
Table 2 below summaries the calculation of the NPV of lost revenue. Interface Carpets have identified
the immediate desire (by 2020) to decarbonise therefore are modelled to be supplied first (no demand
destruction) out of the customers in Option 1. The rate of demand destruction for customers not
supplied by Renewable Gas is estimated based on the decarbonisation policies and letters of support,
as described in Section 3.1.1.
Table 2 – Rate and consequence of demand destruction
Loss of Customer
Start ramp year
Start revenue Lost
($000)
End Ramp year
End ramp amount revenue
Lost ($000)
Demand Destruction
(GJ/a)
NPV of Revenue Lost ($000)
Interface Carpets
2023 - 2028 - - -
City of Sydney
2025 - 2050 61 13,474 439
Dexus 2025 - 2035 282 45,447 3,362
GreenStar Buildings
See Appendix C 161,844 15,428
343 220,765 19,229
The NPV of this option with CAPEX is -$21.3M
3.3.2 BENEFITS & DRAWBACKS
The main drawback of this option is the capacity of this section of the network is low and so has a
capacity of 300 Nm3/h in winter and almost 0 Nm3/h during some periods in summer. Therefore, it
should be able to supply 150 Nm3/h on average or 47 TJ/a. This will only prevent some of the
customers disconnecting from the network.
4 RECOMMENDATION
Option 2 – the connection to the secondary main – is the recommended solution as it has the lowest
NPV (See Table 3) as it allows currently identified customers to be retained on the network and

MALABAR BIOMETHANE PROJECT – OPTIONS ANALYSIS Revision: 0
© Jemena Limited Page 15 of 21
enables further expansion of the project to potentially allow more customers to be retained in the
future.
Table 3 – NPV of options
Option Final annual revenue lost
Capex NPV Incremental NPV
1 $2.1 M $0.0 M -$22.7 M $0.0 M
2 $0.0 M $2.5 M -$2.5 M $20.2 M
3 $1.9 M $2.0 M -$21.3 M $1.4 M
5 REFERENCES
AGL. (2019, December 19). How choosing electricity over gas can help you and the environment.
Retrieved from https://discover.agl.com.au/your-home/setting-new-home-benefits-electricity-
gas/
Anderson, R. (2019, July 29). Renew. Retrieved from https://renew.org.au/renew-magazine/efficient-
homes/emissions-intensity-of-household-electricity-vs-gas/
ARENA. (2019, November 13). ARENA to develop roadmap to boost bioenergy opportunities in
Australia. Retrieved from https://arena.gov.au/assets/2019/11/ARENA-Media-
Release_Bioenergy-Roadmap_131119.pdf
City of Sydney. (2019, March 6). Sustainable Sydney 2030 Snapshot. Retrieved from
https://www.cityofsydney.nsw.gov.au/__data/assets/pdf_file/0010/199495/2030-snapshot-
booklet_FA1.1.pdf
COAG Energy Council. (2019, November). Australias National Hydrogen Strategy. Retrieved from
https://www.industry.gov.au/sites/default/files/2019-11/australias-national-hydrogen-
strategy.pdf
Dexus. (2018). Dexus paves the way to net zero emissions with new renewable Energy Supply
Agreement.
Green Building Council of Australia. (2018). A Carbon Positive Roadmap for buildings. Retrieved from
https://gbca-web.s3.amazonaws.com/media/documents/carbon-positive-roadmap-summary-
paper-fa-web_onU8cXm.pdf
Inner West Council. (2019). Climate+Renewables Strategy - Draft.
Inner West Council. (2019, December 10). Council Meeting Agenda. Retrieved from
https://innerwest.infocouncil.biz/Open/2019/12/C_10122019_AGN_3709_AT_WEB.htm
Malo, J. (2019, December 17). Domain. Retrieved from https://www.domain.com.au/news/the-kitchen-
appliance-that-will-become-a-thing-of-the-past-because-of-climate-change-917526/
Mirvac. (2019). Planet Positive: Mirvac's plan to reach net carbon positive by 2030.
6 APPENDICES

MALABAR BIOMETHANE PROJECT – OPTIONS ANALYSIS Revision: 0
© Jemena Limited Page 16 of 21
APPENDIX A OPTIONS ANALYSIS CALCULATIONS

MALABAR BIOMETHANE PROJECT – OPTIONS ANALYSIS Revision: 0
© Jemena Limited Page 17 of 21
APPENDIX B OPTION 2 DRAWING

MALABAR BIOMETHANE PROJECT – OPTIONS ANALYSIS Revision: 0
© Jemena Limited Page 18 of 21
APPENDIX C OPTION 2 COSTING

MALABAR BIOMETHANE PROJECT – OPTIONS ANALYSIS Revision: 0
© Jemena Limited Page 19 of 21
APPENDIX D INTERFACE CARPETS – LETTER OF SUPPORT

MALABAR BIOMETHANE PROJECT – OPTIONS ANALYSIS Revision: 0
© Jemena Limited Page 20 of 21
APPENDIX E CITY OF SYDNEY – LETTER OF SUPPORT

MALABAR BIOMETHANE PROJECT – OPTIONS ANALYSIS Revision: 0
© Jemena Limited Page 21 of 21
APPENDIX F DEXUS – LETTER OF SUPPORT